
Every week, I join thousands of other media buyers in the same ritual. We open the Meta Ads Manager, eyes scanning the metrics, striving to identify the winning and losing campaigns. A positive ROAS gives us a sense of contentment, while a negative one sends us scrabbling to disable the underperforming asset. This is where many advertisers find themselves trapped in the scoreboard mentality.
By treating metrics as a mere scoreboard, I only see the final outcome, missing the bigger picture that could guide future improvements. It’s like judging a game’s score without considering that my strikers aren’t receiving any passes from the midfield.
If I want to scale performance, it’s crucial to transition from mere reporting to diagnosing. By viewing metrics both as individual KPIs and as parts of an interdependent system, I can uncover the real narrative within my account and make informed optimization decisions.
The Dashboard Illusion
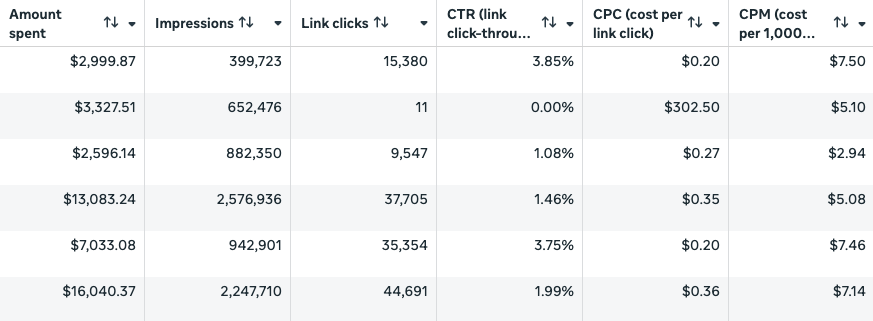
Meta’s interface, with its linear grid format, can sometimes give a false sense of clarity. While one column points at high CPM as an issue, another blames low CTR. In reality, these metrics are often connected, revealing much deeper insights.
A high CPM might not necessarily mean an expensive audience. Instead, it could indicate that my creative isn’t up to par, prompting Meta to charge more due to a subpar user experience.
On the flip side, while a high CTR seems like a win initially, if my CVR is declining, then it’s not really a victory. I find myself paying for high-intent customers that my landing page fails to convert.
The dashboard might tell me what happened, but understanding the system explains why.

Dig deeper: Inside Meta’s AI-driven advertising system: How Andromeda and GEM work together
The Team Metrics Framework
To better comprehend the system, I visualize metrics as parts of a sports team. Each player has a unique role. If the team loses, I don’t bench them all. Instead, I review the plays to identify areas for improvement in the next game.
The Scouts: CPM and Reach
CPM acts as feedback from the auction on my total value, combining my bid, estimated action rates, and user value. Together, they play the role of market resonance.
If I notice a spike in CPM compared to historical averages, these metrics hint at an overly crowded market or my creative’s ineffectiveness in maintaining volume.
The Midfielders: CTR and Hook Rate
Their role emphasizes moving the engagement from Meta’s ad placement to my website. A high hook rate but low CTR shows my ad snags attention but falters in driving clicks. It effectively stops the scroll, but people aren’t compelled to click.
The Strikers: CVR and AOV
Representing the final journey step, they depend on my website. A high CTR and low CPC, yet a low ROAS, indicate issues. Although my ad performed well, my landing page or offer didn’t convert the visitors.
Dig deeper: Rethinking Meta Ads AI: Best practices for better results
Diagnosing System Gaps
The real analysis occurs between the columns displayed in Ads Manager.

Hook vs. Hold Rates
By examining the ratio between hook and hold rates, I can prevent creative fatigue that impacts ROAS.
- If my ad has a high hook rate but low hold rate, it captures attention initially but rapidly loses it. This suggests I should enhance the latter part of the ad with a compelling CTA.
- If I observe a low hook rate but a high hold rate, most people disengage early, although those who engage tend to convert. This scenario presents a chance to test new hooks that align with the rest of the video, aiming to boost initial engagement and conversions.
Link Clicks vs. Landing Page Views
The discrepancy between these metrics often goes unnoticed. Out of 1,000 clicks, if only 450 landing page views are recorded, there may be a technical issue. It’s essential to check my page speed and ensure my tracking functions properly.
Such a drop isn’t typically due to a creative problem but likely a slow server issue since people expect quick site loading times, and any delay results in bounces, wasting my budget.
CPA vs. Frequency
If increasing CPA is baffling, I should examine the frequency. A rise in both suggests ad fatigue among my audience.
An exhausted audience and system require fresh input, not just increased bids or budgets. I should refresh my creative assets or expand targeting if it’s too narrow.

Dig deeper: Meta Ads for lead gen: What you need to know
From Reporting to Diagnosing
When I encounter an underperforming campaign or creative, I ask myself:
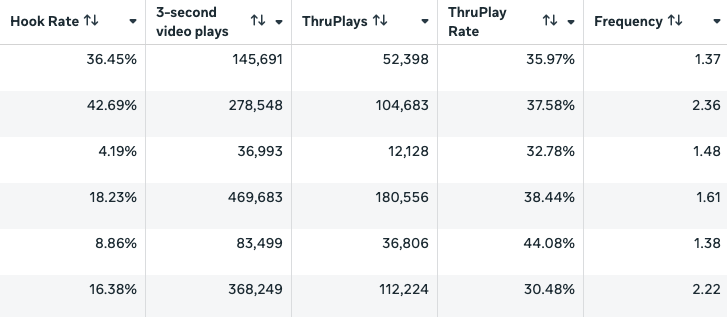
- Is volume constant? Have impressions or spend decreased? This might indicate the system devaluing or rejecting my ad, especially the creative component.
- Where is the friction occurring? I trace it across hook rate, CTR, and CVR.
Upon identifying the bottleneck, I focus on altering only that variable. Changing multiple elements simultaneously obscures the actual issue. For example, if CVR is low, I focus on the landing page experience, not the ad itself.
Am I directing traffic to a detailed product page while promoting various products in a single creative? It’s crucial to eliminate this friction by creating a product collection landing page, offering an intuitive experience for all interests once they click.
Becoming a Media Architect
With Meta’s AI guiding targeting, my role evolves into a system architect.
While a scoreboard highlights something isn’t winning, a system map unravels the full narrative, such as slow site speeds affecting ROAS or creative appealing to the wrong audience.
Next time I check my account, I’ll resist the urge to immediately glance at the ROAS column. Instead, by focusing on ratios and tracing the user’s journey, I’ll unlock the story from ad to website. Shifting focus from winners to detecting friction points is the key to engineering substantial growth.
Dig deeper: 4 Facebook ad templates that still work in 2026 (with real examples)
Inspired by this post on Search Engine Land.

Leave a Reply