Category: Meta

  • Meta Business Agents Shift Commerce Into Messaging

    Meta Business Agents Shift Commerce Into Messaging

    Meta is positioning business messaging as more than a support channel. Its new Business Agent is designed to help companies handle discovery, sales and service inside conversations on WhatsApp and Instagram Direct.

    For marketers, the important question is not whether this is a better chatbot. It is how customer journeys change when product research, lead qualification and checkout can happen without a visit to the company website.

    What Meta Business Agent is designed to do

    Search Engine Land reported on the launch announcement from Meta Conversations 2026 in London. The article describes an autonomous AI agent that can interpret context, continue multi-turn conversations and follow a company’s brand voice across languages.

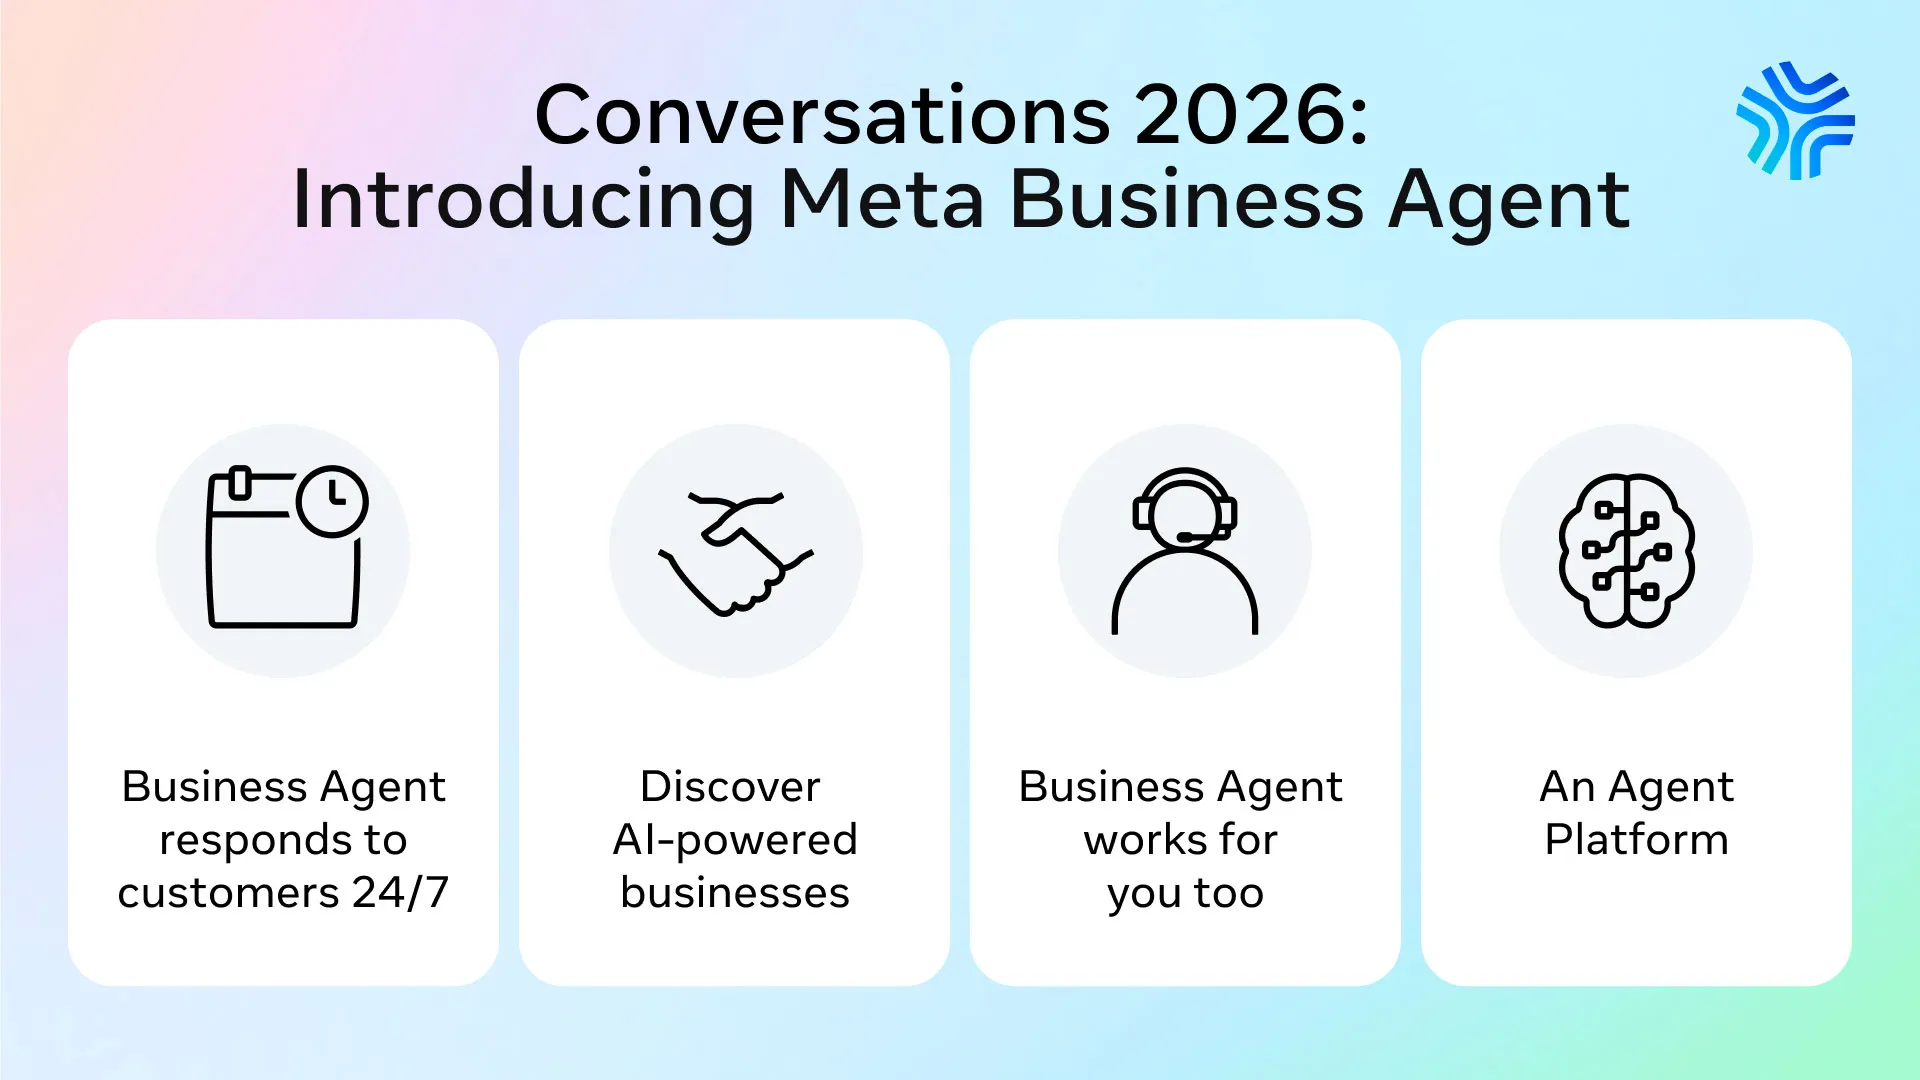
    Conversations 2026 slide introducing Meta Business Agent with four feature cards and icons.
    A Conversations 2026 slide introduces Meta Business Agent through four cards covering 24/7 customer response, AI business discovery, agent support, and an agent platform.

    In demonstrations observed by the publication’s contributor, agents answered support requests, qualified leads, retrieved current inventory through API connections and guided customers through checkout in one WhatsApp thread. Those demonstrations illustrate the intended workflow, but they should not be treated as independent evidence that every deployment will perform equally well.

    The agent can reportedly learn from a business’s Meta channels and website. Companies can also supply operational information such as prices and inventory, then add instructions covering tone, availability and how products should be represented.

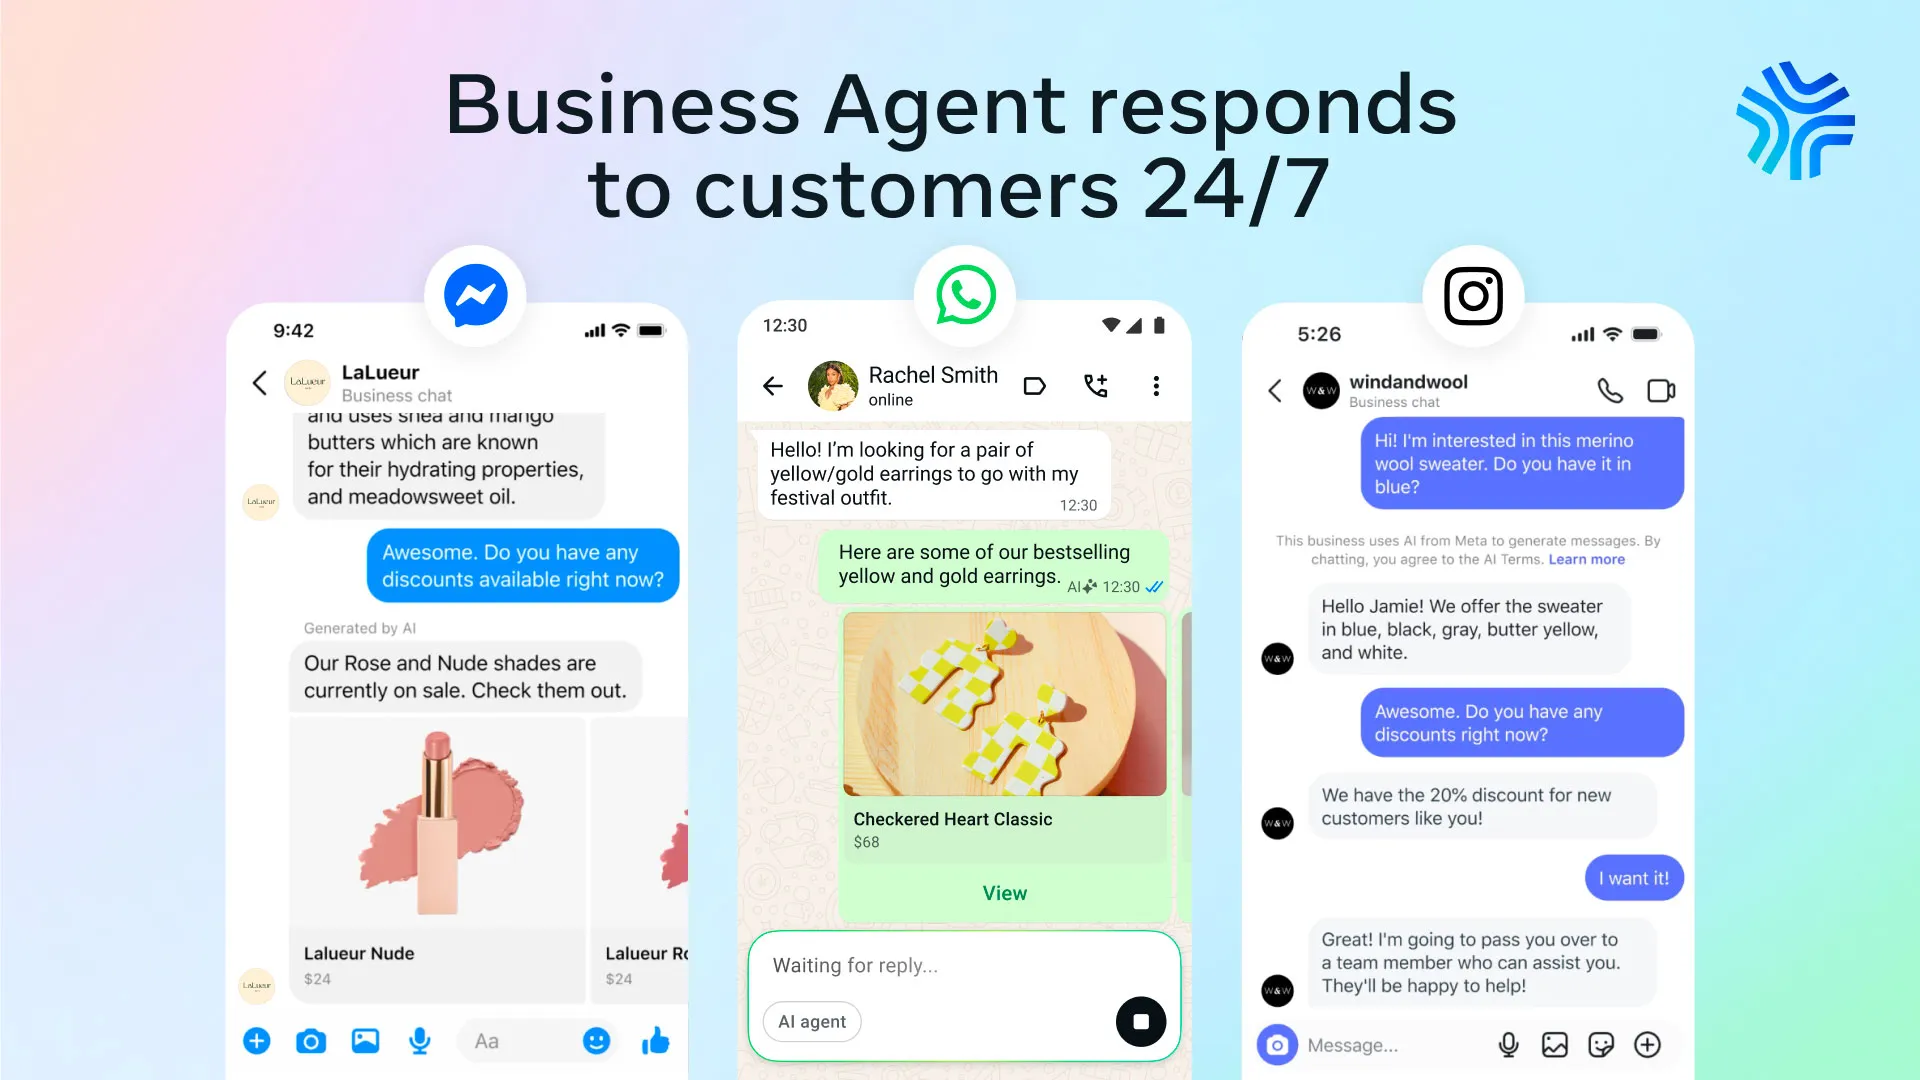
    Three phone chat screens beneath the headline "Business Agent responds to customers 24/7," with messaging app icons.
    Three mobile chat examples show customers asking businesses about products and discounts through Messenger, WhatsApp, and Instagram beneath a 24/7 agent headline.

    Key takeaways for marketers

    • Business messaging can cover several stages of the journey, from initial questions and lead qualification to order updates and purchases.
    • Meta is adding business discovery within WhatsApp search, creating another surface where accurate business information may influence visibility.
    • Product feeds can be browsed within WhatsApp or Instagram Direct, reducing the need to send every shopper to a website.
    • The system can support non-ecommerce goals, including appointment scheduling and other lead-generation tasks.
    • Reliable data, clear operating instructions and human supervision will be central to useful customer interactions.

    The website may no longer anchor every conversion

    A conventional digital funnel often directs an ad, social post or search result toward a landing page. Meta’s model compresses that journey: a person may discover a business, ask questions, browse products and complete a transaction within messaging.

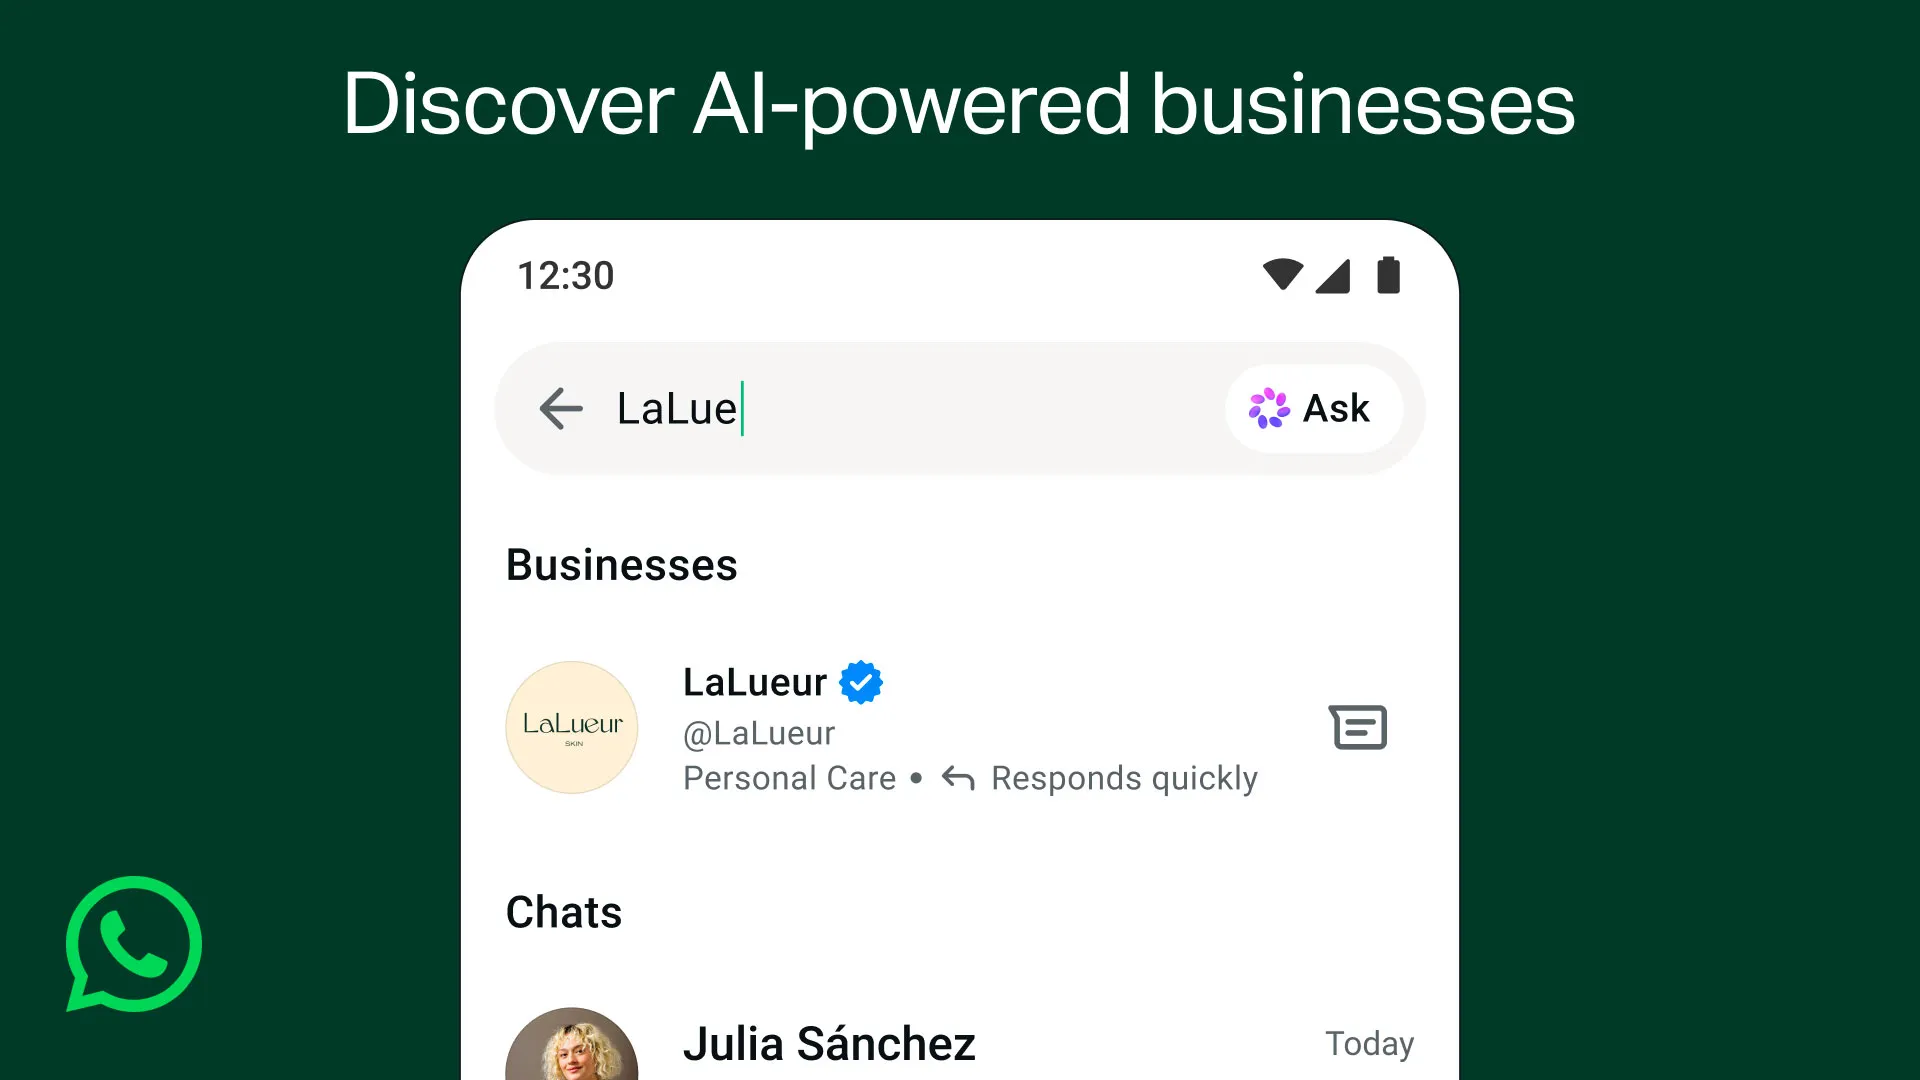
    Search Engine Land also says enhanced discovery features will allow people to find businesses through the WhatsApp search bar. A shared business can become a conversation with a tap when it uses the feature, while a shared restaurant can lead to a directions request within the chat.

    Phone mockup showing an AI-powered business search for LaLueur, with a business result and chat list.
    A phone interface under the heading Discover AI-powered businesses shows a search for LaLue, a verified LaLueur profile, and the start of a chat list.

    This does not make websites irrelevant. Sites can still provide detailed information and support other acquisition channels. The practical change is that website sessions may capture a smaller portion of the customer journey, making channel-level measurement less complete unless messaging interactions are incorporated into reporting.

    Data quality and escalation will determine the experience

    An agent cannot give dependable answers about availability, pricing or policies when its source information is incomplete or stale. Connecting an AI interface to operational systems therefore creates a data-management responsibility as well as a marketing opportunity.

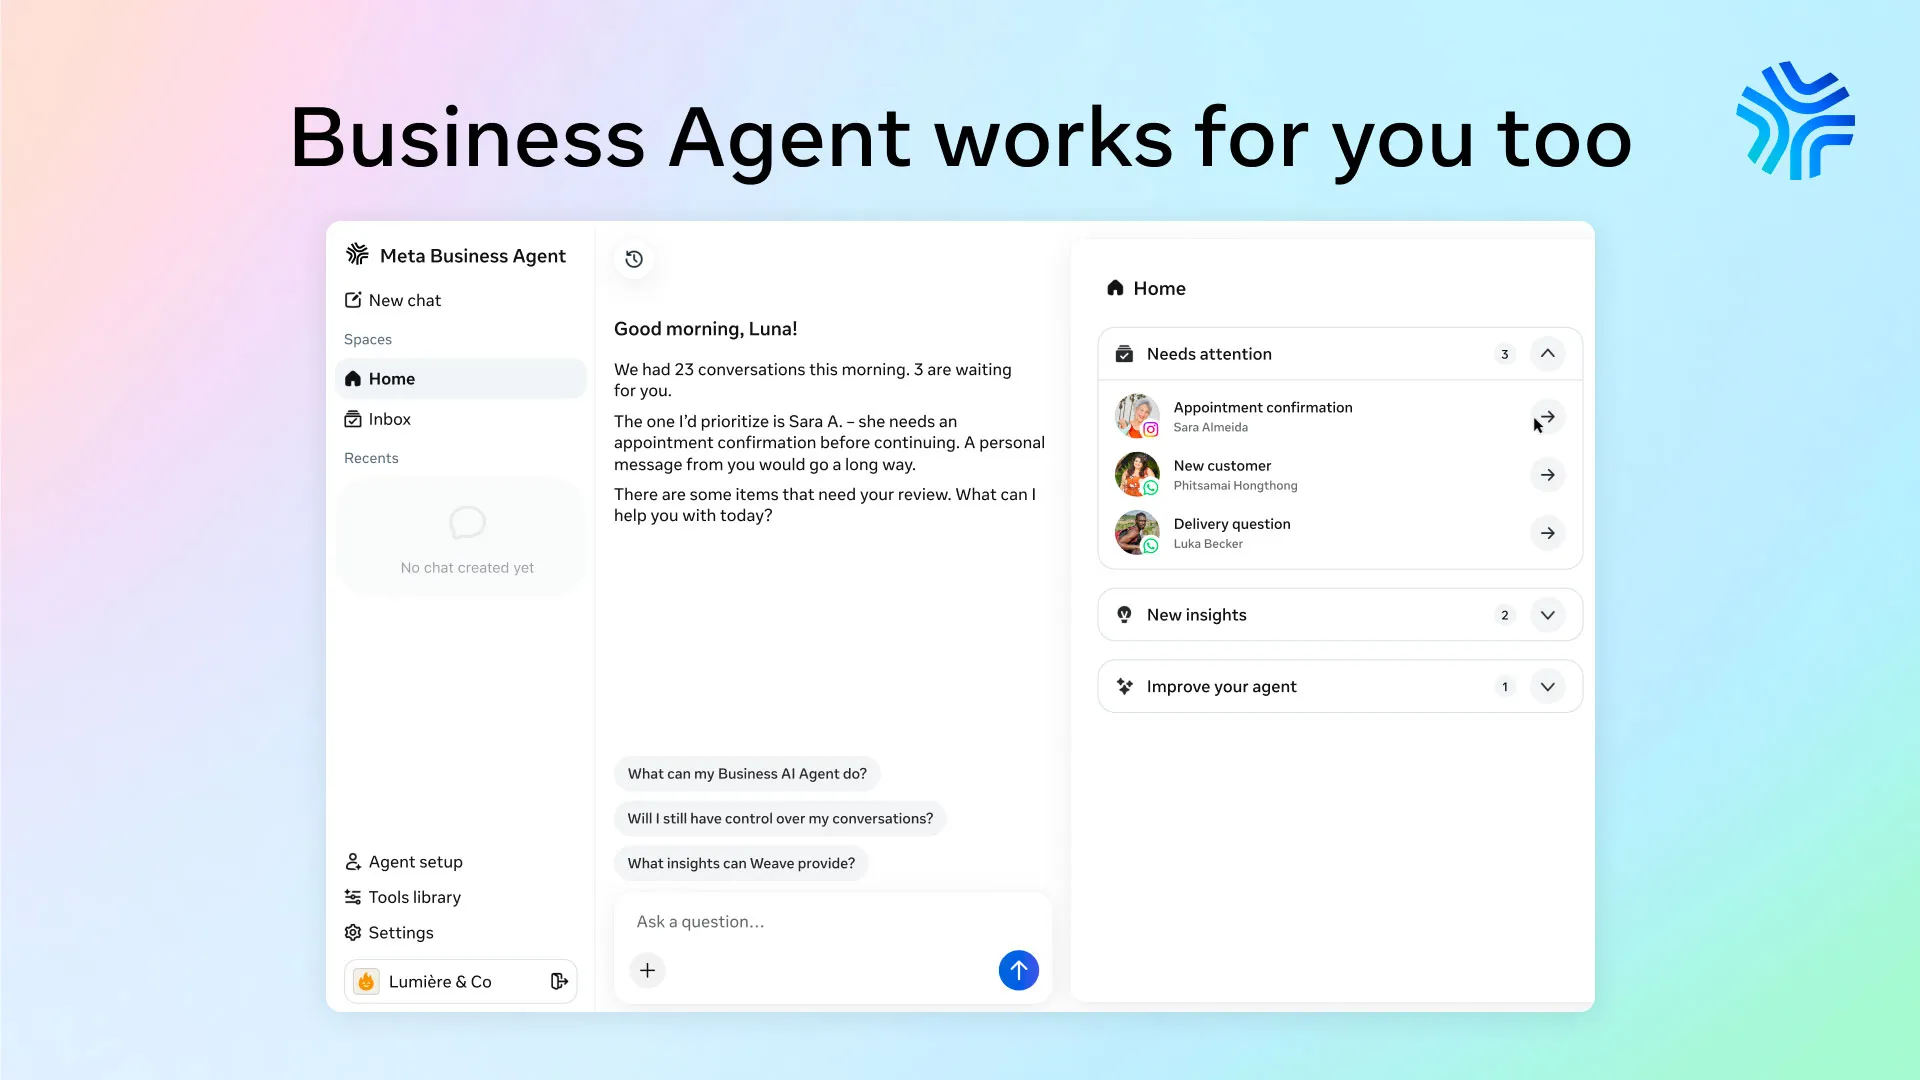
    Business Agent works for you too headline above a Meta Business Agent dashboard with chat and task panels.
    A Meta Business Agent interface shows navigation, a morning conversation summary, suggested questions, and a Home panel listing items that need attention.

    Meta’s control environment, as described in the source, lets a business monitor active conversations, transfer selected chats to a person and provide feedback based on those interactions. That human handoff is important for unusual requests, sensitive cases and conversations where the agent lacks enough information.

    Teams evaluating the product should define which information the agent may use, who owns updates to that information and which situations require escalation. They should also review whether its language reflects the brand accurately instead of assuming that initial instructions will cover every customer scenario.

    Futuristic web browser and analytics dashboard overlap amid neon data streams, illustrating the convergence of SEO, PPC and AI-driven search marketing.
    Organic visibility, paid media and artificial intelligence merge into one connected search ecosystem, where vivid data streams link a creative website with a powerful analytics dashboard.

    A practical way to assess the channel

    The strongest starting point is a narrow customer task with clear source data and an obvious success condition, such as answering routine product questions or scheduling an appointment. Marketers can then examine conversation quality, handoff frequency and the effect on the wider customer journey before expanding the agent’s responsibilities.

    The report does not provide detailed rollout, eligibility or performance information, so planning should remain conditional on what Meta makes available to each business. Even so, the strategic direction is clear: discovery and commerce are moving deeper into messaging, and marketing teams will need to treat those conversations as managed customer experiences rather than isolated chatbot exchanges.


    Inspired by this post on Search Engine Land.


    crushpress.ai community screenshot
  • Meta Connects Live Shopping Ads With Secure Checkout

    Meta Connects Live Shopping Ads With Secure Checkout

    Meta’s shopping initiatives bring three parts of social commerce closer together: live product discovery, personalized advertising and payment. The supplied reporting describes a strategy for turning attention inside Facebook and Instagram into purchases with fewer interruptions.

    For advertisers, the important development is not any one feature in isolation. Live ads can widen discovery, product catalogs can improve relevance, and virtual cards can address payment hesitation. Their value depends on how well those layers operate as one purchase path.

    Live ads extend the storefront beyond its original audience

    CrushPress.AI reported that Meta was expanding Live Video Ads globally on Facebook and introducing them on Instagram. In the United States, the company was also working with live-commerce providers CommentSold and TalkShopLive to help sellers turn livestreams into ads capable of reaching people who had not joined the original broadcast organically.

    This changes the role of a live shopping event. Instead of functioning only as a scheduled broadcast for an existing following, it can also supply advertising creative and product demonstrations for a wider audience. Facebook’s Live Shopping tools, according to the report, allow viewers to browse and purchase products without leaving the livestream.

    The resulting funnel is shorter in principle: a viewer encounters a demonstration, evaluates the featured product and moves toward purchase within the same experience. That convenience may remove unnecessary navigation, although it does not guarantee demand or compensate for an unclear offer.

    Virtual cards address a specific source of checkout friction

    A shopper uses a phone to check out with a generic virtual payment card protected by a translucent shield.

    The report also described a planned virtual-card payment feature for Facebook and Instagram, developed through collaborations with Mastercard and Visa. It said the system would generate a temporary, one-time card number linked to a shopper’s existing card, allowing a transaction without exposing the underlying card details.

    That design addresses a narrow but meaningful trust question: whether a shopper must disclose a primary card number during an in-app purchase. It should not be interpreted as a complete guarantee of transaction safety. Virtual card numbers do not resolve concerns about product quality, delivery, refunds, merchant legitimacy or account security.

    The distinction also matters when assessing availability. The supplied material characterizes the feature as an upcoming rollout but does not provide enough detail to establish current geographic coverage, merchant eligibility or adoption. Advertisers should therefore verify access in their own accounts before designing a campaign around it.

    Product catalogs become the connective data layer

    Product tiles in a central digital catalog connect to live video, personalized shopping placements, a mobile product page, and secure checkout.

    CrushPress.AI reported that Meta was making product data a core component of Sales campaigns. The described approach combines catalog feeds with creative assets while Meta’s AI assembles ads for individual users. Details such as price and availability can therefore influence both what is shown and how accurately an ad reflects the product being sold.

    This positions the catalog as more than an inventory file. It connects recommendations, ad delivery and the purchase opportunity. The report also framed product discovery as increasingly driven by recommendations appearing in feeds, creator videos and business content rather than beginning with a conventional product search.

    That makes feed quality operationally important. If product names, prices, availability or destinations are incomplete or stale, automated assembly can distribute those weaknesses at scale. Strong creative still matters, but it must be supported by reliable commerce data.

    Campaign evaluation should follow the entire purchase path

    The combined proposition should be assessed as a sequence rather than as an ad-format experiment alone. Advertisers need to distinguish reach generated by live promotion from meaningful product engagement, checkout starts and completed purchases. A large viewing audience is useful only when it produces qualified movement through the funnel.

    Catalog accuracy, livestream presentation and checkout confidence can each become a constraint. If viewers engage but do not open product information, the offer or demonstration may need work. If product engagement is healthy but checkout completion is weak, payment confidence, total cost or post-purchase policies may deserve closer examination. Virtual cards could remove one objection, but they cannot diagnose every reason for abandonment.

    Advertisers should also separate platform automation from commercial judgment. Meta’s AI can use product data to assemble and deliver ads, as the report describes, but businesses remain responsible for assortment, positioning, accurate information and the customer experience after payment.

    Key takeaways

    • Live shopping ads can extend a broadcast beyond its organic audience while keeping product discovery close to the buying action.
    • Virtual card numbers are intended to limit exposure of a shopper’s underlying card details, but they address only one dimension of transaction trust.
    • Product catalogs increasingly support ad personalization and discovery, making feed accuracy central to campaign quality.
    • Performance should be judged across viewing, product engagement, checkout initiation and purchase rather than by reach or clicks alone.

    The next meaningful test is whether Meta can make these layers consistently available and reliable enough to produce measurable gains for merchants. Advertisers that establish clean catalog data and full-funnel measurement will be better positioned to evaluate that opportunity as access expands.

    References

  • Meta’s European Digital-Tax Surcharge: A Budgeting Guide

    Meta’s European Digital-Tax Surcharge: A Budgeting Guide

    Your Meta campaign can hit its media-spend target and still exceed the amount finance expected to pay. From July 1, ads aimed at several European markets carry an additional charge of 2%, 3% or 5%, before any VAT.

    If you advertise across borders, your company’s address won’t protect the budget. The rate follows the location targeted by the ad, so you need to revise forecasts, performance metrics and client billing at the market level.

    The surcharge follows the audience, not your billing address

    Glowing ad signals travel from an office and unmarked invoice to audience locations across a map of Europe, where separate coin stacks appear.

    Under Meta’s announced digital-services-tax policy, the advertiser pays a location-specific surcharge beginning July 1. France, Italy and Spain carry a 3% rate; Austria and Turkey carry 5%; and the UK carries 2%.

    The practical rule is simple: look at where the campaign targets people, not where the ad account, agency or company is based. A US business targeting France is exposed to France’s 3% rate. A UK business targeting Austria is exposed to Austria’s 5% rate.

    Target locationSurchargeCost of $100 in media, before VAT
    France3%$103
    Italy3%$103
    Spain3%$103
    Austria5%$105
    Turkey5%$105
    UK2%$102

    The table shows why a media budget and a payable budget can no longer be treated as the same number. Meta’s own example is a $100 ad targeting Italy: the advertiser pays $103, excluding VAT. VAT remains separate, so $103 should not automatically be treated as the final invoice total.

    For campaigns covering several countries, don’t apply one country’s rate to the whole plan. Allocate spend by target market, multiply each amount by the applicable rate, and add the results. If delivery shifts toward a 5% market, the total charge rises even when aggregate media spend stays unchanged.

    For locations outside the listed schedule, don’t invent a planning rate. Check the billing notice for that market before approving the budget. The absence of a country from this table is not evidence about every other tax or platform fee that might apply.

    Choose which budget number must stay fixed

    You can’t preserve the same media delivery, the same total cash outlay and the same return ratio simultaneously when a new cost is added. Decide which constraint matters before changing campaign budgets.

    1. Keep media spend fixed. Use this when reach, traffic or conversion volume matters more than the existing cash ceiling. A $100 Italy media plan remains $100 in media, but its pre-VAT cost becomes $103.
    2. Keep total cash outlay fixed. Reduce allowable media spend so the media plus surcharge fits the approved total. For a $100 pre-VAT cap in a 3% market, allowable media spend is approximately $97.09, because $97.09 multiplied by 1.03 is about $100.
    3. Keep an economic return threshold fixed. Continue funding markets only while revenue or contribution margin supports the all-in cost. This may produce different budget decisions in two countries even when their in-platform conversion performance looks identical.

    Use two formulas in your planning sheet:

    • Expected pre-VAT cost = media spend x (1 + surcharge rate).
    • Allowable media spend = fixed pre-VAT cash cap / (1 + surcharge rate).

    Do not respond by cutting every European campaign 5%. That would overcorrect UK campaigns, which carry a 2% rate, and the 3% markets. It would also confuse a finance constraint with a performance decision. Apply the actual target-location rate first; then decide whether the resulting economics still meet your threshold.

    The same distinction matters in annual and quarterly plans. If your existing budget authorization covers media only, add a separate surcharge line. If it is an all-in cash ceiling, calculate how much media remains available after the charge. Write that assumption into the plan so the campaign manager and finance team don’t each interpret the same number differently.

    Measure all-in CPA and ROAS, not just platform performance

    A billing surcharge can create a reporting split. The advertising view may focus on media spend and auction performance, while the ledger records the higher amount actually paid. Unless your reporting layer imports the surcharge, both views can be internally correct and still lead to different decisions.

    Keep the media metrics for campaign diagnosis. They tell you whether targeting, creative, bids or conversion volume changed. Add all-in metrics for budget and profitability decisions:

    • Media CPA = media spend / conversions.
    • All-in CPA = media spend plus the surcharge / conversions.
    • Media ROAS = attributed revenue / media spend.
    • All-in ROAS = attributed revenue / media spend plus the surcharge.
    • All-in CPM = media spend plus the surcharge, divided by impressions, multiplied by 1,000.

    Suppose an Italy campaign produces the same impressions, conversions and revenue after July 1 as it did before. Its media performance has not deteriorated. Its economic performance has: every $100 of media now creates $103 of pre-VAT cost. If you compare the old media-only ROAS with the new all-in ROAS without labeling the methodology, the apparent decline can be mistaken for an auction or creative problem.

    Preserve both columns rather than rewriting history. Label one set as media metrics and the other as all-in metrics, then mark July 1 as a change in cost methodology. This gives operators a stable campaign diagnostic while giving finance and leadership the number that reflects actual cost.

    VAT needs its own treatment. Whether VAT belongs in a profitability model can depend on the business, jurisdiction and recoverability. Have the finance or tax owner decide that treatment; don’t make a universal VAT assumption inside the advertising dashboard.

    Build a market-level control sheet before approving spend

    A blank market-planning board organizes colored budget tokens beside a calculator, coins and an unlabeled map of Europe.

    A single blended percentage is acceptable for a rough scenario, but it is weak operational control. The country mix can change, and the difference between 2% and 5% is large enough to distort forecasts when spend is concentrated in the higher-rate markets.

    Your control sheet should contain one row per target market and these fields:

    • Target country and reporting currency.
    • Planned media spend.
    • Applicable surcharge rate.
    • Expected surcharge amount.
    • Expected total before VAT.
    • Approved cash ceiling and whether it includes the surcharge.
    • Conversions and attributed revenue.
    • Media CPA and ROAS.
    • All-in CPA and ROAS.
    • Invoice variance and the person responsible for resolving it.

    Then work through the change in this order:

    1. Inventory active and scheduled campaigns. Identify every campaign that targets France, Italy, Spain, Austria, Turkey or the UK, including campaigns run from accounts based elsewhere.
    2. Map spend to the correct rate. Avoid applying a company-wide rate when campaigns deliver into countries with different percentages.
    3. Declare the fixed constraint. Record whether the approved number is media spend, pre-VAT cash outlay or a return target.
    4. Update forecasts and purchase approvals. Add the charge as a visible line instead of hiding it in a miscellaneous variance allowance.
    5. Update performance reporting. Add all-in CPA, ROAS and CPM while keeping media-only metrics available for diagnosis.
    6. Reconcile the first affected invoice. Compare the charged amounts with spend delivered into each covered location. Investigate differences instead of silently absorbing them into campaign variance.

    You don’t necessarily need to split every multi-country campaign. Separate markets when country-level budget control, margin differences, client ownership or invoice reconciliation justify the added structure. Keep them consolidated when a unified campaign is operationally preferable, but calculate the expected surcharge as a spend-weighted amount rather than using the highest or lowest rate.

    Agencies also need a contract check. Don’t add a generic 5% client fee to all European activity: the listed rates differ, and the charge follows the target location. Confirm whether taxes and platform surcharges are included in the existing fee arrangement or passed through separately. If the contract is unclear, get legal or finance review before changing a client’s invoice.

    Key takeaways for your July 1 plan

    • Meta’s surcharge is determined by the ad’s target location, not the advertiser’s home country.
    • The listed rates are 3% for France, Italy and Spain; 5% for Austria and Turkey; and 2% for the UK.
    • A $100 Italy ad becomes $103 before VAT, so media spend and total payable cost are different numbers.
    • If the cash ceiling cannot rise, divide that ceiling by 1 plus the applicable rate to find the allowable media spend.
    • Use media-only metrics to diagnose campaigns and all-in CPA, ROAS and CPM to judge economic performance.
    • Forecast and reconcile by market, especially when one campaign covers countries with different rates.

    Before the next Europe-focused budget is approved, add the country, rate and all-in cost fields to the planning sheet and make one person responsible for the first invoice reconciliation. The surcharge itself isn’t optional for covered delivery; the decision you control is whether it becomes a planned cost or an unexplained miss.

    References

  • Meta Attribution Updates: A Practical Guide for Advertisers

    Meta Attribution Updates: A Practical Guide for Advertisers

    If Meta Ads Manager starts showing a different mix of attributed conversions, do not let the first reporting change trigger an automatic budget change. Your ads may not have become better or worse. Meta has changed how it classifies the interactions that happen before a conversion.

    You now need to separate conversions connected to an actual link click from conversions preceded by a like, share, save, or qualifying video engagement. That distinction can improve your analysis, but only if you reset your baseline and stop treating every attributed conversion as the same kind of evidence.

    Meta now draws a harder line between traffic and engagement

    For campaigns focused on website or in-store conversions, only link clicks will contribute to click-through attribution. Likes, shares, saves, and other non-link interactions will no longer be counted as click-through activity. Conversions associated with those interactions move into engage-through attribution.

    Reporting elementPrevious treatmentNew treatmentHow to interpret it
    Link click before conversionIncluded in click-through attributionRemains in click-through attributionThe person used the ad’s link before converting
    Like, share, save, or another non-link interactionCould contribute to the broader click-through classificationMoves to engage-through attributionThe person interacted with the ad but did not necessarily visit through its link
    Engagement-based namingEngaged-view attributionEngage-through attributionThe label now covers a broader range of social interactions
    Video engaged-view qualification10 seconds5 secondsShorter video engagement can qualify for the engagement-based category

    This is more than a terminology cleanup. A link click is evidence of navigation. A like or save is evidence of engagement. Both can matter, but they answer different questions. Keeping them in separate reporting categories prevents a social interaction from looking like a website visit.

    The shorter video qualification reflects how quickly people can respond to short-form creative. Meta reports that 46% of Reels purchase conversions happen within the first two seconds. Treat that as evidence that meaningful exposure can happen quickly, not as proof that every brief view caused the eventual purchase.

    The reporting definitions are changing, but Meta says billing methods remain unchanged. That matters when you investigate an apparent performance shift: first establish whether spend, sales, and cost actually changed, or whether the same outcomes were redistributed between attribution categories.

    Key takeaways

    • Click-through attribution now requires a link click for website and in-store conversion campaigns.
    • Likes, shares, saves, and other qualifying non-link interactions belong under engage-through attribution.
    • Engage-through replaces the older engaged-view label and gives social interactions a distinct reporting role.
    • The video engaged-view qualification moves from 10 seconds to 5 seconds.
    • Historical and current reports may not be directly comparable, so establish a new baseline before changing budgets.
    • Cleaner click-through reporting can reduce one source of disagreement with Google Analytics, but it will not make the two platforms identical.

    Reset your baseline before changing campaign spend

    An analyst aligns two measurement rails at a shared starting point while budget tokens remain set aside on the desk.

    An attribution definition change creates a break in your reporting history. If you compare a period using the old classification with one using the new classification, part of the apparent movement may come from relabeling rather than customer behavior.

    Build a clean handoff around the date the new definitions become visible in your account:

    1. Record the transition date. Note when click-through and engage-through first appear under the new definitions. Add that date to your reporting calendar, dashboard annotations, and client notes.
    2. Preserve a pre-change export. Save campaign, ad set, and ad-level results from a representative period before the transition. Include spend, impressions, link clicks, attributed conversions, conversion value, and the attribution settings used at the time.
    3. Write down your conversion definition. Specify the event that counts as success, where it occurs, and whether your report covers website conversions, in-store conversions, or both. A purchase, qualified lead, and store visit should not be blended into one unexplained total.
    4. Create separate reporting lines. Show link-click conversions, engage-through conversions, and the combined attributed total where those fields are available. Do not hide the split inside one return-on-ad-spend number.
    5. Compare matched periods. Use periods with the same length and comparable day mix. Keep the conversion event and attribution configuration consistent. Otherwise, you will be measuring several changes at once.
    6. Delay attribution-driven budget reactions. If sales, leads, or revenue changed, investigate immediately. If only the attribution mix changed, wait until you have a complete reporting cycle under the new definitions. Changing spend at the transition point makes it harder to distinguish a real performance effect from reclassification.

    Your old results are not useless. They simply need a boundary marker. Keep them for directional and seasonal context, but do not present an old click-through conversion and a newly defined click-through conversion as perfectly equivalent.

    Reconcile Meta and Google Analytics without forcing a match

    Two transparent measurement lenses observe different parts of the same path from an advertisement to a website visit and purchase.

    Restricting click-through attribution to link clicks should make that category conceptually closer to the traffic Google Analytics can observe. It removes likes, shares, and saves from a bucket that sounds like site navigation. That can reduce one source of reporting confusion, but it does not create measurement parity.

    Meta Ads Manager and Google Analytics observe different parts of the journey and apply different credit rules. Ads Manager can associate a conversion with an eligible ad interaction. Google Analytics primarily reports activity it can observe on the website or app. Engagement-based and view-based influence will therefore remain a legitimate reason for totals to differ.

    When the platforms disagree, reconcile them in this order:

    1. Match the business outcome. Confirm that both reports use the same event. Do not compare Meta purchases with a Google Analytics report that includes begin-checkout events or other conversions.
    2. Match the period and time zone. A conversion near midnight can land on different dates when account settings differ. Check this before interpreting a daily gap.
    3. Inspect link tracking. Verify that campaign parameters survive redirects and reach the final landing page. A genuine Meta link click cannot appear under the expected campaign in Google Analytics if the identifying parameters are removed.
    4. Separate click-through from engage-through. Compare Google Analytics traffic and conversions primarily with Meta’s link-click-derived results. Keep engage-through visible as a separate influence measure instead of treating its absence from Google Analytics as a tracking failure.
    5. Check the conversion handoff. For purchases or leads, compare the underlying business records with both platforms. Platform totals are interpretations of those outcomes; your order or lead system should remain the control total.
    6. Document unresolved differences. Record which touchpoints, attribution rules, and conversion windows each report includes. A known, consistently defined gap is more useful than a forced match built from incompatible metrics.

    If you use Northbeam or Triple Whale, inspect their definitions as well. Meta is working with both analytics providers to incorporate clicks and views into their attribution models. That collaboration does not remove the need to verify which fields are available in your account, when the integration takes effect, and whether historical data is reclassified. Do not assume two dashboards use the same definition merely because both display a Meta conversion total.

    Use the new split to make better creative and budget decisions

    The practical value of the update is not a tidier dashboard. It is the ability to ask what kind of response each ad produces before you decide what to scale.

    Use link-click results to judge the route to conversion

    Link-click attribution is the more relevant slice when an ad is expected to move someone directly to a product page, lead form, booking page, or store-information page. Evaluate it alongside link clicks, landing-page activity, completed conversions, conversion value, and cost.

    If Meta shows strong link-click conversion performance but your analytics platform records little corresponding traffic, investigate the path before increasing spend. Check the destination URL, campaign parameters, redirects, page loading, consent behavior, and conversion event. A platform-reported conversion does not prove that your traffic instrumentation is healthy.

    Use engage-through results as influence evidence

    An engage-through conversion tells you that an eligible social interaction preceded the conversion. It does not tell you that the person visited through the ad, and attribution alone does not prove that the interaction caused the sale.

    That makes engage-through useful for creative designed to earn saves, sharing, discussion, or later consideration. Read it with engagement quality, branded demand, direct traffic, and business outcomes. If engage-through conversions rise while link clicks and sales stay flat, do not scale a direct-response budget solely because the attributed total looks larger. Test whether the creative produces incremental conversions or improves the next step in the journey.

    Treat five-second video qualification as a measurement rule, not a creative target

    The shift from 10 seconds to 5 seconds makes shorter video engagement eligible sooner. It does not mean five seconds is the ideal ad length, that a five-second viewer has purchase intent, or that every conversion following a short view belongs entirely to the video.

    For Reels and other fast video placements, make the opening seconds understandable without a long setup. Show the product, problem, use case, or brand cue early enough that a brief exposure communicates something real. Then judge the ad on two tracks: whether it earns attention and whether the resulting business outcomes justify the spend.

    A simple decision matrix can keep the new categories in proportion:

    • Strong link-click conversions and strong business outcomes: the ad is supporting a measurable route to conversion. Consider scaling gradually while watching marginal cost.
    • Strong engage-through results but weak link traffic: the creative may be influencing consideration rather than driving immediate visits. Keep it separate from direct-response evaluation and test its incremental contribution.
    • Strong link clicks but weak completed conversions: examine the offer, landing page, checkout, lead form, and event implementation. The ad may be generating traffic while the post-click experience loses it.
    • High attributed totals with no movement in underlying sales or leads: treat the platform result cautiously. Attribution can redistribute credit; it cannot create business outcomes.
    • Weak click-through and engage-through performance: changing the attribution label will not rescue the campaign. Revisit the audience, offer, creative, and conversion path.

    At your next performance review, place link-click conversions, engage-through conversions, and verified business outcomes beside one another. Make a budget decision only after you can identify which line moved and what behavior it represents. That is how the attribution update becomes a better decision system instead of another reporting dispute.

    References

  • Meta Ads KPI Relationships: A Diagnostic System for Growth

    Meta Ads KPI Relationships: A Diagnostic System for Growth

    Your ROAS has dropped, and the obvious move is to pause the ad. That may stop the loss, but it doesn’t tell you what failed. ROAS is the last result in a chain that begins with delivery, passes through attention and the click, and ends with a purchase and its value.

    You can make a better decision by finding the first broken handoff in that chain. Once you know whether the friction sits in the auction, creative, page load, offer or checkout experience, you can test the part that actually needs work.

    Build one KPI chain from impression to revenue

    Ads Manager presents metrics as neighboring columns. Your customer does not experience them that way. Each stage depends on the one before it, so a weak result downstream may have been created several steps earlier.

    Read the account from left to right. Start with delivery and volume, then follow the user through attention, click, arrival, conversion and order value. Your job is to find the earliest stage where performance diverged from its normal relationship with the next stage.

    StageQuestion to answerKPIs to read together
    DeliveryIs Meta finding and serving enough impressions at a workable cost?Spend, impressions, reach, CPM and frequency
    AttentionDoes the creative earn attention and keep it?Hook rate and hold rate
    ResponseDoes that attention create a useful click?Link CTR, link clicks and CPC
    ArrivalDoes the click become a loaded landing page?Link clicks, landing page views and cost per landing page view
    ConversionDoes the page turn qualified visits into the intended action?CVR and CPA
    ValueDoes each conversion generate enough revenue?AOV and ROAS

    This sequence prevents a common diagnostic error: blaming the most visible metric rather than the first broken relationship. Low ROAS does not automatically make the ad creative the problem. High CPM does not automatically make the audience the problem. High CTR does not automatically mean the traffic is valuable.

    Be precise about metric definitions before comparing them. Link CTR and CTR for all clicks do not describe the same behavior. CVR based on landing page views is not interchangeable with CVR based on link clicks or sessions. Select one definition for each stage and use it consistently across the campaigns, ads and periods you compare.

    Treat “high” and “low” as comparisons with a relevant baseline, not universal judgments. Use the same campaign objective, conversion event, attribution setting and reporting level. A campaign can look different because its measurement context changed even when the customer journey did not.

    Use KPI math to locate the pressure on CPA and ROAS

    The relationships become clearer when you decompose the outcome. The following equations are useful diagnostic identities when every input uses the same spend, reporting period, attribution scope and event definitions.

    RelationshipWhat it isolatesWhat a deterioration means
    CPC = CPM / (1,000 x link CTR as a decimal)The combined effect of auction cost and click efficiencyCPC can rise because impressions became more expensive, link CTR fell, or both happened
    Arrival rate = landing page views / link clicksThe handoff between the ad and the websiteMore clicks are failing to become recorded page loads
    Cost per landing page view = CPC / arrival rateThe real cost of delivering a visitor to the pageEven inexpensive clicks can become expensive visits when arrival rate falls
    CPA = cost per landing page view / CVRThe combined effect of visit cost and conversion efficiencyCPA can rise because visits cost more, fewer visits convert, or both
    ROAS = AOV / CPAThe relationship between acquisition cost and order valueROAS can fall because CPA rose, AOV fell, or both

    The last identity assumes that CPA represents an attributed purchase and AOV uses the same attributed purchases and revenue. If your account mixes lead events, modeled values, different attribution settings or different denominators, use the relationship directionally rather than expecting the columns to reconcile exactly.

    This decomposition gives you four useful reads:

    • If CPM rises while link CTR stays flat, CPC should rise. The pressure began before the website.
    • If CPC stays stable while CPA worsens, inspect arrival rate and CVR. The auction is unlikely to be the first bottleneck.
    • If CPA stays stable while ROAS declines, inspect AOV and recorded purchase value before replacing a productive ad.
    • If link CTR improves while CVR falls, the creative may be generating more interest without generating more qualified demand.

    The equations are not a substitute for judgment. They narrow the investigation. They tell you which relationship must have changed, then the surrounding metrics help you decide why.

    Find the first broken handoff before choosing a fix

    A glowing stream crosses connected isometric platforms toward a package and gem, while an early bridge is cracked and marked by an inspection light.

    CPM and reach: separate auction pressure from a delivery problem

    CPM is not simply the price of an audience. It is feedback from an auction in which bid, estimated action rates and user value contribute to total value. A CPM increase can therefore support several hypotheses: stronger competition, weaker expected response, reduced creative resonance or some combination of them.

    Pair CPM with spend, impressions, reach and link CTR. If CPM rises while delivery and response weaken, investigate the creative and auction environment before assuming that a higher budget will solve the problem. If CPM rises but CTR, CVR and order value remain healthy, you may be seeing cost pressure rather than a broken journey. The unit economics decide whether that pressure is tolerable.

    A fall in impressions or spend also deserves attention before you inspect rates. When volume changes sharply, rate metrics can distract you from the more basic issue that the system is no longer delivering the ad at the same level. Check the delivery pattern and creative response together; lower volume identifies an area to investigate, not a cause by itself.

    Hook rate and hold rate: distinguish stopping power from sustained interest

    Hook rate and hold rate answer different questions. The hook earns the first moment of attention. The rest of the creative has to retain that attention, develop the proposition and create a reason to act. Use the definitions configured in your reporting setup consistently, because the exact event or viewing threshold behind each metric may differ.

    • High hook rate with low hold rate: the opening stops the scroll, but the body loses people. Keep the opening as the control and test the middle, pacing, proposition or closing call to action.
    • Low hook rate with high hold rate: the content works for the smaller group that gets past the opening. Test a new hook that accurately sets up the existing message; rebuilding the whole ad would discard the part already holding attention.
    • Healthy hook and hold rates with weak link CTR: the ad may be watchable without making the next step compelling. Clarify the value of clicking, the offer and the call to action.

    Do not optimize the hook in isolation. A sensational opening can improve an attention metric while attracting people who do not want the product. The relevant question is whether the hook hands the right viewer to the body of the ad, and whether the body hands that viewer to the landing page.

    Link clicks and landing page views: verify that traffic actually arrives

    A link click records intent to leave the placement. A landing page view indicates that the destination loaded far enough to produce the relevant event. The gap between the two is a separate performance stage, not a minor reporting detail.

    A result such as 1,000 link clicks but only 450 landing page views should trigger a technical investigation. It does not prove one cause, but it is too large a handoff loss to treat as a creative problem without checking the destination.

    Work through the handoff in this order:

    1. Confirm that link clicks and landing page views use the same date range, reporting level and destination.
    2. Calculate arrival rate by dividing landing page views by link clicks. Track that ratio beside CTR and CPC.
    3. Open the exact destination used by the ad and check whether redirects, server response or page load delay obstruct the visit.
    4. Verify that the landing page view event is present and firing as intended. A measurement failure and a loading failure can create a similar dashboard pattern.
    5. Judge CVR only after you understand which denominator it uses. Purchases divided by clicks and purchases divided by landing page views answer different questions when arrival rate is weak.

    This relationship explains why cheap clicks can still produce an expensive campaign. If many clicks never become page views, the effective cost of an actual visitor rises even when CPC looks attractive.

    CTR, CVR and AOV: test message match before blaming traffic

    High CTR and low CPC show that an ad can generate clicks efficiently. They do not show that the page can convert those clicks or that the resulting purchases carry enough value. When CTR looks healthy but ROAS does not, split the post-click result into CVR and AOV.

    • CVR fell: inspect landing-page relevance, the offer and the path to conversion. The traffic may have encountered friction, or the ad may have promised something the page does not deliver clearly.
    • CVR held but CPA rose: look upstream at the cost of delivering a real visitor. CPM, CTR or arrival rate may have changed.
    • CPA held but ROAS fell: inspect AOV and attributed revenue. Replacing the ad will not repair a decline in value per purchase.

    Message match is often the practical issue. If one creative promotes several products but sends every click to a detailed page for only one of them, some interested users will land in the wrong context. A relevant collection page can preserve the range of choices presented in the ad. The destination should continue the decision the creative started.

    This is also why a CTR increase can be misleading. More clicks are useful only when the next-stage metrics show that they are arriving and converting. If CTR rises while CVR collapses, test whether the new creative broadened curiosity beyond the people who are likely to buy.

    CPA and frequency: look for fatigue as a paired movement

    Frequency matters because it gives context to a changing CPA. When frequency and CPA rise together, creative fatigue becomes a reasonable working hypothesis. Refresh the creative input or expand targeting when the audience is too narrow before relying on higher bids or budgets.

    Frequency alone is not a verdict. If it rises while CTR, CVR and CPA remain stable, the account is not showing the same evidence of fatigue. Monitor the relationship instead of applying an arbitrary frequency cutoff. The damaging condition is repeated exposure accompanied by weaker response or more expensive acquisition.

    Turn the diagnosis into one controlled Meta Ads test

    Two matching miniature conversion pathways receive equal streams of glowing beads, with one component changed in the second pathway to represent a controlled test.

    A diagnosis is useful only when it changes what you test. Use the following process whenever a campaign or ad appears to be underperforming.

    1. Lock the comparison context. Use the same reporting level, objective, conversion event, attribution setting and metric definitions. Do not compare one ad with a campaign-wide blended result and treat the difference as causal.
    2. Check volume first. Record spend, impressions and reach. A delivery change can alter the meaning of every rate that follows.
    3. Trace the chain in order. Read CPM and frequency, hook and hold, link CTR and CPC, clicks and landing page views, CVR and AOV, then CPA and ROAS.
    4. Name the first broken relationship. “ROAS is down” is an outcome, not a diagnosis. “CPC is stable, but fewer clicks become landing page views” identifies a handoff you can investigate.
    5. Assign the problem to an owner. Creative owns attention and click motivation. The media and auction context shape delivery. The website and measurement setup own the click-to-page-view handoff. The page, offer and purchase path shape CVR. Product mix and order value shape AOV.
    6. Change one meaningful variable. If CVR is the first break, test the landing experience or offer while holding the ad steady. If hold rate is the first break, edit the body or ending while retaining the hook as the control.
    7. Choose an expected KPI and a guardrail. A page-load fix should improve arrival rate without requiring CTR to change. A new hook should improve initial attention without damaging hold rate, CTR or downstream conversion quality.
    8. Read the whole chain again. A local improvement counts only if it preserves or improves the handoff to the next stage.

    Write the test as a short diagnostic note before making the change: observed pattern, working hypothesis, variable being changed, metric expected to respond and downstream guardrail. For example: “Link CTR is stable, arrival rate has fallen and CVR among recorded landing page views is stable. Check page delivery and tracking; do not replace the ad. Arrival rate is the response metric, while link CTR is the guardrail.”

    This discipline matters because simultaneous changes erase the explanation. If you replace the creative, broaden targeting, rewrite the page and alter the offer at once, a better result will not tell you which bottleneck was real. A worse result will be equally difficult to interpret.

    Key takeaways

    • ROAS and CPA are outputs. Diagnose them by tracing delivery, attention, click, arrival, conversion and value in order.
    • Use compatible denominators. Link CTR, landing page arrival rate and landing-page-based CVR reveal different handoffs that blended metrics can hide.
    • Read paired movements. CPM with CTR, hook with hold, clicks with landing page views, CPA with frequency, and CPA with AOV are more informative than isolated scores.
    • Find the first broken relationship. Downstream damage does not prove that the downstream stage created it.
    • Change one variable at the identified bottleneck, then watch the next-stage KPI as a guardrail.

    The next time ROAS falls, do not begin with the pause button. Put the KPIs in journey order and mark the first handoff that changed. That relationship gives you the next investigation, the next controlled test and a reason for acting that is stronger than a red number on a dashboard.

    References

  • Meta Paid Subscriptions: A Decision Guide for Marketers

    Meta Paid Subscriptions: A Decision Guide for Marketers

    If Meta offers you a paid tier inside Instagram, Facebook, or WhatsApp, don’t start with the length of the feature list. Start with the recurring problem you need the subscription to solve. A premium control is valuable only when it changes a decision, removes meaningful work, or produces a measurable business result.

    That distinction matters because Meta is experimenting with several kinds of value at once: audience controls, deeper insights, AI creation capacity, and AI-assisted productivity. You need a way to evaluate each capability without assuming that payment automatically buys attention.

    What Meta is actually testing across its apps

    Meta is testing paid subscriptions on Instagram, Facebook, and WhatsApp. The core experiences are expected to remain free, and the experiments are being developed as app-specific offerings rather than one universal bundle.

    These subscriptions are also separate from Meta Verified. That is an important purchasing distinction. Verification-related value and access to premium creation, productivity, or audience tools should be evaluated as different products, even if they eventually appear next to each other in an account.

    Instagram’s initial candidates may include unlimited audience lists, information about non-followers, and stealth Story viewing. Treat those as provisional examples, not a promised package. A feature displayed in another account, market, or test does not belong in your business case until it appears in the offer available to you.

    AI is a larger part of the direction. Meta intends to give paying users greater access to its Vibes AI video generator through a freemium model. It also plans to embed the Manus AI agent in its apps and offer separate Manus subscriptions to businesses. Meta acquired Manus for $2 billion, and an Instagram shortcut has been reported as part of the prospective integration. The investment shows that AI is not merely a decorative subscription extra, but it still does not tell you which workflows the final products will support.

    Put every proposed feature into one of four practical buckets:

    • Control: who can see something, how an audience is organized, or how you interact with content.
    • Intelligence: information that can improve a content, audience, or campaign decision.
    • Production: tools or capacity that help create more usable assets.
    • Productivity: assistance that removes steps from a repeatable workflow.

    This classification gives each feature an owner and a measurement plan. It also exposes vague offers. If your team cannot identify the bucket, the recurring job, and the expected result, the feature is not ready for a budget.

    Paid access does not automatically mean greater reach

    An unbranded phone unlocks a set of premium tools while a distant audience remains the same size and distance away.

    Nothing in the subscription test description establishes that paying will give posts preferential ranking or guaranteed distribution. Do not build a forecast around an algorithmic advantage that Meta has not explicitly offered.

    A subscription could improve results indirectly. Better non-follower information might change what you publish. More AI video capacity might let you test additional creative ideas. Audience lists might make a recurring sharing workflow easier. In each case, however, the paid feature is only the first link in a longer chain:

    • Entitlement: your account receives access to the feature.
    • Adoption: someone uses it in a defined workflow.
    • Audience effect: the resulting content or interaction produces a different response.
    • Business effect: that response contributes to a qualified visit, lead, sale, retention outcome, or documented cost saving.

    Only entitlement follows directly from the transaction. You have to demonstrate the other three. This is why impressions, generation counts, and time spent inside a premium interface are weak success measures on their own.

    The same discipline applies to SEO, answer engine optimization, and generative engine optimization. A paid Meta tool may help you create or adapt content, but it does not by itself produce a durable, crawlable, well-supported answer on your website. It also does not guarantee that a search engine or frontier model will cite your brand. Keep social production and owned-content visibility as connected but separately measured systems.

    If reach is your goal, write the hypothesis in mechanism terms. For example: non-follower insights will reveal a recurring topic gap; the team will use that gap to revise its content plan; the revised content should increase qualified actions from people outside the existing audience. That can be tested. “Premium will increase reach” cannot.

    Decide whether a feature solves a paid-worthy problem

    A long menu makes an offer feel valuable even when most of its features will never enter your workflow. Replace feature counting with a written decision gate.

    Answer five questions before checkout

    1. What recurring job is difficult now? Name the work, the person doing it, and where the friction occurs.
    2. Does the available tier support that job today? Verify the in-account offer. Do not pay for a roadmap, a reported test, or a feature available only to someone else.
    3. What action will change? More data is not an outcome. Identify the content, audience, or operating decision that the new information will alter.
    4. What evidence will establish value? Choose a workflow metric and a downstream metric before activating the tier.
    5. What is the exit rule? Set the minimum result required for renewal and the condition that will trigger cancellation or another controlled test.

    If you cannot answer the third question, wait. A dashboard that creates no decision is another reporting obligation, not an intelligence advantage.

    Translate candidate features into proof

    Candidate capabilityProblem it could solveEvidence worth collectingCommon purchasing mistake
    Non-follower insightsUnderstanding how people beyond the current audience respondA documented content decision followed by qualified actions from the relevant audience segmentPaying for more charts without changing the content plan
    Unlimited audience listsManaging repeated sharing to distinct groupsLess list-maintenance work and better response from the intended groupCreating segments that nobody owns or uses
    Additional Vibes capacityProducing more usable video variations from a defined conceptApproved assets per production hour and outcomes per published assetCounting generated clips instead of publishable, effective clips
    Stealth Story viewingA specific personal or research preferenceA clearly stated utility that justifies the recurring expenseInventing a growth case for a feature with no growth mechanism
    Manus integrationA workflow the available agent can demonstrably completeCompletion time, error rate, review work, and avoided tool costSubscribing because of the acquisition or future integration plan

    For a business, calculate a maximum defensible recurring price before the actual price influences your judgment. Use this structure: verified labor saved, plus attributable incremental contribution, plus the cost of any tool you can genuinely retire, minus added review and governance costs. If the subscription is mainly for personal utility, compare it with a fixed discretionary budget instead of manufacturing a commercial return.

    Because Meta intends to develop different offerings for its apps, run that calculation separately for Instagram, Facebook, and WhatsApp. An Instagram production benefit does not justify a WhatsApp fee unless the WhatsApp tier independently improves a workflow you use.

    Test the workflow before making the subscription permanent

    A marketer tests an unbranded phone feature through a tabletop workflow that compares time, remaining work, results, and recurring cost.

    A new tool often receives extra attention during its first use. That novelty can look like productivity. A useful pilot captures all the work around the feature and holds unrelated variables steady.

    1. Capture a baseline. Use one complete, representative content or operating cycle. Record time, output, review work, and the downstream result with exact metric definitions.
    2. Choose one primary hypothesis. Tie one premium capability to one workflow change and one main result.
    3. Hold major confounders steady. Avoid changing publishing cadence, paid-media spend, offer, audience, and creative process at the same time.
    4. Log actual use. Record who used the feature, for which task, what failed, and how much correction or manual work followed.
    5. Inspect the full chain. Check entitlement, adoption, audience response, and business effect instead of stopping at platform activity.
    6. Apply the exit rule before the next billing decision. Renew, cancel, or run a narrower follow-up based on the threshold set before the test.

    A simple before-and-after pilot is not a true A/B test unless comparable users or outputs are assigned concurrently and other meaningful conditions are controlled. Call the method what it is. The goal is a decision-grade result, not a more impressive label.

    Measure AI output as a production system

    Generation speed alone will overstate the value of Vibes or any future AI feature. Include prompt preparation, source gathering, factual review, brand review, revisions, and publishing work. Useful operational measures include:

    • Approved assets per production hour: approved assets divided by the team’s total production and review time.
    • First-pass acceptance rate: assets approved without revision divided by all assets reviewed.
    • Publication rate: generated assets that were actually published divided by all generated assets.
    • Outcome per published asset: the chosen qualified action divided by the number of assets published.
    • Correction burden: review and revision time added because of factual, brand, or quality problems.

    These measures prevent cheap generation from hiding expensive review. They also let you compare an integrated Meta tool with your existing workflow without pretending that every generated variation has equal value.

    Keep your website as the factual source of truth

    If premium AI tools increase your social output, anchor that output in owned content. Publish the durable explanation, product information, evidence, or answer on your website first. Then derive platform-native clips and captions from the approved source.

    • Keep names, product details, definitions, and claims consistent between the web page and its social derivatives.
    • Give each substantive page a clear purpose, visible authorship where relevant, and a review process for material changes.
    • Use structured data only when it accurately represents content visitors can see on the page.
    • Link from social content when the page provides the useful next step, not merely to manufacture a click.
    • Measure social referrals, branded discovery, leads, and assisted outcomes separately; do not claim search or AI visibility from social activity alone.

    This arrangement gives AI production a controlled input and gives your audience a stable place to verify details. It also protects the content program from becoming dependent on a feature package Meta may change after testing.

    Key takeaways

    • Meta is testing separate paid offerings for Instagram, Facebook, and WhatsApp while keeping the core experiences free.
    • The proposed subscriptions are distinct from Meta Verified and may combine audience controls, insights, AI creation, and productivity features.
    • No described feature establishes that subscribers will receive automatic ranking or distribution priority.
    • Subscribe only when a capability changes a recurring workflow, has a measurable downstream result, and clears a pre-set renewal threshold.
    • Evaluate each app independently and include review, governance, and correction work in the cost of AI output.
    • Use premium social tools to derive and distribute content from an accurate owned source, not as a substitute for one.

    When an offer reaches your account, take a screenshot of the exact features and terms, choose one paid-worthy problem, and write the success and exit criteria before activating it. If you cannot define the changed action and the evidence it should produce, keep the free experience and revisit the decision when the product is clearer.

    References

  • Meta Andromeda and GEM: A Practical Ads Strategy for 2026

    Meta Andromeda and GEM: A Practical Ads Strategy for 2026

    If your old Meta Ads playbook depended on narrow interest stacks, duplicated ad sets, and frequent bid or budget adjustments, Andromeda and GEM create an uncomfortable question: which controls still help, and which ones now obstruct the system?

    The practical answer is not to hand everything to automation. It is to move your effort upstream. Use targeting to define genuine eligibility, give Meta a stronger range of creative choices, consolidate avoidable fragmentation, and judge performance at planned checkpoints instead of reacting to every short-term movement.

    What Andromeda and GEM actually change

    A useful operating model begins by separating retrieval from recommendation. Andromeda, introduced in 2024, retrieves ads that may be relevant to a person by using past interactions and creative-level signals. GEM then applies broader predictive intelligence to ad selection and sequencing. In simple terms, Andromeda helps assemble the viable candidates; GEM helps determine which candidate should be delivered and what interaction may make sense next.

    That distinction matters because neither system can rescue weak inputs. Retrieval cannot surface a useful creative concept that does not exist in your account. Recommendation cannot optimize toward a business outcome that is poorly measured or represented by the wrong campaign objective.

    LayerOperational roleYour strongest leverCommon mistake
    AndromedaRetrieves potentially relevant ads for an individual opportunityDistinct creative concepts and enough eligible reachDividing the audience so narrowly that each campaign sees only a thin slice of demand
    GEMPredicts which ad and sequence may produce the desired responseClear objectives, dependable measurement, stable delivery, and coherent offersChanging campaigns so often that the system has to optimize around a moving setup
    Combined systemMatches available ads to people and outcomes across Meta’s ecosystemHigh-quality inputs, useful creative variety, and disciplined evaluationTreating automation as a substitute for positioning, economics, or conversion experience

    This is why broad targeting and creative-first planning often belong together. A broader eligible audience gives the system more opportunities to find response patterns. Distinct creative concepts give it meaningful choices within that audience. Broad groups have been able to outperform elaborate interest-based setups as Meta’s retrieval became more creative-centric, but that is a strategic direction, not a promise that every broad campaign will win.

    Creative-first also does not mean targeting has become irrelevant. Targeting should still enforce real constraints: where you can sell, who is legally eligible, which existing customers should be included or excluded, and which regions can receive the offer. What has weakened is the case for using speculative audience slices as the main way to express relevance. When the difference is a motivation, pain point, use case, or level of awareness, express it in the ad before creating another audience partition.

    Consolidate campaigns without erasing business controls

    Many tangled campaign pathways merge into a few organized channels while several distinct control gates remain separate.

    The goal of simplification is signal concentration, not the smallest possible account. Before merging anything, ask whether the campaigns can genuinely share an objective, conversion event, offer, geographic eligibility, and economic target. If they cannot, separation may still be necessary. If they can, duplicated structures may only be dividing delivery data and forcing Meta to relearn similar patterns in several places.

    Use this consolidation test on every campaign and ad-set boundary:

    • Keep the boundary when the business outcome differs. A lead campaign and a purchase campaign are not interchangeable merely because they advertise the same brand.
    • Keep it when eligibility differs. Regional availability, language-dependent destinations, legal restrictions, and customer exclusions can justify separate delivery rules.
    • Keep it when economics require independent control. Offers with materially different margins, sales capacity, or acceptable acquisition costs may need their own budgets.
    • Question it when the only difference is a guessed persona or interest. If both groups can buy the same offer under the same economics, let persona-specific creative carry more of the distinction.
    • Question it when the split exists only for reporting convenience. Naming conventions, asset labels, and downstream reporting can often provide visibility without creating another delivery silo.

    After consolidation, do not judge success by whether every creative or audience receives equal spend. The system is designed to allocate delivery unevenly when it predicts unequal opportunity. Your decision metric should remain the campaign’s business outcome. Asset-level delivery is diagnostic evidence, not a fairness requirement.

    Budget belongs in the same discussion. Larger, consistent budgets can accelerate learning by producing a steadier flow of data. That does not make a budget increase an automatic cure. More spend can simply purchase more weak traffic when the offer, measurement, or creative is wrong. Scale only when the resulting acquisition cost and conversion quality remain acceptable to the business.

    A more useful budget question is: can this campaign run long enough to reach a planned decision point without a rescue edit? If the answer is no, reduce structural fragmentation, narrow the number of simultaneous tests, or revise the expected volume. A budget that forces constant intervention is not giving either system a stable problem to solve.

    Build creative coverage, not a pile of cosmetic variants

    Six distinct advertising concepts surround a central product pedestal, including demonstration, lifestyle, close-up, creator-style, problem-focused, and promotional scenes.

    Andromeda can retrieve only from the ads you supply. If every asset makes the same promise to the same implied buyer in nearly the same format, a large creative count can still represent very little strategic variety. Changing a background color, trimming a caption, or moving the logo produces a variant. Changing the buyer problem, promise, proof, objection, or presentation creates a new concept.

    Plan the creative library as a coverage map. For each concept, record:

    • Buyer context: the situation that makes the offer relevant, such as an urgent problem, a recurring task, or a planned upgrade.
    • Primary promise: the outcome the ad asks the buyer to value.
    • Reason to believe: the demonstration, mechanism, evidence, or explanation supporting that promise.
    • Objection addressed: the concern that could prevent action, such as effort, fit, complexity, or switching cost.
    • Format: the way the idea is experienced, including a demonstration, direct explanation, customer perspective, static visual, or short-form video.
    • Destination: the page or conversion path that continues the same message after the click.

    This map exposes false diversity quickly. If several ads have different thumbnails but identical entries in every other field, you have executional variation rather than broad conceptual coverage. That can still be useful for refining a proven idea, but it should not be mistaken for a portfolio capable of matching several motivations.

    A hypothetical analytics product illustrates the difference. One concept could focus on the reporting backlog and demonstrate an automated workflow. Another could focus on uncertainty in decision-making and show how an executive sees the underlying evidence. A third could address implementation anxiety with a clear explanation of the setup. The product is unchanged, but the reason to care, the proof, and the implied buyer situation are genuinely different.

    Meta’s AI-driven setup benefits from creative tailored to different personas and delivered through varied media formats. Treat that as a portfolio requirement, not permission to publish ungoverned volume. Every concept still needs an accurate claim, recognizable brand voice, and a landing experience that fulfills the promise.

    GEM’s role in sequencing also changes how you should think about a winner. The account does not necessarily need one universal ad that performs every communication job. It needs useful material for different interaction contexts: introducing the problem, explaining the solution, supplying proof, handling an objection, and stating the offer. You cannot dictate the exact sequence for every person, but you can make sure the available library contains coherent next steps.

    Use labels that preserve this strategic information. A useful asset name identifies the concept, promise, proof type, format, and version. That lets you see whether Meta is finding repeatable demand for a message or merely concentrating delivery on one execution. Without concept-level labels, creative analysis collapses into filenames and superficial format comparisons.

    Test with stable inputs and diagnose the right layer

    Stability does not mean leaving a campaign untouched indefinitely. It means deciding in advance what evidence will justify a change. Short-lived performance peaks and daily fluctuations are weak foundations for structural decisions. Longer engagement patterns, continuous creative renewal, and fewer hasty modifications fit the way Andromeda and GEM learn.

    Run a deliberate operating loop:

    1. Define the question. State whether you are testing a new buyer problem, promise, proof type, format, offer, or destination. Do not call an undefined batch of new ads a test.
    2. Set the decision rule before launch. Name the primary business outcome, any quality or profitability guardrail, and a review point that accounts for your normal conversion delay and data volume.
    3. Hold avoidable inputs stable. Keep the objective, measurement, offer, and destination consistent when the purpose is to compare creative concepts.
    4. Intervene only for a clear exception. A broken destination, rejected asset, invalid tracking setup, material pacing risk, or incorrect offer deserves immediate action. Ordinary movement does not.
    5. Review campaign outcomes and creative patterns separately. Decide whether the campaign is economically viable first. Then use asset patterns to brief the next round of concepts.
    6. Document the decision. Record what changed and why, so a later performance shift is not misattributed to the newest creative when budget, tracking, or structure changed at the same time.

    If you need causal certainty, use a controlled experiment that isolates the variable. Normal AI-optimized delivery is not an even creative rotation, so comparing two ads that received different audiences, spend, and timing does not produce a clean causal answer. Routine campaign reporting can identify promising patterns; it cannot automatically explain why they occurred.

    When results disappoint, diagnose the layer before rebuilding the account:

    • The campaign cannot spend: check eligibility, approvals, budget, bid or cost controls, audience restrictions, and delivery settings before blaming creative matching.
    • Ads receive delivery but little meaningful response: examine the hook, buyer problem, format, and clarity of the promise. More audience slicing will not repair an irrelevant message.
    • People engage but do not complete the next step: check whether the destination continues the ad’s promise, whether the offer is clear, and whether the conversion path adds avoidable friction.
    • Reported conversions change after measurement edits: separate the tracking change from the media conclusion. A reporting shift is not automatically a change in buyer behavior.
    • One concept absorbs most delivery: do not force equal allocation solely to make the report look balanced. Examine what buyer problem or proof it represents, then develop materially distinct ways to serve the same underlying demand.
    • Performance weakens after a previously productive run: refresh the concept portfolio and inspect the offer and destination. Recreating old audience complexity is unlikely to solve creative exhaustion.

    This diagnostic order protects you from a common failure mode: using targeting changes to solve a message problem, using new creative to solve a broken conversion path, or using more budget to solve weak economics. Andromeda and GEM can optimize delivery choices. They cannot decide which business problem you actually have.

    Key takeaways

    • Andromeda retrieves potentially relevant ads; GEM adds predictive selection and sequencing across broader interaction data.
    • Use targeting for genuine eligibility and control. Express motivations, use cases, and objections through creative before building another speculative audience slice.
    • Consolidate campaigns that share the same outcome, measurement, eligibility, offer, and economics, but retain boundaries that protect real business constraints.
    • Build distinct creative concepts around different problems, promises, proof, objections, and formats. Cosmetic variations are not strategic diversity.
    • Keep budgets and campaign inputs stable until a planned review point unless an operational problem requires immediate intervention.
    • Judge automation by profitable business outcomes, then use delivery patterns as evidence for the next creative brief.

    Start with one account audit. Mark every campaign boundary that exists only because of an assumed audience distinction, label each live ad by its actual concept, and choose the next review point based on your conversion delay. Those three actions will show whether you are giving Andromeda and GEM a clear optimization problem or a maze of competing instructions.

    References

  • Brand Visibility in Meta AI: A Practical Optimization Plan

    Brand Visibility in Meta AI: A Practical Optimization Plan

    Your Instagram and Facebook accounts can look active while your brand remains difficult for Meta AI to identify, explain or recommend. More posts won’t solve that problem if your name, category, offer and supporting evidence are inconsistent or buried inside promotional language.

    A better plan starts with the questions you want your brand to appear for. You then create a stable record of what the brand is, publish content that answers those questions, adapt that evidence to each Meta surface and test the resulting answers under repeatable conditions.

    Define the visibility outcome before you optimize

    “Brand visibility” is too broad to be a useful target. It can mean that Meta AI recognizes your name, understands what you sell, includes you in an unbranded recommendation or gives someone an accurate next step. Those are different outcomes, and each one exposes a different problem.

    Start with real user situations, not a generic goal such as “rank in Meta AI.” Group the questions that matter to your business by intent:

    • Discovery: Someone knows the problem or category but doesn’t know your brand.
    • Fit: Someone wants to know whether an option suits a particular audience, location, use case or constraint.
    • Evaluation: Someone is comparing approaches and needs meaningful differences, limitations and proof.
    • Validation: Someone has heard of your brand and wants to confirm what it does, whether it is credible or whether a claim is accurate.
    • Action: Someone wants the correct page, account, contact route or purchasing path.

    Write down the exact questions people are likely to ask. For each question, define what a satisfactory appearance would contain. A useful target might require the correct brand name, the right category, an accurate description of the offer, a relevant piece of evidence and a safe next step. “We should appear” isn’t specific enough to audit.

    Don’t make branded questions your only test. Asking “What is [Brand]?” measures whether the system can discuss a name the user has already supplied. Asking “Which providers solve [problem] for [audience]?” tests whether the brand can be discovered in the context that creates new demand.

    This distinction also prevents a common reporting mistake. Follower growth, feed reach and engagement can be useful channel metrics, but they don’t establish that Meta AI can represent the brand accurately. Track assistant visibility as its own outcome.

    Give Meta AI one coherent brand to understand

    A coordinated product box, bag and several blank social media content frames share the same teal-and-apricot geometric design.

    Before you create more content, establish a canonical brand record. This is the factual spine that should remain stable across your website, Instagram profile, Facebook presence and supporting content.

    Your internal record should settle the following points in plain language:

    • The exact brand name and any legitimate name variants.
    • The category the business belongs to.
    • The audience it serves and the problems it addresses.
    • The products, services or programs currently offered.
    • The geographic market or service area, where relevant.
    • The distinctions you can support with evidence.
    • The official website, social accounts and action paths.
    • Important boundaries, exclusions or eligibility conditions.

    Turn the core into a direct sentence: “[Brand] is a [category] for [audience] that provides [offer] in [market].” That sentence is an editorial control, not a slogan. It tells everyone producing content which facts must not drift.

    Consistency doesn’t require copying the same bio everywhere. It means the factual meaning survives every variation. One profile can be conversational and another can be detailed, but they shouldn’t assign the business to different categories, describe different audiences or send people to conflicting destinations.

    Run a contradiction audit before launching a new campaign. Compare your website, profile descriptions, About information, recurring captions and high-visibility explainers. Look specifically for:

    • Old names that remain in current-looking content.
    • Broad slogans that replace a clear category description.
    • Offers that have been renamed, narrowed or discontinued.
    • Different locations or service areas across properties.
    • Claims on social media that the website cannot substantiate.
    • Links that lead to obsolete pages or an unrelated homepage.
    • Third-party terminology that conflicts with the language you now use.

    Correct the properties you control before trying to overpower an error with more posts. Publishing new claims while prominent old claims remain live creates another version of the brand rather than a clearer one.

    Disambiguation matters when a name is generic, abbreviated or shared. Pair the name with its category, audience or location in visible text. A logo may tell a loyal customer who you are, but a sentence such as “[Brand] provides [service] for [audience]” gives both people and automated systems an explicit identity to work with.

    Publish evidence in a form that can answer a question

    A brand claim is not yet an answer. “Built for modern teams” doesn’t explain which teams, what the product does, when it fits or why anyone should believe the claim. If your content never resolves those points, an AI-generated answer has little dependable material to carry forward.

    Create a query-to-content map. Each priority question should have a clear, maintained destination that contains:

    • A direct answer: State the essential fact before the promotional explanation.
    • Scope: Identify the relevant audience, market, use case and conditions.
    • Support: Connect the claim to product details, documentation, policies, named credentials or other evidence you can verify.
    • Boundaries: Explain when the offer isn’t a fit or when the answer depends on a condition.
    • A next step: Point to the most relevant page or action rather than defaulting to a generic homepage.

    A practical content unit can follow this sequence: name the question, answer it in one plain sentence, explain the conditions, show the evidence, state the limitation and provide the appropriate action. The format works for product explanations, service-area pages, comparisons, policy answers and social captions because every element has a distinct job.

    Make important passages understandable on their own. Pronouns such as “it,” “this” and “they” become ambiguous when a sentence is separated from the surrounding post. Repeat the brand, product or service name where clarity requires it. This is useful writing, not keyword repetition.

    Apply the same rule to visual content. If a video or image contains an important product fact, include that fact in accessible supporting text such as the caption or transcript. The visual can carry the emotion and demonstration; the text should still identify the object, audience, claim and context. Essential meaning shouldn’t depend on a viewer recognizing an unlabeled product.

    Keep volatile facts maintainable. Pricing, availability, locations, eligibility and product status should have a clear canonical home. Update that destination when the fact changes, then align the social content that still receives attention. Scattering the same changing fact across many permanent assets makes contradictions more likely.

    If your website uses structured data, make sure the markup agrees with the visible page. Treat schema as a consistency and interpretation layer, not as proof of a direct Meta AI ranking lever. Perfect markup cannot repair vague copy, unsupported claims or conflicting brand information.

    Give each Meta surface a distinct content job

    Your brand can be encountered across Instagram, Facebook and the Meta AI chatbot. The factual spine should remain consistent, but the content unit that earns attention in a feed isn’t necessarily the one that resolves a detailed question.

    ContextPrimary content jobWhat to prepareFailure to catch
    InstagramMake the brand and its proof recognizable in a visual settingVisual demonstrations supported by captions that name the product, audience, use case and evidenced benefitThe content looks polished, but a new viewer cannot tell what is offered or for whom
    FacebookCarry fuller explanations, current business context and practical detailsMaintained profile information, clear explainers, question-led updates and links to canonical evidenceAn old description, link or offer conflicts with the current website
    Meta AI chatbotResolve a user’s question with an accurate brand representationDirect, self-contained answers and verifiable supporting pages for the prompts that matterThe brand is absent, placed in the wrong category, described inaccurately or mentioned without support
    Owned websiteAct as the canonical evidence layerStable brand facts, focused answer pages, clear ownership and aligned structured data where usedSocial claims have no durable destination where a person can verify them

    On Instagram, don’t force every caption to become a miniature landing page. Give the visual one clear proof job, then use the caption to identify what is being shown and why it matters. If the post demonstrates a workflow, name the workflow. If it shows a result, state what produced the result and avoid implying that one example is universal.

    On Facebook, use the room available to answer the questions that arise after initial interest: who the offer is for, what the process involves, where it is available and which conditions apply. Keep profile-level facts especially clean because they frame everything published beneath them.

    For chatbot visibility, work backward from the prompt. If someone asks for options in a category, can your public content connect the brand to that category without interpretation? If someone asks whether the offer fits a constraint, is the condition stated explicitly? If someone asks why the brand is credible, can they reach evidence rather than another assertion?

    Don’t clone every asset across every surface. Preserve the names, categories, claims and proof, then change the delivery. Instagram may demonstrate the claim, Facebook may explain its context and the website may hold the complete evidence. The message should become richer as the user needs more detail, not mutate into a different brand story.

    Audit prompts, diagnose the gap and fix it in order

    A laptop with a blank conversational interface sits beside organized brand evidence trays, while a magnifying glass highlights a broken connection in a chain of glowing nodes.

    AI visibility cannot be managed from a single screenshot. Wording and context can change an answer, so save the exact prompts you use and repeat them under comparable conditions. The goal isn’t to manufacture a universal score. It is to notice persistent omissions, factual errors and unsupported representations.

    Build the audit from your visibility brief. Include unbranded discovery questions, fit questions, comparison questions, brand-validation questions and action questions. Avoid leading every prompt with your desired answer. A test such as “Why is [Brand] the best option?” presupposes both inclusion and superiority; it tells you little about natural discovery.

    For every run, record:

    • The exact prompt and the user intent it represents.
    • The surface and testing context.
    • Whether the brand appeared without being named in the prompt.
    • Whether its category, audience, offer and location were correct.
    • Which material claim was present, missing or wrong.
    • Whether evidence or a useful path was surfaced, when the interface provided one.
    • Which controlled page or Meta asset should resolve the gap.
    • What you changed before the next comparable test.

    Use descriptive states instead of fake precision: absent, mentioned, accurately represented, supported and actionable. A brand can move through those states without becoming the first name in an answer. That movement still matters because correct representation is a prerequisite for trustworthy discovery.

    Read each pattern as a diagnostic hypothesis, not as proof of a hidden ranking factor:

    • Absent from unbranded prompts: Check whether your content explicitly connects the brand to the category, problem, audience and market in question.
    • Mentioned in the wrong category: Look for outdated bios, vague slogans, legacy pages and inconsistent third-party descriptions.
    • Correctly described but unsupported: Strengthen the evidence destination and connect relevant social claims to it.
    • Visible for the brand name but not the problem: Build content around the user’s situation instead of publishing more brand announcements.
    • Visible on a Meta profile but inaccurate in an answer: Compare prominent profile facts with the canonical website record and remove contradictions you control.
    • Accurate but not actionable: Replace generic links with a destination that matches the prompt’s intent.

    Fix gaps in a deliberate order. Accuracy comes first because additional distribution can spread an error. Resolve conflicting identity facts next. Then add the missing answer and evidence. Adapt it to the relevant Meta surface after the canonical version is sound. Amplification belongs at the end.

    1. Correct factual errors and potentially misleading claims.
    2. Align the canonical brand record across controlled properties.
    3. Create or improve the answer and its supporting evidence.
    4. Package the material for the relevant Meta context.
    5. Retest the same prompt before expanding the change.
    6. Apply the lesson to the next high-value query.

    Change one meaningful layer at a time when you want to learn from the result. If you rewrite the website, replace every profile description and launch a large campaign simultaneously, you may improve visibility but won’t know which gap mattered. Keep a simple change log tied to the prompt set.

    Key takeaways

    • Meta AI visibility is query-specific; define the user question and the acceptable answer before measuring it.
    • A stable brand record matters more than repeating identical promotional copy across channels.
    • Answer-ready content pairs a direct claim with scope, evidence, boundaries and a relevant next step.
    • Instagram, Facebook, the chatbot context and your website should perform different jobs while preserving the same facts.
    • Track absence, accuracy, support and actionability separately so you can fix the actual weakness.
    • Treat audit patterns as clues to investigate, not as proof that you have discovered Meta AI’s internal ranking formula.

    Start with the unbranded question that matters most to your next customer. Write the canonical answer, align the brand facts around it, publish evidence that can be checked and record a baseline response. Once that question is represented accurately, move to the next one. You will be building a maintainable visibility system rather than another stream of disconnected content.

    References

  • How Effective Are Meta Reels Ads? A Practical Testing Guide

    How Effective Are Meta Reels Ads? A Practical Testing Guide

    If your Reels ads attract views but produce weak sales or brand lift, do not assume the placement is the problem. A video can satisfy the 9:16 specification and still feel like an ad borrowed from another channel, complete with slow pacing, dominant branding, and a message that arrives after the viewer has swiped away.

    Reels can be effective, but the useful answer is more specific: results improve when the creative is built around the product, benefit, sound, pace, and visual language of Reels. The strongest reported relationship was a 5.3x lift in purchase intent when direct-response ads supplied product context through benefits, features, or a clear unique selling proposition. That is a reason to test contextual creative, not a promise of 5.3x more sales.

    What “effective” means in the Reels evidence

    Meta supplied the underlying advertiser analysis, so its findings should be treated as directional vendor evidence. They identify creative characteristics associated with stronger purchase-intent and brand-interest rankings. They do not establish that one editing choice will cause the same lift in every account, audience, category, or campaign.

    Purchase intent is also a proxy, not a completed transaction. It can help you identify whether an ad changed how people feel about an offer, but it does not account for price, landing-page friction, inventory, sales follow-up, or whether the platform received credit for a purchase that would have happened anyway. Your final judgment still has to come from the business outcome the campaign was meant to create.

    Key takeaways

    • Reels-native creative means more than cropping an existing video vertically. It requires faster storytelling, platform-appropriate sound, and a message designed for a swipe-driven viewing environment.
    • Brand campaigns and direct-response campaigns need different branding patterns. Early, repeated branding can support brand objectives, while sales-oriented creative benefits from giving the product and proposition more screen time.
    • Speech and music work well together, but the core message should also be visible. The viewer should not need one particular audio setting to understand the offer.
    • The reported multipliers are separate associations. They cannot be added or multiplied to forecast the result of combining every tactic.
    • A/B testing can identify the better creative version. Incrementality testing is needed when you want to know whether the advertising created additional results.

    Match the creative rules to the campaign’s real job

    The apparent contradiction in Reels advice is that branding should sometimes appear early and often, yet sometimes occupy less than a quarter of the ad. Both can be sensible. The right treatment depends on whether you are trying to build memory for the brand or prompt a response to a product.

    For brand campaigns, make the advertiser recognizable

    • Introduce the brand within five seconds. Early branding was associated with a 1.7x improvement in the likelihood of reaching top purchase-intent performance. Use a product, name, visual identity, or spoken reference that fits the scene instead of interrupting it with a long logo animation.
    • Let the brand reappear. Multiple brand appearances were associated with a 1.8x improvement in top-tier purchase intent. Repetition can come from packaging, product use, a creator mentioning the name, or a closing frame; it does not require a permanent logo covering the video.
    • Combine speech with music. That pairing made brand ads twice as likely to reach the top 20% for brand interest. Music establishes rhythm, while speech carries meaning. Neither should make the other difficult to follow.
    • Carry the proposition in two channels. Presenting a message visually and audibly was associated with 1.8x stronger brand-interest performance. Put the essential claim on screen when it is spoken rather than relying on decorative text.
    • Place the brand in a believable moment. Everyday, slice-of-life situations were associated with a 1.5x lift in purchase intent. Choose a situation in which the product would naturally be used; relatability cannot rescue a scene with no connection to the offer.

    The practical rule is to make the brand identifiable without making every frame behave like a title card. If viewers remember the scenario but cannot name the advertiser, the creative was under-branded. If the brand treatment prevents the scenario from feeling natural, it was over-engineered.

    For direct response, give the product most of the attention

    • Show the product more than once. Multiple product appearances were associated with a 2.7x lift in purchase intent. An opening use case, a closer view in the middle, and a recognizable closing shot can each do a different job.
    • Keep explicit branding below 25% of the runtime. This pattern was associated with a 4.8x purchase-intent lift for direct-response creative. It does not mean hiding the advertiser. It means preventing logos and branded frames from displacing the demonstration, benefit, or reason to act.
    • Explain why the product matters. Benefits, features, and unique selling propositions produced the strongest reported relationship, at 5.3x higher purchase intent. Do not merely display an attractive object. Connect what the viewer sees to a problem, use case, or meaningful difference.
    • Make the call to action visible and audible. Using both channels was associated with a 1.9x lift in purchase intent. The action should match the destination: a pricing page, product page, lead form, or booking flow needs a correspondingly precise instruction.
    • Use a combined audio-visual hook. A hook that could be seen and heard was associated with 1.5x higher purchase intent. Open with the tension, outcome, product action, or useful question rather than an introduction that delays the point.
    • Use native elements only when they clarify tone or meaning. Emojis were associated with 2.5x stronger ranking performance for direct-response ads. An emoji can reinforce an emotion or label a step, but scattering them across an otherwise conventional commercial will not make it native.

    These relationships are not a recipe whose ingredients automatically stack. A Reel with five product shots, repeated logos, speech, music, captions, emojis, several benefits, and two calls to action can become less understandable, not more persuasive. Start with one proposition and use each element to make that proposition easier to notice or believe.

    Turn the findings into a workable Reels storyboard

    Six vertical storyboard cards on a desk show a product reveal, demonstration, benefit, reaction, and final product-use scenes without written notes.

    A useful creative brief should fit into one sentence: this audience should take this action because this product delivers this specific benefit. If the sentence contains several audiences, actions, or benefits, split the concept before writing the script.

    1. Open on the reason to keep watching. Pair an immediate visual with a spoken or on-screen idea. A brand campaign can establish the brand during this opening. A direct-response campaign should usually lead with the product, problem, outcome, or benefit.
    2. Show the product doing its job. Repeat the product only when each appearance contributes something new: context, operation, detail, scale, result, or recognition. Reusing the same beauty shot does not add information.
    3. State the proposition in speech and on screen. Keep the visual wording short enough to read while the scene moves. It should preserve the central meaning of the spoken line, not transcribe every word or compete with the product.
    4. Add music as structure. Choose music that supports the pacing and leaves room for speech. If removing the music makes the idea collapse, the concept may be relying on atmosphere instead of a persuasive message.
    5. Plan branding according to the objective. For brand building, place recognizable cues early and return to them naturally. For direct response, keep the advertiser identifiable while reserving most of the runtime for the offer, demonstration, and benefit.
    6. End with one action. Show it, say it, and make sure the landing experience completes the same thought. A Reel promising a particular benefit should not send the viewer to a generic home page where that benefit is difficult to find.

    Review the storyboard once with sound and once without it. In the sound-on review, check whether speech and music are balanced. In the silent review, check whether the product, proposition, brand, and action remain understandable. This is not an argument for making sound optional; it is a way to ensure that the visual and audio channels support each other instead of carrying two unrelated messages.

    Test whether stronger creative produces stronger business results

    Two matched smartphone filming setups compare a static distant product ad with a close, energetic product demonstration under controlled studio conditions.

    The right question is not whether Reels works in general. It is whether a defined Reels treatment creates more of your intended outcome than the realistic alternative. That comparison might be a native Reel against your adapted video, an early product demonstration against a slower reveal, or a benefit-led script against a product-only montage.

    1. Define the decision before launching. Name the primary result that will determine the winner. Use a brand metric for a brand question and a qualified lead, purchase, or other business outcome for a response campaign.
    2. Change one meaningful variable. If one version changes the hook, music, product shots, branding, copy, and call to action at the same time, you may find a winner but will not know why it won.
    3. Hold the surrounding conditions steady. Keep the audience, offer, destination, placement conditions, and campaign objective comparable so that the creative difference remains interpretable.
    4. Set the test window and decision rule in advance. Do not end a test simply because one version leads during an early fluctuation. Wait for the planned test to finish, then apply the same winner criterion you chose before seeing the result.
    5. Record what lost as carefully as what won. Note the hypothesis, exact variation, primary result, and important secondary signals. This prevents the next production cycle from repeating an old test under a new filename.
    6. Use incrementality when the spending decision warrants it. An A/B creative test tells you which version performed better under the test conditions. Incrementality measurement asks whether advertising caused additional outcomes rather than receiving attribution for behavior that would have occurred anyway.

    Do not promote a Reel to the main budget solely because it earned inexpensive views, strong reactions, or a high purchase-intent score. Those signals can diagnose attention and persuasion, but the campaign still has to clear the outcome that matters to the business. Conversely, a weak first test does not prove that the placement is ineffective if the ad was a repurposed asset that never tested the native treatment in question.

    Avoid the conclusions the numbers cannot support

    • “A 5.3x intent lift means 5.3x revenue.” Intent is not revenue. Treat it as evidence that a proposition may be more persuasive, then verify the effect against completed business outcomes.
    • “Every reported tactic should go into every ad.” The relationships were measured separately and are not additive. Too many devices can obscure the single message a short video needs to communicate.
    • “Branding below 25% is a universal rule.” That finding applies to the direct-response analysis. Brand-oriented creative benefited from early and repeated recognition, so copy the rule that matches the campaign job.
    • “Native means casual, improvised, or disguised.” Native creative follows the format’s visual, audio, and storytelling grammar. It can still be carefully scripted, accurately branded, and unmistakably commercial.
    • “A vertical crop is a Reels strategy.” Aspect ratio is only the container. The hook, pacing, product visibility, sound design, benefit, and call to action determine whether the idea actually belongs in that container.

    For your next production cycle, make one Reels-native version and keep the current creative as the control. If the objective is direct response, benefit context is the strongest first variable to test. If the objective is brand building, start with early, repeated recognition that remains part of the scene. Predefine the outcome, run the comparison, and validate incremental impact before moving a meaningful share of budget. That will tell you far more about Reels effectiveness than a general platform benchmark ever could.

    References