Tag: Performance

  • Unlock the Power of GSC’s Branded Query Filter for SEO Success

    Unlock the Power of GSC’s Branded Query Filter for SEO Success

    I recently delved into Google Search Console’s branded query filter, which has become a game-changer for SEO reporting. This feature now allows me to track brand awareness, diagnose performance drops, and truly measure the impact of my SEO efforts.

    In November 2025, Google introduced a solution to a long-standing SEO challenge: the ability to distinguish branded from non-branded search performance directly within Google Search Console (GSC). The rollout is now complete for eligible properties, and I was ecstatic to try it out.

    For so long, I’ve had to rely on regex filters, custom dashboards, or third-party tools, which weren’t always reliable. But GSC’s branded query filter simplifies the process, positioning it as a native feature in a platform widely used for organic reporting.

    ```json
{
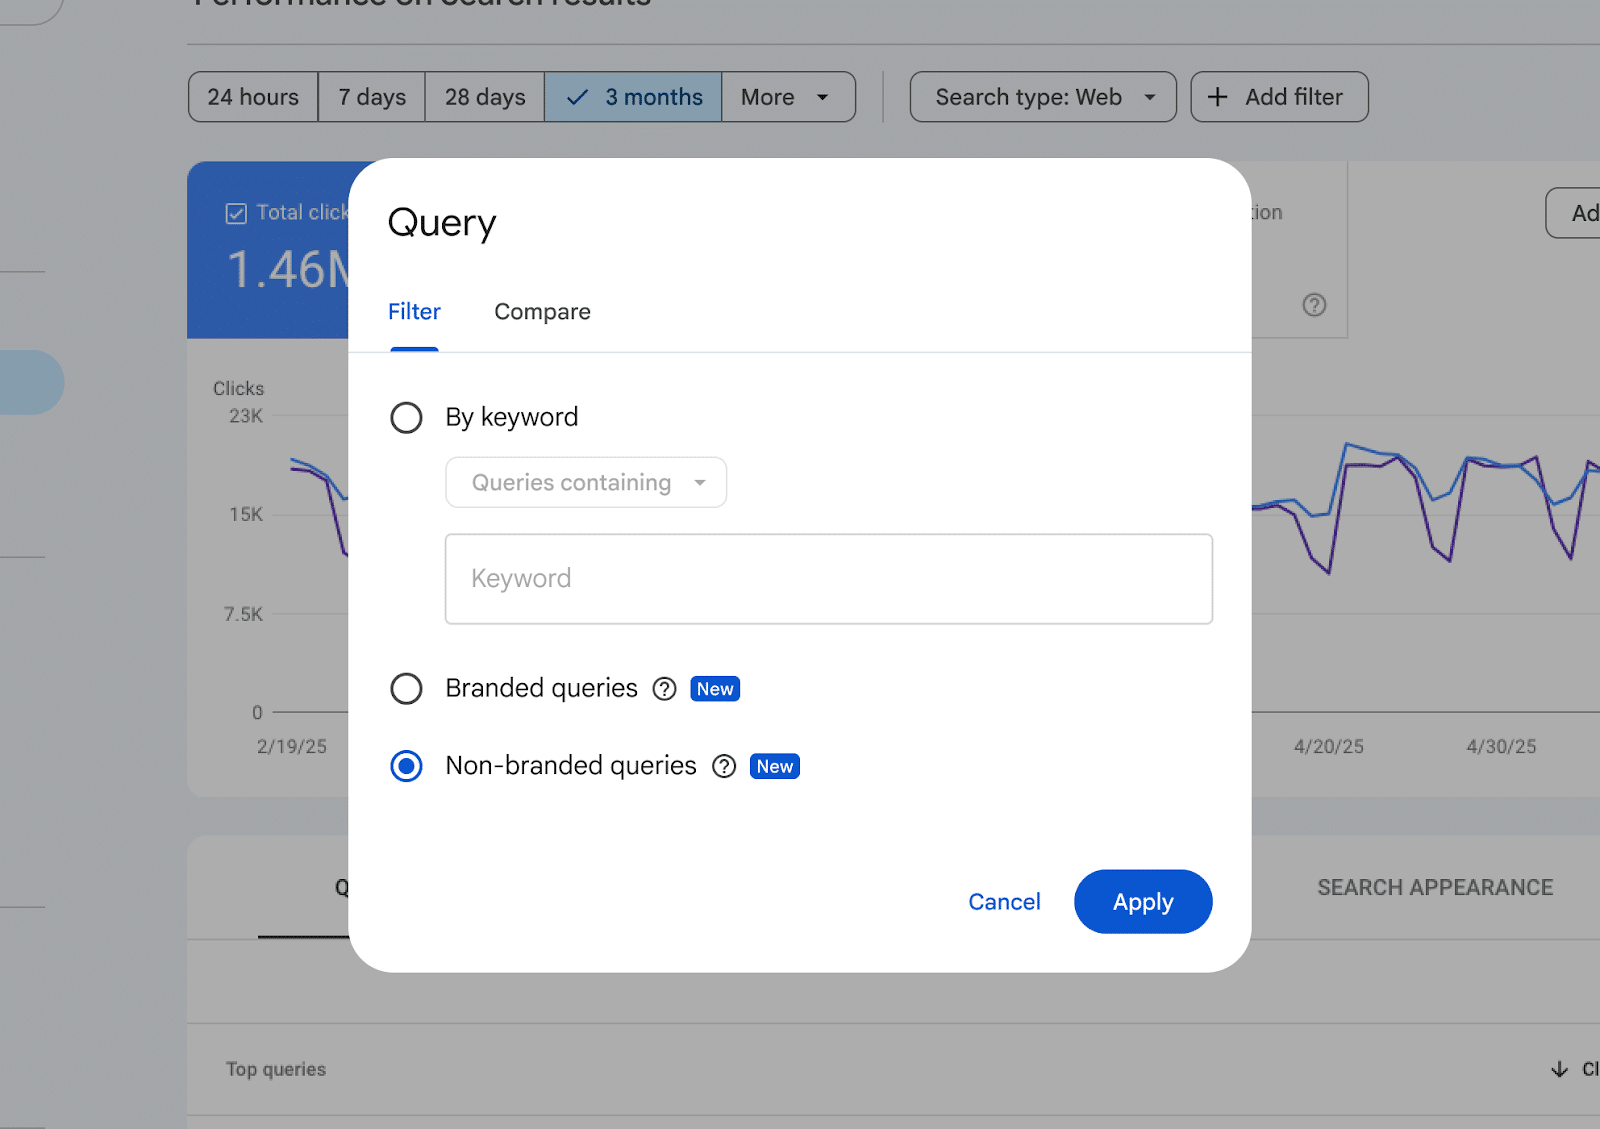
  "alt": "Search query filter options in a web analytics tool showing filters by keyword and query type.",
  "caption": "Explore search query trends with detailed filters: select by keyword or focus on branded versus non-branded queries for insightful analysis.",
  "description": "The image displays a query filter interface in a web analytics tool, featuring options to filter by keyword and prioritize either branded or non-branded queries. The interface is overlaid on a chart displaying click data over time, illustrating performance metrics for search results. Keywords: web analytics, search queries, data filtering."
}
```

    This change makes it easier for me to close a crucial gap in SEO reporting. Now, I can independently evaluate brand demand and discovery, leading to improved performance analysis supported by first-party data.

    In essence, GSC’s new filter performs its function by sorting queries into two categories:

    ```json
{
  "alt": "The CapmatchOne logo with a gradient circle and bold text.",
  "caption": "Discover innovation with the CapmatchOne logo, featuring sleek typography and a modern gradient circle.",
  "description": "The CapmatchOne logo features bold, modern typography coupled with a gradient circle, symbolizing connection and innovation. The sleek design conveys a sense of progress and creativity. This image can be used for branding or promotional purposes, appealing to audiences interested in innovative solutions and forward-thinking designs."
}
```
    • Branded queries that include recognized brand terms.
    • Non-branded queries covering all other discovery queries.

    This filter is accessible directly via:

    ```json
{
  "alt": "Line graph and analytics showing changes in clicks, impressions, CTR, and position over time.",
  "caption": "Diving into the data: This graph reveals key changes in clicks, impressions, CTR, and average position over the last three months compared to last year.",
  "description": "The image displays a line graph depicting trends in total clicks, impressions, CTR, and average position. The graph compares the last three months to the same period last year, highlighting a 31.74% decrease in clicks and a 32.72% decline in CTR. Impressions show a slight increase of 1.42%. Keywords: analytics, data visualization, SEO metrics."
}
```
    • Performance > Search results > + Add filter > Query.
    • Query groups.
    • API-accessible data exports.

    These features empower me to group queries by topic or intent, filter by branded and non-branded types, and create detailed reports without external processing.

    ```json
{
  "alt": "Graph showing interest over time with fluctuating blue line and descending green trend line from 2024 to 2026 in the US.",
  "caption": "Dive into the trend: This graph illustrates the ups and downs of interest from 2024 to 2026, showing a notable decline overall despite several peaks.",
  "description": "This image depicts a line graph representing interest over time from October 2024 to January 2026 in the United States. A blue line captures the fluctuating interest levels, with notable peaks in early and late 2025. Meanwhile, a green arrowed line indicates an overall downward trend. The graph provides an insightful visual representation of interest dynamics during this period, reflecting both temporary spikes and a general decline."
}
```

    Historically, separating branded from non-branded performance wasn’t new but maintaining consistency was challenging. I used to manually segment with regex, keyword tagging in rank-tracking tools, or through custom dashboards.

    These methods worked but were fragile. Common issues included character limits on regex, language variants for international sites, and no shared standard for branded terms. With GSC’s update, I find these challenges largely eliminated.

    ```json
{
  "alt": "Line graph comparing branded and non-branded CTR over time, showing notable variance from October 2025 to January 2026.",
  "caption": "Exploring the dynamics of branded versus non-branded CTR, this graph reveals intriguing trends from late 2025 into 2026.",
  "description": "This line graph illustrates the comparison between branded and non-branded click-through rates (CTR) over a period from October 2025 to early January 2026. The vertical axis represents the percentage of CTR, ranging from 0% to 25%, while the horizontal axis shows the timeline. The graph demonstrates fluctuating rates, with branded CTR peaking notably around early 2026, while non-branded CTR remains relatively steady and low throughout the period. This visualization provides insights into the effectiveness of brand recognition on digital engagement metrics. Keywords: Branded CTR, Non-Branded CTR, Click-Through Rate, Digital Marketing Analytics."
}
```

    Branded traffic is crucial, being both a signal of brand awareness and a major source of conversions. However, when mixed with non-branded data, it skews the interpretation of SEO performance.

    By segmenting this data, I can now accurately identify brand demand versus discovery, allowing clearer insights. This helps me to better understand what’s genuinely boosting performance and address key questions like:

    ```json
{
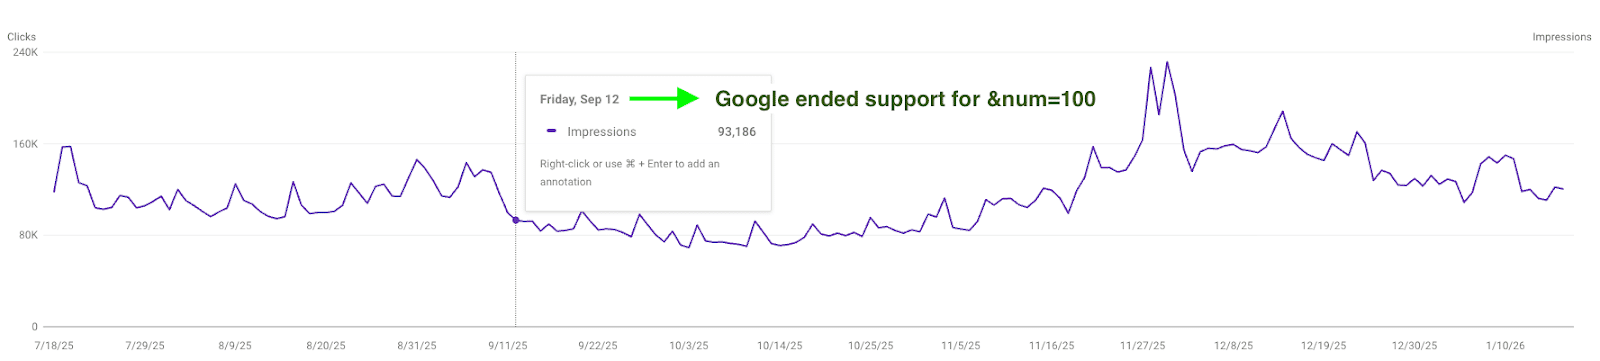
  "alt": "Line graph showing impressions over six months with a note about Google ending support for &num=100 on September 12.",
  "caption": "A dynamic graph illustrating search impressions over time, noting Google's change in support, influencing trends.",
  "description": "This image features a line graph depicting the number of impressions over a six-month period. It includes an annotation on September 12, highlighting Google's end of support for &num=100. The graph shows a fluctuating trend with notable spikes, marked by a vertical guide at the annotation point. Useful for observing impact on search performance metrics."
}
```
    • Are we enhancing brand demand or expanding non-branded reach?
    • Is our content strategy bolstering non-branded visibility?
    • Is the current strategy effective as anticipated?

    Having used the filter, branded search trends have become one of the clearest indicators of brand health. Monitoring these trends reveals gaps and provides opportunities across various channels.

    This functionality isn’t just a feature; it signifies a paradigm shift in SEO measurement. The consistency it brings to branded versus non-branded reporting is transforming how SEO work gets done, making reporting more consistent and actionable.

    As I continue to evaluate and use these insights, I find that adopting this feature means less time spent reconciling data and more focus on interpreting results. This results in more confident and consistent communication, ultimately driving greater impact.


    Inspired by this post on Search Engine Land.


    crushpress.ai community screenshot
  • Master Meta Ads: Analyze KPIs for Growth Beyond Metrics

    Master Meta Ads: Analyze KPIs for Growth Beyond Metrics

    Every week, I join thousands of other media buyers in the same ritual. We open the Meta Ads Manager, eyes scanning the metrics, striving to identify the winning and losing campaigns. A positive ROAS gives us a sense of contentment, while a negative one sends us scrabbling to disable the underperforming asset. This is where many advertisers find themselves trapped in the scoreboard mentality.

    By treating metrics as a mere scoreboard, I only see the final outcome, missing the bigger picture that could guide future improvements. It’s like judging a game’s score without considering that my strikers aren’t receiving any passes from the midfield.

    If I want to scale performance, it’s crucial to transition from mere reporting to diagnosing. By viewing metrics both as individual KPIs and as parts of an interdependent system, I can uncover the real narrative within my account and make informed optimization decisions.

    The Dashboard Illusion

    Meta’s interface, with its linear grid format, can sometimes give a false sense of clarity. While one column points at high CPM as an issue, another blames low CTR. In reality, these metrics are often connected, revealing much deeper insights.

    A high CPM might not necessarily mean an expensive audience. Instead, it could indicate that my creative isn’t up to par, prompting Meta to charge more due to a subpar user experience.

    On the flip side, while a high CTR seems like a win initially, if my CVR is declining, then it’s not really a victory. I find myself paying for high-intent customers that my landing page fails to convert.

    The dashboard might tell me what happened, but understanding the system explains why.

    A visual of an example of Meta Ads Manager CTR and CPM reporting columns.
    A visual of an example of Meta Ads Manager CTR and CPM reporting columns.

    Dig deeper: Inside Meta’s AI-driven advertising system: How Andromeda and GEM work together

    ```json
{
  "alt": "Table showing advertising data with metrics like amount spent, impressions, and link clicks.",
  "caption": "Dive into advertising performance metrics with detailed data on spending, impressions, and clicks to optimize your campaigns effectively.",
  "description": "This image shows a table containing advertising performance metrics. The columns include 'Amount Spent', 'Impressions', 'Link Clicks', 'CTR', 'CPC', and 'CPM'. Each row provides specific data points, such as dollars spent and number of impressions achieved, offering insights into the efficiency of advertisement spending. Keywords: advertising data, performance metrics, marketing analytics."
}
```

    The Team Metrics Framework

    To better comprehend the system, I visualize metrics as parts of a sports team. Each player has a unique role. If the team loses, I don’t bench them all. Instead, I review the plays to identify areas for improvement in the next game.

    The Scouts: CPM and Reach

    CPM acts as feedback from the auction on my total value, combining my bid, estimated action rates, and user value. Together, they play the role of market resonance.

    If I notice a spike in CPM compared to historical averages, these metrics hint at an overly crowded market or my creative’s ineffectiveness in maintaining volume.

    The Midfielders: CTR and Hook Rate

    Their role emphasizes moving the engagement from Meta’s ad placement to my website. A high hook rate but low CTR shows my ad snags attention but falters in driving clicks. It effectively stops the scroll, but people aren’t compelled to click.

    The Strikers: CVR and AOV

    Representing the final journey step, they depend on my website. A high CTR and low CPC, yet a low ROAS, indicate issues. Although my ad performed well, my landing page or offer didn’t convert the visitors.

    Dig deeper: Rethinking Meta Ads AI: Best practices for better results

    Diagnosing System Gaps

    The real analysis occurs between the columns displayed in Ads Manager.

    ```json
{
  "alt": "The CapmatchOne logo with a gradient circle and bold text.",
  "caption": "Discover innovation with the CapmatchOne logo, featuring sleek typography and a modern gradient circle.",
  "description": "The CapmatchOne logo features bold, modern typography coupled with a gradient circle, symbolizing connection and innovation. The sleek design conveys a sense of progress and creativity. This image can be used for branding or promotional purposes, appealing to audiences interested in innovative solutions and forward-thinking designs."
}
```

    Hook vs. Hold Rates

    By examining the ratio between hook and hold rates, I can prevent creative fatigue that impacts ROAS.

    • If my ad has a high hook rate but low hold rate, it captures attention initially but rapidly loses it. This suggests I should enhance the latter part of the ad with a compelling CTA.
    • If I observe a low hook rate but a high hold rate, most people disengage early, although those who engage tend to convert. This scenario presents a chance to test new hooks that align with the rest of the video, aiming to boost initial engagement and conversions.

    Link Clicks vs. Landing Page Views

    The discrepancy between these metrics often goes unnoticed. Out of 1,000 clicks, if only 450 landing page views are recorded, there may be a technical issue. It’s essential to check my page speed and ensure my tracking functions properly.

    Such a drop isn’t typically due to a creative problem but likely a slow server issue since people expect quick site loading times, and any delay results in bounces, wasting my budget.

    CPA vs. Frequency

    If increasing CPA is baffling, I should examine the frequency. A rise in both suggests ad fatigue among my audience.

    An exhausted audience and system require fresh input, not just increased bids or budgets. I should refresh my creative assets or expand targeting if it’s too narrow.

    A visual of an example of Meta Ads Manager reporting columns.
    A visual of an example of Meta Ads Manager reporting columns.

    Dig deeper: Meta Ads for lead gen: What you need to know


    From Reporting to Diagnosing

    When I encounter an underperforming campaign or creative, I ask myself:

    ```json
{
  "alt": "Table showing video engagement metrics including hook rate, video plays, ThruPlays, ThruPlay rate, and frequency.",
  "caption": "Dive into this fascinating breakdown of video engagement rates, from hook rate to ThruPlays. A compelling look at how viewers interact with video content.",
  "description": "This image displays a table summarizing video engagement metrics. Columns include Hook Rate, 3-second video plays, ThruPlays, ThruPlay Rate, and Frequency, with sortable arrows indicated. Each row presents different numeric values, offering insights into how videos are performing in terms of initial engagement and viewer retention. Ideal for analyzing viewer behavior and optimizing video content strategies."
}
```
    • Is volume constant? Have impressions or spend decreased? This might indicate the system devaluing or rejecting my ad, especially the creative component.
    • Where is the friction occurring? I trace it across hook rate, CTR, and CVR.

    Upon identifying the bottleneck, I focus on altering only that variable. Changing multiple elements simultaneously obscures the actual issue. For example, if CVR is low, I focus on the landing page experience, not the ad itself.

    Am I directing traffic to a detailed product page while promoting various products in a single creative? It’s crucial to eliminate this friction by creating a product collection landing page, offering an intuitive experience for all interests once they click.

    Becoming a Media Architect

    With Meta’s AI guiding targeting, my role evolves into a system architect.

    While a scoreboard highlights something isn’t winning, a system map unravels the full narrative, such as slow site speeds affecting ROAS or creative appealing to the wrong audience.

    Next time I check my account, I’ll resist the urge to immediately glance at the ROAS column. Instead, by focusing on ratios and tracing the user’s journey, I’ll unlock the story from ad to website. Shifting focus from winners to detecting friction points is the key to engineering substantial growth.

    Dig deeper: 4 Facebook ad templates that still work in 2026 (with real examples)


    Inspired by this post on Search Engine Land.


    crushpress.ai community screenshot
  • Mastering Fresh Content: Stand Out in an AI-Driven World

    Mastering Fresh Content: Stand Out in an AI-Driven World

    I’ve come to realize that AI has dramatically simplified the publishing process, but it also means standing out amidst the noise is increasingly challenging. The good news is, by focusing on clarity, intent alignment, and a few strategic SEO adjustments, we can make significant progress.

    As AI breaks down the barriers to production, the web is getting flooded with content that is polished, optimized, but often lacks distinctiveness. When everything seems competent, you and I must strive harder to differentiate our voices.

    Though AI has transformed how content is churned out, the core of what users seek—intent—remains unchanged. They sift through headlines and descriptions, rewarding clarity and effectiveness. This is why foundational elements matter even more now.

    I find that keeping content fresh isn’t about being novel for novelty’s sake. It’s about diving back into what makes content truly unique: distinct messaging, structured delivery, and a deep grasp of our audience’s needs.

    The Real Problem with AI Content

    The crux of the issue with AI-generated content isn’t its factualness—it’s its sameness. AI draws from vast pools of existing content, often reproducing unremarkable tropes and conclusions. Individually, they seem fine; collectively, they’re indistinguishable.

    This homogeneity is why so much content today feels the same. Even when relevant, it seldom provides a unique reading experience.

    Both users and search engines are responding in kind. In a sea of similar content, differentiation becomes key. At this juncture, originality, specificity, and intent alignment have taken on heightened importance.

    Ironically enough, AI has increased the value of originality. As automated content inundates the web, signals like clarity, usefulness, and intent alignment become beacons of high-quality content.

    Many teams falter here, competing with AI by focusing on quantity over quality. Freshness isn’t about novelty; it’s about crafting content that feels distinctly human and undeniably helpful.

    ```json
{
  "alt": "The CapmatchOne logo with a gradient circle and bold text.",
  "caption": "Discover innovation with the CapmatchOne logo, featuring sleek typography and a modern gradient circle.",
  "description": "The CapmatchOne logo features bold, modern typography coupled with a gradient circle, symbolizing connection and innovation. The sleek design conveys a sense of progress and creativity. This image can be used for branding or promotional purposes, appealing to audiences interested in innovative solutions and forward-thinking designs."
}
```

    Fresh, Unique Content is Still Built on Classic SEO Principles

    Ever since content creation tools evolved, what’s been constant is how people interact with search engines. Users still show up with an issue to solve, skimming through results to pick what seems most relevant.

    Despite the rise of AI, this behavior endures.

    Page titles, headings, and meta descriptions serve as that crucial first contact with the user. They function almost like ad copy, contrary to assumptions that these elements are becoming obsolete.

    Classic SEO principles—clear search intent alignment, descriptive language, organized structure—continue to underpin fresh content.

    Although these aren’t groundbreaking ideas, their importance has surged. A tweak in clarity doesn’t just help search engines index a page; it helps users find answers to their questions.

    Small SEO Changes Can Lead to a Strong Impact

    A recent experiment on my website examined whether more descriptive titles could boost clicks without altering the underlying content. We tested the hypothesis by aligning page titles more closely with search intent and user needs.

    The result? A greater alignment led to a substantial increase in click-through rates, proving that small changes can powerfully impact visibility and engagement.

    Strategies for Keeping Content Fresh in an AI-Saturated World

    Remaining fresh in the AI era isn’t about jumping on every new tool but requires intentionality in creating, positioning, and maintaining content.

    ```json
{
  "alt": "Spreadsheet showing SEO service titles, metrics like clicks, impressions, and percentage changes in performance.",
  "caption": "Exploring the Impact: Test results of various SEO service titles reveal significant changes in clicks, impressions, and average position post-implementation.",
  "description": "This image displays a spreadsheet that tracks the performance of different SEO service titles. Columns include 'Current Title', 'Test Title', 'Implemented Date', 'Clicks', 'Impressions', and 'Avg. Position'. Each row represents a specific service, with measured metric changes after applying test titles. Key data points include variations in percentage changes for clicks, impressions, and average position, indicating the effectiveness of new titles. This information can aid in optimizing SEO strategies."
}
```

    1. Treat Intent as Strategy

    The essence of SEO has always been search intent, not keyword stuffing. Before crafting content, ask what problem the searcher is trying to address and what a good answer would look like in their context.

    2. Use Page Titles and Headlines as Tools

    In a crowded SERP, an effective title is crucial to catch a user’s attention and make them click.

    3. Refresh Before You Create

    Oft-overlooked is the power of improving existing content. You don’t need to produce new content incessantly when updates can achieve better results.

    4. Lean into Specificity and Constraints

    While AI excels at general advice, human-guided content shines through specificity and context, offering expert insights and breaking down misconceptions.

    5. Use AI as an Accelerator

    AI should accelerate tasks that don’t require judgment. Editorial responsibilities still lie with us, ensuring content aligns with our goals.

    6. Measure Freshness by Behavior

    It’s not the volume of content but engagement metrics like time on page and scroll depth that define freshness.

    7. Accept that ‘Traditional’ Doesn’t Mean Outdated

    Mainstays like clarity, structure, and relevance have only gained importance in our AI-driven landscape.

    Why Fresh Content Actually Wins

    While AI has revolutionized content speed and accessibility, truly effective content remains appealing and relevant, aligning with users’ search intent and preferences.


    Inspired by this post on Search Engine Land.


    crushpress.ai community screenshot
  • Discover the Best Shopify Plus Agencies to Elevate Your Business in 2026

    Discover the Best Shopify Plus Agencies to Elevate Your Business in 2026

    Last updated: February 9, 2026

    In our latest report, I’ve dug deep into the world of Shopify Plus agencies to bring you the cream of the crop for 2026. With an exhaustive analysis of 84 agencies globally, my research focused on crucial factors like mastery of the Shopify Plus platform, customer reviews, and unique enterprise capabilities.

    After meticulously evaluating each agency, I honed in on six standout contenders by ranking their abilities in areas such as technical expertise, B2B implementation success, and customer satisfaction rates. Below, I’ve summarized who made the cut and why they shine.

    The Top Shopify Plus Agencies of 2026

    Here, I’m unveiling the top Shopify Plus specialists! This table showcases each expert agency based on a comprehensive assessment of their technical prowess and customer delight.

    RankAgencyShopify Plus Platform MasteryAverage Online Review ScoreEnterprise B2B Implementation Track RecordCustom Development & Integration CapabilitiesClient Retention & Project Success RateAgency Leadership Experience ScoreSpecialty
    1AtwixCertified Shopify Plus Partner4.9180+ enterprise B2B implementationsProprietary Sirius ERP integration platform~96%4.8B2B commerce transformations
    2Eastside CoShopify Plus Partner4.3150+ deploymentsA/B testing specialization~88%4.0Conversion rate optimization for Shopify Plus
    3We Make WebsitesShopify Plus Expert4.8UK market focusHeadless commerce expertise~90%4.3UK headless development
    4Digital SilkShopify Plus Partner4.7120+ projectsBrand design specialization~92%4.8Enterprise fashion brand experiences
    5Studio RotateShopify Plus Partner4.5Australian market leadershipDesign-first approach~75%3.9Australian-style commerce design
    6CharleShopify Plus Partner4.475+ Plus implementationsEuropean boutique focus~78%3.7European design solutions

    Atwix: Leading in Enterprise B2B Commerce

    With over 15 years of experience, Atwix stands as a beacon for B2B eCommerce transformation. Founded by Slava Kravchuk, Atwix leverages its vast Shopify Plus expertise, bringing innovative custom development and integration services to manufacturers and distributors.

    What sets Atwix apart is their ingenious Sirius integration platform, a vital tool that links various enterprise systems with ease, ensuring real-time data accuracy. Their 96% client retention rate is a testament to their ability to offer solutions that scale as businesses expand.

    Location: Chicago, IL

    Established: 2006

    Price Range: $$$$

    Average Review Score: 4.8/5

    Services Offered: Shopify Plus Development, B2B Commerce Solutions, ERP Integration, Custom App Development, Platform Migration

    Summary of Online Reviews
    Clients laud Atwix as “true professionals” providing “quick responses” and “elegant solutions” to complex challenges. Their “deep technical expertise” and proactive management are consistently highlighted.

    Eastside Co: Masters of Conversion Rate Optimization

    At Eastside Co, the name of the game is conversion rate optimization through precise A/B testing strategies. My insights show this agency emphasizes performance metrics, helping brands maximize their growth potential in the Shopify Plus ecosystem.

    Their targeted services benefit direct-to-consumer brands, reflecting their commitment to driving results using data-driven methodologies. Though they excel in conversion, their scope might be too narrow for businesses needing expansive ecommerce solutions.

    Location: Los Angeles, CA

    Established: 2017

    Price Range: $$$

    Average Review Score: 4.3/5

    Services Offered: Conversion Rate Optimization, A/B Testing, Performance Analysis, Custom Checkout Solutions, Analytics Implementation

    Summary of Online Reviews
    Clients commend Eastside Co for their “focus on performance metrics” and systematic approach to achieve “ROI improvements.” Their dedication to analytics stands out, though some mention the need for additional partners for broader projects.

    We Make Websites: Experts in UK Headless Development

    In the UK, We Make Websites is synonymous with expertise in headless commerce and performance optimization. My research indicates their focus on Core Web Vitals and innovative technical practices makes them a powerhouse for UK markets.

    While they are adept at creating high-speed, dynamic experiences, their strategies focus primarily on the UK, which might pose challenges for international companies with more complex needs.

    Location: London, UK

    Established: 2008

    Price Range: $$$$

    Average Review Score: 4.8/5

    Services Offered: Headless Commerce, Performance Optimization, Custom Development, API Integration, Technical SEO

    Summary of Online Reviews
    Clients praise them for their “attention to performance” with “lightning-fast storefronts.” However, their strong UK-centric approach can be challenging for global firms.

    Digital Silk: Crafted for Large-Scale Fashion Brands

    For those in the fashion arena, Digital Silk offers exceptional design-centric Shopify Plus services. Their commitment to aesthetic excellence is ideal for high-end fashion brands focused on stunning visual identity over operational intricacies.

    While their creativity in design sets them apart, their services might not suit businesses looking for robust, functional ecommerce solutions with sophisticated technical requirements.

    Location: New York, NY

    Established: 2013

    Price Range: $$$$

    Average Review Score: 4.7/5

    Services Offered: Brand Design, Shopify Plus Development, Visual Identity, Digital Marketing, UX Design

    Summary of Online Reviews
    Clients appreciate their “design quality” and the ability to craft “experiences” that highlight brands, though some note their focus on aesthetics can sometimes overlook functional needs.

    Studio Rotate: Embodying Australian Commerce Design

    Studio Rotate blends local market knowledge with design prowess to serve the Australian market effectively. My insights reveal their visually compelling solutions cater magnificently to regional audiences.

    While their boutique approach is a boon for Australian brands, it might not match the needs of international or large enterprises seeking extensive capabilities and scalability.

    Location: Melbourne, Australia

    Established: 2016

    Price Range: $$$

    Average Review Score: 4.5/5

    Services Offered: Shopify Plus Development, Australian Market Focus, Design Direction, User Experience, Local Commerce

    Summary of Online Reviews
    Clients remark on their “deep Australian market knowledge” and ability to craft “local designs.” However, regional focus can limit scalability for international markets.

    Charle: Masters of UK Creative Solutions

    Since 2018, Charle has charmed ambitious UK brands with their creative and performance-driven Shopify Plus development. With a focus on people-first strategies, they’ve built a remote-first culture that encourages innovative collaboration.

    However, while offering captivating creative designs, their capacity to address comprehensive B2B functionality is limited, particularly outside the UK market.

    Location: London & Manchester, UK

    Established: 2018

    Price Range: $$$

    Average Review Score: 4.4/5

    Services Offered: Shopify Plus Development, Creative Design, UK Market Focus, Platform Migration, Brand Development

    Summary of Online Reviews
    Clients describe their experience with Charle as “an absolute dream” due to their “creative approach” and seamless process, though their focus on UK limits global expansion capabilities.

    The Top Shopify Plus Agencies in the US by Specialty

    To aid you further, I’ve classified these exceptional Shopify Plus agencies into specialized categories based on detailed research. This should help you align with partners who resonate with your project goals and growth aspirations.

    Enterprise B2B Commerce Solutions

    1. Atwix
    2. We Make Websites
    3. Digital Silk

    Market-Specific & Regional Development

    1. Studio Rotate
    2. Atwix
    3. We Make Websites

    Design & Performance Optimization

    1. Digital Silk
    2. Atwix
    3. Eastside Co

    Source


    Inspired by this post on First Page Sage Blog.


    crushpress.ai community screenshot
  • Unlocking Paid Media Success: The Real Structural Challenge

    Unlocking Paid Media Success: The Real Structural Challenge

    For years, I’ve been part of countless discussions about paid media, all revolving around the same question: should we focus on building in-house teams or outsource to agencies?

    While this debate is certainly valid, it often overlooks the core issue at hand. The real challenge isn’t where paid media is placed within our organizational chart. Instead, it’s all about how we structure performance leadership.

    Many companies, including the ones I’m familiar with, navigate Google Ads and other paid channels with capable teams, solid budgets, and well-documented best practices. Campaigns are active. Dashboards appear full. We keep optimizing as scheduled. Yet:

    • Results stall. 
    • Pipelines flatten. 
    • Budgets get questioned. 
    • Confidence in paid advertising erodes.

    This is hardly a talent issue. Rather, it’s often a structural one.

    The Plateau Most In-House Teams Eventually Hit

    Across several B2B paid media accounts, ranging from SaaS to service businesses with monthly spends in the five-figure range, I’ve noticed a recurring pattern.

    Performance doesn’t just drop overnight. It slows gradually.

    Campaigns continue running. Costs seem stable. We still gather leads. But growth comes to a halt. Leadership observes motion without gaining insight. Decisions turn reactive. Paid media shifts from a growth engine to a cost center that must justify its existence.

    The gap lies not in effort or execution. Over time, strategy narrows when teams work in isolation.

    Why ‘More Headcount’ Rarely Fixes the Problem

    When performance slows, the immediate response is often to hire more staff. This could be a new specialist, a channel owner, or someone in a more senior position.

    While additional resources might alleviate workload, simply increasing headcount doesn’t usually solve the actual problem. 

    In my experience with in-house teams, three challenges are consistently present:

    1. Tracking and Leadership Visibility

    Often, leadership teams lack a unified and clear view of how paid media impacts pipeline and revenue. The data is out there, but it’s scattered across different platforms, tools, and dashboards. 

    Without strong integrations, even well-executed campaigns operate with weak feedback loops, which limits their potential for improvement.

    2. Structure and Skill Ceiling

    Many teams strive to adhere to proven best practices. The problem isn’t their intent but the context. What works for one company or growth stage can be ineffective, or even detrimental, for another. 

    Without external benchmarks or fresh perspectives, teams struggle to determine what truly applies to our business.

    3. Lack of Systematic Testing

    Daily execution consumes the available capacity. Teams focus on maintaining stability instead of driving performance forward. Testing becomes intimidating despite the fact that real gains usually emerge from the few experiments that succeed.

    Over time, this creates an illusion of optimization: steady activity without significant progress.

    The Same Mistake Happens Before Ads Even Launch

    These structural problems don’t just affect companies already engaged in paid media. They often arise earlier, before the first campaigns even begin.

    In many B2B companies, paid advertising becomes relevant when growth from outbound sales, partnerships, or organic channels begins to slow. 

    Budgets are cautiously allocated. Execution is delegated. Results are expected to spring forth from platform defaults.

    What’s typically missing is strategic ownership:

    • Clear definitions of success that go beyond surface-level metrics
    • Tracking that ties spend to pipeline, not just lead volume
    • A testing roadmap aligned with revenue goals

    Without this foundation, initial results are often disappointing. Budgets are cut. Confidence wanes. Paid media is labeled ineffective before it gets a real chance to show its worth.

    Ironically, this early phase is where an external perspective can have the greatest long-term impact. It’s also the phase when companies are least likely to seek it.

    The Structural Advantage of Outsourced Performance Leadership

    Outsourcing is often seen as a cost-cutting measure or a way to boost execution power. In reality, its major advantage lies in perspective.

    External performance teams work across various accounts, industries, and growth stages. They:

    • Identify patterns earlier. 
    • Recognize when platform recommendations favor spend growth over business outcomes. 
    • Challenge assumptions that internal teams may no longer question.

    That outside view is crucial in areas like tracking architecture, platform integrations, and account structure, where partial adoption of best practices can subtly undermine performance.

    A typical scenario looks like this: 

    • Teams adhere to platform guidance but leave underlying martech gaps unresolved. 
    • Systems fail to communicate effectively. 
    • Optimization signals weaken. 
    • Budget efficiency drops, even though campaigns seem fully compliant.

    When Outsourcing Actually Works — And When It Doesn’t

    Outsourcing isn’t a one-size-fits-all solution. It falters when companies expect external partners to improve performance in isolation, or when strategy and execution exist in separate realms.

    It thrives best as a hybrid model:

    • Internal teams manage execution and business context
    • External experts provide strategic direction, structural adjustments, and continuous challenge

    In this structure, partners don’t replace teams. They elevate them.

    That’s why a specialized Google Ads agency offers the most value when our goal goes beyond running campaigns to transform paid media into a predictable, scalable growth driver.

    A Smarter Model: External Strategy, Internal Execution

    High-performing organizations increasingly separate strategy from execution volume.

    We bring in outside expertise not because something is broken, but because we desire:

    • Objective assessments of performance and structure.
    • Stronger attribution and tracking foundations.
    • Disciplined experimentation frameworks.
    • Clear accountability at the leadership level.

    This method builds momentum before budgets get cut, and not after results decline. It also helps leadership comprehend why paid media performs the way it does, thereby restoring confidence in the channel.

    What High-Performing Companies Do Differently

    Organizations that avoid prolonged plateaus tend to:

    • Consider paid media a system, not a standalone channel.
    • Invest early in clear tracking and robust integrations.
    • Welcome external challenges before performance drops.
    • Accept that most tests will fail, knowing the few successful ones will compound.

    In this context, outsourcing isn’t about cost efficiency. It’s about maintaining strategic acuity as platforms and markets evolve.

    Final Thought

    The in-house versus outsourced debate oversimplifies a deeper question: who owns performance direction, and how often is it challenged?

    As paid media platforms continuously evolve and automate, the companies that sustain growth aren’t those with the largest teams, but those with the clearest perspective.


    Inspired by this post on Search Engine Land.


    crushpress.ai community screenshot
  • Crafting Year-End PPC Reports that Captivate Leadership

    Crafting Year-End PPC Reports that Captivate Leadership

    As the new year arrives, it’s my job to present an end-of-year (EOY) PPC report that truly reflects our performance.

    EOY reports are not merely extended versions of our monthly check-ins. Instead, they cater to a different audience—mainly the leadership team, who need a broader narrative.

    Executed well, these reports set the stage for the upcoming strategies, garnering buy-in and positioning me as a strategic ally rather than just a campaign overseer.

    ```json
{
  "alt": "Collage of colorful charts and graphs including bar graphs, line charts, pie charts, and a world map on white paper.",
  "caption": "Dive into a sea of data with vibrant charts and graphs, showcasing trends, distributions, and insights, ready to tell your story in numbers.",
  "description": "This image features a variety of colorful charts and graphs on white paper, illustrating diverse data sets. The left section shows bar, line, and pie charts, while the central section includes a world map, mixed charts, and a 50% donut chart. To the right is a collection of stacked papers with various graphs and diagrams, ideal for presentations or reports. This assortment aids in visualizing data hierarchies, comparisons, and trends, making it perfect for analytic and business contexts. Keywords: charts, graphs, data visualization, bar graph, pie chart, line chart, world map."
}
```

    Here’s my approach for creating an impactful EOY PPC report that engages leadership and sets us on a successful path for the new year.

    1. Understanding My Audience’s Priorities

    Launching a new campaign without defined goals and target audiences is unheard of, and the same goes for my EOY report.

    ```json
{
  "alt": "2025 Paid Search Performance chart showing revenue of $1.5M, ROAS of 6.1, and cost of $243K compared to 2024 figures.",
  "caption": "2025 marked a significant growth in paid search performance with a revenue of $1.5M and ROAS of 6.1, showing a positive trend over 2024.",
  "description": "The image illustrates the 2025 Paid Search Performance, highlighting a revenue increase to $1.5M, a ROAS of 6.1, and costs of $243K. Compared to 2024, there's a notable improvement with revenue up by 14.4%, ROAS by 7.2%, and a cost increase of 6.7%. This reflects successful strategy adjustments, based on GA4 data, achieving over $1.5 million in sales."
}
```

    This year, my clients include diverse leadership teams—from those new to me wanting concise summary reports, to detail-oriented CEOs desiring a rich narrative.

    Instead of a generic template, I tailor each report to fit the unique needs of each audience, avoiding confusion and maximizing satisfaction.

    ```json
{
  "alt": "Pie chart showing Google Ads 2025 spend breakout with segments for Performance Max, Search, Discovery, Video, Shopping, and Display.",
  "caption": "Unpacking Google Ads 2025 spending: Discover the projected distribution across Performance Max, Search, and other key ad platforms.",
  "description": "This image features a pie chart depicting the projected Google Ads spend distribution for 2025. The chart illustrates allocations: Performance Max (46.7%), Search (35.9%), Discovery (15.7%), with smaller segments for Video, Shopping, and Display. Each segment is linked to a blurred representation of sponsored content, highlighting Google’s strategic ad platform focus. Ideal for understanding future digital ad strategies and budget prioritization."
}
```

    If you’re unsure of your audience, engage your primary contact to better understand the report’s recipients, their focal points, and decision-making goals.

    2. Building a Clear Executive Summary

    My executive summary’s role is to quickly provide leadership with an understanding of our PPC performance.

    ```json
{
  "alt": "Bar graph showing 2025 paid search performance, comparing page views and inquiry forms conversion rates and costs.",
  "caption": "2025’s strategic shift to inquiry forms boosts conversion signals, though tracked conversion rates and costs reflect distinct changes.",
  "description": "This bar graph illustrates the 2025 paid search performance review, highlighting a strategic transition in conversion tracking from page views to inquiry forms in late July. The graph compares the costs per conversion and conversion rates for January to July with inquiry forms from August to December. Key visual elements include a segmented bar chart showcasing conversions over time, color-coded by source: website GA4 and calls from ads. The overall analysis indicates a shift to fewer but higher-value tracked conversions."
}
```

    It’s the gateway that frames everything that follows, and though taught to write it last, I start with it to shape the report’s flow.

    Focusing on Key KPIs

    I prioritize metrics vital to my audience—be it revenue, leads, or conversions—ensuring these are front and center in my summary.

    ```json
{
  "alt": "Line graph showing purchase revenue by channel for 2023-2025, with CPC leading.",
  "caption": "The line graph illustrates the trend in purchase revenue from various channels over 2023-2025, highlighting CPC as the leading source.",
  "description": "This image presents a line graph depicting purchase revenue by channel from January 2023 to October 2025. Channels include CPC, email, organic, none, text, referral, and others. CPC (green line) shows a significant lead over other channels, particularly in peak months. The graph suggests CPC's crucial role in 2025 revenue, accounting for 41% of the total as tracked in GA4. Keywords: purchase revenue, channel, CPC, 2025, line graph."
}
```

    Providing Context with Benchmarks

    By leveraging year-over-year performance, target achievements, and industry benchmarks, I ensure leadership comprehends our standing without needing to guess.

    These benchmarks provide busy executives with an immediate grasp of our performance, priming them for deeper insights and actions to follow.

    ```json
{
  "alt": "Table outlining events impacting ACME's PPC performance, including anvil boom, tariffs, and more.",
  "caption": "Discover how key events like the anvil-throwing boom and new tariffs impacted ACME's PPC performance across different levels.",
  "description": "This table provides an overview of key political, economic, and technological events affecting ACME's PPC performance. Events such as the recreational anvil throwing boom and the tariff increase on steel are highlighted alongside their levels of impact, ranging from high to low. The table details what happened during each event and analyzes the subsequent effects on ACME's performance, such as changes in search demand, pricing adjustments, and conversion rates. Keywords: ACME, PPC performance, anvil throwing, tariffs, economic impact."
}
```

    3. Diving into Performance Details

    Here, I delve into the ‘why’ behind our performance, illuminating the strategies and decisions driving key outcomes.

    Whether limited to pivotal insights or an in-depth analysis, my focus remains on information supporting the summary and informing our future direction.

    ```json
{
  "alt": "Slide titled 'Next Steps' listing strategies for 2024, including video expansion, lifestyle imagery, improved tracking, and campaign optimization.",
  "caption": "Discover the 2024 strategic roadmap focusing on video reach, imagery enhancement, advanced tracking, and innovative campaign optimization.",
  "description": "This slide, titled 'Next Steps' for the year 2024, outlines key strategic initiatives. The focus is on expanding video reach and messaging, adding lifestyle imagery to Merchant Center, improving tracking with GA4 data, and optimizing campaigns for new customer acquisition. It highlights the planned enhancements to maintain market maturity and leverage new targeting tools in 2025. Keywords: strategy, video, imagery, tracking, campaigns, 2024."
}
```

    Highlighting Best Performers and Resource Allocation

    By showcasing top-performing assets and how we distributed efforts, I help leadership see where we’ve excelled and intelligently invested resources.

    Reflecting on Tests and Trends

    Sharing tests and trends that have shaped our year helps leadership understand the evolution of our strategy and sets the stage for potential opportunities.

    ```json
{
  "alt": "Augmented reality tools in Google Ads for beauty products displayed on smartphones.",
  "caption": "Discover the future of shopping with augmented reality in Google Ads, showcasing interactive beauty product experiences.",
  "description": "This image highlights the integration of augmented reality (AR) in Google Ads, focusing on the beauty industry. Two smartphones display virtual try-on features for Covergirl lipstick, allowing users to visualize products in real-time. The concept promises to expand into more industries following its beauty launch in 2023. Keywords include AR tools, Google Ads, beauty industry, and interactive features."
}
```

    4. Considering External Influences

    It’s crucial to frame our performance within the wider environment, highlighting external factors that influenced results either positively or negatively.

    An Analysis of Digital and Economic Factors

    From shifts in digital marketing channels to broader macroeconomic trends, I contextualize performance against external events, explaining both impacts and non-impacts.

    5. Planning for What’s Next

    Looking ahead, I focus not on pre-determined paths, but on our decision-making framework, assuring leadership of a structured plan for adapting to future changes.

    Outlining Next Steps and Innovations

    By sharing strategic moves tied to last year’s data, as well as exploratory initiatives and adaptation strategies, I foster confidence and excitement for the year to come.

    Finalizing with a Leadership Lens

    Before submitting, I ensure all data is clearly sourced, negatives are addressed up front, and all stakeholder queries have been thoroughly answered.

    This reflective practice not only strengthens my relationship with stakeholders but also lays the foundation for seamless reporting in the years ahead.


    Inspired by this post on Search Engine Land.


    crushpress.ai community screenshot
  • Google Resolves Page Indexing Report Delay for Instant Insights

    Google Resolves Page Indexing Report Delay for Instant Insights

    I just discovered that Google Search Console has finally addressed the month-long delay in their page indexing report. It felt like a stroke of relief when I saw the report now displays data as recent as just a few days ago. This is the usual schedule for updates and I’m thrilled to have this crucial tool back on track.

    Another piece of good news: emails notifying about indexing issues have resumed, so we site owners can stay informed directly through our inboxes once again.

    Page Indexing Report. This indispensable tool helps me understand which pages on my site Google can find and index, along with highlighting any potential problems. It also allows me to submit any fixes and see if they’ve been successfully implemented. Previously, when the report was delayed, we couldn’t verify our fixes or check the indexing status of new and existing pages, which was quite frustrating.

    Fixed Issues. Here’s a screenshot of the updated report, showcasing a more current date—December 14th—instead of the long-stagnant November 21st:

    ```json
{
  "alt": "Google Search Console page indexing report with internal issue notice and last update date of 12/14/25.",
  "caption": "A glimpse into Google Search Console showing a page indexing report struggling with internal data update issues, marked with a last update date of 12/14/25.",
  "description": "This image shows a screenshot of Google Search Console's page indexing report, indicating an internal issue preventing recent data updates. A red arrow points to the last update date, 12/14/25, underlining the delay in data refresh. The interface features a clear search bar, an 'export' button, and user account controls, emphasizing typical dashboard usability. Keywords: Google Search Console, indexing report, data update, internal issue."
}
```

    Besides, Google has also resolved the delays in performance reports just yesterday! It’s a relief to know that most significant reports are now functioning smoothly, though it’s always wise to stay prepared for potential future hiccups.

    Why It Matters to Us. Over the past month, many of us struggled to provide up-to-date reporting to our SEO clients and stakeholders. With the recent fixes, we now have access to the latest data for both page indexing and performance reports.

    This means we can get back to speed with our reporting tasks, just in time before the holiday season sets in.


    Inspired by this post on Search Engine Land.


    crushpress.ai community screenshot
  • Unlock the Power of Google’s PMax Channel Report

    Unlock the Power of Google’s PMax Channel Report

    For years, I’ve been fascinated by how PPC advertisers navigate the complexities of Google’s campaigns, especially Performance Max (PMax).

    While the automation behind PMax is impressive, the lack of transparency has often been a source of frustration for me and many others.

    Thankfully, Google has finally started to address some of these concerns with the introduction of the new Channel Performance report.

    ```json
{
  "alt": "Channel distribution table showing campaign data with clicks, impressions, interactions, conversions, and costs.",
  "caption": "Dive into your campaign's performance with detailed channel distribution metrics to enhance your advertising strategy.",
  "description": "This image displays a channel distribution table from a Performance Max campaign, detailing metrics such as impressions, clicks, interactions, conversions, conversion value, and costs across various platforms like Discover, Display, Gmail, Maps, Search, and YouTube. The table aids in understanding ad performance, providing insights into clicks, engagements, and overall effectiveness for optimizing marketing strategies. Source: Smarter Ecommerce."
}
```

    This guide is designed to help you understand the report, its benefits, and how you can leverage it effectively.

    The Channel Performance report represents a major shift in how we can view and assess campaign performance.

    ```json
{
  "alt": "Spreadsheet displaying channel performance data for various ad campaigns, including impressions, clicks, and conversions.",
  "caption": "Dive into the detailed performance metrics of your ad campaigns. This table showcases insights into impressions, clicks, and conversions, guiding your marketing strategy.",
  "description": "This image depicts a tabular display of channel performance data for ad campaigns. The table includes columns for impressions, clicks, interactions, conversions, conversion value, and cost. It highlights performance for campaigns with and without product data. This snapshot is integral for analyzing marketing efficiency and guiding strategic decisions in digital advertising. Keywords: ad performance, marketing data, campaign analysis."
}
```

    Located under Campaigns > Insights and Reports > Channel Performance (beta), it’s a pre-built network report offering tabular and flow diagram data.

    It’s currently exclusive to Performance Max campaigns but could potentially expand to other types in the future, hinting at a broader applicability.

    ```json
{
  "alt": "Channel performance data filter interface showing options for clicks, cost, conversions, and reports.",
  "caption": "Explore your channel performance with customizable columns for clicks, costs, interactions, and more. Fine-tune your analytics for September 2025.",
  "description": "This image depicts a data interface for channel performance analysis, allowing users to modify columns such as clicks, impressions, cost, interactions, conversions, and reports. Users can customize their view by selecting relevant metrics to drag and drop for reorder. The time frame is set from September 1 to 30, 2025. This interface aids in detailed performance analysis for ecommerce campaigns."
}
```

    Previously, getting insights into channel performance required tedious manual reports, or at best, third-party tools with limited capabilities.

    Now, the Channel Performance report provides a direct, Google-native solution to this problem.

    ```json
{
  "alt": "Sankey diagram showing ad conversions across channels like Discover, Display, and Search with costs and results.",
  "caption": "Discover the power of your ad channels with this insightful Sankey diagram, illustrating interactions and conversions across platforms like Discover, Display, and Search.",
  "description": "This Sankey diagram displays the conversion sources and efficacy of ad channels, including Discover, Display, Gmail, Maps, and Search. Key metrics shown are impressions, interactions, and results. Discover has a cost of $73.79, Display $12.96, and Search $4,585.49, with Search holding the highest share of cost at 91.46%. The results value for 'Purchase' is noted at $21,989.92. Source: Smarter Ecommerce (smec)."
}
```

    The report has two primary components: an account-level view and a campaign-level view, complete with a data table and a Sankey diagram.

    The account-level view offers a new perspective with a convenient table displaying campaign and channel metrics, making it easier to analyze at a glance.

    ```json
{
  "alt": "Channel performance report flowchart with data on impressions, interactions, and conversions.",
  "caption": "Decoding the Channel Performance report—a visual flowchart unraveling the intricate paths from impressions to conversions.",
  "description": "This image showcases a data visualization flowchart detailing a Channel Performance report. It illustrates the journey from 3,418,904 impressions through 53,910 interactions to 2,440.72 conversions. Various channels such as Discover, Display, and Search are analyzed for metrics like dynamic remarketing, responsive display, and video ads. Keywords: channel performance, data visualization, impressions, conversions, digital marketing."
}
```

    This view allows for sorting by different metrics, which is a handy way to compare and prioritize campaigns.

    My favorite feature is the ability to switch segments, offering insights into ‘ads using product data’ versus ‘ads not using product data’, which was a significant challenge in understanding PMax campaigns.

    ```json
{
  "alt": "Three-panel diagram titled 'Lack of proportion' showing the disproportion in impressions between asset-based and product-based ads on Search and YouTube.",
  "caption": "Explore the disparity in digital ad impressions: asset-based vs. product-based. These visualized figures reveal the significant difference in search and YouTube ad performance.",
  "description": "This image displays a three-panel diagram highlighting the imbalance in impressions between asset-based and product-based ads, titled 'Lack of proportion'. It shows a stark contrast with 4,492 impressions for asset-based ads versus 1,242,147 for product-based ads. The data indicates that asset-based ads account for only 0.36% of Search Network impressions, countering a common belief of around 17%. The diagram aims to offer clear visualization of digital ad performance between different types on platforms like Search and YouTube. Source attribution: Smarter Ecommerce (smec)."
}
```

    Upon switching to the campaign-level view, you’ll notice a striking Sankey diagram that visualizes user interactions from impressions to conversions.

    Though visually impressive, the data table below is more reliable for detailed analysis, showing performance metrics by channel and ad type.

    ```json
{
  "alt": "SMX introduces SPN with enhanced data segmentation in Google Ads performance reports, currently showing only impressions.",
  "caption": "Discover SPN: A notable move towards transparency in Google Ads. Currently, only impressions are available, but segmentation enhancements are on the way.",
  "description": "This image showcases a new feature coming soon to SMX: SPN, which enhances data segmentation in Google Ads Performance Max campaigns. The current interface includes icons for Google services and a highlighted section for channel performance data, showing only impressions. This update marks an important step towards greater transparency in ad reporting, emphasizing the future availability of segmented data for Search Partners. Source: Smarter Ecommerce (smec)."
}
```

    For a deeper dive, I recommend exporting the data and using it in spreadsheets for comprehensive analysis.

    However, the report has some drawbacks, like the misleading proportions in the Sankey diagram and lack of ratios in the data table.

    Despite this, it offers valuable insights into which channels are genuinely delivering results, enabling you to maximize asset and traffic quality.

    Utilizing placement data for quality control and customizing reports through Google Sheets can enhance your strategy.

    Google has promised future features like API access, which will expand the report’s utility significantly.

    As we continue to explore these insights, the challenge lies in accurately interpreting the data to make informed decisions.


    Inspired by this post on Search Engine Land.


    crushpress.ai community screenshot
  • Boost Your ROAS Like a Pro with Insights from La Maison Simons

    Boost Your ROAS Like a Pro with Insights from La Maison Simons

    Have you ever felt uneasy managing large catalogs in Google Performance Max, almost like you’re handing over your wallet to an algorithm? I sure have.

    La Maison Simons faced a similar struggle. With too many products and not enough control, they decided to rebuild their segmentation using Channable Insights. This change turned their perplexing campaign into a revenue powerhouse.

    Step 1: Stop segmenting by category

    Initially, Simons divided campaigns by product category. It seemed like a good idea until their popular sweater consumed the entire budget, leaving less visible or new products unnoticed.

    Static segmentation brought limited visibility and sluggish decision-making. Marketers were trapped with manual tweaks, while Google auto-focused on what’s already succeeding.

    Step 2: Segment by performance

    With Channable Insights, product-level data like ROAS and clicks now fuel dynamic grouping:

    ```json
{
  "alt": "Product segmentation chart showing Star Products, Zombie Products, and New Arrivals with goals.",
  "caption": "Discover the three pillars of product segmentation: Star products to scale profitably, Zombie products to test and find hidden revenue, and New arrivals to nurture early.",
  "description": "This image illustrates a product segmentation chart divided into three categories: Star Products, Zombie Products, and New Arrivals. Each segment has a corresponding goal and includes items like proven winners or new listings. The chart uses bold colors: pink for segments, blue for inclusions, and yellow for goals, optimizing clarity and visibility. Keywords: product segmentation, Star Products, Zombie Products, New Arrivals, business strategy."
}
```

    Products automatically transition between segments based on performance. As Etienne Jacques, Digital Campaign Manager at Simons, expressed:

    “One super popular item no longer takes all the money.”

    Step 3: Shorten your analysis window

    Instead of the usual 30-day signals, Simons decided to use a rolling 14-day window. This means quicker reactions, more accurate decisions, and less wasted spend in a fast-paced catalog.

    Step 4: Push the strategy across channels

    Why limit the strategy to Google? Simons applied the same segmentation across:

    ```json
{
  "alt": "Image displaying a table with 'Quick Rules to Implement'. Includes principles and their importance.",
  "caption": "Unlock success with quick rules: Prioritize performance over segmentation, embrace shorter data windows, and give new arrivals a unique path.",
  "description": "The image outlines 'Quick Rules to Implement', featuring a table with two columns: 'Principle' and 'Why It Matters'. Principles include prioritizing performance over category segmentation, using shorter data windows, and ensuring new arrivals have unique paths. The reasons include aligning budgets with revenue, making faster decisions, and treating new items without bias. The visual uses a bright pink background with contrasting colors for text, aiding clarity and engagement."
}
```
    • Meta
    • Pinterest
    • TikTok
    • Criteo

    This cross-channel consistency amplifies optimization.

    Step 5: Watch the metrics climb

    Simons unlocked impressive results without increasing ad spend:

    • ROAS growth: from ~800% to ~1500%
    • CPC decrease: $0.37 to $0.30
    • CTR lift: 1.45% to 1.86%
    • 14% increase in average order value
    • 1300% ROAS for New Arrivals campaigns
    • Faster workflows and fewer manual tweaks

    Even previously invisible products turned into unexpected profit drivers with a spot in the limelight.

    Step 6: Treat automation as control, not chaos

    Automation has restored marketing control rather than taking it away. Now, teams can learn from data and actively influence product growth instead of leaving everything to PMax autopilot.

    Your action plan

    • Classify products as Stars, Zombies, and New Arrivals.
    • Automate campaign reassignment based on real-time data.
    • Refresh product insights every 14 days.
    • Roll out segmentation logic to every paid channel.
    • Scale what wins – test what’s yet to succeed.

    Aiming for Simons-style ROAS gains without raising ad spend? Start with a free feed and segmentation audit to enhance your product data quality.


    Inspired by this post on Search Engine Land.


    crushpress.ai community screenshot
  • Unlocking VTC Bidding: A New Era for Google App Campaigns

    Unlocking VTC Bidding: A New Era for Google App Campaigns

    I’ve noticed a significant shift in Google Ads as they now allow us to optimize bidding for view-through conversions (VTC) in Android App campaigns. This change highlights a growing emphasis on video-driven performance.

    In the past, VTC was a subtle, behind-the-scenes signal within Google’s system. Now, it’s a visible option that allows me to focus on conversions that occur after an ad is seen, rather than clicked.

    The shift. It’s evident that Google is steering app advertising away from traditional click-focused strategies, encouraging an approach centered around influence and incremental results. This is particularly beneficial for platforms like YouTube and in-feed video advertising.

    This update means our bidding strategies align more intuitively with the actual ways users discover and install apps today.

    Why it matters to me. This flexibility allows me to go beyond mere clicks, enhancing measurement metrics for video-centric app campaigns. It’s an exciting validation for those of us invested in upper-funnel marketing activities.

    Who benefits the most? Advertisers who prioritize video content and focus on creating awareness and engagement. This is a game-changer for teams oriented towards long-term growth, not just immediate installs.

    ```json
{
  "alt": "Google Ads interface showing options for language selection and view-through conversion optimization.",
  "caption": "Explore the Google Ads settings with options to tailor your campaign's language and optimize view-through conversions for better targeting.",
  "description": "This image displays a screenshot of the Google Ads interface, focusing on campaign settings. The interface includes sections like Mobile app, Locations, Languages, and options for view-through conversion optimization. Users can select the languages their customers speak, with 'English' already chosen. The screenshot also highlights options related to EU political ads, ensuring compliance with regulations. This setup aids advertisers in optimizing campaign performance effectively."
}
```

    What I’m keeping an eye on:

    • How Google’s attribution models affect campaign reliance
    • Potential shifts in Cost-Per-Acquisition expectations
    • The growing importance of creative quality over click-centric strategies

    First seen by. I came across this update thanks to Rakshit Shetty, a Senior Performance Marketing Executive who first spotted this change.

    Bottom line. Google is elevating view-based data for app campaigns to a priority status, marking a shift towards a performance marketing strategy led by AI and agnostic of sales funnels.


    Inspired by this post on Search Engine Land.


    crushpress.ai community screenshot