Tag: Performance

  • Why Double-Checking PPC Settings Can Save Your Campaign

    Why Double-Checking PPC Settings Can Save Your Campaign

    As a seasoned PPC professional, I’ve learned the hard way that even experts can fall victim to default settings. It’s become clear to me how crucial it is to thoroughly double-check every campaign setting.

    On episode 334 of PPC Live: The Podcast, I chatted with Sophie Fell, Head of Paid Media at Liberty Marketing Group. We delved into a memorable PPC mishap involving location targeting, illustrating how minor oversights can escalate into significant issues—but also how to resolve them effectively.

    Sophie shared a story where she inadvertently launched a campaign with worldwide location targeting. The campaign quickly amassed 1,500 leads, which appeared promising until she realized they were from unintended locations.

    At first glance, such a spike in leads seemed like a triumph, yet we soon saw it as a cautionary tale. Upon further investigation, the reason was clear: the location settings were misconfigured. This experience taught us the importance of scrutinizing results that seem unusually favorable.

    The client noticed the mistake around the same time as Sophie. She addressed the situation with honesty, acknowledging the error, clarifying the misstep, and resolving it promptly. This transparency was crucial in maintaining trust, even if the client felt understandably frustrated.

    This wasn’t a case of lacking expertise; rather, it was about rushing through processes and assuming reviews had been done. We’ve all made assumptions that trip us up, and this incident was a stark reminder of the dangers inherent in default settings.

    Once the issue was corrected, Sophie’s campaign achieved exceptional results, hitting targets early and surpassing revenue goals by £3.5 million. This success wasn’t defined by the initial error but by the way it was handled.

    Nowadays, Sophie double-checks campaign settings multiple times for assurance. She examines settings during any unusual performance shifts and ensures results are thoroughly vetted. Her key takeaway: post-launch reviews often catch what pre-launch overlooks.

    When mistakes occur, Sophie advises: pause, assess, and be transparent. It’s critical to take responsibility, explain the error, and detail preventive measures. Errors only escalate into issues if mishandled.

    In her audits, Sophie frequently encounters outdated accounts, over-reliance on brand campaigns, and misapplied automation tools. She emphasizes the ongoing importance of aligning keywords, ads, and landing pages, even in the era of AI-driven marketing.

    Discussing mistakes is vital—many assume industry veterans no longer err, but learning never stops. Sharing these experiences fosters junior confidence, enhances leadership, and propels industry evolution.

    I believe a healthy team culture tolerates experimentation and accountability. Sophie highlights the need for clear testing frameworks, budget constraints, and openness. Teams claiming perfection often lack innovation.

    The key takeaway? Regularly verify your campaign settings. Platforms evolve, defaults change, and assumptions can lead astray. Ensuring campaigns align with intentions prevents mishaps.


    Inspired by this post on Search Engine Land.


    crushpress.ai community screenshot
  • Unlocking the Mystery: PMax Now Shows Search Partner Impact

    Unlocking the Mystery: PMax Now Shows Search Partner Impact

    I’ve been eagerly waiting for Google to enhance their Performance Max (PMax) reporting, and now it’s finally here! This new update reveals how much PMax spends on Search Partners and if that traffic actually adds value to our campaigns.

    Google has rolled out a significant upgrade to PMax reporting, which gives us advertisers our first opportunity to clearly see how Search Partners influence campaign outcomes. This transparency is a game-changer for those of us managing PPC campaigns.

    Driving the news. The update is now live in Google Ads and integrates Search Partners into the PMax channel performance tables. Here are a few things we can now observe:

    • How Search Partners contribute to overall PMax results.
    • Whether they provide incremental value.
    • Comparison of their performance with other PMax channels.
    • The total spending directed towards Search Partners.

    What’s changing. This added level of transparency allows us to see how PMax distributes the budget across different channels, particularly in search. It’s crucial for understanding whether the Search Partners’ traffic is beneficial or if it detracts from the campaign’s efficiency.

    ```json
{
  "alt": "Channel performance report showing costs and impressions for multiple advertising platforms.",
  "caption": "Explore your advertising efficiency with detailed channel performance insights, revealing costs and share percentages for strategic decision-making.",
  "description": "This image showcases a channel performance report from an advertising dashboard. It details costs associated with maps, search partners, and YouTube, indicating share of cost percentages for each. The report highlights $191.22 cost and 41.79% share for search partners, $33.84 cost and 7.39% share for YouTube, and $0 cost for maps. A table below lists channels like Discover, Gmail, and Google Display Network alongside metrics such as impressions and clicks, providing insights for advertising strategies. Keywords: channel performance, advertising, cost analysis, dashboard."
}
```

    Why we care. In the past, Search Partners’ activity was hidden within PMax, leaving us in the dark about our spending and its impact. Now, this new line of reporting sheds light on a previously invisible segment of search inventory. With this insight, we can assess incremental value, compare performance with other PMax channels, and make more informed decisions on optimization and budgeting. Essentially, we’re now able to measure spending that was invisible, which could directly influence our campaign performance and profitability.

    The big picture. While it may seem like a small change, it’s a crucial step towards understanding how PMax works. For those of us running large-scale PMax accounts or analyzing channel profitability, isolating Search Partners’ data can dramatically shape our strategies in optimization, budgeting, and overall planning.

    First seen. Google Ads specialist Aleksejus Podpruginas was the first to notice this update, sharing his findings on LinkedIn.

    Bottom line. PMax is finally giving us a clearer view of how Google’s automation spends our money. This insight is a pivotal piece of the puzzle that we’ve been missing.


    Inspired by this post on Search Engine Land.

    crushpress.ai community screenshot
  • How Workflow Integration Can Transform Your Sales Training

    How Workflow Integration Can Transform Your Sales Training

    I recently discovered a hard truth about sales enablement programs: having stellar content isn’t enough. The key issue lies in the poor integration with existing workflows, leading many organizations to overlook the vital element of user adoption. This realization made me rethink how we design training programs.

    While designing a $500,000 sales enablement program, I witnessed firsthand how perfection can fall short without strategic adoption. Initially, I was confident in the content’s quality, but it didn’t quite catch on as expected. What I learned is that behavior change doesn’t happen merely because the content is flawless. Instead, it requires seamless integration into daily routines.

    True success lies in creating a program that not only teaches but also fits naturally within a salesperson’s workflow. Without this, even the most thoughtfully crafted training can end up unused. By collaborating closely with the sales team, I understood the importance of embedding learning into their existing processes, making adoption smoother and more natural.

    Ultimately, I’ve learned that for a training program to drive genuine behavior change, it must prioritize ease of adoption. It’s about creating an environment where learning feels like part of the job rather than an extra task. When we focus on integration, the training becomes a powerful catalyst for change. I urge everyone to rethink how their sales enablement strategies align with everyday workflows.


    Inspired by this post on genmark.ai Blog.


    crushpress.ai community screenshot
  • Explore Google’s New Branded Queries Filter in Search Console

    Explore Google’s New Branded Queries Filter in Search Console

    I’ve got some exciting news about Google Search Console that’s just too good to keep to myself. They’ve introduced a branded queries filter that’s rolling out gradually, and trust me, you’ll want to get your hands on it!

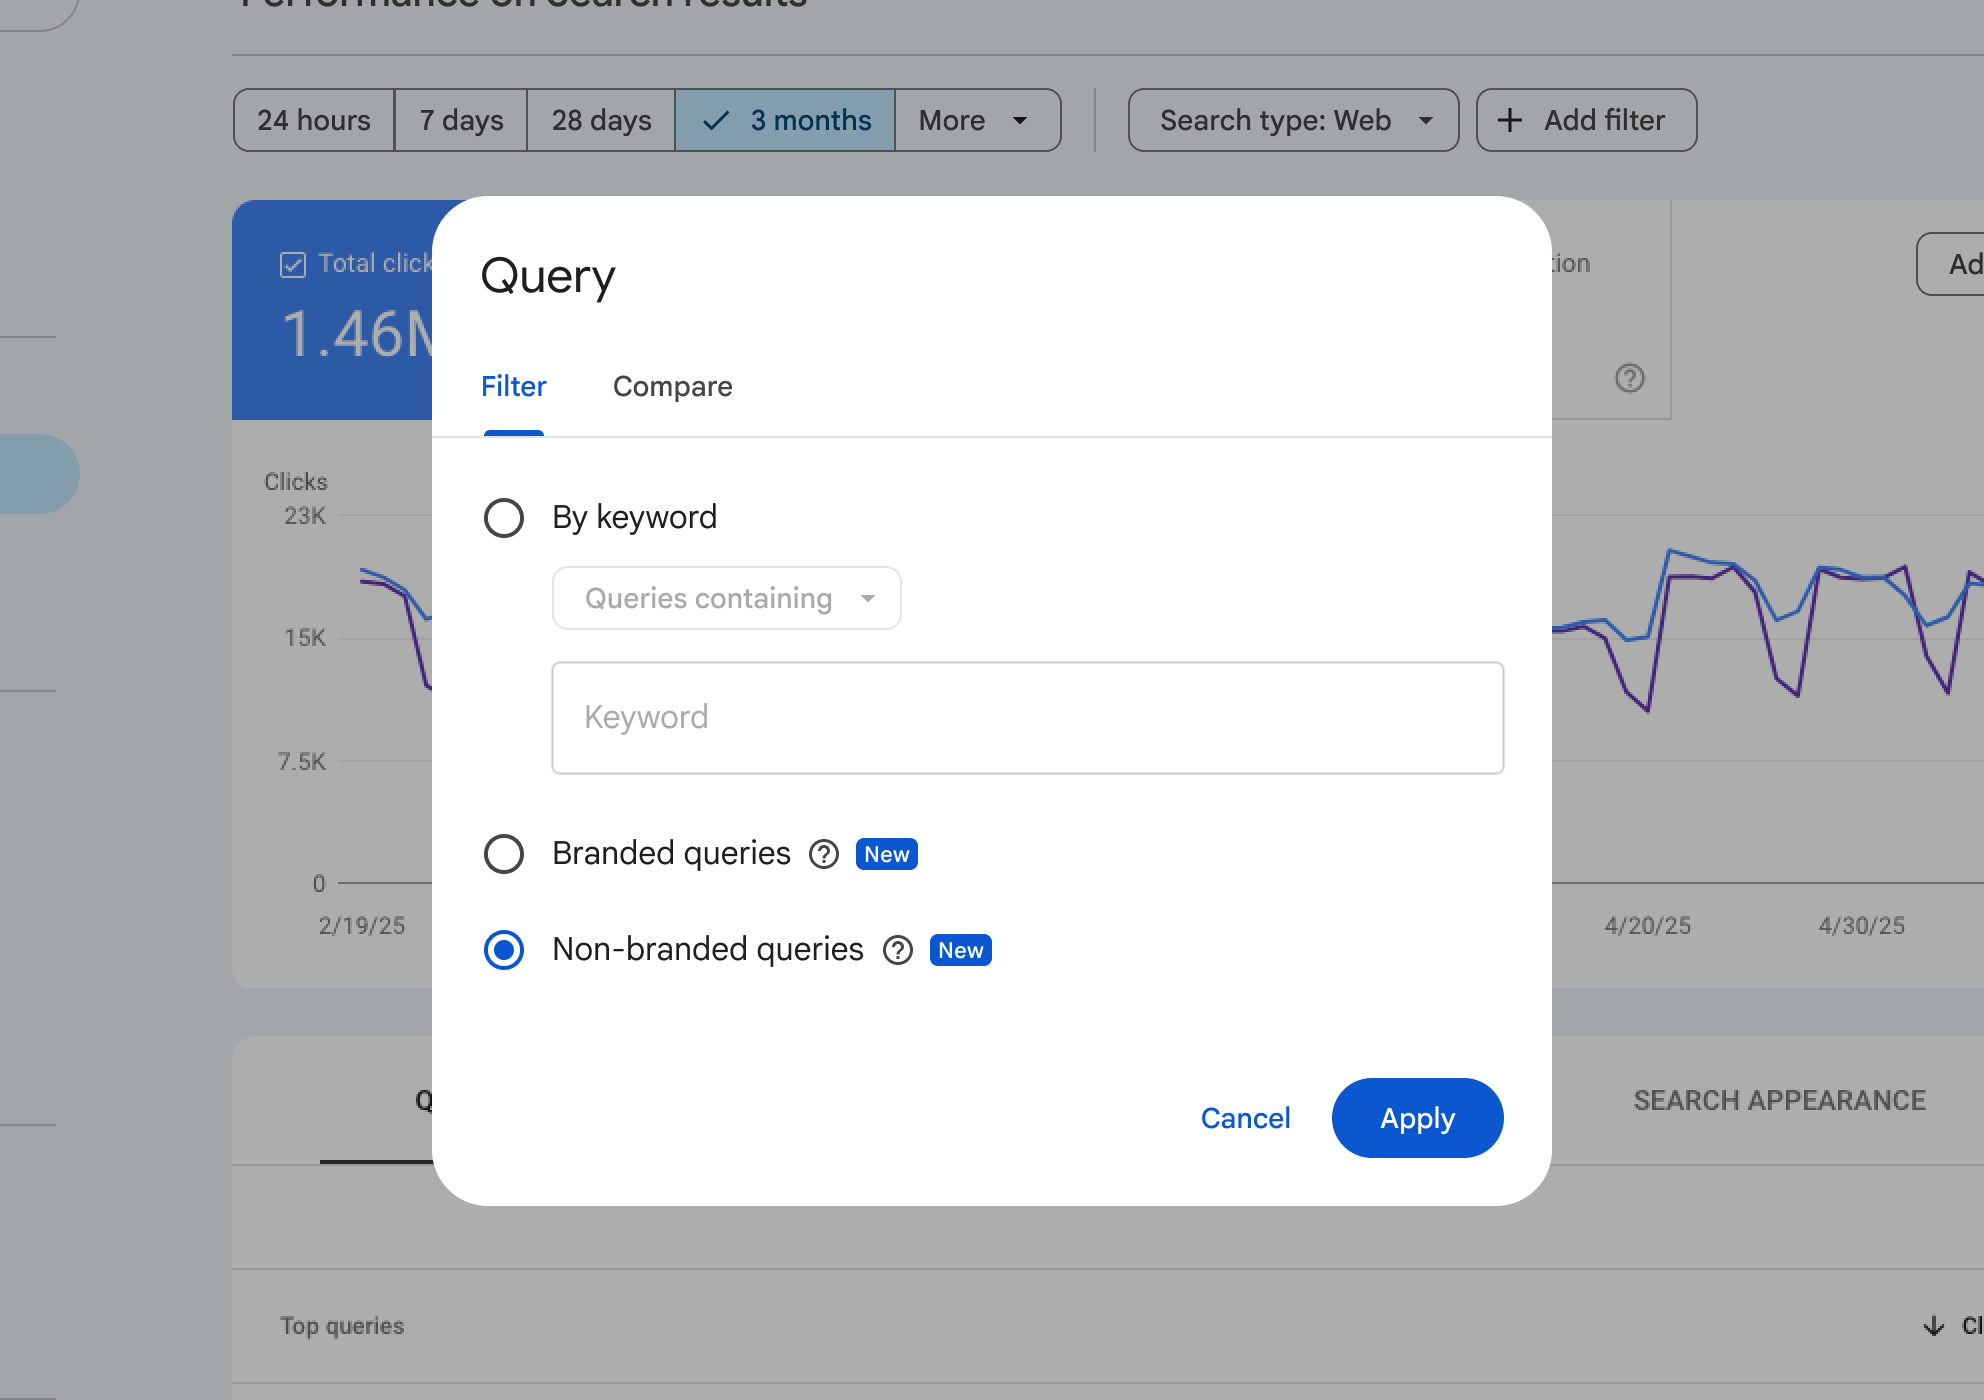
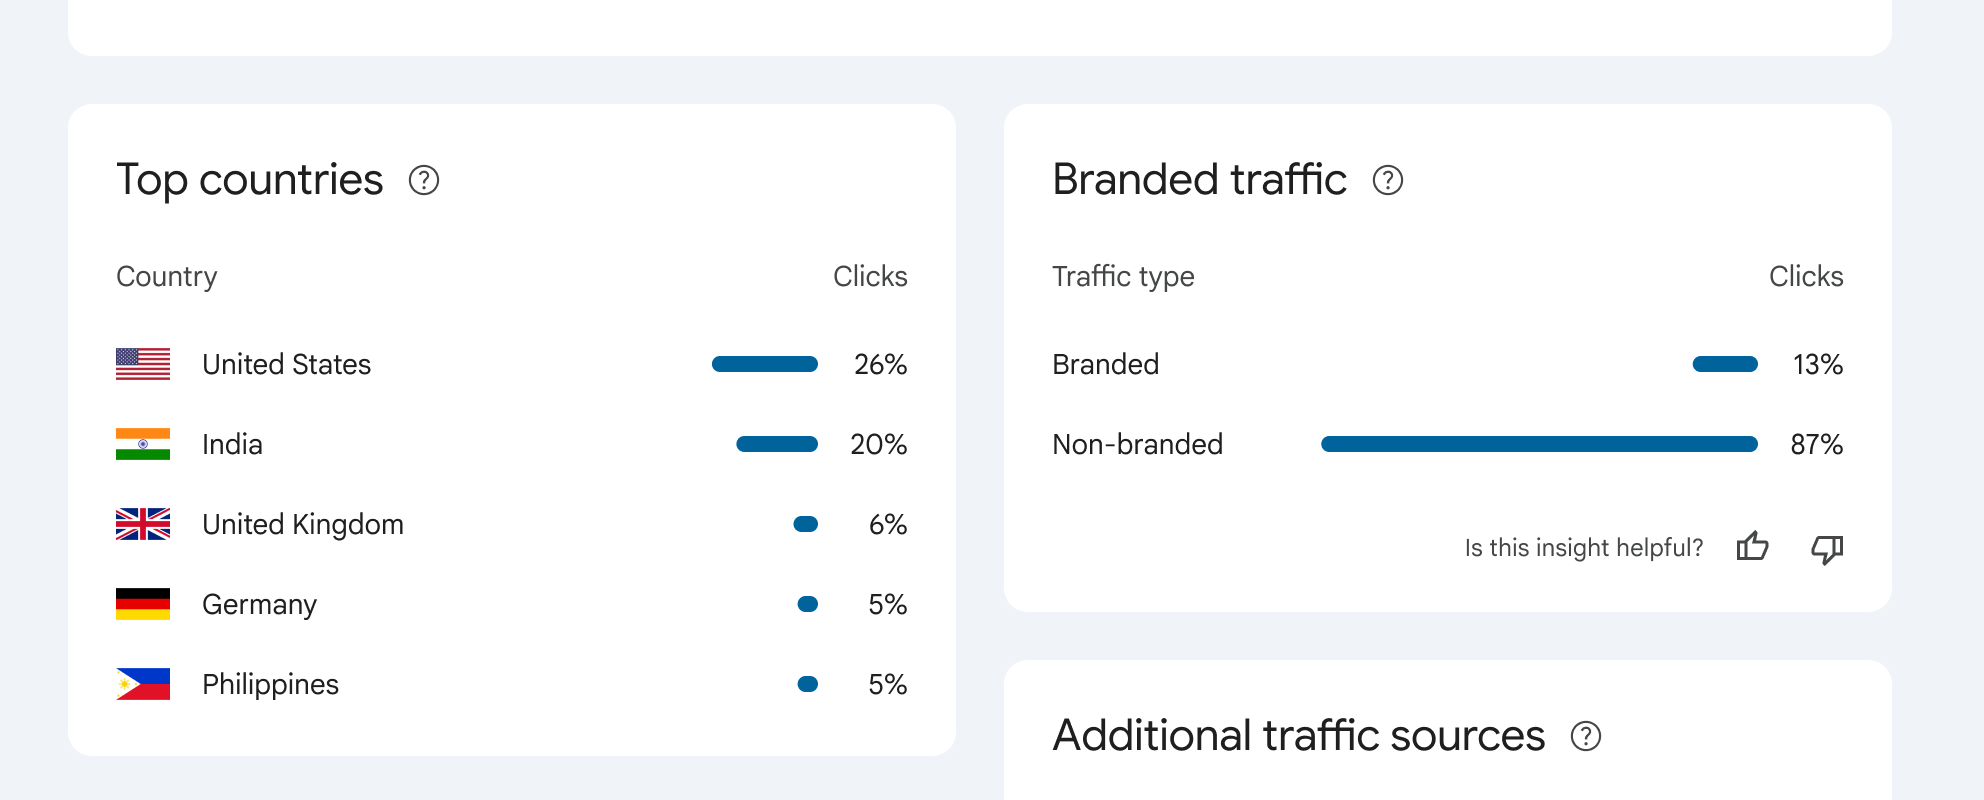
    With this new addition, I’ve found that filtering performance reports by branded or non-branded queries has never been easier. Google can now show me the percentage of traffic my site gets from either branded or non-branded sources, right from Search Console.

    This update made its debut at today’s Google Search Central event in Tel Aviv, and if you’re hearing about it now, it’s because news travels fast, especially from events like these.

    Understanding Branded Queries. Google defined branded queries for us: These are search queries that include my brand name, its variations or any brand-related products. For instance, if my brand was Google, related queries could be “Google,” “Gogle,” or even “Gmail.”

    This differentiation helps me see how returning users differ from new ones. Focusing on this can lead to higher click-through rates for branded queries. Meanwhile, non-branded ones show how new users find my content organically.

    ```json
{
  "alt": "Google Search Console filter menu for query settings with non-branded queries selected.",
  "caption": "Exploring search performance insights with Google Search Console's filter menu, focusing on non-branded queries for a three-month period.",
  "description": "This image displays the Google Search Console interface, specifically the filter menu for setting search query parameters. The menu shows options to filter by keyword, branded queries, and non-branded queries, with the latter selected. The background features a line graph representing performance data for a three-month timeframe. Key interface buttons 'Cancel' and 'Apply' are visible, providing a comprehensive tool for analyzing website performance metrics. Keywords: Google Search Console, filter, search queries, non-branded, performance analysis."
}
```

    Finding the Filter. Ready to use it? You can locate the branded versus non-branded filter within performance reports under search filters for queries. I love how it works across all search types, whether web, images, video, or news. Metrics like impressions and CTR tailored to my needs are just a click away.

    Here’s a handy screenshot for visuals:

    ```json
{
  "alt": "Chart showing top countries and branded traffic percentages. United States leads with 26% clicks, followed by India at 20%.",
  "caption": "Discover where your traffic comes from! The United States leads with 26% of clicks, while non-branded traffic dominates at 87%.",
  "description": "This image displays two charts: 'Top countries' and 'Branded traffic.' In the 'Top countries' section, the United States leads with 26% of clicks, followed by India at 20%, the United Kingdom at 6%, and both Germany and the Philippines at 5%. The 'Branded traffic' chart shows 13% branded and 87% non-branded clicks. These insights help understand the geographic and branding sources of website traffic."
}
```
    crushpress.ai community screenshot