

The position of ads is more crucial than ever. I’ve recently come across new data that underscores how Google AI Overviews are reshaping paid search visibility and click-through rates (CTR).
In my experience, Google’s AI Overviews have dramatically altered the search landscape almost overnight. As someone deeply invested in paid search, I’ve noticed the battle for visibility isn’t just about ad rank anymore—it’s about appearing above the AI results.
This change is part of a rapid surge in AI Overviews, which I discovered in Adthena’s earlier study. My analysis found that AI Overviews are now trespassing into short, high-volume commercial searches.
The underlying mechanism causing this is pretty clear to me: AI Overviews intercept user attention, slash CTRs, and push both organic and paid listings lower down the page. As a result, clicks and revenue take a hit.
From what I’ve seen in Adthena’s latest research, it accurately identifies how often advertisers secure top ad positions above AI Overviews across seven major industries, device types, and query categories. The research highlights clear leaders and provides actionable strategies for the rest of us in paid search.
The topline reality: Ad position visibility is lost 25% of the time
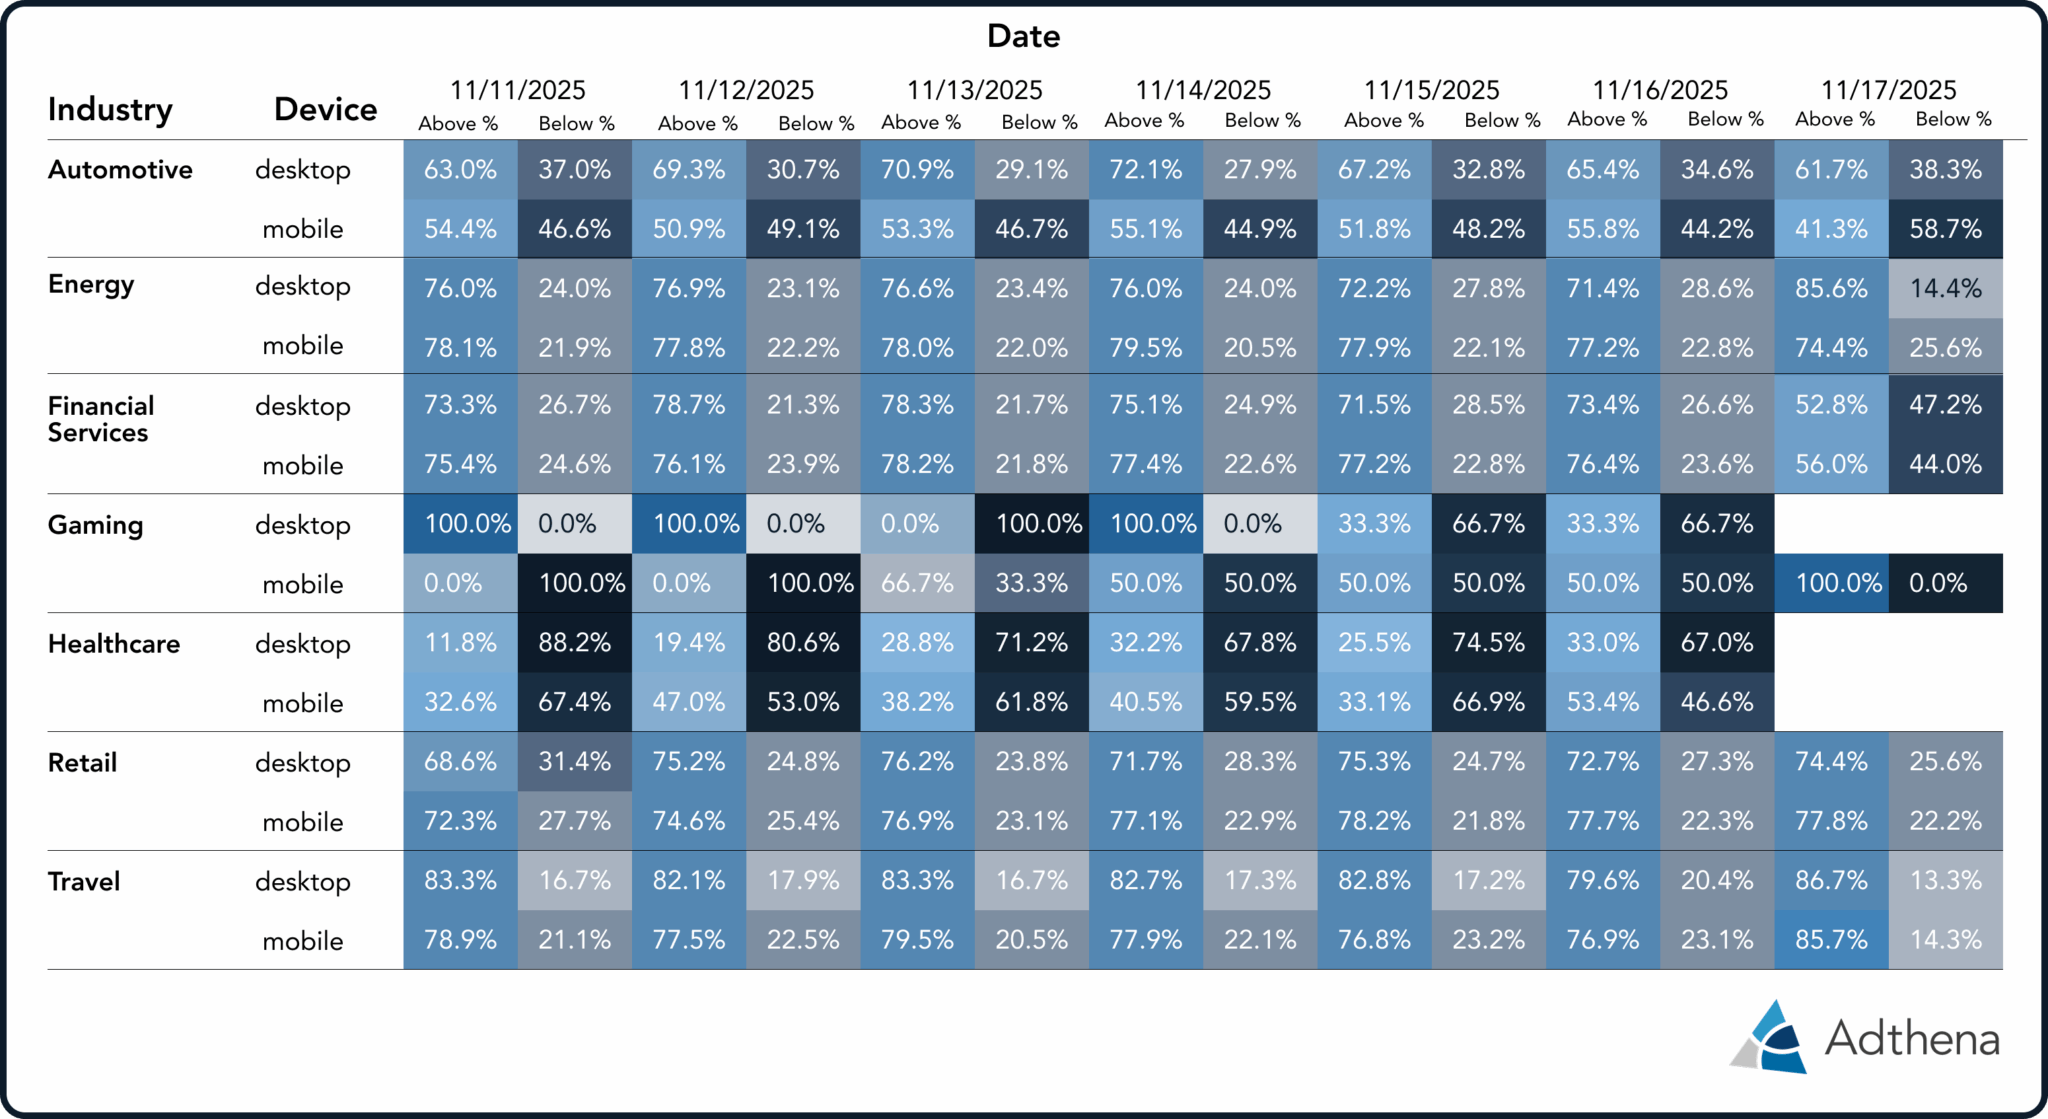
The industry benchmark table below reveals how fierce the fight is for the top spot. It shows us the percentage of ads that appear either above or below AI Overviews across seven industries.


Strategic implications from the topline data
- The leaders: Industries like Travel, Energy, Financial Services, and Retail consistently land above the AI Overviews in more than 75% of cases. However, I’ve noticed that even in these sectors, 1 in 4 paid ads are still affected. When keywords drive major revenue, that 20% to 30% exposure is a direct threat to ROI.
- The runners-up (the risk of being hidden): Healthcare is a major outlier. Ads in this field often appear below AI Overviews 64.6% of the time, given the high-stakes nature and research-heavy aspect of healthcare searches. Google’s AI prioritizes “expert” information first, meaning healthcare ads see significantly less visibility.
- The volatility: The gaming sector shows a clear 50/50 split. Visibility feels like flipping a coin, demonstrating to me the need for agile bidding strategies.
The device divide: Why mobile is your biggest threat
From what I’ve gathered, device-specific data indicates that ads are more likely to be displaced by AI Overviews in a mobile setting due to limited screen space.

Strategic implications on device differences
- Automotive’s Mobile Problem: Although Automotive shows strong “Above %” placement overall, daily trends are worrying. On mobile, ads are frequently buried by AI Overviews, making them invisible without extensive scrolling. This leads to diminishing visibility and CTR for us marketers.
- The “double whammy”: In healthcare, desktop ads generally appear below AI Overviews, although mobile sometimes performs slightly better. It seems the AI Overviews box might be designed for mobile screens, occasionally allowing one or two ad slots to remain visible. However, desktop visibility still suffers greatly.
- Actionable insight: Mobile is where AI Overviews present the greatest challenge. For industries like healthcare and gaming, where this is a significant problem, securing top ad positions is vital for survival.
The query intent test: Where does AI Overviews win and lose?
Generally, I’ve observed that long queries tend to be more informational and thus more likely to activate AI Overviews, while shorter ones are typically transactional. The table below unfolds a surprising industry pattern related to this.
This table reveals the connection between query complexity (or user intent) and AI Overviews’ dominance, spread over query lengths from one to ten words.

Strategic implications on query intent
- AI Overviews dominance on the fringes:
- Healthcare shows that as queries get longer (up to 10 words), ad positions above AI Overviews drop to 0%. Google clearly prioritizes complex health questions, relegating commercial interests lower.
- Gaming reveals the opposite: short terms (1-2 words) have 0% visibility above AI, suggesting organic results or features claim the top spot. However, for longer terms (7-9 words), ads dominate above AI Overviews, a golden opportunity to engage users deeply researching.
- The unexpected paid search opportunity (Automotive & Travel):
- Automotive and Travel ads excel with longer informational queries rather than short, high-volume ones. For example, Automotive’s “Ad Above AI Overviews” rate leaps from 21.9% (one word) to over 74% (four words).
- Strategic implication: This upends conventional PPC strategy, suggesting we should be bidding eagerly on mid-to-upper-funnel terms where AI Overviews are present, intercepting the user’s journey before their final decisions.
Next steps for paid search marketers
Adthena’s research highlights that the threat of Google AI Overviews is fragmentary. Precision is key: know when and where your ads can outrank AI Overviews, adjust your bids and content accordingly.
From my ongoing observations, as the frequency of AI Overviews rises, these ad position percentages might swing. I advise regularly auditing profitable keywords to effectively handle changes in the AI-driven search landscape.
Here are three game-changing steps we can take:
1. Have you explored testing a device-specific strategy?
I’ve realized that mobile often amplifies visibility loss from AI Overviews, notably in sectors like automotive.
I recommend considering a device-specific strategy, especially for campaigns severely impacted by AI Overviews.
2. Have you identified quick wins in keyword coverage?
Data on word counts reveals unexpected possibilities. Industries like Gaming and Automotive often see robust ad placements with long-tail queries (four words or more) above AI Overviews.

This signals high-visibility traffic in mid- to upper-funnel searches that our competitors may be ignoring.
3. Have you reviewed your ad copy against the AI answer?
AI Overviews can miss out on brand nuances and emotional resonance.
To captivate users, ads must deliver what AI can’t: a strong, compelling reason to choose you over Google’s summary. Using messaging that includes trust, guarantees, or urgency can clearly differentiate from AI’s generic style.
Convey transactional incentives like deals, free shipping, or scarcity (“Limited stock, grab yours!”), and use emotional elements like customer testimonials to build trust and convey your unique brand narrative.
The search landscape has evolved. Adthena’s data suggests that marketers who rapidly analyze and adjust their ad strategies in response to AI Overviews will thrive.
Ready to see where your ads sit today?
Adthena gives you the precise data on ad appearances in relation to AI Overviews, helping you adapt to changes in AI search performance. Book a demo to see where your ads rank today.
Inspired by this post on Search Engine Land.

Leave a Reply