Create Custom SEO Reports with Ease Using Claude Code & GSC

```json
{
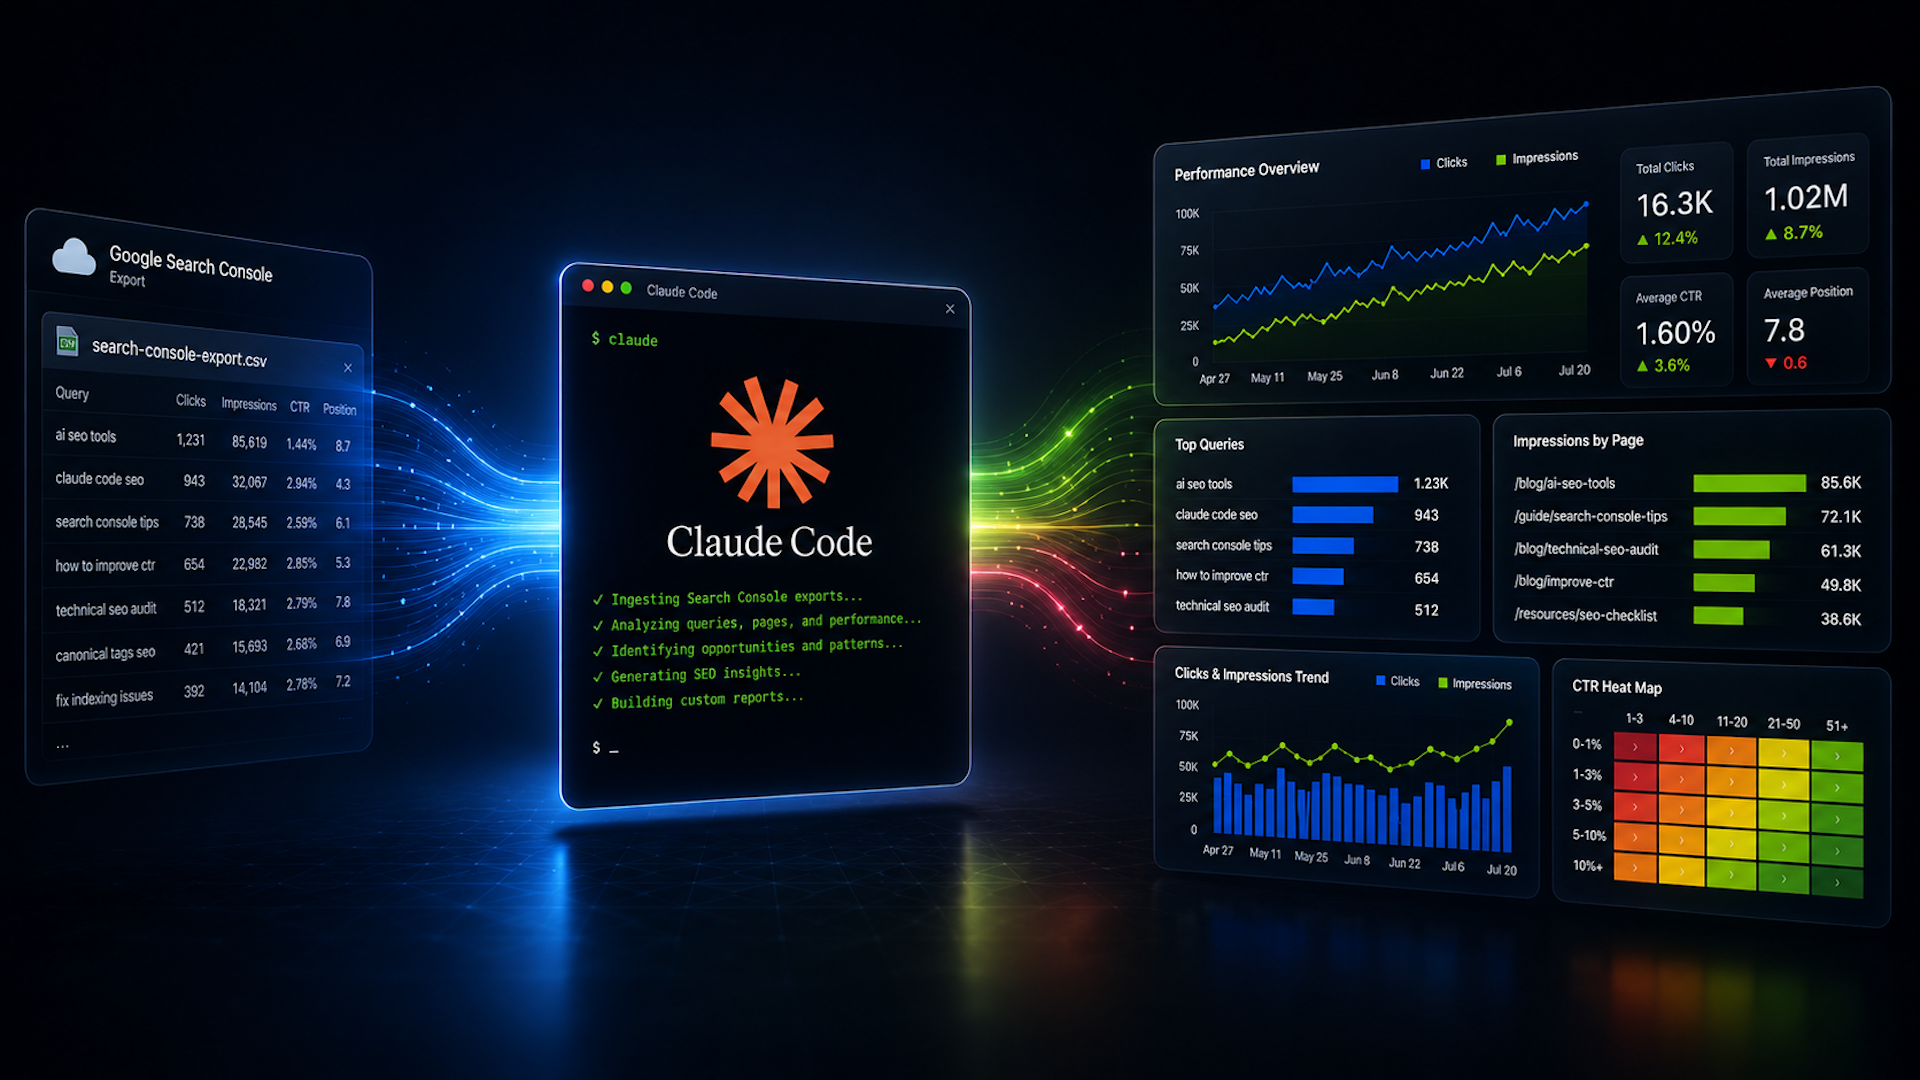
  "alt": "Digital dashboard displaying SEO performance data with charts and graphs from Claude Code.",
  "caption": "Dive deep into SEO metrics with Claude Code's visual dashboard, presenting search console insights and performance analytics.",
  "description": "This image showcases a digital dashboard by Claude Code, filled with SEO performance data. The dashboard displays a variety of charts and graphs including performance overview, top queries, and impressions by page. The central window features the Claude Code interface running analysis scripts, surrounded by vibrant data visuals representing search trends and metrics. This setup is ideal for analyzing search engine optimization results and generating insightful reports."
}
```

I’ve always found SEO reporting to be a bit of a hassle. It used to mean spending hours exporting data from Google Search Console (GSC), tidying it up in spreadsheets, and then trying to make sense of it all in Data Studio.

Now, with AI tools like Claude Code, my workflow has completely changed. I can instantly create customized data visuals and reports in a fraction of the time it used to take.

Let me walk you through the journey of transforming GSC data into tailored reports, streamlining the entire process.

```json
{
  "alt": "The CapmatchOne logo with a gradient circle and bold text.",
  "caption": "Discover innovation with the CapmatchOne logo, featuring sleek typography and a modern gradient circle.",
  "description": "The CapmatchOne logo features bold, modern typography coupled with a gradient circle, symbolizing connection and innovation. The sleek design conveys a sense of progress and creativity. This image can be used for branding or promotional purposes, appealing to audiences interested in innovative solutions and forward-thinking designs."
}
```

Using Claude Code is different from the standard Claude experience. While the regular Claude.ai acts like a chatbot, Claude Code functions as an AI coding assistant right on my computer. It’s capable of reading GSC CSV files, analyzing large datasets, and transforming raw data into clear, visual reports.

Initially, setting up Claude Code can be daunting, especially if you aren’t familiar with technical tasks. But don’t worry, the setup is a one-time effort. Once it’s up and running, generating reports takes just minutes.
```json
{
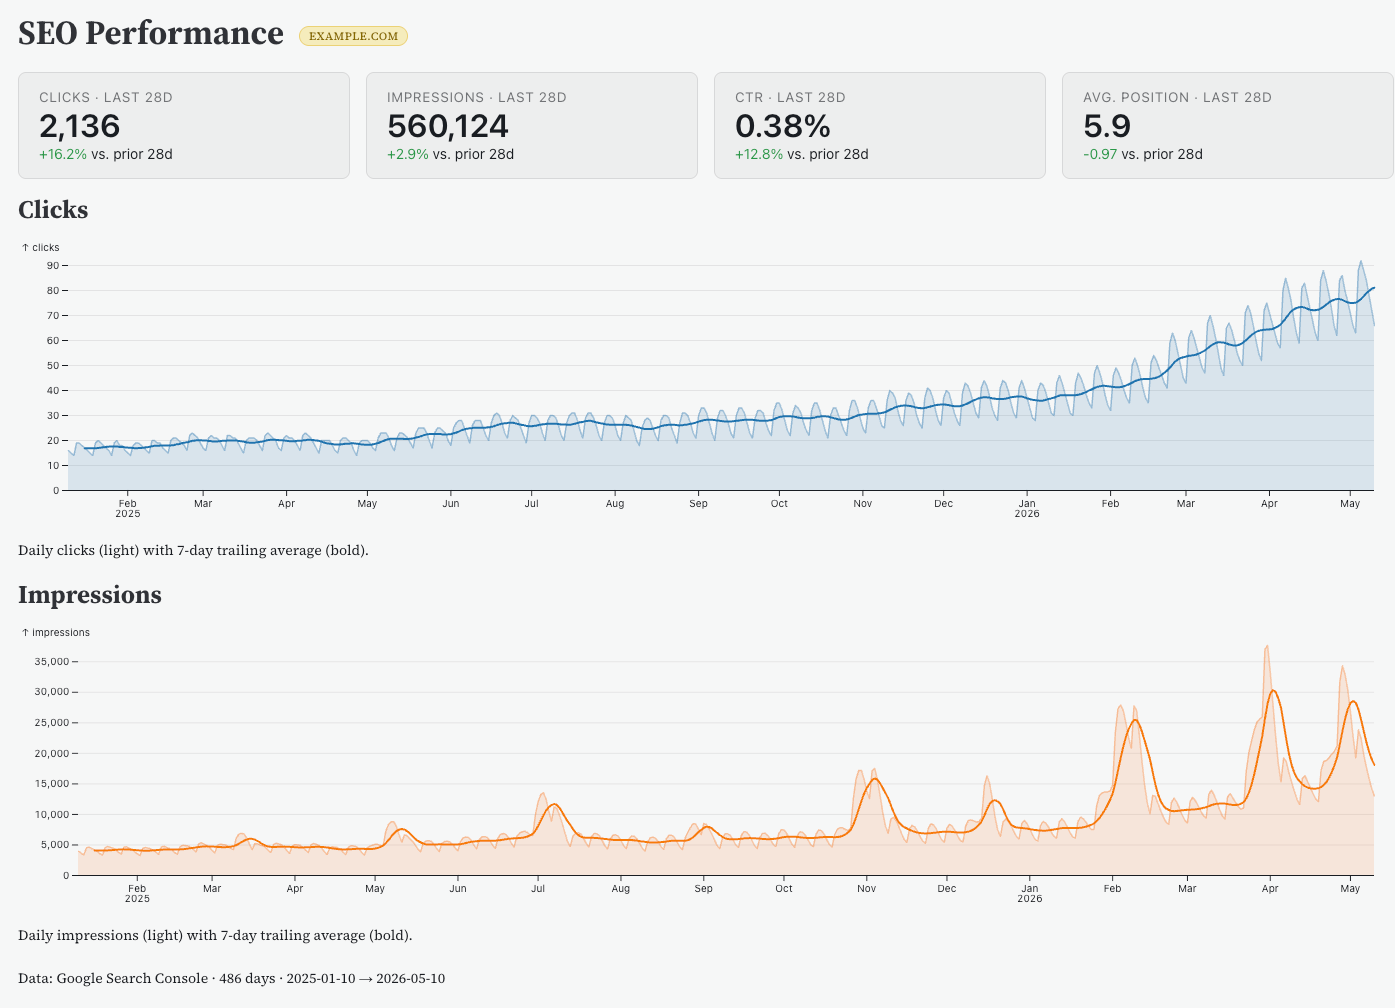
  "alt": "SEO performance graphs displaying clicks and impressions trends from January 2025 to May 2026.",
  "caption": "Diving into SEO performance: The upward trends in clicks and impressions paint a promising picture for the example.com site!",
  "description": "The image displays two line graphs depicting SEO performance metrics for example.com from January 2025 to May 2026. The top graph shows daily clicks with a steady upward trend, featuring a 7-day trailing average. The bottom graph reflects daily impressions, showing periodic spikes and a growing trend. Key performance indicators include 2,136 clicks, 560,124 impressions, and a CTR of 0.38% for the last 28 days. Collected from Google Search Console over 486 days, these metrics indicate an overall improvement."
}
```

The real magic happens after you connect Claude to GSC. Whether you’re in an enterprise environment or you’re an independent SEO consultant, having Claude Code set up is invaluable.

Starting your journey with Claude Code begins by creating an account on Claude.ai. Even without a paid subscription, I find the platform extremely helpful for generating SEO reports.
```json
{
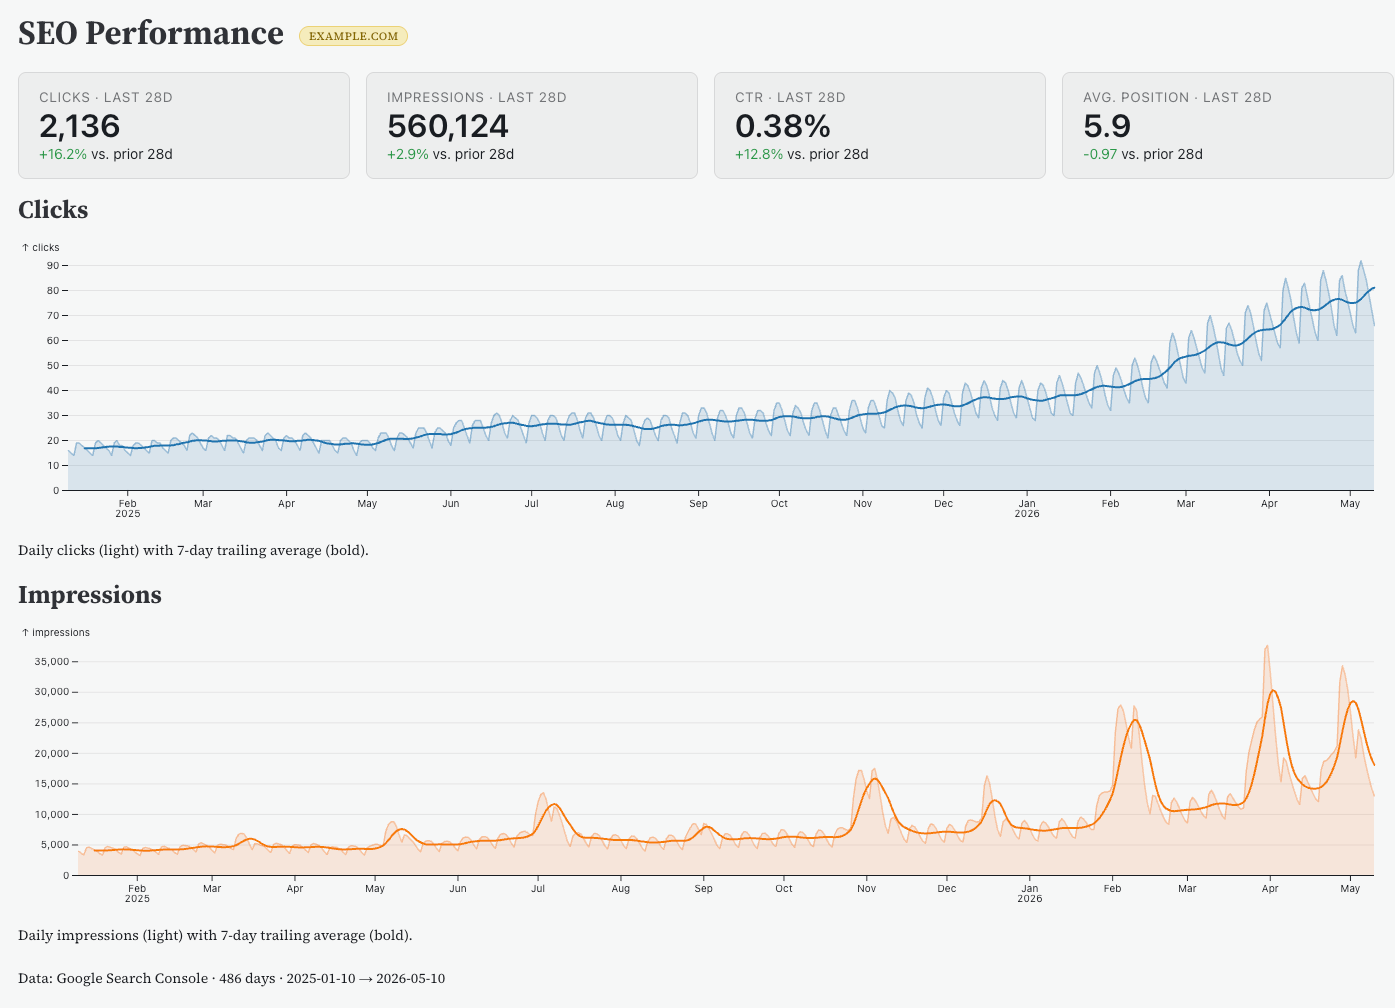
  "alt": "SEO performance graph showing clicks and impressions trends over time from January 2025 to May 2026.",
  "caption": "Explore the upward trends in SEO performance from January 2025 to May 2026, showcasing a steady increase in clicks and impressions, hinting at improved strategies.",
  "description": "This image showcases a detailed SEO performance analysis for example.com, spanning from January 2025 to May 2026. The upper graph indicates daily clicks with a notable increase, depicted with a light blue line and a bold 7-day average. The lower graph illustrates daily impressions, highlighting fluctuations with peaks in mid-2025 and early 2026, represented by a light orange line. Key metrics from the last 28 days include 2,136 clicks, 560,124 impressions, 0.38% CTR, and an average position of 5.9."
}
```

A crucial step in using Claude Code is installing Node.js on your machine. For this tutorial, I used a Mac, but it’s compatible with other operating systems too. Once Node.js is installed, I am able to install Claude Code and verify my setup through simple terminal commands.

After setting everything up, I navigated a series of prompts in Claude, choosing how to access GSC data and defining key parameters for my reporting.
```json
{
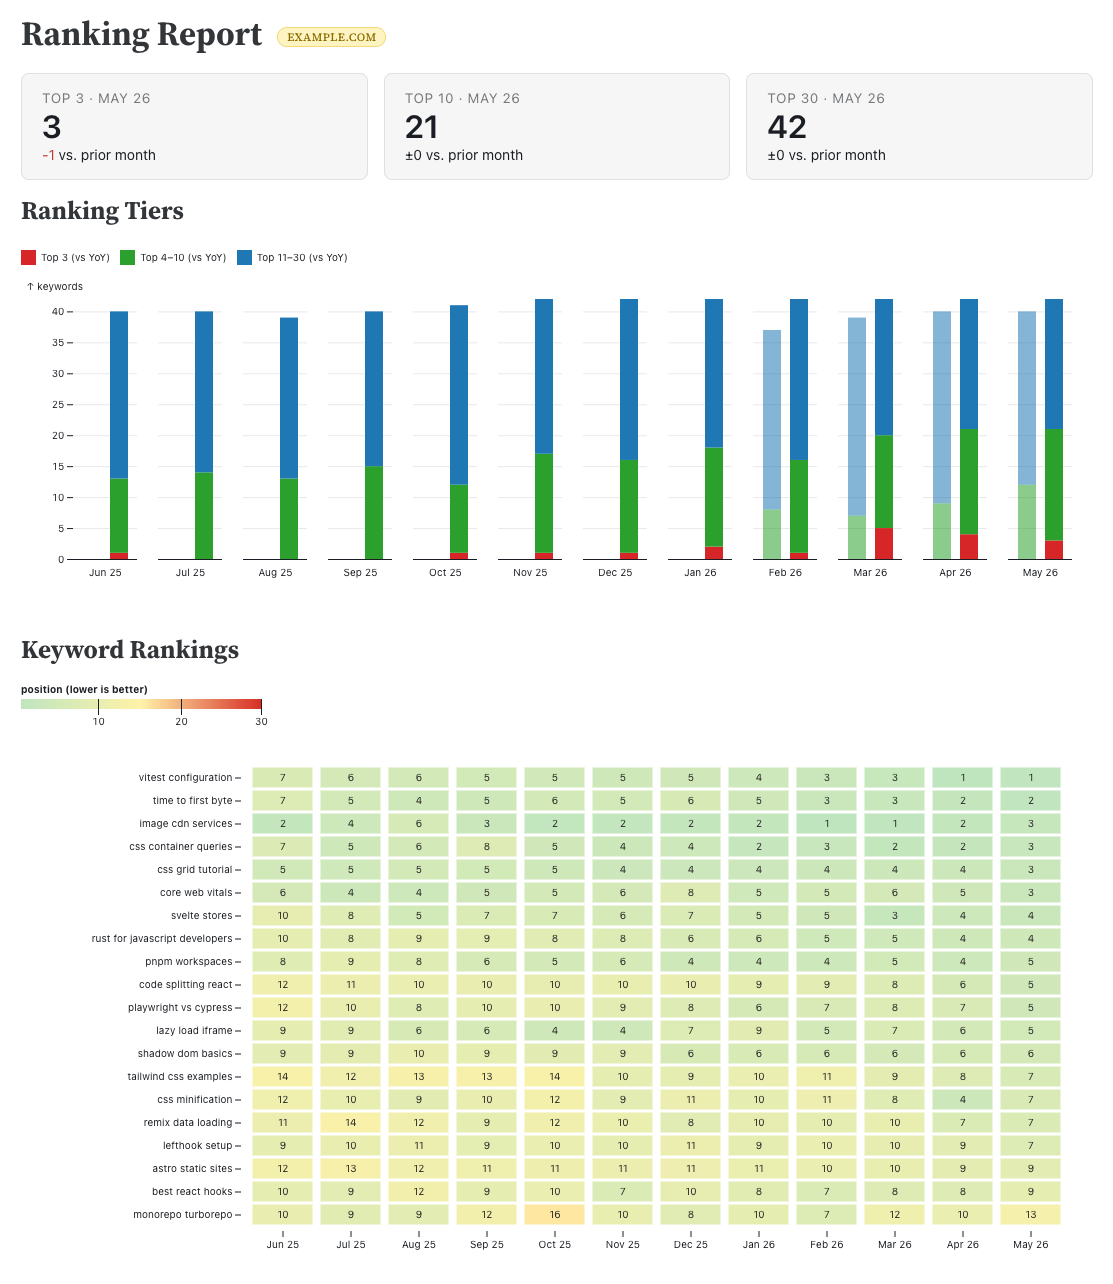
  "alt": "Website ranking report showing data for top 3, top 10, and top 30 positions with keyword rankings and monthly bar chart analysis.",
  "caption": "Monitor your SEO performance with this detailed ranking report, showcasing keyword positions and monthly trends for top search results.",
  "description": "This image displays a ranking report for a website, including data for top 3, top 10, and top 30 positions as of May 26. It features a bar chart illustrating ranking tiers over several months, showing keywords distributed in top 3 (red), top 4-10 (green), and top 11-30 (blue) categories. Below the chart, a detailed table lists keyword rankings by month, highlighting position changes. Essential for understanding SEO performance and tracking keyword success."
}
```

Connecting Claude to GSC involves interacting with the Search Console API, albeit a bit technical. But Claude guides me through each step, ensuring a smooth setup.

The exciting part comes after the connection is established. I can now rapidly create focused reports, such as identifying top-performing pages or tracking keyword trends over time, tailor-made for my needs.

Overall, Claude Code redefines how I manage SEO reporting. It offers the perfect balance of speed, flexibility, and control. Once the groundwork is laid, it makes my reporting both dynamic and precise, adapting to the demands of my stakeholders with ease.


Inspired by this post on Search Engine Land.


crushpress.ai community screenshot

FAQs

How does Claude Code help with Google Search Console reporting?

Claude Code can read GSC CSV files, analyze large datasets, and turn raw search data into clear visual reports. The article says this helps create customized data visuals and reports in much less time than manual spreadsheet and Data Studio workflows.

Is Claude Code different from the regular Claude.ai chatbot?

Yes. The article describes regular Claude.ai as a chatbot, while Claude Code works as an AI coding assistant on the user’s computer for tasks like reading CSV files and generating reports.

What setup is needed before creating custom SEO reports with Claude Code?

The article starts with creating an account on Claude.ai and installing Node.js on the machine. After Node.js is installed, Claude Code can be installed and the setup can be verified with simple terminal commands.

Is setting up Claude Code for SEO reporting technical?

The setup can feel daunting for people who are not familiar with technical tasks. The article frames it as a one-time effort, after which generating reports can take just minutes.

How does Claude Code connect to Google Search Console data?

The article explains that connecting Claude to GSC involves the Search Console API. Claude then guides the user through prompts to choose how to access GSC data and define reporting parameters.

What kinds of SEO reports can Claude Code create from GSC data?

The article gives examples such as reports for identifying top-performing pages and tracking keyword trends over time. It emphasizes focused, tailored reports that adapt to stakeholder needs.

Comments

Leave a Reply

Your email address will not be published. Required fields are marked *