I recently dove deep into the fascinating world of ChatGPT Ads with insights from Adthena. It turns out, the advertising space on ChatGPT is a treasure trove of competitive information that many search teams are missing out on.
Your competitors are running stealth campaigns via ChatGPT, and the frustrating part is that it’s not immediately visible what they’re bidding on or what creative strategies they’re adopting. Unlike Google Ads, there’s no native way—yet—to get a behind-the-scenes look at this in ChatGPT.
When OpenAI launched advertising within AI-generated responses, brands jumped on board quickly. With the Ads Manager and lowered spending thresholds, this new ad channel grew rapidly. And with plans to expand to U.K. markets soon, there’s a quickly closing window for early adopters to gain a significant advantage.
From the start, we’ve been closely monitoring these developments, and what we’ve found is eye-opening.
What Does the Current ChatGPT Ads Landscape Look Like?
Our analysis spans nearly a million queries across 20 industries in five markets, telling a clear story of the current landscape.
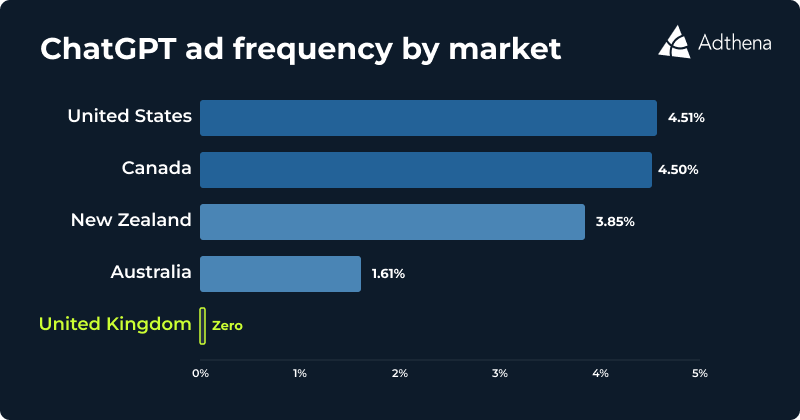
It’s Primarily a U.S. Channel—Other Markets are Catching Up
In the U.S., ads are run on about 4.5% of queries. In contrast, during the same period, the U.K. had none. The U.S. dominates, accounting for 90% of ChatGPT ad placements in our dataset, with Canada and New Zealand also active and Australia at 1.6%.
For U.K. teams, it means while the channel isn’t live yet, U.S. competitors are already fine-tuning prompts and creative strategies, placing them at a strategic advantage when the U.K. market opens.
The Majority of Responses Contain Just One Ad
On average, ChatGPT presents only 1.06 ad items per response in the U.S., implying a single sponsored slot per query. This level of exclusivity changes the game completely compared to multi-slot Google Ads.
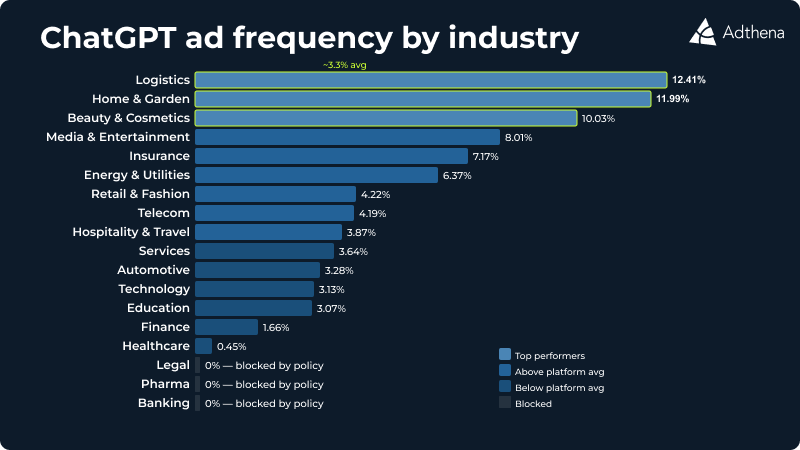
Industry Restrictions Still Apply
Certain sectors, like Legal and Pharma, show no ad activity due to what seems to be OpenAI’s deliberate restrictions, although this could change, providing proactive teams an edge.
Unexpected Hot Categories
Logistics, Home & Garden, and Beauty & Cosmetics are leading in ad frequency, indicating high potential for growth in these sectors.
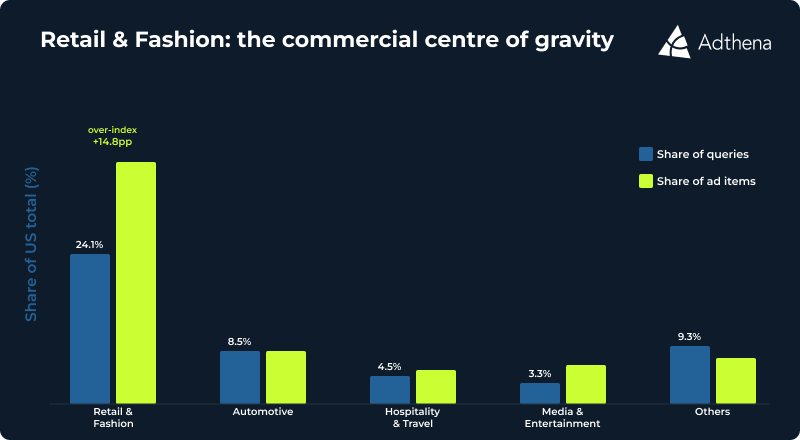
Retail Leads in Ad Spend
Retail & Fashion accounts for a vast share of U.S. ad items, indicating robust advertiser demand, far surpassing the national average. This suggests the significant investments made by retail brands in this space.
Current Challenges in Competitive Intelligence
Without tools like Auction Insights, understanding your competitive landscape on ChatGPT is practically impossible. You’re spending budget where you can barely track competitor activity. It’s a gap that Adthena aims to close.
Achieving Full Market Visibility with Adthena
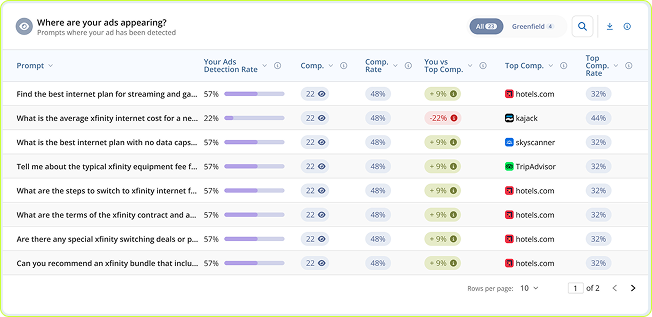
Adthena’s ChatGPT Ads Intelligence offers broader insights by monitoring a plethora of prompts daily, providing a competitive overview previously unavailable.
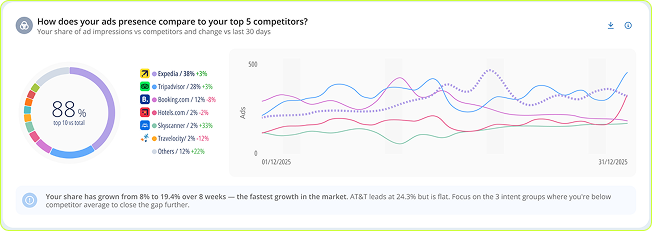
You can now see who bids on your prompts, track share of voice, and spot open prompts ripe for targeting before competitors do.
In a new and rapidly evolving channel, being an early mover is an opportunity that shouldn’t be missed. Try ChatGPT Ads Intelligence free for 21 days and unlock the full potential of your advertising strategy.
Beyond Just ChatGPT: Expanding Your Search Horizons
As users move towards AI-driven searches for high-intent queries, such as product recommendations, it’s essential for search practitioners to adapt. Simply put, the game is changing.
If you’re attentive to ChatGPT Ads now, you’ll be hard to budge later. Our data shows a window of opportunity open now, similar to the early days of Google Ads. Capitalize on this before it closes.
Start your free 21-day trial of Adthena’s ChatGPT Ads Intelligence today to discover what’s unfolding in the ChatGPT ad space.
Inspired by this post on Search Engine Land.

Leave a Reply