
I often find that platform reporting can lead me astray when trying to gauge the real impact of Demand Gen creative. To get a clear picture, conducting controlled experiments can validate if my creative work genuinely boosts conversions.
Demand Gen campaigns shine across YouTube, Discover, and Gmail, but they also bring a challenge—what I call the “attribution illusion.” It’s frequent for me to question whether reported conversions are truly incremental or if users would have converted through search regardless.
Google introduced asset uplift experiments in November, allowing me to measure the impact of my Demand Gen creative using an A/B split test. This feature helps replace assumptions with clearer insights into what’s truly driving results.
Relying heavily on creative instinct or standard reporting can misdirect efforts and waste valuable resources on underperforming assets. Google’s A/B testing capabilities empower me to isolate the impact of individual assets, preventing such outcomes.
Why attribution doesn’t equal incrementality
For example, if someone views a Demand Gen ad on YouTube but doesn’t click, only to search for my brand later and convert, Google might still credit the Demand Gen campaign. This attribution reflects correlation more than causation.
To measure accurately, I need to understand the scenario without showing the creative. Withholding test assets from a portion of the target audience helps establish a baseline.
The difference in conversion rates, or any key KPI between groups exposed to the ad and those not, reveals the actual incremental lift the creative drives.
Dig deeper: Why incrementality is the only metric that proves marketing’s real impact
What you need before testing creative uplift
Launching experiments without enough data for statistical significance is a common misstep. Before testing, I ensure campaigns meet necessary prerequisites to avoid inconclusive or invalid results.
Conversion volume
Google suggests having at least 50 conversions across test groups during the experiment for accurate lift measurement. If primary conversions fall short, I consider optimizing the test around micro-conversions like “Add to Cart.”
Budget minimums
Experiments require continuous, uninterrupted spending. A limited budget stopping my campaign early skews data for the control group.
The campaign budget must be sufficient to run for at least four weeks or until statistically significant results are achieved.
Creative isolation

I test one new variable at a time to determine if a specific asset drives uplift, keeping all other campaign elements unchanged.
Dig deeper: Why Demand Gen is the most underrated campaign type in Google Ads
How to run an asset uplift test in Google Ads
Running a creative uplift test in Google Ads is now more streamlined. Here’s how I set up a valid experiment.
1. Define a clear hypothesis
Each scientific test starts with a clear hypothesis. I avoid tests without defined objectives. For example:
- Bad hypothesis: “Let’s see if our new video works.”
- Good hypothesis: “Adding user-generated content (UGC) to our Demand Gen asset group will drive a 10% incremental lift in ‘purchase’ conversions compared to standard static image carousels.”
Navigate to the Experiments interface
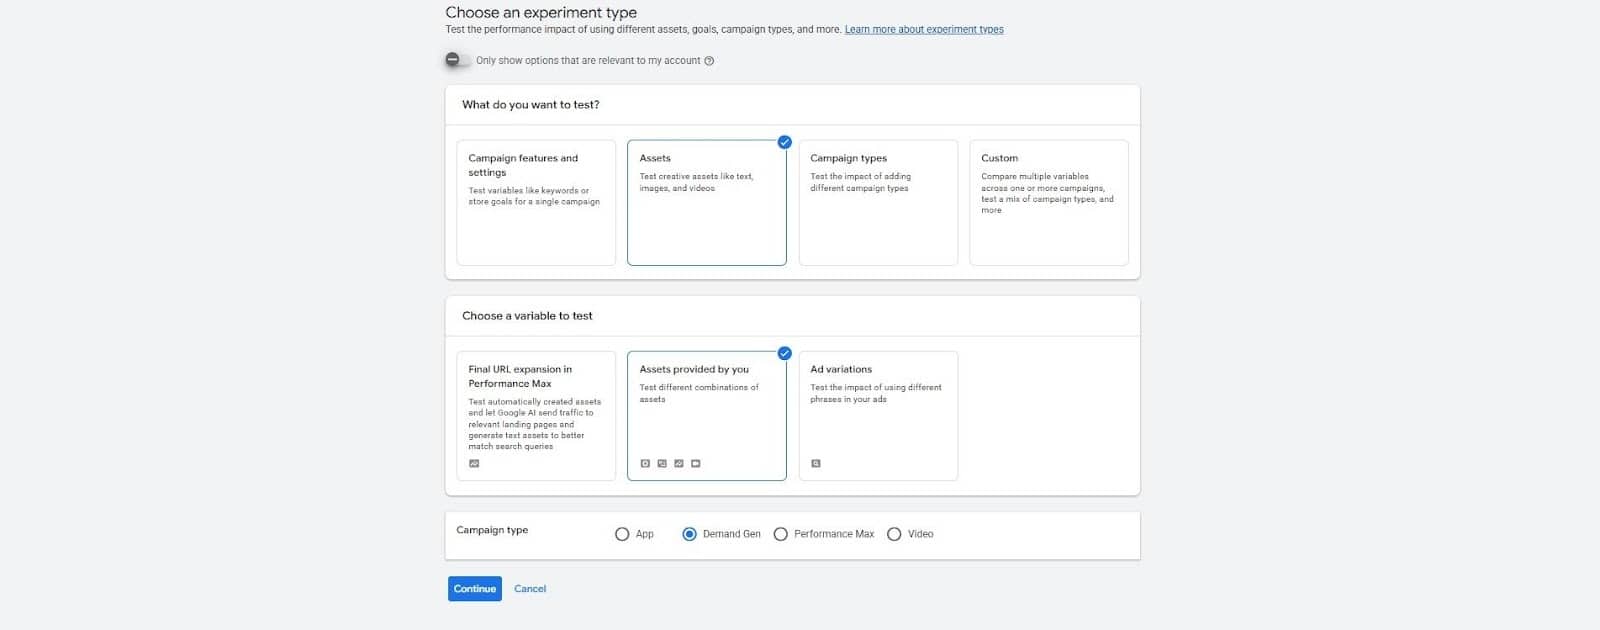
In my Google Ads account, I navigate to Campaigns > Experiments. I create a new experiment, selecting Asset tests provided by you for a Demand Gen campaign.
Configure a 50/50 split
I define a 50/50 cookie-based split to ensure both groups have equal historical data and algorithm weighting, preventing users from being in both test arms.
My existing campaign becomes the control, and the new asset campaign serves as the treatment.
Lock your variables
Once started, I practice extreme discipline by not altering audiences, targeting, or making drastic bid and budget changes.
Any changes during the test can introduce noise, affecting the statistical significance of results.
Set the duration
I run experiments for at least four weeks. Week 1 is a learning period, and Weeks 2 to 4 provide actionable data.
Longer conversion cycles in B2B SaaS might require six to eight weeks.
Dig deeper: What it takes to make demand gen work for B2B and ecommerce
What your experiment results actually mean
Upon completion, I review the Experiments dashboard for each arm’s performance and confidence intervals across metrics to validate my hypothesis.
Outcome 1: Positive lift (statistically significant)
A positive lift with 95% confidence means my creative asset adds real value. I calculate incremental cost per acquisition (iCPA) by dividing the treatment group’s ad spend by incremental conversions over the control.
This iCPA becomes my benchmark for further scaling.
Outcome 2: Negative lift
Creatives may underperform, perhaps being too disruptive or skipped in ads. Pausing these assets is crucial to let data direct budget choices over personal preference.
Outcome 3: Inconclusive result
If results are negligible and don’t confidently attribute conversions after four weeks, I might extend the test for more data. If still inconclusive, trying a drastically different creative asset is my next step.
Prove creative impact with incrementality testing
Creative remains a powerful differentiator for performance. Creating high-quality video or UGC is one thing, but proving its impact with scientific rigor strengthens my creative decisions.
Asset uplift experiments provide evidence of Demand Gen’s budget worthiness to stakeholders. When I start with a holdout test, establish a baseline, and let data guide my creative roadmap, the results speak for themselves.
Dig deeper: The Google Ads Demand Gen playbook
Inspired by this post on Search Engine Land.

Leave a Reply