
A 3% LinkedIn ad conversion rate can be healthy or seriously under target. If the click goes to your website, 3% is close to the broad landing-page average. If you use a LinkedIn Lead Gen Form, the same result is far below the platform benchmark.
That distinction is the starting point for every useful comparison. Once you separate the conversion path, you can judge your format, offer and audience against the right peer group, then decide whether the real constraint is the ad, the conversion experience or lead quality.
Start with the conversion path, not the account average
Across all measured formats, LinkedIn Lead Gen Forms converted 11.9% of clicks, compared with 3.0% for website landing pages. At those rates, 1,000 clicks would produce about 119 on-platform form submissions or 30 website conversions.
| Conversion path | Average conversion rate | Conversions per 1,000 clicks at benchmark | Best comparison |
|---|---|---|---|
| LinkedIn Lead Gen Form | 11.9% | About 119 | Other on-platform forms with a similar offer |
| Website landing page | 3.0% | About 30 | Other website campaigns with the same conversion action |
The gap is mostly a difference in friction. A Lead Gen Form opens within LinkedIn and can prefill information from the member’s profile. A website click introduces a page load, a new interface and usually more fields or decisions. The form benchmark is therefore not evidence that every advertiser should keep people on LinkedIn. It shows that you should never combine on-platform and website conversions into one rate and call the result healthy or unhealthy.
Keep the conversion action equally strict as well. A newsletter signup, webinar registration and demo request may all appear as conversions in a dashboard, but they represent different levels of commitment. Renaming them all as leads does not make them comparable.
Use a range when forecasting rather than treating 11.9% or 3.0% as a promise. Lead Gen Form rates moved from 12.5% in Q1 2025 to 11.2% in July and August 2026. Website rates stayed within a narrower 2.8% to 3.3% range. For a planning model, those observed ranges are more defensible than assuming every future click will convert at the overall average.
These numbers are directional, not universal. The underlying pool covered 1,240 campaigns from 186 B2B and B2C advertisers, $38.4 million in spend and about 2.9 million clicks in North America and Europe. Your auction, geography, sales motion and measurement rules can produce a materially different result.
Choose a format benchmark that matches the ad’s job
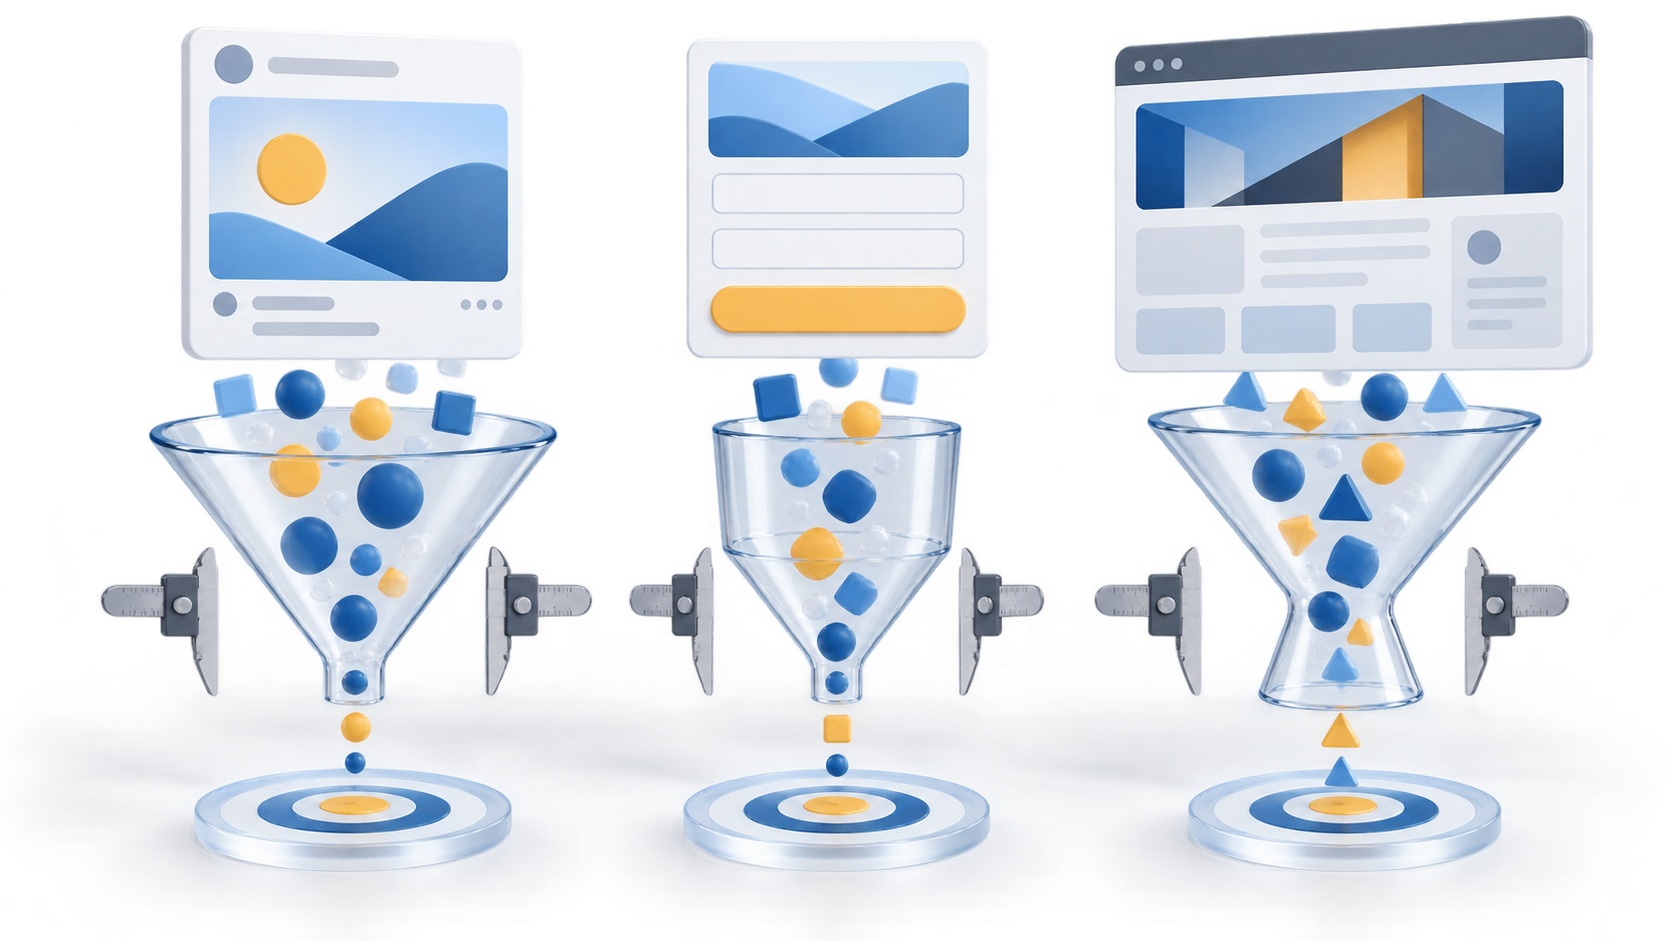
The all-format average can hide a format problem. Thought Leader Ads generated more than twice the average click-through rate, while Text Ads and Spotlight Ads produced very low click-through and landing-page conversion rates. Compare your campaign with the row that matches both its format and destination.
| LinkedIn ad format | Lead Form or on-platform rate | Landing-page rate | Average CTR | Average CPL |
|---|---|---|---|---|
| Single Image Ads | 11.9% | 3.2% | 0.53% | $141 |
| Thought Leader Ads | 13.1% | 3.7% | 1.08% | $87 |
| Video Ads | 9.6% | 2.5% | 0.39% | $186 |
| Document Ads | 14.7% | N/A | 0.71% | $94 |
| Carousel Ads | 10.4% | 2.8% | 0.47% | $167 |
| Text Ads | N/A | 1.9% | 0.03% | $214 |
| Spotlight Ads | N/A | 2.3% | 0.08% | $198 |
| All formats | 11.9% | 3.0% | 0.55% | $144 |
The format-level benchmarks from January 2025 through August 2026 make Document Ads and Thought Leader Ads the clearest direct-response starting points. Document Ads had the highest on-platform conversion rate at 14.7%. Thought Leader Ads paired a 13.1% form rate with a 1.08% CTR and the lowest format-level CPL, $87. Both formats let the audience consume something useful before contact information becomes the next step.
Single Image Ads are a sensible control because their 11.9% Lead Gen Form conversion rate matches the aggregate benchmark. Video and Carousel Ads came in below that control on conversion rate and CPL. That does not make them inherently poor formats; it means they need to justify their place through a different objective or outperform their own format baseline.
Read CTR and conversion rate as two separate handoffs. Low CTR with acceptable post-click conversion points toward the audience, opening message or creative. Healthy CTR with weak conversion points toward an expectation mismatch, an unattractive offer or unnecessary friction after the click. If both rates are healthy but CPL remains high, inspect the price of the traffic and the breadth of your targeting before rebuilding the landing page.
Do not switch formats on conversion rate alone. A move from a high-CPL format to a lower-CPL format is only an improvement if lead acceptance and downstream qualification hold. Preserve those fields in your test reporting so a cheaper form fill cannot quietly replace a more valuable buyer.
Judge the offer by cost per qualified opportunity

The offer creates a larger benchmark swing than the ad format. Low-commitment assets attract more submissions, while high-intent actions such as demos convert fewer clicks. That is expected. The useful question is what each route costs when the lead reaches your sales qualification standard.
| Offer | Lead Gen Form rate | Landing-page rate | Average CPL | Lead-to-SQL rate | Average cost per SQL |
|---|---|---|---|---|---|
| Original research or benchmark report | 16.8% | 5.7% | $68 | 5.9% | $1,153 |
| Webinar registration | 13.2% | 4.4% | $96 | 7.6% | $1,263 |
| Demo request | 4.8% | 2.1% | $318 | 22.7% | $1,401 |
| Consultation or assessment | 5.6% | 2.4% | $284 | 19.4% | $1,464 |
| Free trial | 6.9% | 2.6% | $231 | 14.2% | $1,627 |
| Ebook or guide | 15.9% | 5.3% | $74 | 4.1% | $1,805 |
| Event or conference registration | 9.7% | 3.1% | $122 | 6.3% | $1,937 |
The table exposes why conversion rate is not a business outcome. An ebook or guide converted 15.9% of Lead Gen Form clicks and cost $74 per lead, yet only 4.1% of those leads became sales-qualified. Its resulting cost per SQL was $1,805. A demo request converted only 4.8% and cost $318 per lead, but its 22.7% qualification rate brought cost per SQL down to $1,401.
Original research or a benchmark report produced the strongest combined result: 16.8% Lead Gen Form conversion, $68 CPL and $1,153 per SQL. That does not mean placing the words “benchmark report” on an ordinary ebook will reproduce the result. The offer has to contain information the buyer cannot get from a routine product page, and it has to connect naturally to the problem your company solves.
Use the relationship between CPL and qualification rate in your planning model:
Cost per SQL = cost per lead divided by the lead-to-SQL rate expressed as a decimal.
The same relationship works in reverse. Multiply your allowable cost per SQL by your expected lead-to-SQL rate to find the maximum CPL the campaign can sustain. This prevents an arbitrary CPL target from penalizing high-intent offers or rewarding assets that produce many names but little pipeline.
Keep educational and high-intent campaigns in separate reporting groups. Benchmark reports, webinars and guides should be judged on both capture efficiency and eventual qualification. Demos, assessments and trials should be judged on qualified yield and cost per SQL, even when their initial conversion rates look low.
Adjust expectations for industry and audience difficulty
Your industry changes what a realistic result looks like. Higher education, nonprofits and staffing campaigns combined high conversion rates with comparatively low CPLs. Legal, IT services and cybersecurity campaigns faced lower form conversion and substantially higher lead costs. A single account-wide target would misclassify both ends of that range.
| Industry | Lead Gen Form rate | Landing-page rate | Average CPL |
|---|---|---|---|
| Higher education | 15.6% | 4.6% | $72 |
| Nonprofit | 14.4% | 4.3% | $63 |
| Staffing and recruiting | 13.7% | 4.1% | $86 |
| Insurance | 13.1% | 3.8% | $171 |
| Financial services | 12.6% | 3.4% | $196 |
| Manufacturing and industrial | 12.2% | 3.5% | $118 |
| Logistics and supply chain | 11.8% | 3.3% | $109 |
| Professional services and consulting | 11.4% | 3.2% | $152 |
| Software and SaaS | 10.9% | 2.7% | $178 |
| Healthcare and medical technology | 10.3% | 2.9% | $163 |
| IT services and cybersecurity | 9.8% | 2.3% | $214 |
| Legal | 8.7% | 2.6% | $246 |
Use the industry benchmark closest to your actual buyer and offer, not whichever row makes performance look best. A legal campaign at an 8.7% Lead Gen Form rate is sitting on its industry average even though it falls well below the 11.9% all-format baseline. Conversely, a higher-education campaign at 11.9% would match the broad average but trail its 15.6% industry result.
Seniority and company size add another layer. Conversion rates declined as targeted seniority and employer size increased. Senior buyers at large organizations are frequently targeted, have more at stake in revealing buying intent and often operate inside longer purchasing processes. If your campaign is restricted to that audience, compare it with earlier campaigns aimed at the same segment before treating the broad industry average as a requirement.
Build your comparison set in this order: conversion path, offer, format, industry, then audience seniority and company size. The closer the match, the more diagnostic the benchmark becomes. When no exact peer exists, use the broader number as a starting range and let your own consistently defined campaign history become the operating baseline.
Key takeaways: turn the benchmark into a decision
- Use 11.9% for LinkedIn Lead Gen Forms and 3.0% for website landing pages only as broad starting points. Never blend the two conversion paths.
- Compare formats separately. Document Ads reached 14.7% on-platform conversion, while Thought Leader Ads combined 13.1% form conversion with a 1.08% CTR and $87 CPL.
- Do not optimize for form fills alone. A demo’s 4.8% conversion rate produced a lower cost per SQL than the 15.9% conversion rate for ebooks and guides.
- Adjust for the market you actually target. Industry Lead Gen Form benchmarks ranged from 8.7% for legal to 15.6% for higher education, with senior and large-company audiences generally converting less often.
- Diagnose the funnel in order: CTR, click-to-conversion rate, CPL, lead-to-SQL rate and cost per SQL. Fix the first weak handoff instead of changing every campaign component at once.
Before your next campaign review, label every campaign by conversion path, format, offer and audience segment. Put CTR, conversion rate, CPL, lead-to-SQL rate and cost per SQL in the same view. You will then be able to see whether you need a stronger ad, less conversion friction, a better offer or tighter qualification.
Make the smallest change that addresses that handoff, and keep the rest stable long enough to preserve a meaningful comparison. The goal is not to beat a universal LinkedIn number. It is to produce more qualified buying opportunities at an economics your business can sustain.
References

Leave a Reply