
Unlocking Content Success: Mentions, Citations & Clicks in 2026

```json
{
  "alt": "Illustration of a person and a robot discussing mentions and citations in a digital interface.",
  "caption": "Human meets AI: A digital collaboration exploring mentions and citations in a futuristic interface.",
  "description": "This digital illustration depicts a person and a robot interacting with large floating screens labeled 'Mentions' and 'Citations'. The futuristic setting emphasizes a pathway of digital connectivity, symbolizing collaboration between human intelligence and artificial intelligence. Keywords like CTR, API, and MCP are subtly integrated, enriching the scene with technological context."
}
```

In my new content strategy for 2026, I’ve learned that the focus now lies in the signals models perceive, rather than the pages users visit. It’s crucial to adapt our content before digital agents dominate the journey.

Generative systems like ChatGPT, Gemini, Claude, and Perplexity have started reshaping the discovery phase. This stage once drove millions to our websites, but now it’s all about getting referenced in models.
```json
{
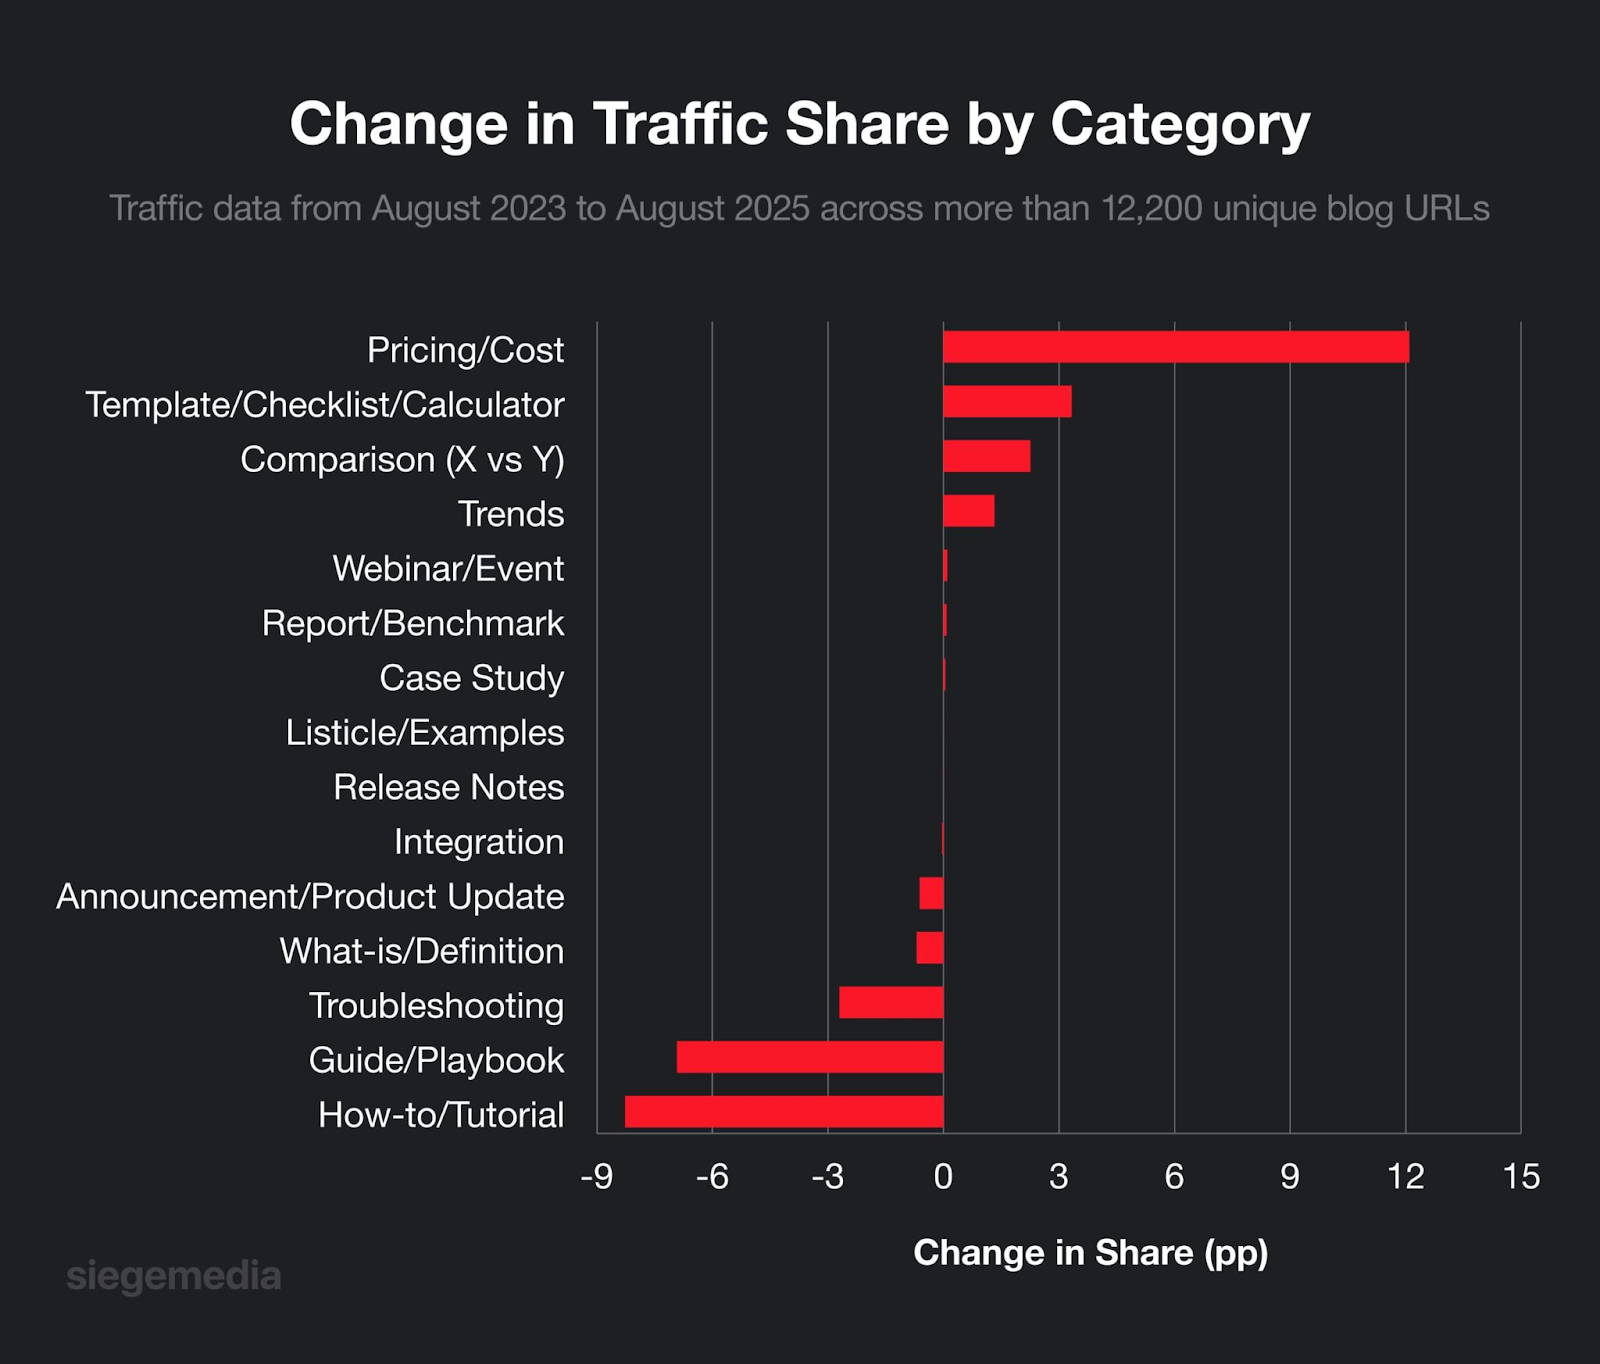
  "alt": "Bar chart showing change in traffic share by content category from August 2023 to August 2025, highlighting pricing/cost and template categories.",
  "caption": "Intriguing shifts in blog traffic! Pricing and templates see the highest growth, while tutorials and guides face a decline from 2023 to 2025.",
  "description": "This bar chart illustrates the change in traffic share by content category from August 2023 to August 2025, based on data from over 12,200 blog URLs. Categories such as Pricing/Cost and Templates/Checklists/Calculators saw significant increases in traffic share, while How-to/Tutorials and Guide/Playbook categories experienced declines. The chart provides valuable insights for content strategists and marketers aiming to optimize their focus areas. Keywords: traffic share, content category, blog analysis, digital marketing trends, content strategy."
}
```

Metrics like impressions, sessions, and CTR are still important but tell an incomplete story. Mentions, citations, and structured visibility signals are emerging as the trustworthy paths to revenue.
```json
{
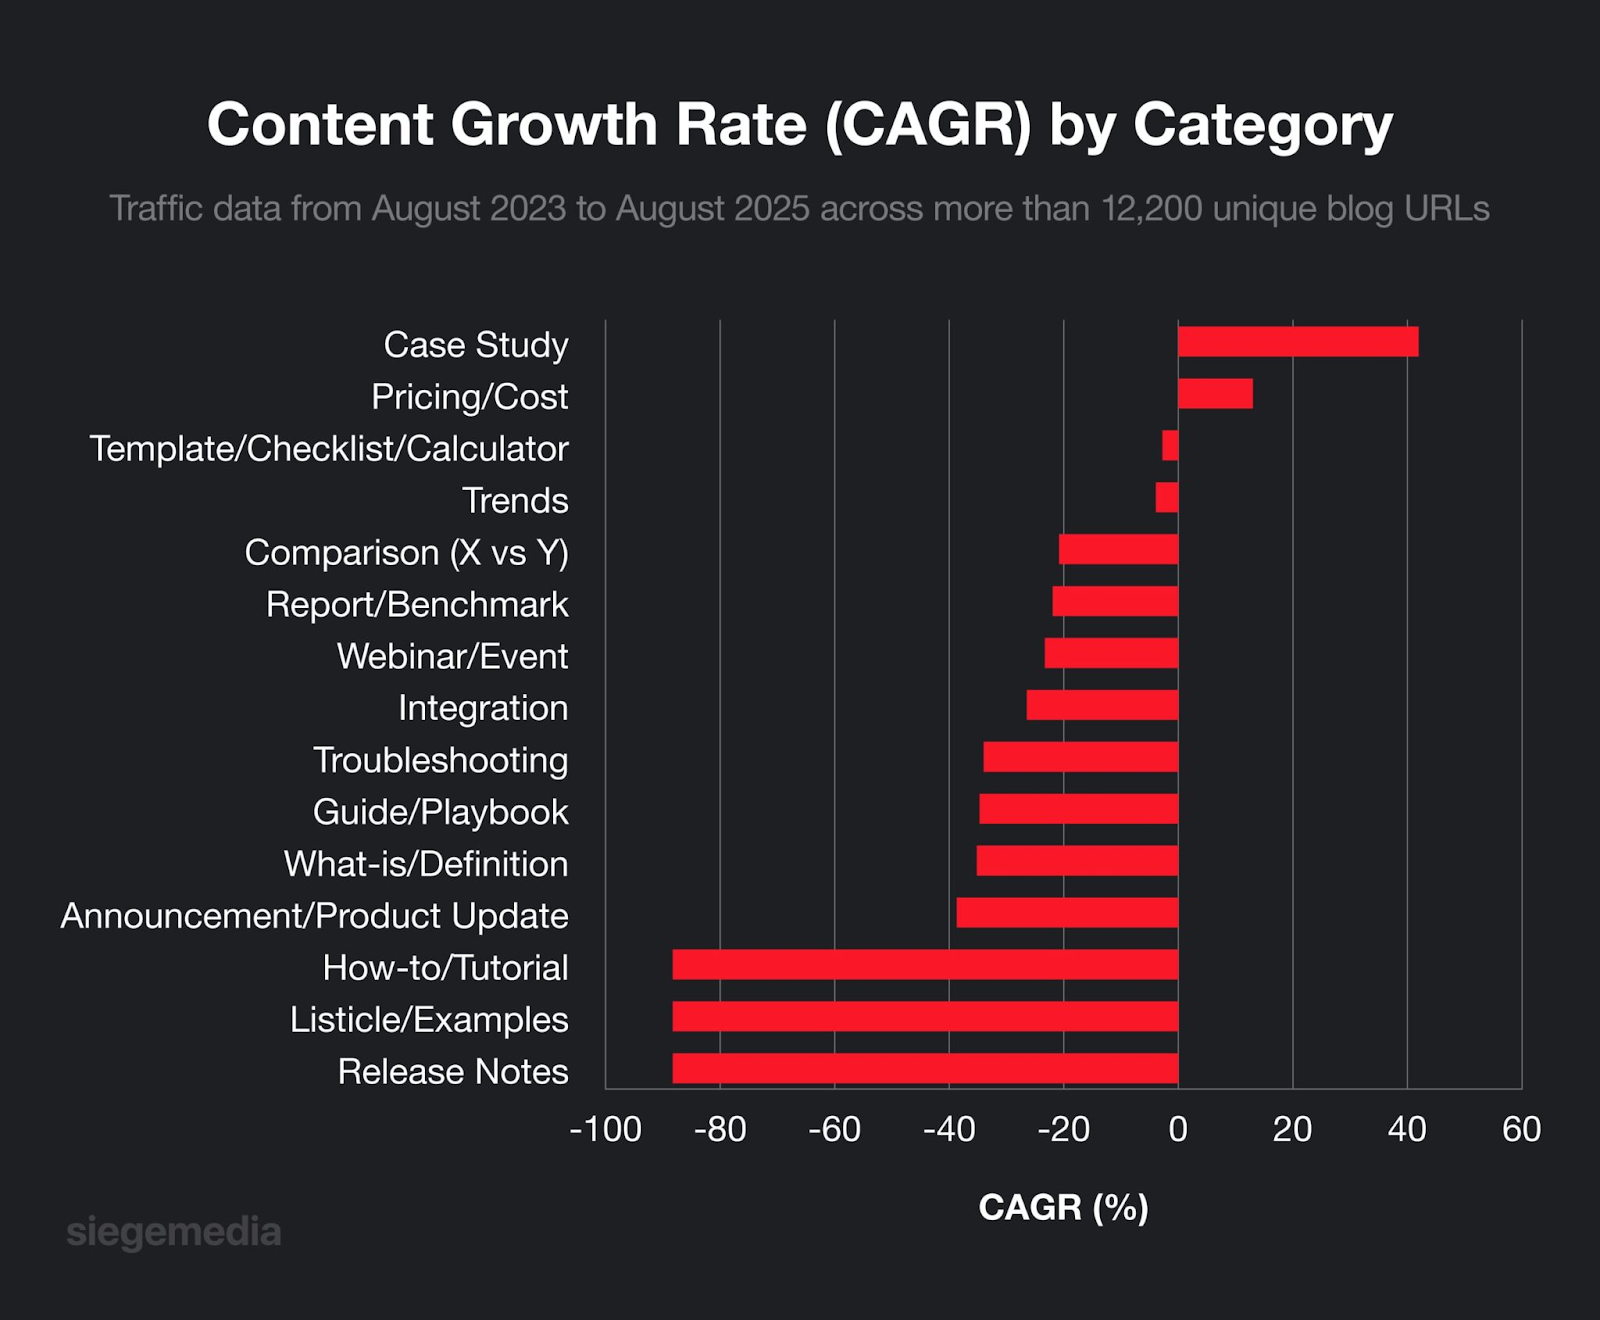
  "alt": "Bar chart showing content growth rate (CAGR) by category from August 2023 to August 2025.",
  "caption": "Explore the varied content growth rates by category from August 2023 to 2025. Discover which types like Case Studies and Trends are leading the pack and which are falling behind.",
  "description": "This bar chart illustrates the content growth rate (CAGR) by category from August 2023 to August 2025, based on traffic data across over 12,200 blog URLs. Categories like Case Study and Trends show significant growth, while others such as How-to/Tutorial and Release Notes experience declines. This insightful analysis by siegemedia provides a clear view of content trend dynamics over a two-year span."
}
```

In this article, I’ve compiled insights from Siege Media’s content performance study, Grow and Convert’s findings on conversion, Seer Interactive’s AI research, and firsthand experiences within generative platforms. They guide us on how visibility, engagement, and purchasing intent are reshaping as AI covers more of the user journey.

```json
{
  "alt": "Bar chart showing engagement rates of content types like trends, updates, guides, comparisons, and case studies.",
  "caption": "Discover which content types are driving engagement! Trends and updates lead the way, outperforming guides and comparisons in boosting interaction.",
  "description": "This bar chart illustrates engagement rate improvements for different content types from August 2023 to August 2025, analyzing over 12,200 blog URLs. The data reveals that 'Trends' and 'Announcements/Product Updates' show the highest engagement improvements, followed closely by 'Guide/Playbook' and 'Comparison (X vs Y)'. The chart is a resourceful insight for content strategists aiming to boost user interaction with effective content."
}
```

The team at Siege Media conducted an extensive performance analysis across various industry blogs, covering more than 7.2 million sessions. Kudos to them for sharing such a substantial dataset with us.

```json
{
  "alt": "A robotic figure with glowing eyes and metal hands gestures with the text 'But wait, there's more!' in bold.",
  "caption": "This robot is ready to deliver unexpected surprises with the classic phrase 'But wait, there's more!'",
  "description": "The image features an animated robotic character with glowing yellow eyes and metal hands, dressed in a blue shirt. The robot stands in a kitchen setting, gesturing animatedly. Above and below it, the text reads 'But wait, there's more!' in bold, capital letters. This image plays on the classic infomercial trope, implying that there's an exciting twist or additional element yet to be revealed. Keywords: robot, glowing eyes, gesture, blue shirt, infomercial, surprise."
}
```

Notably, the data is focused on blog content, which may not align perfectly with other formats such as videos or landing pages.

```json
{
  "alt": "Illustration of a chef with a conversion funnel using tofu cubes, moving from discover to decide stages.",
  "caption": "From tofu blocks to decisive bites, this creative infographic illustrates the stages of customer engagement, paralleling a marketing funnel.",
  "description": "This image features a chef preparing tofu cubes on a tray, symbolizing the stages of a marketing funnel: 'Discover & Awareness,' 'Consider & Explore,' and 'Decide & Convert.' The process is visually represented by several cubes on a tray to a single cube on a plate, illustrating the journey from expanding reach to final decision-making. Keywords: marketing funnel, conversion stages, customer journey, tofu metaphor."
}
```

Here’s what I’ve learned from their findings.

```json
{
  "alt": "Bar graph comparing BOTF and TOF traffic pageviews.",
  "caption": "This bar chart highlights the stark difference between BOTF and TOF traffic in terms of pageviews, with TOF towering over BOTF.",
  "description": "A bar graph titled 'BOTF vs. TOF Traffic (Pageviews)' showing comparative pageview data. The red bar represents BOTF traffic with a lower count, while the blue bar shows significantly higher TOF traffic. The Y-axis is labeled with pageview counts ranging from 0 to 250,000. This visual emphasizes the disparity in traffic sources, useful for digital marketing analysis and strategy development."
}
```

TL;DR of the Siege Media Study

Pricing and cost-related content has shown the strongest growth, contrasting the sharp decline of top-of-funnel guides and “how-to” posts. It appears pricing pages have risen at the expense of TOFU content, but I see it differently. As user habits change, buyers are now likely to initiate research generatively and only move to high-intent queries as they near a decision.

```json
{
  "alt": "Bar graph comparing BOTF and TOF conversion rates, with BOTF at 4.78% and TOF at 0.19%.",
  "caption": "Comparing conversion rates: BOTF significantly outperforms TOF with a rate of 4.78% versus 0.19%. Discover the factors behind this stark difference.",
  "description": "This bar graph illustrates a comparison between BOTF (Bottom of the Funnel) and TOF (Top of the Funnel) conversion rates. The BOTF conversion rate stands at 4.78%, shown with a tall red bar, while the TOF conversion rate is markedly lower at 0.19%, depicted by a short blue bar. The chart highlights the stark effectiveness difference in conversion strategies between the two funnel stages, making it a valuable resource for marketers aiming to optimize conversion tactics. Keywords: conversion rate, BOTF, TOF, marketing funnel, graph."
}
```

The data highlights substantial growth in pricing and comparison content, whereas traditional guides have significantly declined. We’ll revisit this trend later.

```json
{
  "alt": "ChatGPT interface showing a conversation about planning a trip to the Outer Banks.",
  "caption": "Explore the serene beauty of the Outer Banks with a personalized travel plan created to suit your desires for relaxation and adventure.",
  "description": "This image captures a ChatGPT interface discussing a travel plan to the Outer Banks, North Carolina. The conversation highlights the region's 175-mile stretch of barrier islands known for their sandy beaches, lighthouses, seaside towns, and wild horses. The interface prompts further planning based on user preferences and budget. Keywords: Outer Banks, travel plan, ChatGPT, North Carolina attractions."
}
```

Despite setbacks in certain content forms, major categories are seeing increased engagement. Users are completing more research within generative engines, thus reaching sites with a higher intent and readiness to act.

```json
{
  "alt": "ChatGPT conversation recommending top Outer Banks rental companies for large groups.",
  "caption": "Discover the top Outer Banks rental companies perfect for hosting large groups, featuring options with pools, beach access, and more.",
  "description": "This image shows a ChatGPT conversation focused on recommending specific Outer Banks rental companies suitable for large groups of around 12 people. The list includes Sun Realty, Beach Realty & Construction, Carolina Designs Realty, and Resort Realty, highlighting features like large accommodations, oceanfront homes, and pet-friendly options. These companies offer a range of properties, including multi-bedroom homes ideal for family reunions or group getaways, with amenities such as beach access and private pools."
}
```

As a data-focused SEO professional, this could be an indicator to prioritize bottom-of-funnel content, but there’s more to consider…

```json
{
  "alt": "Line graph showing the growth of ChatGPT users from Nov 2022 to Sep 2025, with a steep increase after Jan 2024.",
  "caption": "The surge in ChatGPT's user numbers from November 2022 to September 2025 highlights its expanding impact, especially post-January 2024.",
  "description": "This line graph illustrates the growth in weekly active ChatGPT users across consumer plans (Free, Plus, Pro) from November 2022 to September 2025. The graph marks data points every six months, revealing a significant upward trend. Notable growth accelerates post-January 2024, reaching nearly 800 million users by September 2025. Keywords: ChatGPT, growth, users, consumer plans, timeline."
}
```

Don’t Forget the TOFU!

I never thought I’d say this, but keeping up with TOFU content is essential. We might need even more of it to ensure sustained visibility and engagement.

```json
{
  "alt": "Bar chart showing conversation topic shares divided into categories like Multimedia, Practical Guidance, Writing, and more.",
  "caption": "Explore the fascinating breakdown of conversation topics from over a million interactions, with Writing and Practical Guidance leading the charge.",
  "description": "This bar chart presents a detailed breakdown of conversation topic shares as defined in Table 3. Categories include Multimedia (6.0%), Practical Guidance (28.3%), Seeking Information (21.3%), and Writing (28.1%). Specific subcategories like Tutoring or Teaching (10.2%), Specific Info (18.3%), and Personal Writing or Communication (8.0%) offer deeper insights into user interactions. Data is sampled from approximately 1.1 million conversations between May 15, 2024, and June 26, 2025."
}
```

Reflecting on SEO’s legacy, we see how it has evolved over time. Grow and Convert’s research from 2023 indicates that despite high TOFU traffic, its conversion rates are notably lower compared to BOFU, a trend seen across channels like PPC.

```json
{
  "alt": "Animated scientist in lab coat enthusiastically addresses three robots seated at a table.",
  "caption": "Excitement fills the room as the animated professor shares thrilling news with a group of attentive robots.",
  "description": "A scene from an animated show where a bespectacled scientist in a white lab coat announces 'Good News, Everyone!' to three robots sitting at a table. The scientist's expressive gesture and the attentive robots create a humorous and lively atmosphere. This image captures a quintessential moment of excitement and surprise, ideal for themes of innovation and technology. Keywords: animated, scientist, robots, announcement, humorous."
}
```

Generative engines now manage most of the TOFU journey, often keeping users within platforms for research before they cross over for decision-specific interactions.

```json
{
  "alt": "Bar chart comparing conversion rates of AI platforms and Google Organic Search.",
  "caption": "AI platforms, including ChatGPT, showcase higher conversion rates than Google Organic Search, highlighting their growing influence in digital marketing.",
  "description": "This image is a bar chart titled 'Conversion Rates: AI vs. Google Organic Search' showing the conversion rates of various traffic sources. ChatGPT leads with 15.9%, followed by Perplexity at 10.5%, Claude at 5%, and Gemini at 3%. Google Organic trails at 1.76%. The chart, using shades of purple, illustrates the rising impact of AI in conversion efficiency. Keywords: AI, conversion rates, Google Organic, ChatGPT, digital marketing."
}
```

For example, when I used ChatGPT to plan a trip, it engaged me deeply in TOFU and MOFU stages. This involved numerous opportunities to encounter new brands before reaching my final decision.

```json
{
  "alt": "A suited man with sunglasses stands confidently with text reading 'Never Send A Human To Do A Machine's Job.'",
  "caption": "In the realm of machines, humans may not always be up to the task. This image captures the essence of technology's rising dominance.",
  "description": "The image features a suited man wearing sunglasses, exuding confidence and authority. Accompanied by the impactful text 'Never Send A Human To Do A Machine's Job,' it highlights the theme of technological superiority. The dark background adds to the serious tone, providing a dramatic and intense atmosphere. Keywords: machine, human, technology, superiority, authority."
}
```

The pivotal learning here is that TOFU and MOFU interactions set the stage for conversion decisions. This dynamic reveals the importance of being part of the TOFU stage to imprint on potential clients.

Why Do These Protocols Matter to a Content Strategist?

Protocols like AP2 and Computer Use are game-changers. They are reshaping the role of clicks from human navigation to transactional steps for AI agents. Understanding this shift is imperative for content strategists.

As Siege Media’s data shows, while pricing and calculators excel because humans still drive these choices, AI agents may soon undertake this task, potentially replacing human site visits with bot interactions validating costs through technical verification.

The 2026 Strategy

This evolving landscape demands a strategic pivot. To achieve success in 2026, I believe a dual focus is necessary. First, optimize BOFU content for seamless technical execution. Second, reinforce TOFU efforts by enhancing mentions and citations to establish trust and recognition in generative answers.

As clicks turn into a commodity managed by AI, the value of mentions will soar, making them the new battleground for visibility. It’s time to bolster TOFU efforts, ensuring they contribute significantly to our broader strategy.


Inspired by this post on Search Engine Land.


crushpress.ai community screenshot

FAQs

What signals matter for content discovery in 2026?

Signals models perceive matter more than pages visited. Mentions, citations, and structured visibility signals are emerging as trustworthy paths to revenue.

What does BOTF stand for and how does it compare to TOF?

BOTF stands for Bottom of the Funnel and TOF stands for Top of the Funnel. In the Siege Media study, BOTF conversion rate is 4.78%, higher than TOF’s 0.19%.

Which content categories grew or declined according to the Siege Media study?

Pricing and cost-related content grew the strongest; TOFU content such as how-to guides declined. The data also shows that Trends and Announcements/Product Updates can achieve higher engagement than other formats.

What is the recommended 2026 content strategy?

A dual focus: optimize BOFU content for seamless technical execution; reinforce TOFU efforts by enhancing mentions and citations to establish trust in generative answers.

Why is TOFU still important?

TOFU content remains essential for sustained visibility and engagement. Generative engines now manage most of the TOFU journey, keeping users within platforms for initial research before decision-specific interactions.

Comments

Leave a Reply

Your email address will not be published. Required fields are marked *