Why AI Assistant Usage Follows Different Daily Rhythms

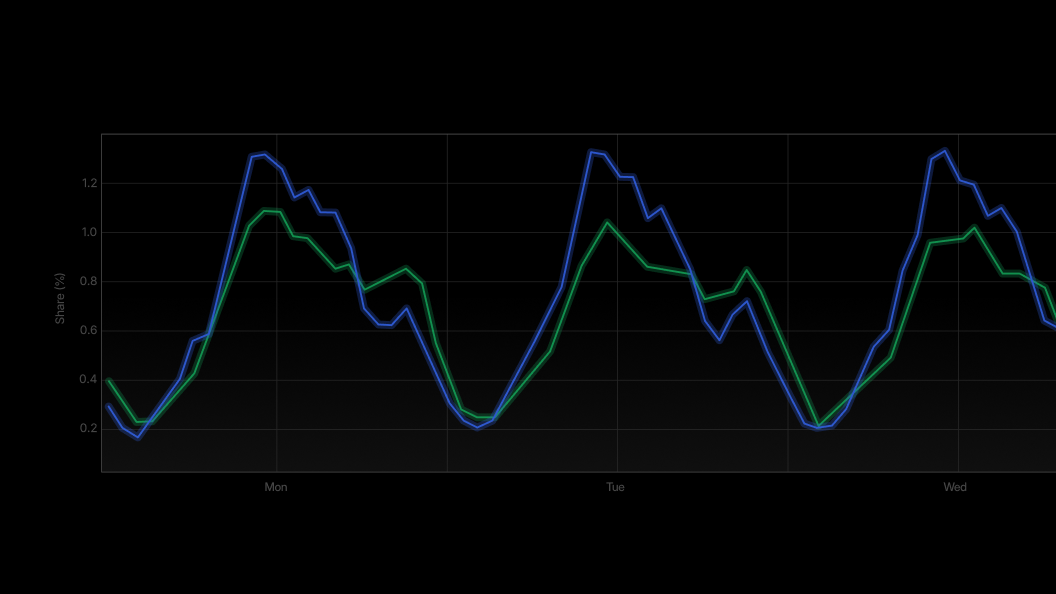
Dark line chart with blue and green series fluctuating across Monday, Tuesday, and Wednesday.

AI assistants may be software, but the people using them still follow schedules. That creates patterns in when AI tools attract attention, answer questions, and influence decisions.

Try Profound Blog offers one central observation: every AI assistant has a daily and weekly rhythm, but that rhythm varies by platform, region, and user. The source does not provide supporting measurements, so the useful takeaway is a framework for investigation rather than a universal timetable.
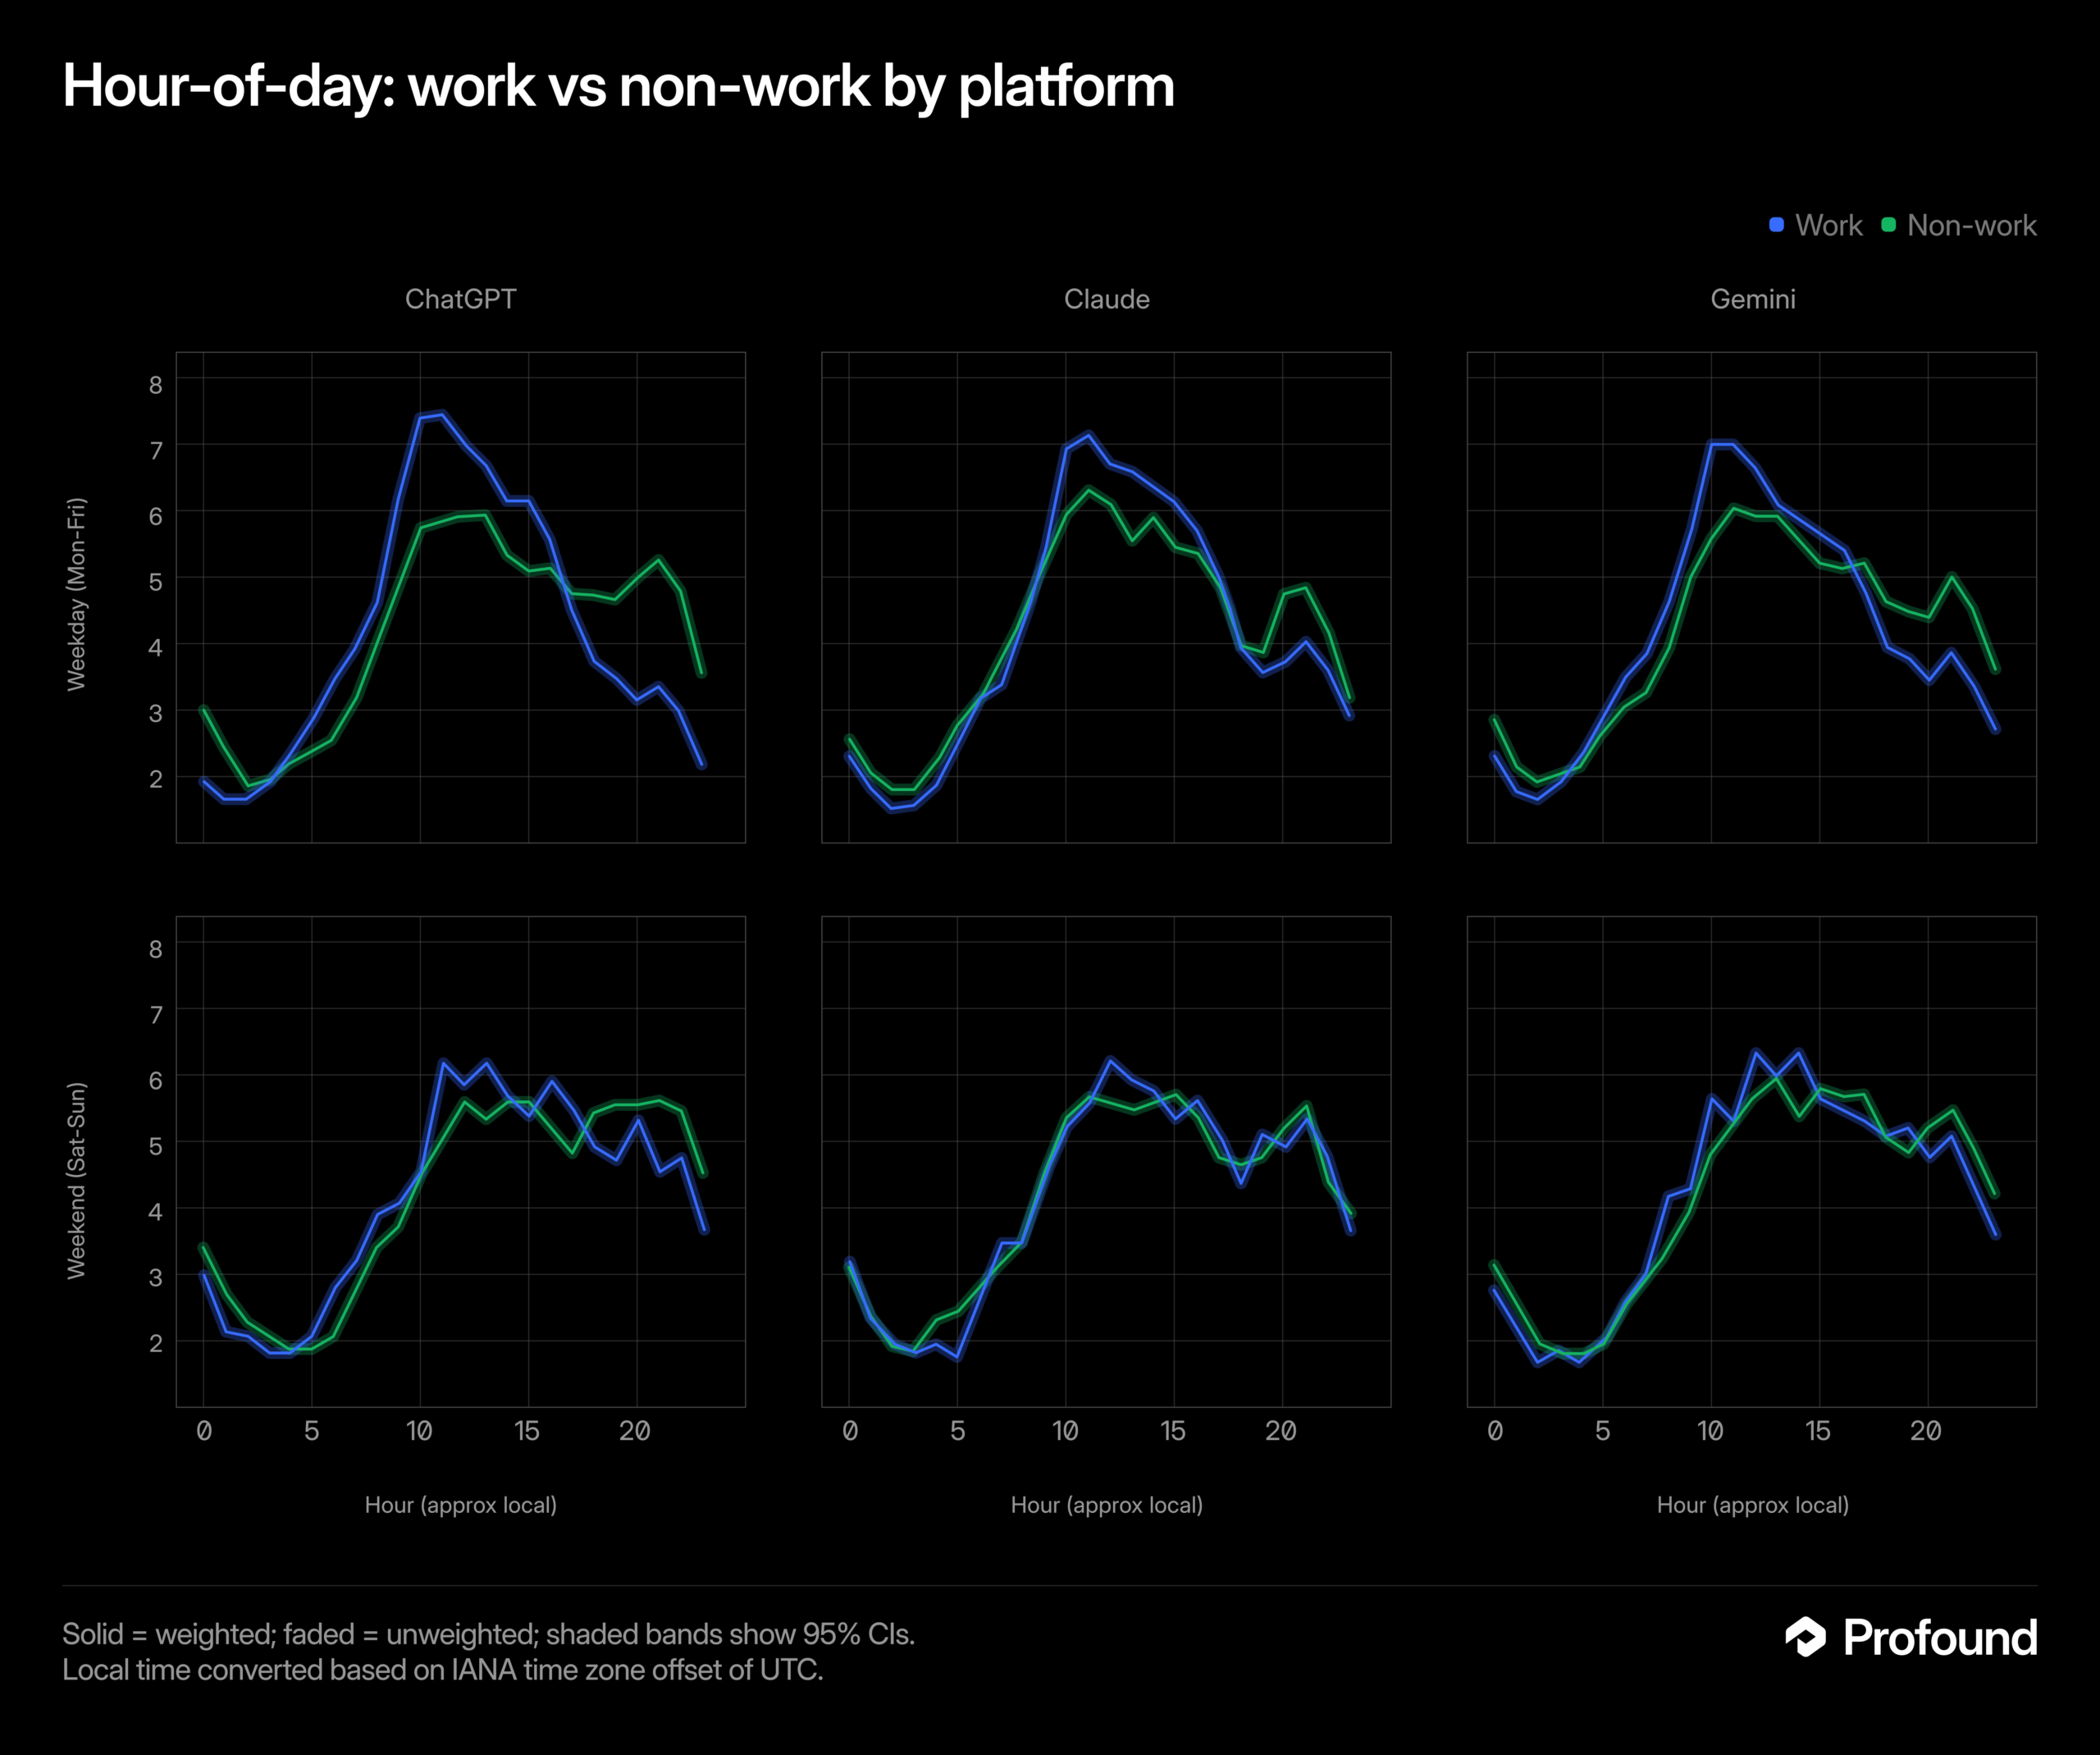
Six line charts compare work and non-work hourly patterns for ChatGPT, Claude, and Gemini on weekdays and weekends.
Blue work and green non-work lines show hourly patterns for ChatGPT, Claude, and Gemini, split into weekday and weekend rows, with most curves highest around late morning to afternoon.

The rhythm belongs to usage, not the assistant

An AI system does not begin a workday in the human sense. Any apparent schedule is more likely to reflect when people open a platform, what they use it for, and how it fits into their routines.
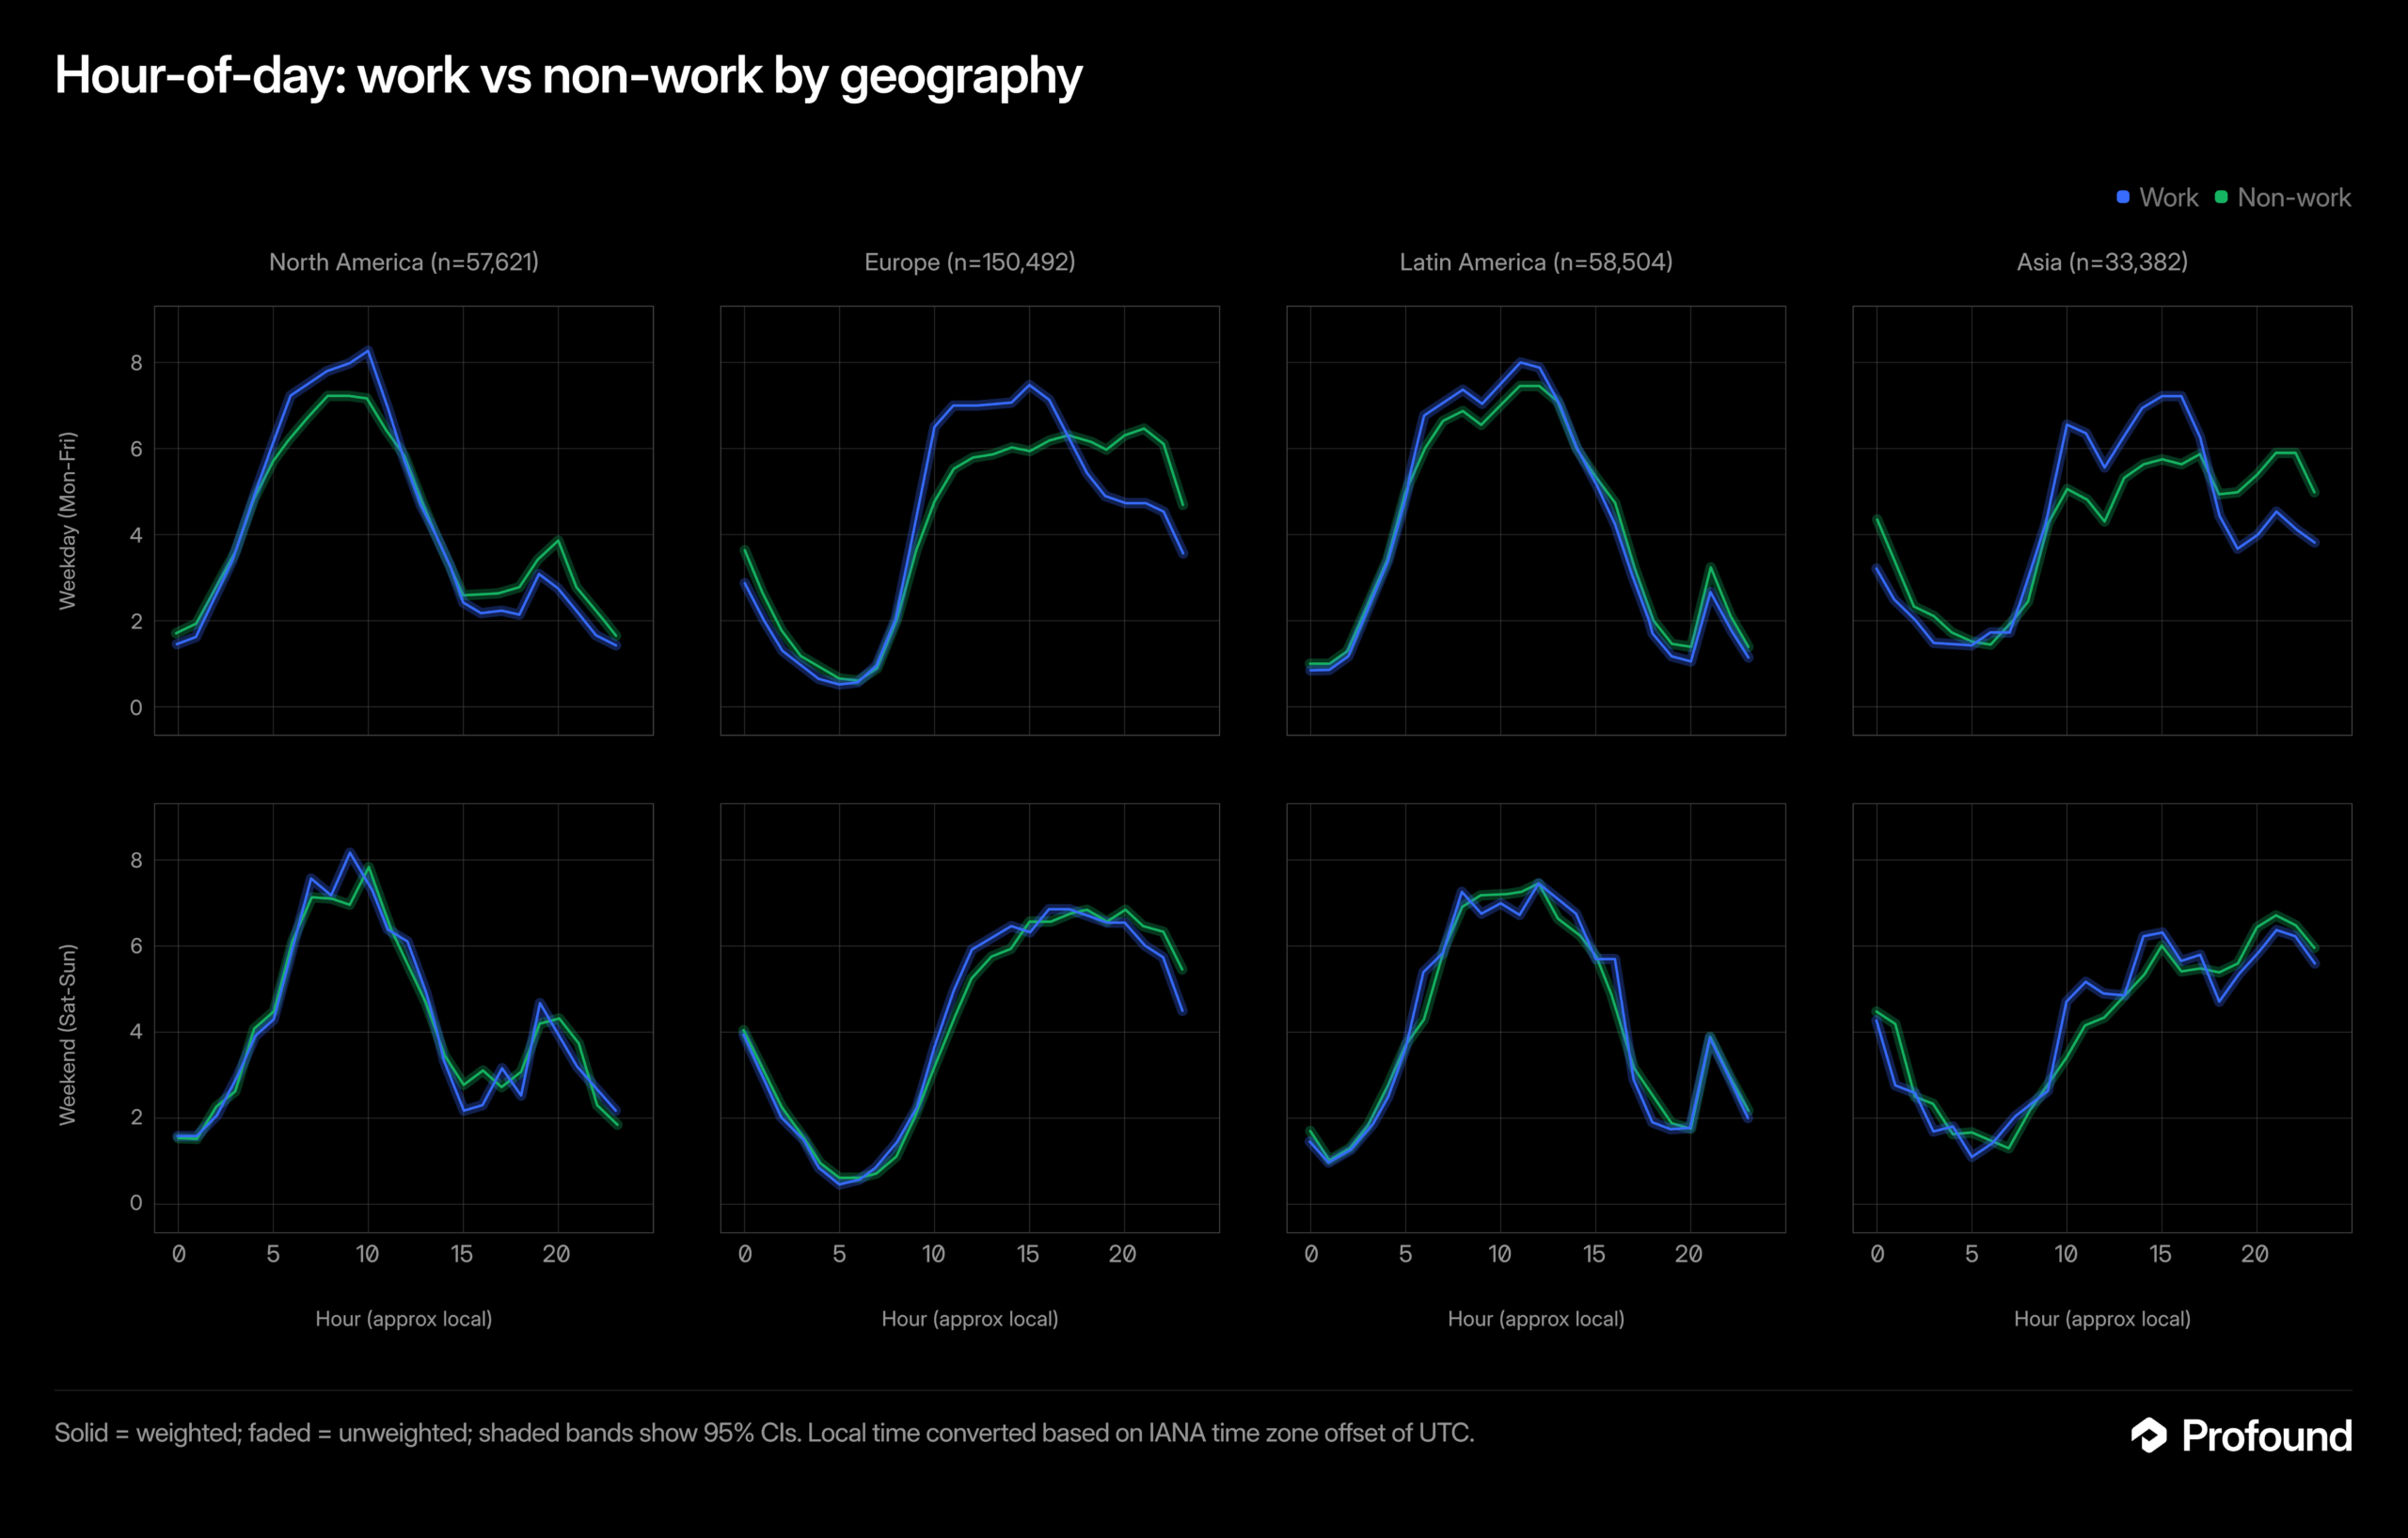
Eight line charts compare hourly work and non-work patterns across four regions on weekdays and weekends.
Blue work and green non-work lines trace hour-of-day patterns for North America, Europe, Latin America and Asia, split into weekday and weekend rows.

A tool associated with professional tasks may see a different pattern from one used for personal questions. The distinction matters because a broad label such as “AI traffic” can hide meaningful differences among audiences and use cases.
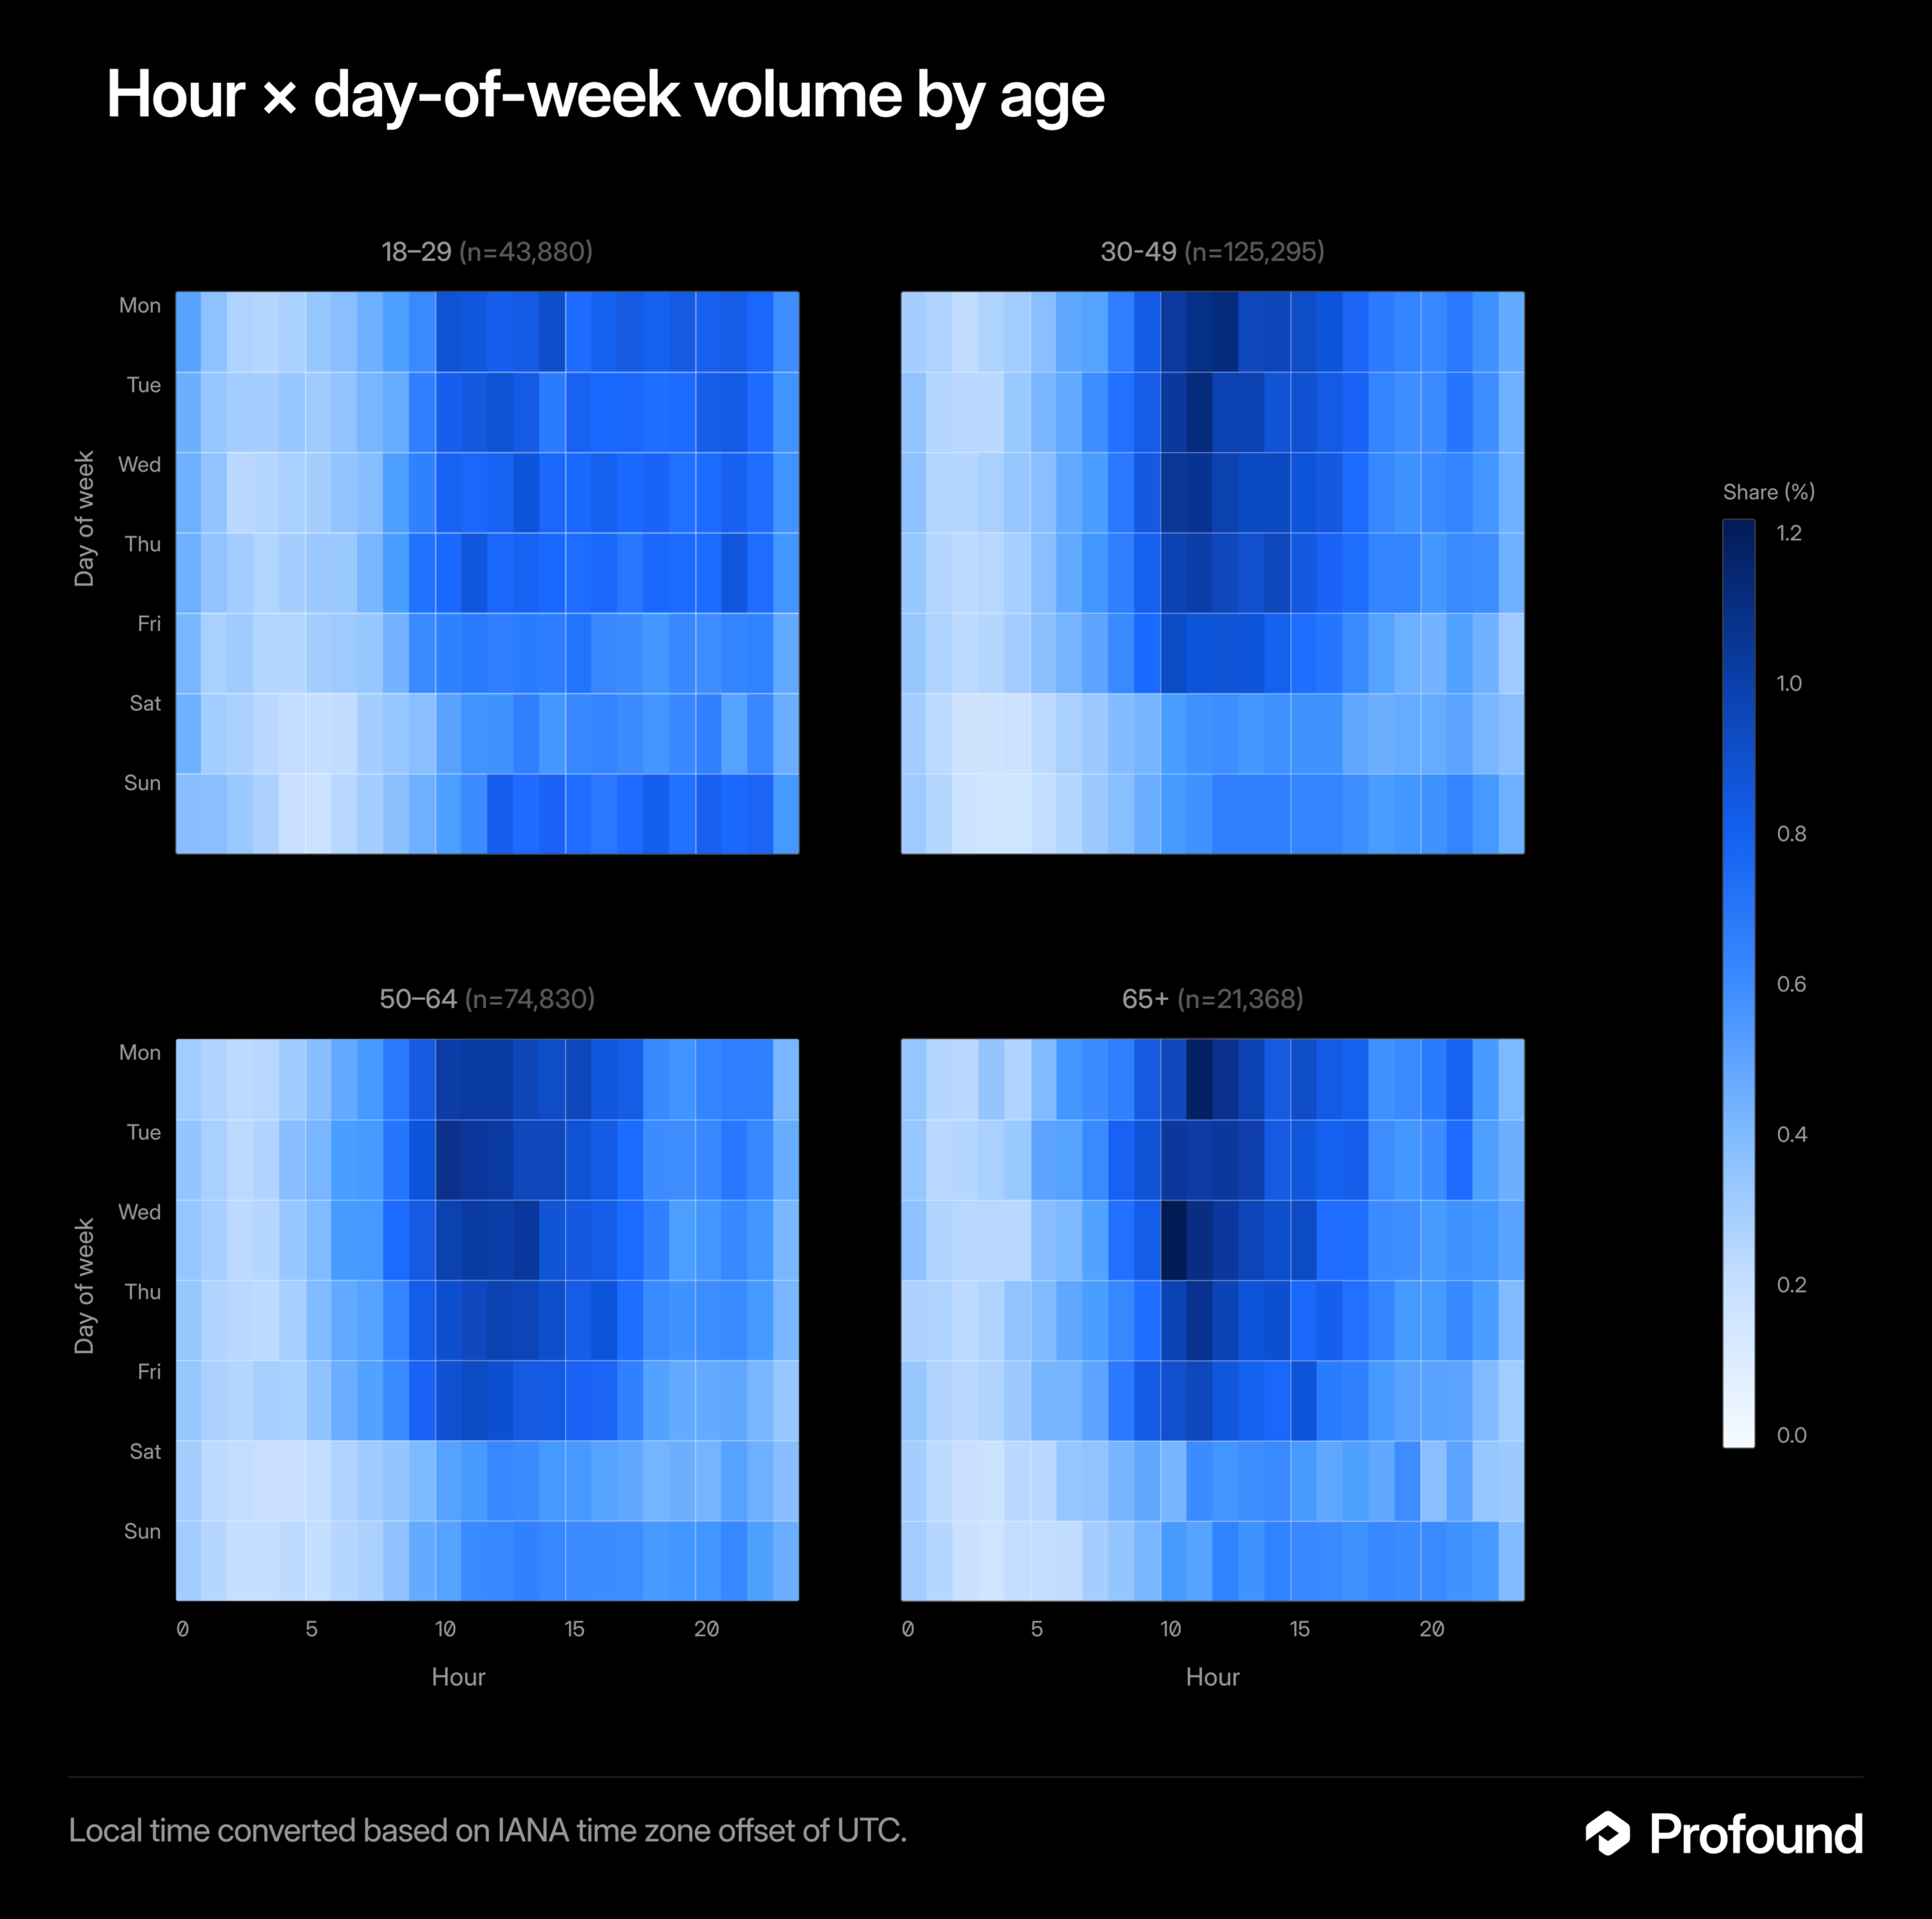
Four blue heatmaps compare hourly, weekday volume shares across age groups from 18-29 to 65+.
Four heatmaps plot share by hour and day of week for ages 18-29, 30-49, 50-64 and 65+, with the darkest weekday bands around late morning.

Why one schedule cannot describe every audience

The source specifically cautions that timing is not consistent across platforms, regions, or users. Each dimension can change how an observed pattern should be interpreted:
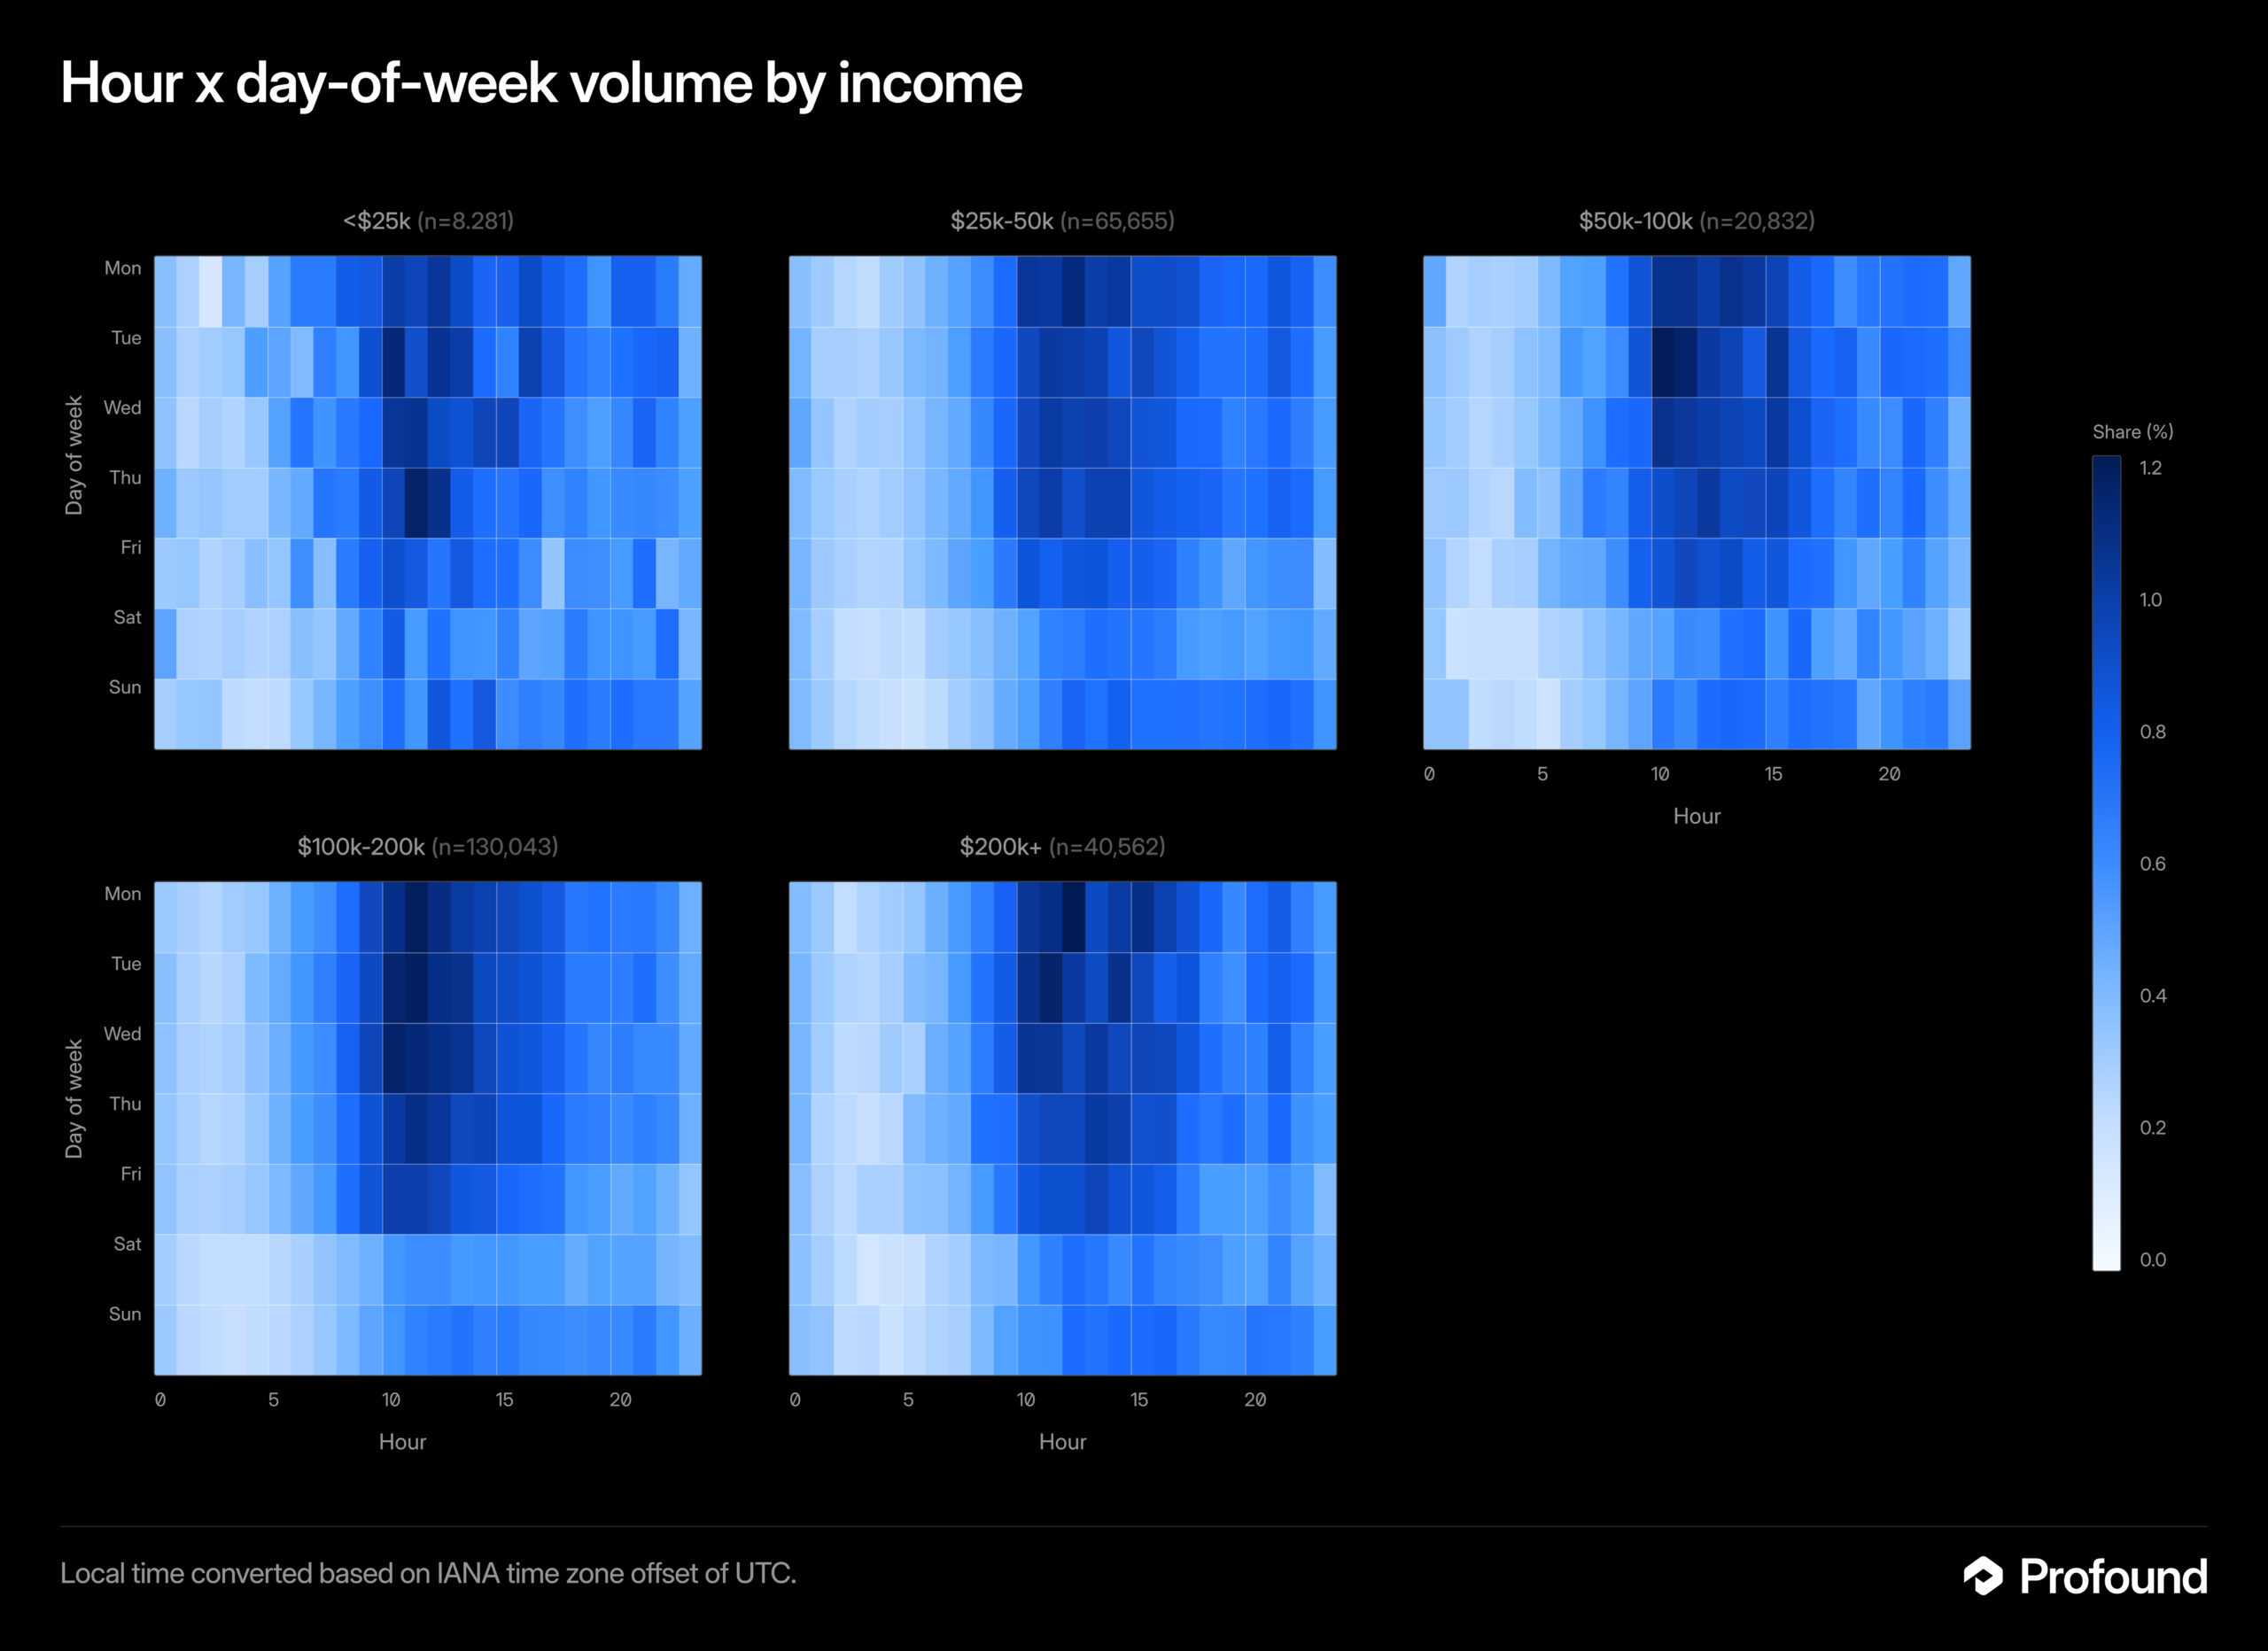
Five heatmaps compare hourly, weekday volume shares across income brackets from under $25k to $200k+.
The five blue heatmaps show share percentages by hour and day of week for income groups, with many darker cells appearing from late morning through afternoon.
  • Platform: Different products can serve different purposes and attract different usage habits.
  • Region: Local time, working patterns, and audience location can shift periods of activity.
  • User: Individual needs determine whether an assistant is used for work, study, research, planning, or another task.

These variables make a single global “best time” an unreliable assumption. A pattern found in one segment should not automatically be applied to another.
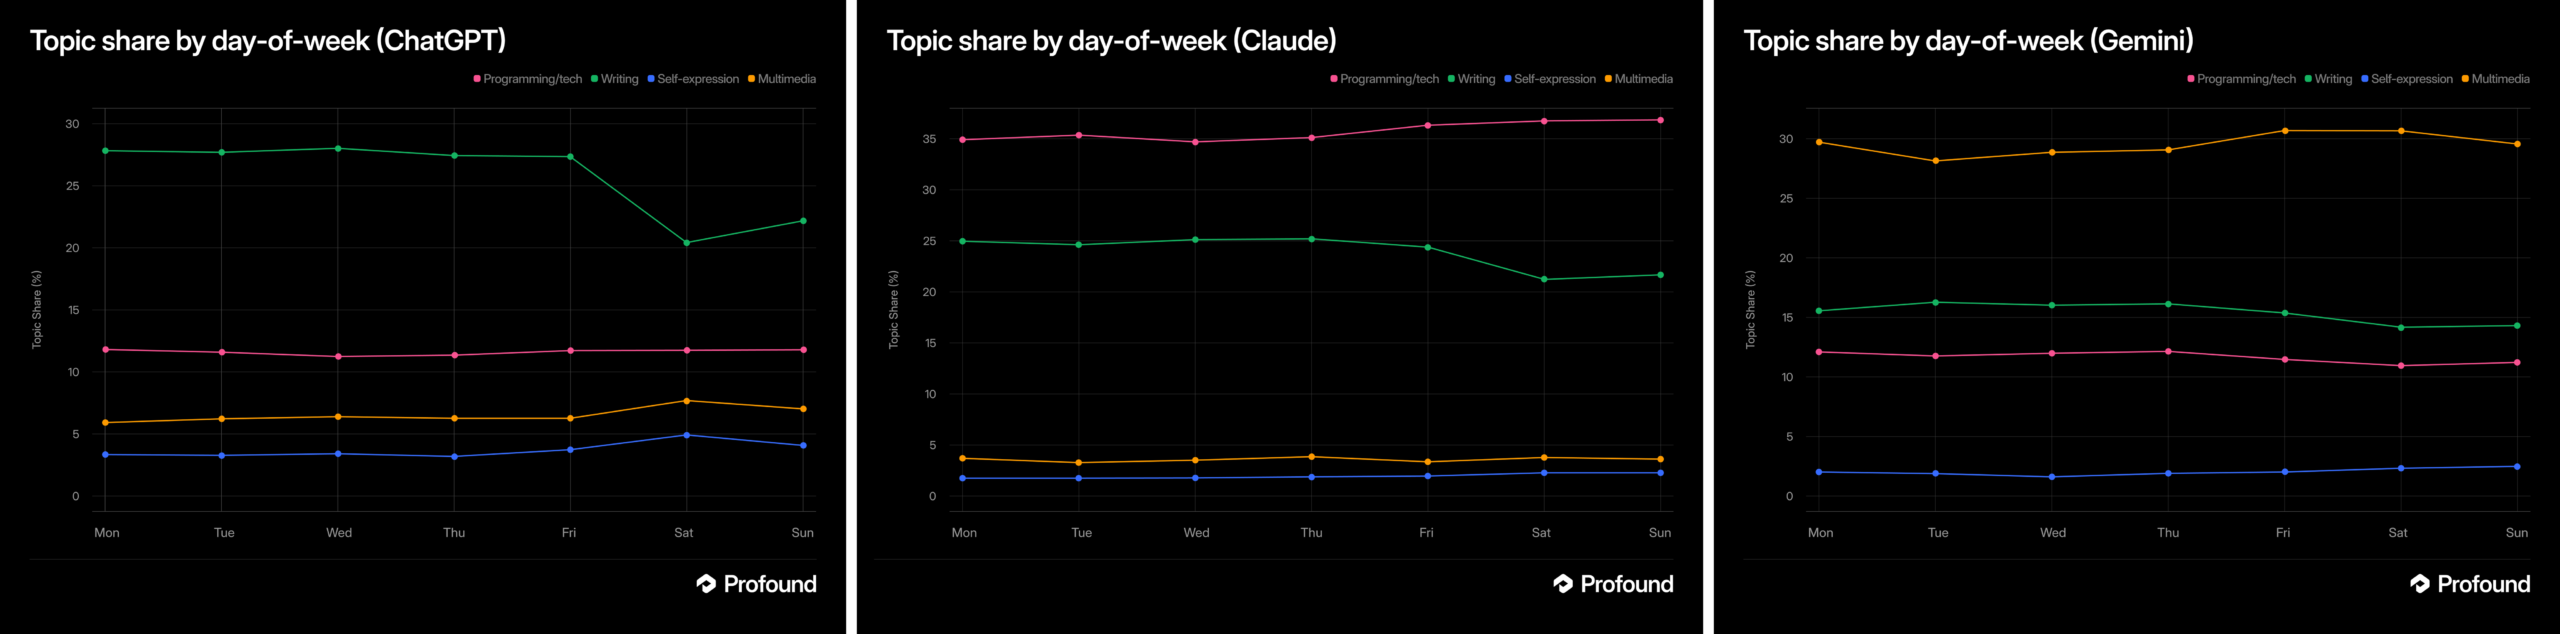
Three line charts compare topic share by weekday for ChatGPT, Claude, and Gemini across four categories.
Side-by-side weekday charts show writing highest for ChatGPT, programming/tech highest for Claude, and multimedia highest for Gemini, with weekend shifts.

Key takeaways

  • AI assistant activity can form recurring daily and weekly patterns.
  • Those patterns may differ across platforms, regions, and individual users.
  • Timing should be evaluated within a defined audience and use case.
  • The source states the principle but does not supply data for specific hours or days.

How teams can evaluate timing responsibly

For marketers, publishers, and product teams, the practical response is to examine their own evidence. Analysis should begin with a clear question: which platform, audience, region, and outcome are being measured?
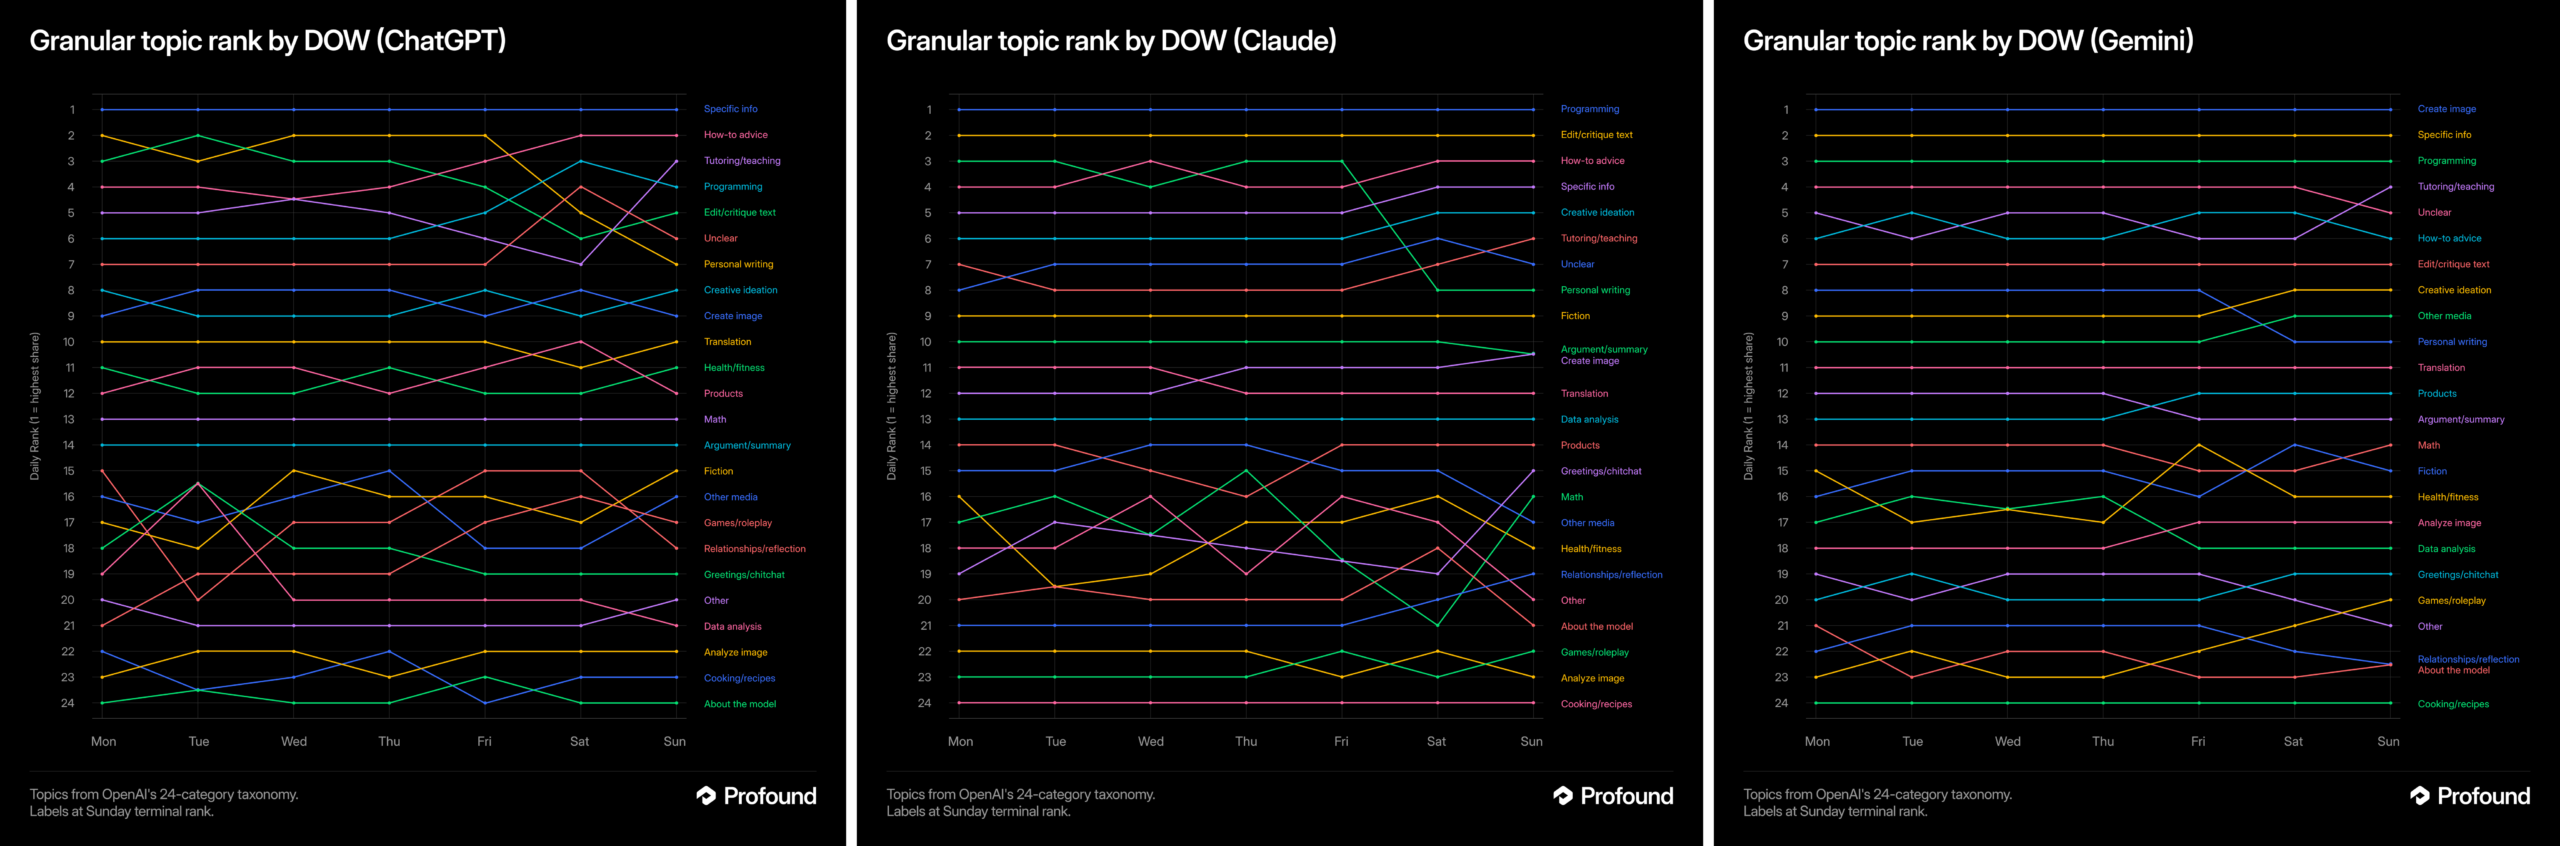
Three dark line charts compare 24 topic rankings by day of week for ChatGPT, Claude, and Gemini.
Side-by-side charts titled "Granular topic rank by DOW" trace colored topic rankings from Monday through Sunday for ChatGPT, Claude, and Gemini.

Teams can then compare consistent time periods, use the relevant local time zone, and separate audience segments where possible. They should also distinguish between activity and impact. A busy period does not necessarily produce the most valuable visits, recommendations, conversions, or customer outcomes.

Any apparent rhythm should be treated as a working pattern rather than a permanent rule. User behavior, product design, and the mix of use cases can change, so conclusions need periodic review.

What the source does not establish

Try Profound Blog does not identify peak hours, preferred weekdays, regional differences, or platform-specific results in the supplied material. It also does not describe a study or methodology. Claims about exact schedules would therefore go beyond the available evidence.

The defensible conclusion is narrower: AI usage has timing patterns, and context determines what those patterns mean. Organizations that want actionable answers will need to measure the audiences and outcomes that matter to them.


Inspired by this post on Try Profound Blog.


crushpress.ai community screenshot

FAQs

Why does AI assistant usage follow daily and weekly rhythms?

The assistants themselves do not keep human schedules; their users do. Apparent patterns are more likely to reflect when people open each platform, the tasks they bring to it, and how the tool fits into work and personal routines.

Is there one best time to reach people through AI assistants?

No. The article cautions that timing varies by platform, region, audience, and use case, so a pattern observed in one segment should not be applied globally.

Which factors can change an AI assistant's usage pattern?

Platform purpose, audience region and local time, and individual needs can all shift activity. Work, study, research, planning, and personal questions may follow different schedules.

How should teams analyze AI assistant timing?

Start with a defined platform, audience, region, and outcome. Compare consistent periods in the relevant local time zone, segment audiences where possible, and review the pattern periodically.

Does the busiest AI usage period produce the best results?

Not necessarily. High activity does not automatically lead to the most valuable visits, recommendations, conversions, or customer outcomes, so teams should measure impact separately from volume.

Are AI assistant timing patterns permanent?

No. User behavior, product design, and the mix of use cases can change, so any observed rhythm should be treated as a working pattern and reviewed over time.

Does the cited source identify exact peak hours or weekdays?

No. The supplied material does not establish peak hours, preferred weekdays, regional differences, platform-specific results, or a study methodology, so exact schedule claims would exceed the evidence.

Comments

Leave a Reply

Your email address will not be published. Required fields are marked *