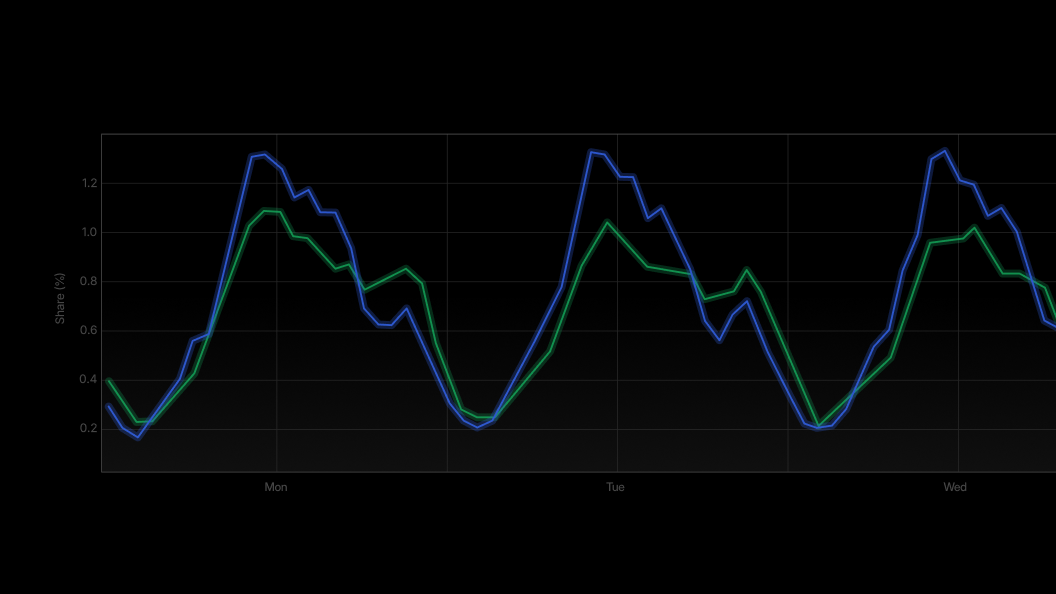
Tag: User Behavior

  • Why AI Assistant Usage Follows Different Daily Rhythms

    Why AI Assistant Usage Follows Different Daily Rhythms

    AI assistants may be software, but the people using them still follow schedules. That creates patterns in when AI tools attract attention, answer questions, and influence decisions.

    Try Profound Blog offers one central observation: every AI assistant has a daily and weekly rhythm, but that rhythm varies by platform, region, and user. The source does not provide supporting measurements, so the useful takeaway is a framework for investigation rather than a universal timetable.
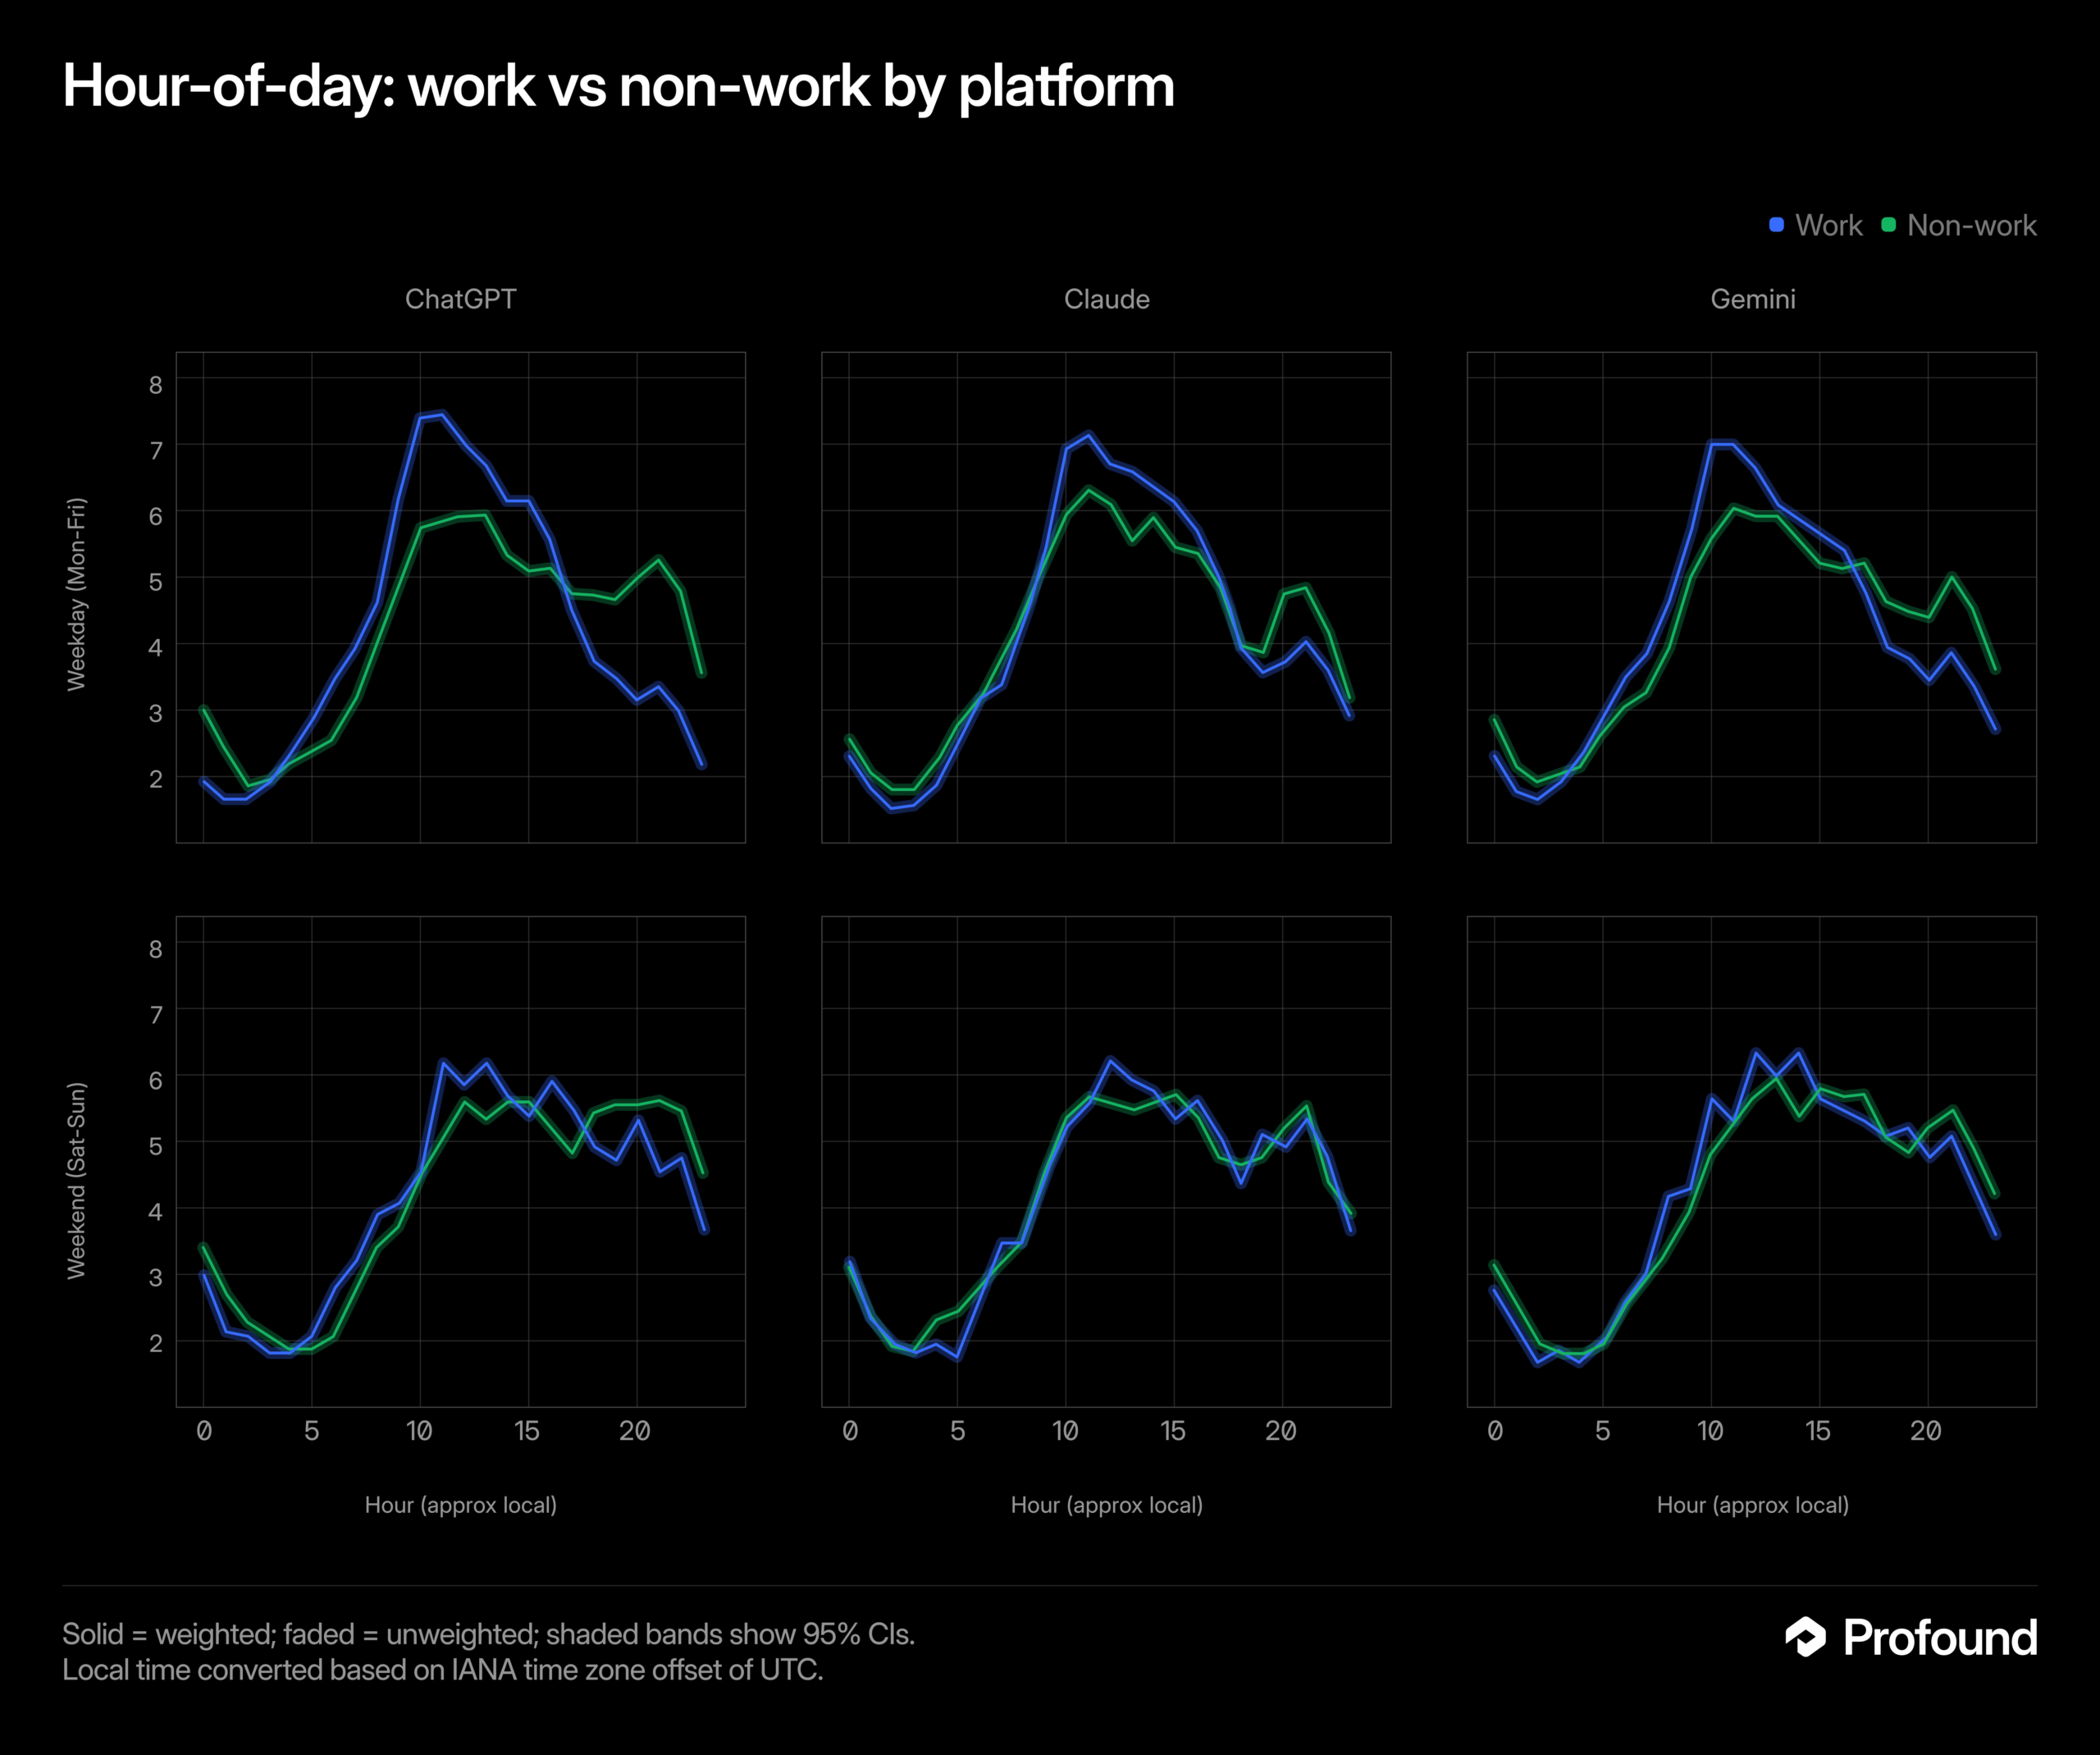
    Six line charts compare work and non-work hourly patterns for ChatGPT, Claude, and Gemini on weekdays and weekends.
    Blue work and green non-work lines show hourly patterns for ChatGPT, Claude, and Gemini, split into weekday and weekend rows, with most curves highest around late morning to afternoon.

    The rhythm belongs to usage, not the assistant

    An AI system does not begin a workday in the human sense. Any apparent schedule is more likely to reflect when people open a platform, what they use it for, and how it fits into their routines.
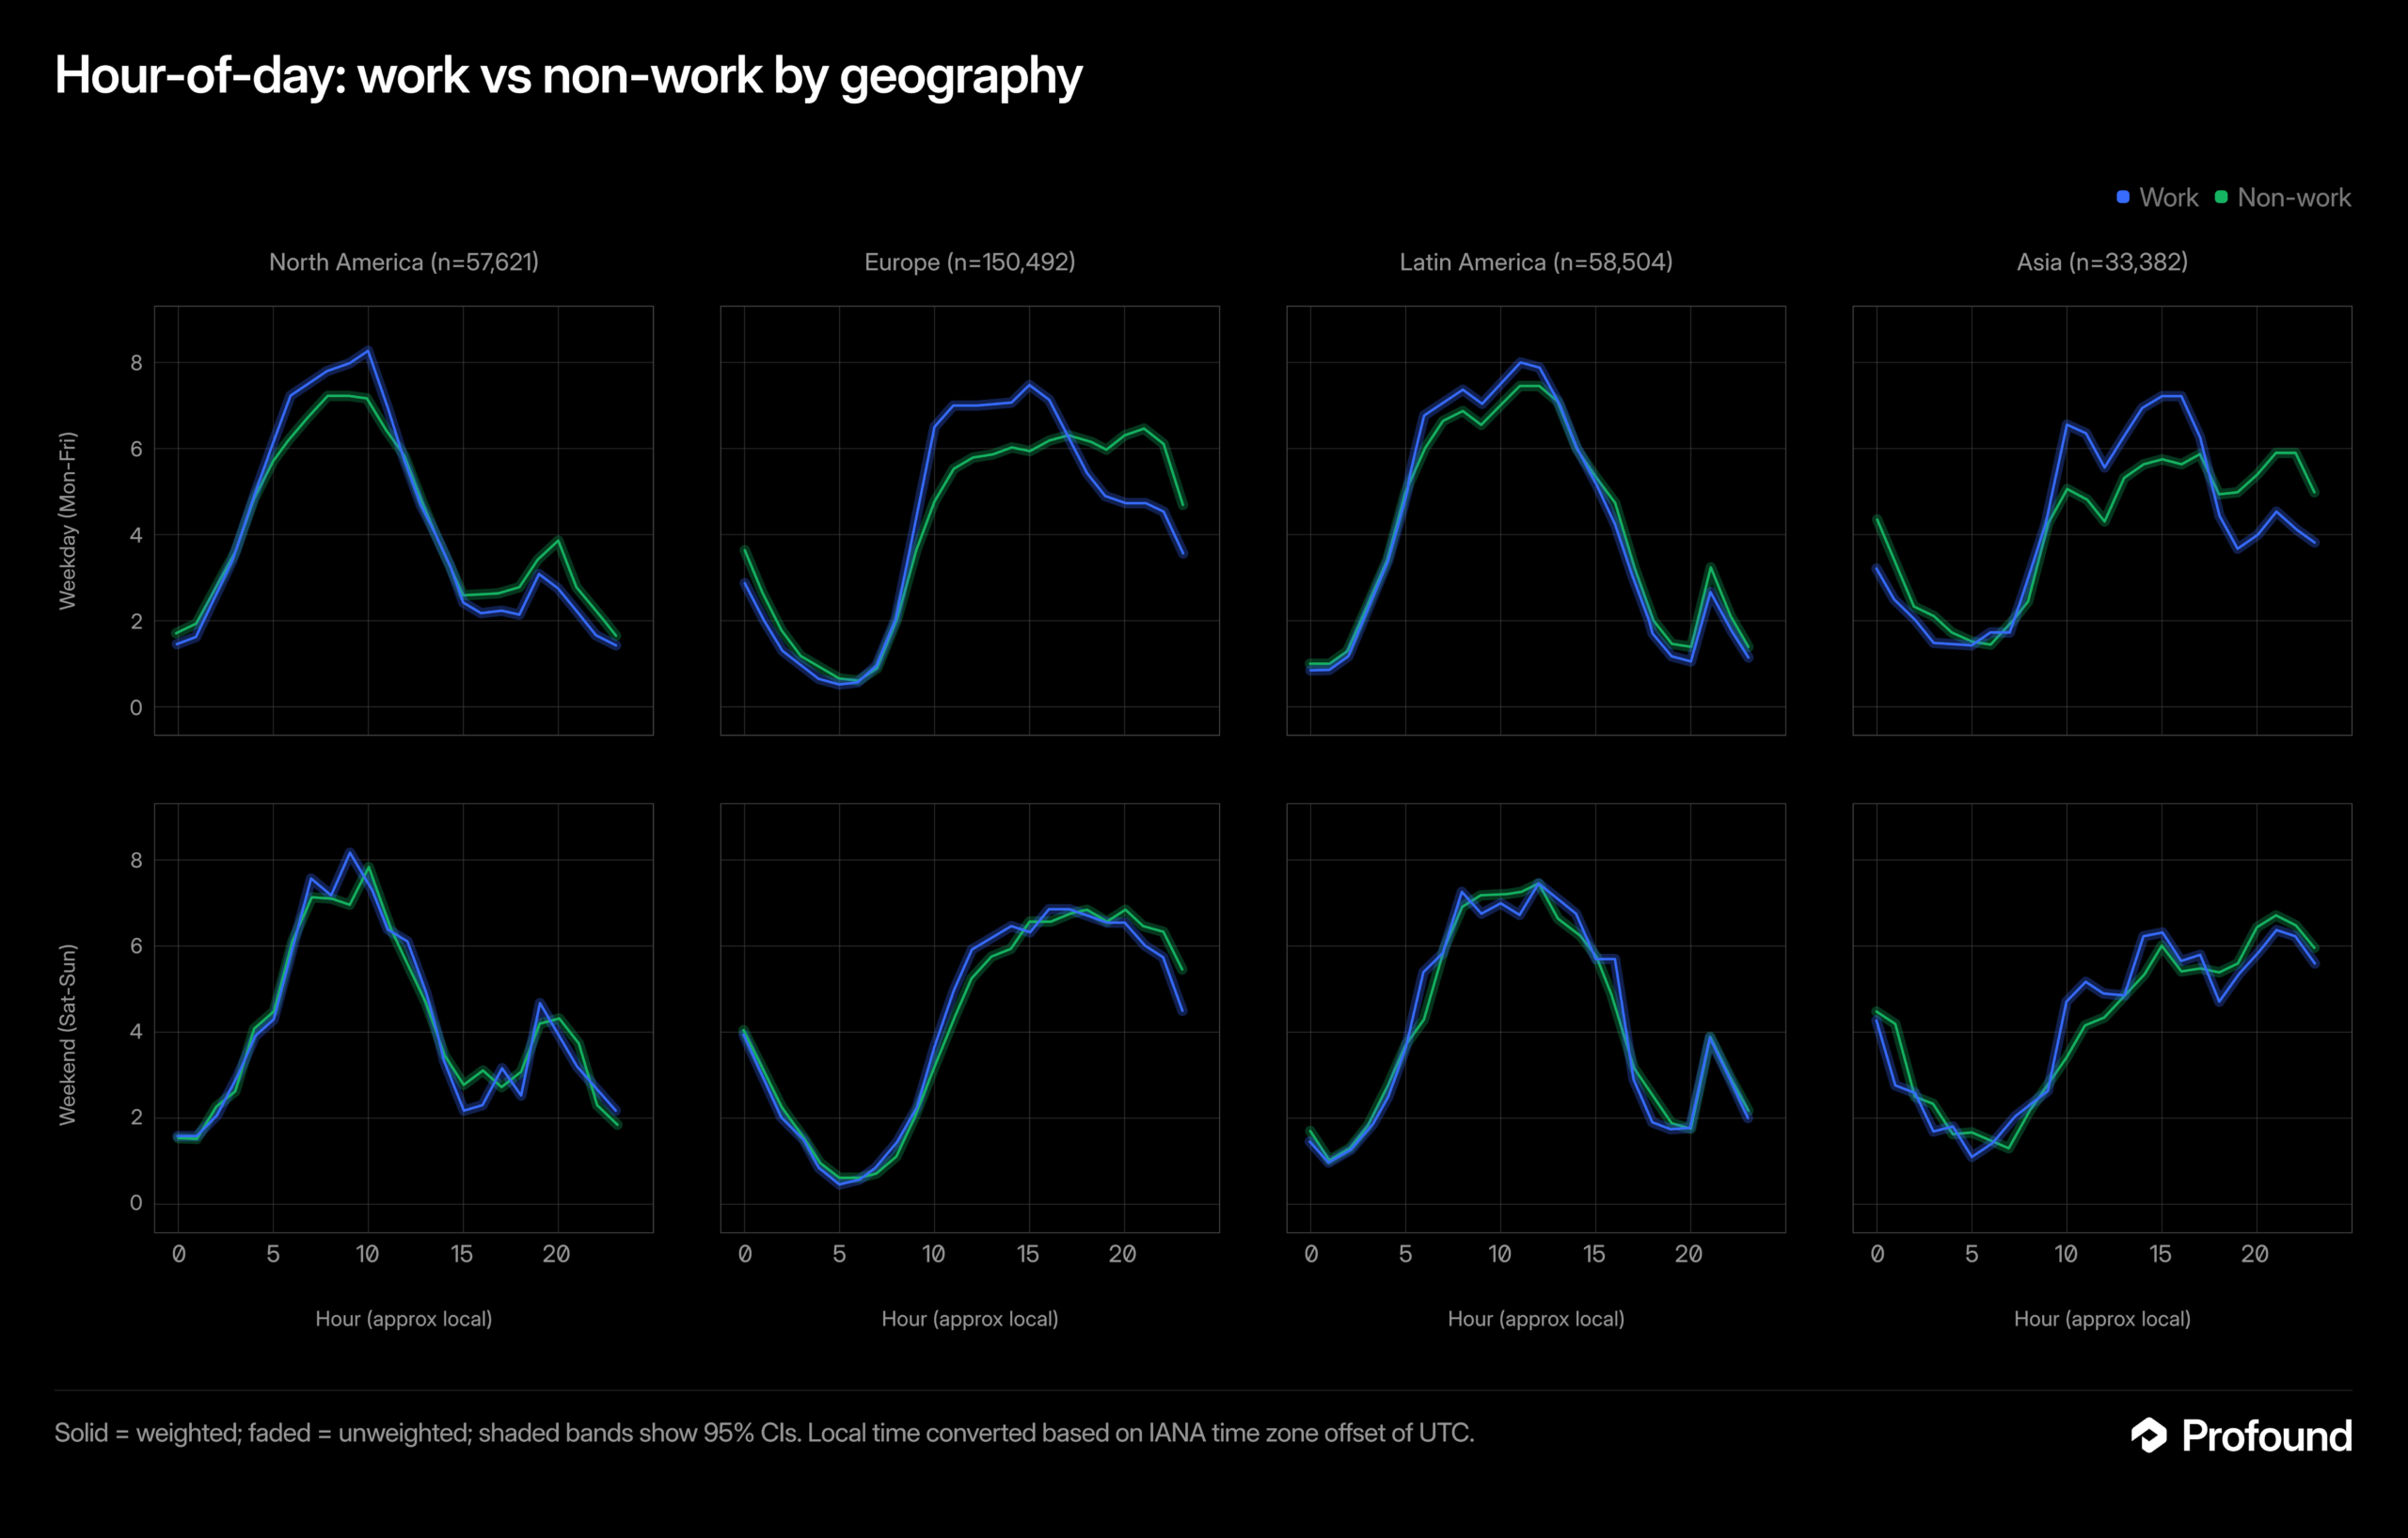
    Eight line charts compare hourly work and non-work patterns across four regions on weekdays and weekends.
    Blue work and green non-work lines trace hour-of-day patterns for North America, Europe, Latin America and Asia, split into weekday and weekend rows.

    A tool associated with professional tasks may see a different pattern from one used for personal questions. The distinction matters because a broad label such as “AI traffic” can hide meaningful differences among audiences and use cases.
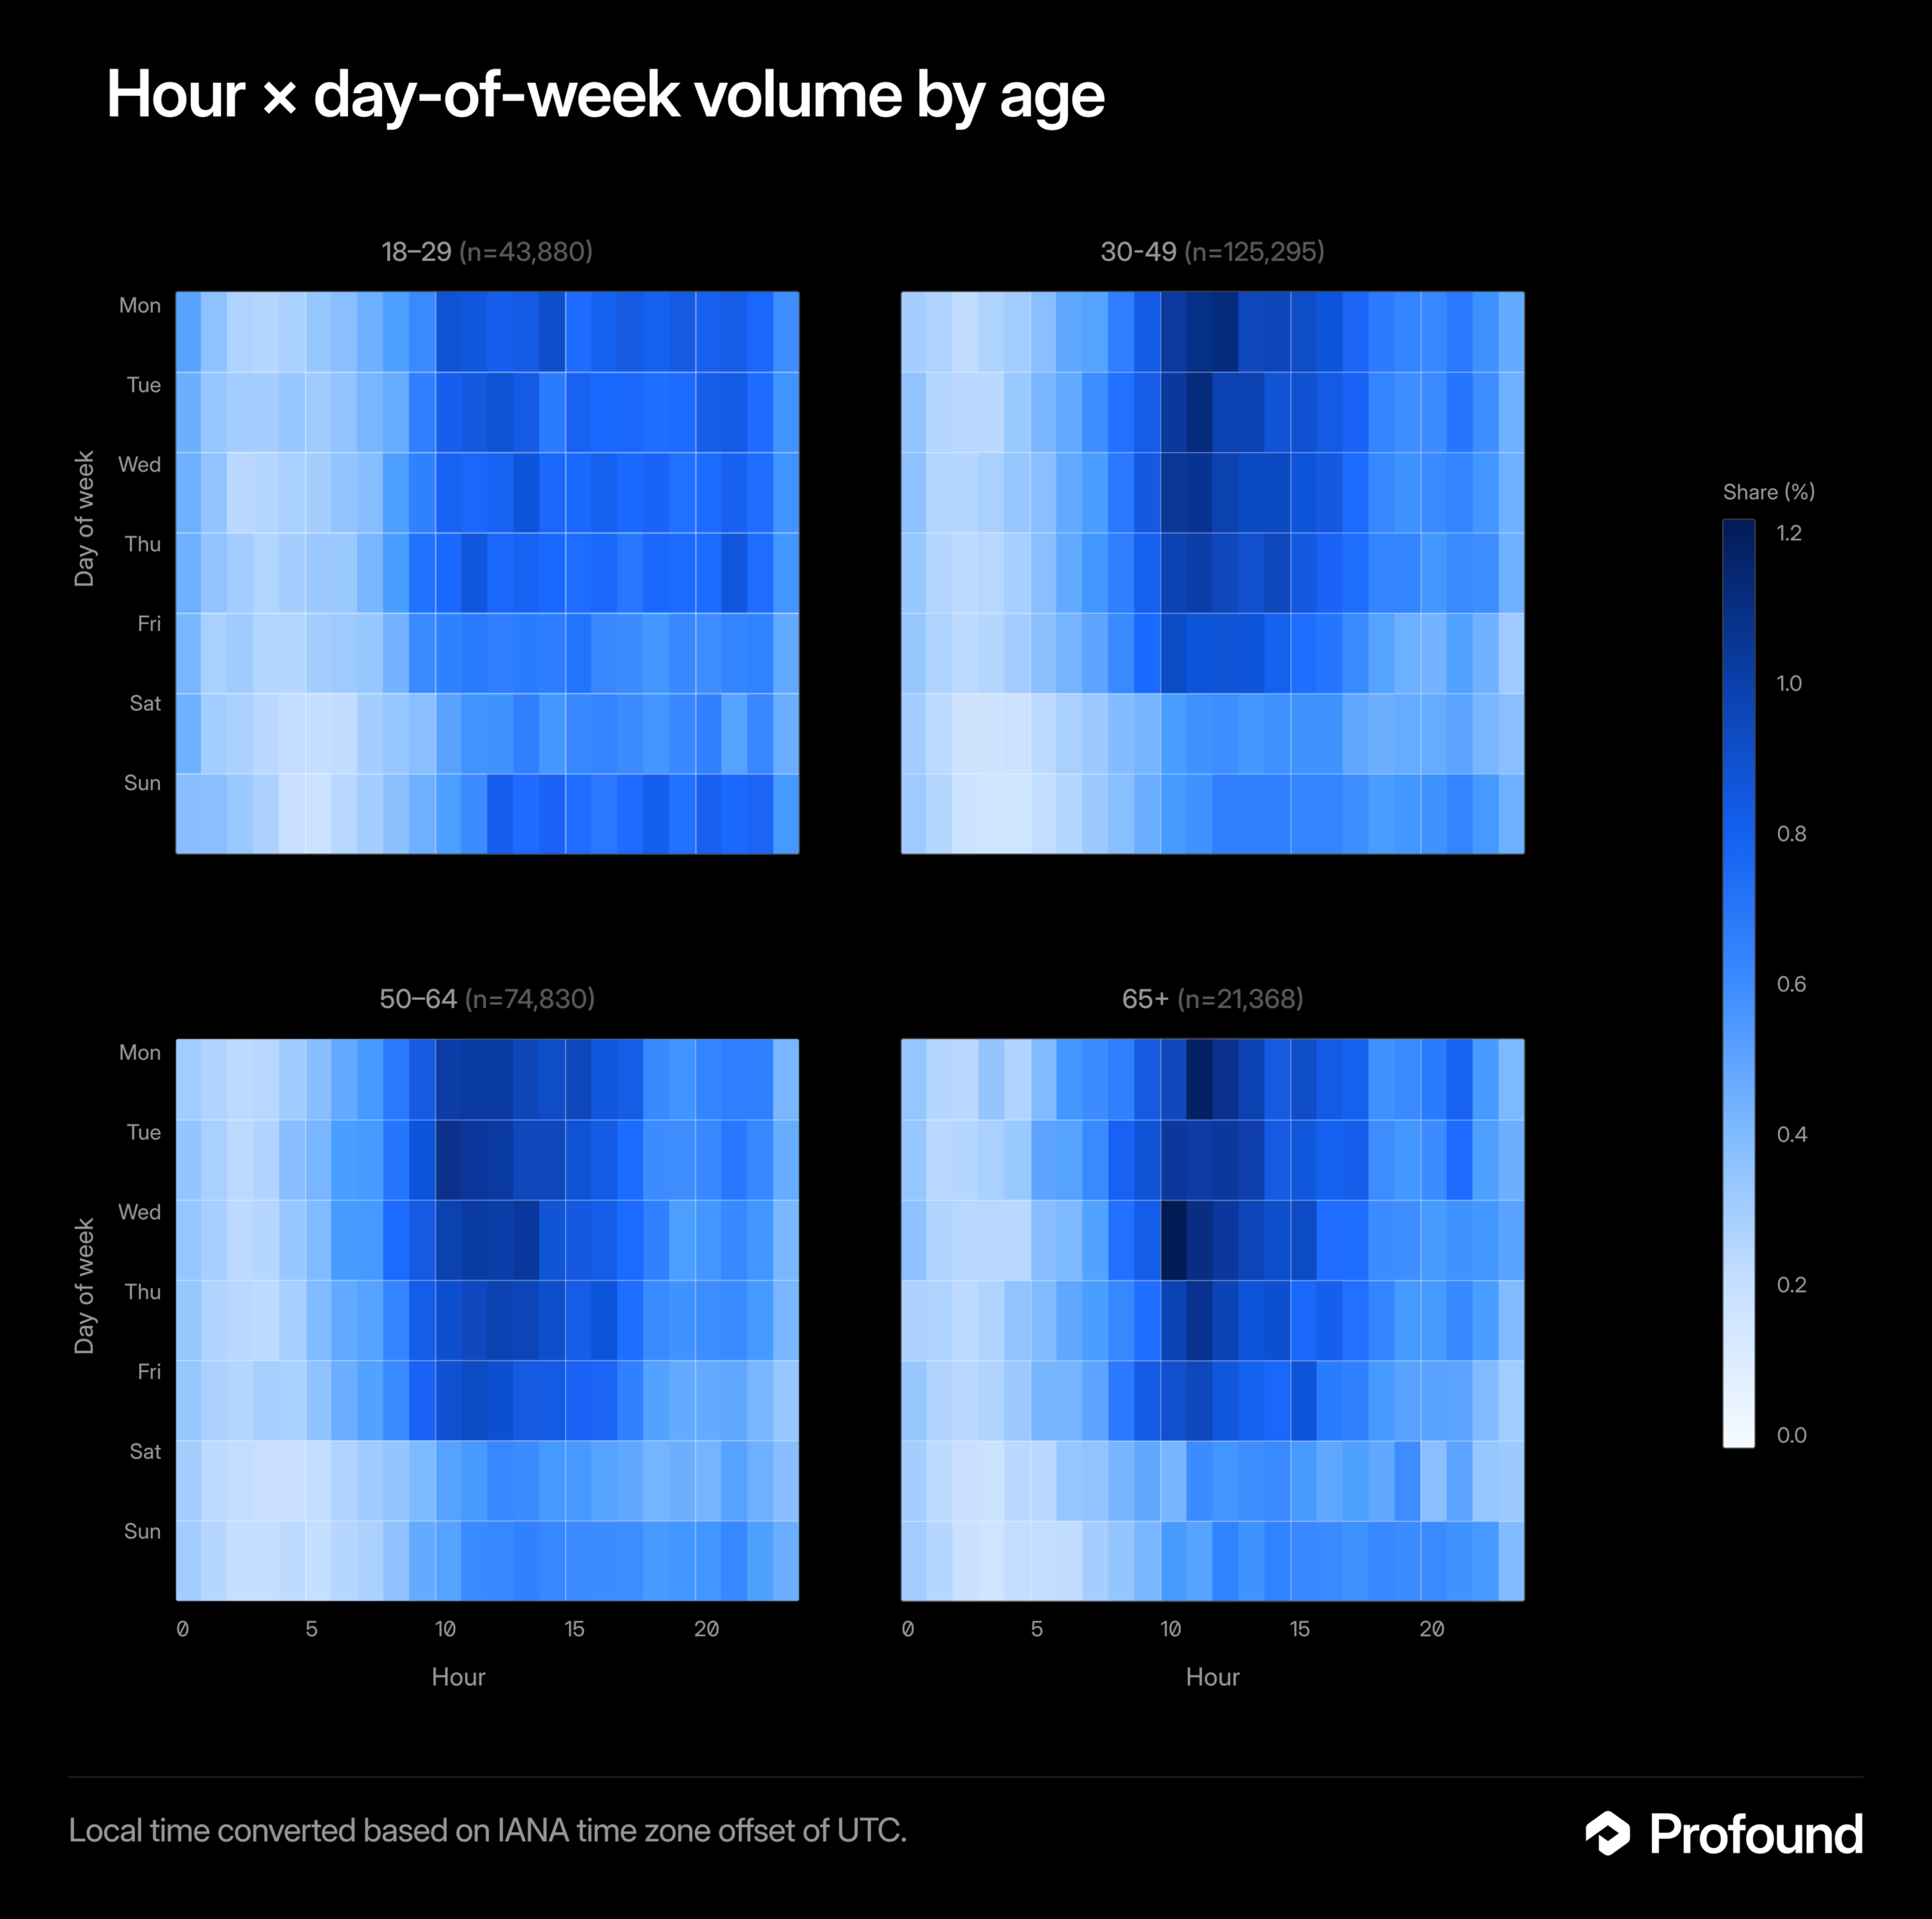
    Four blue heatmaps compare hourly, weekday volume shares across age groups from 18-29 to 65+.
    Four heatmaps plot share by hour and day of week for ages 18-29, 30-49, 50-64 and 65+, with the darkest weekday bands around late morning.

    Why one schedule cannot describe every audience

    The source specifically cautions that timing is not consistent across platforms, regions, or users. Each dimension can change how an observed pattern should be interpreted:
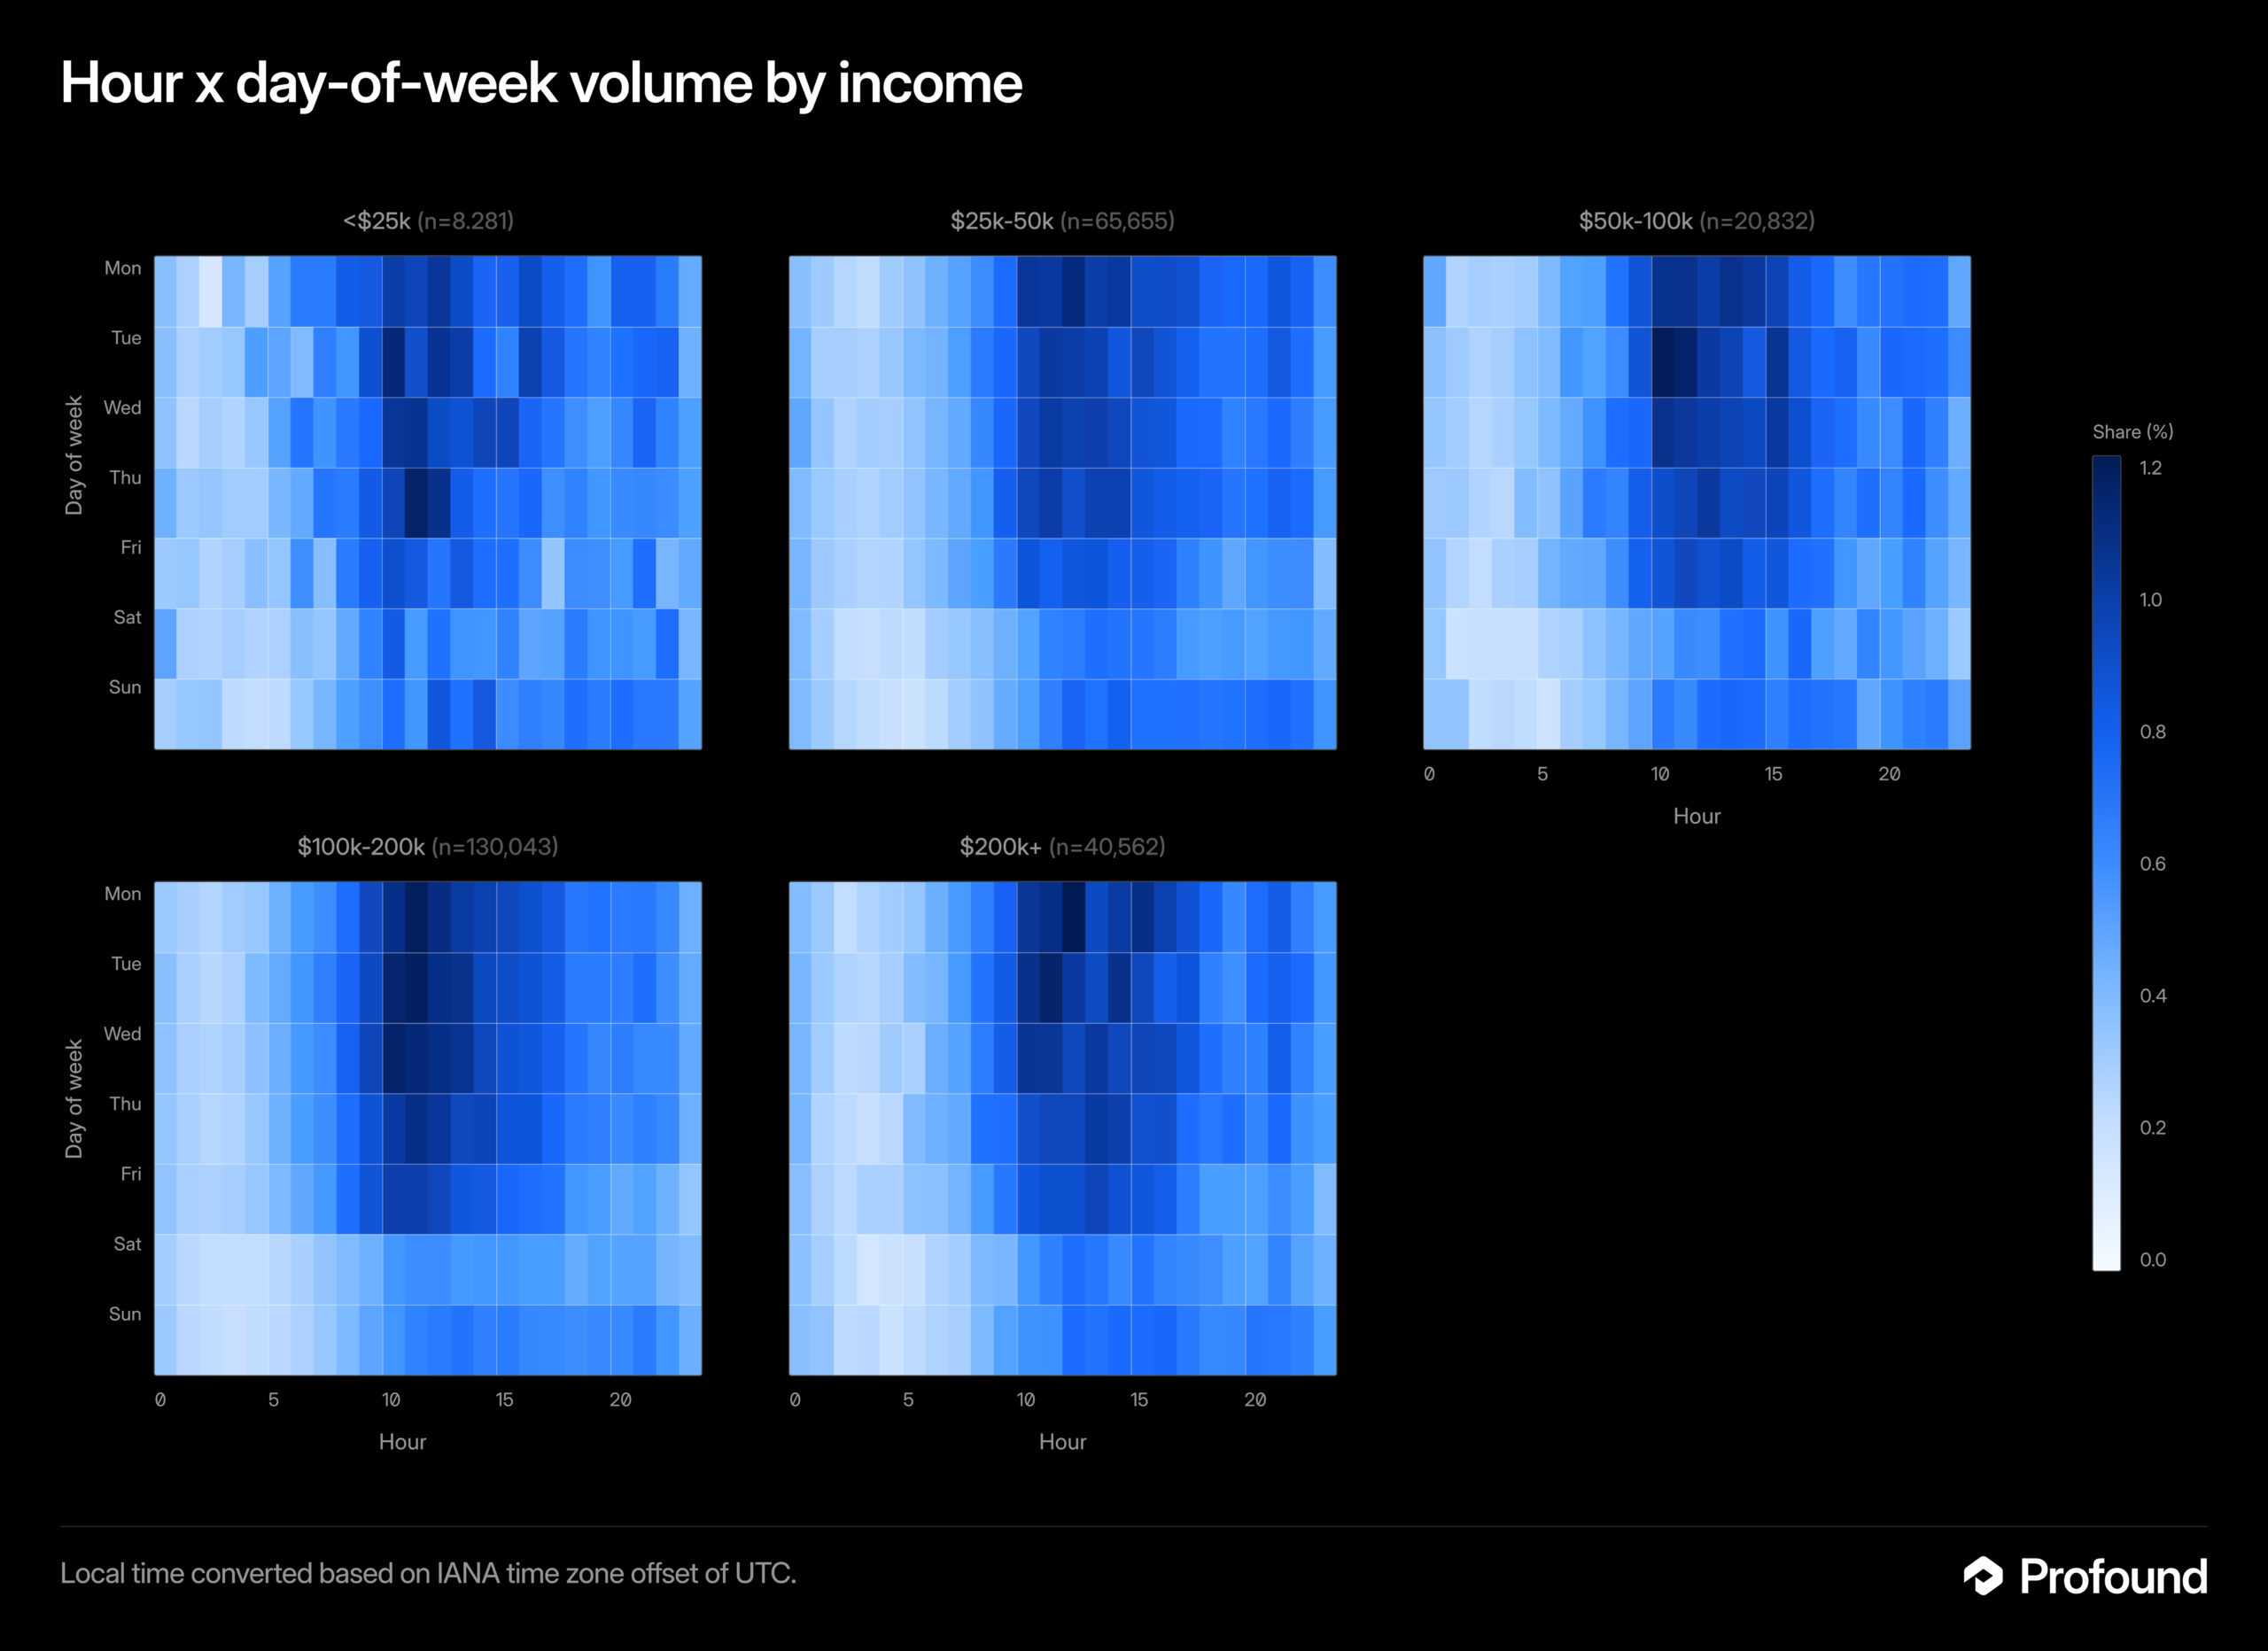
    Five heatmaps compare hourly, weekday volume shares across income brackets from under $25k to $200k+.
    The five blue heatmaps show share percentages by hour and day of week for income groups, with many darker cells appearing from late morning through afternoon.
    • Platform: Different products can serve different purposes and attract different usage habits.
    • Region: Local time, working patterns, and audience location can shift periods of activity.
    • User: Individual needs determine whether an assistant is used for work, study, research, planning, or another task.

    These variables make a single global “best time” an unreliable assumption. A pattern found in one segment should not automatically be applied to another.
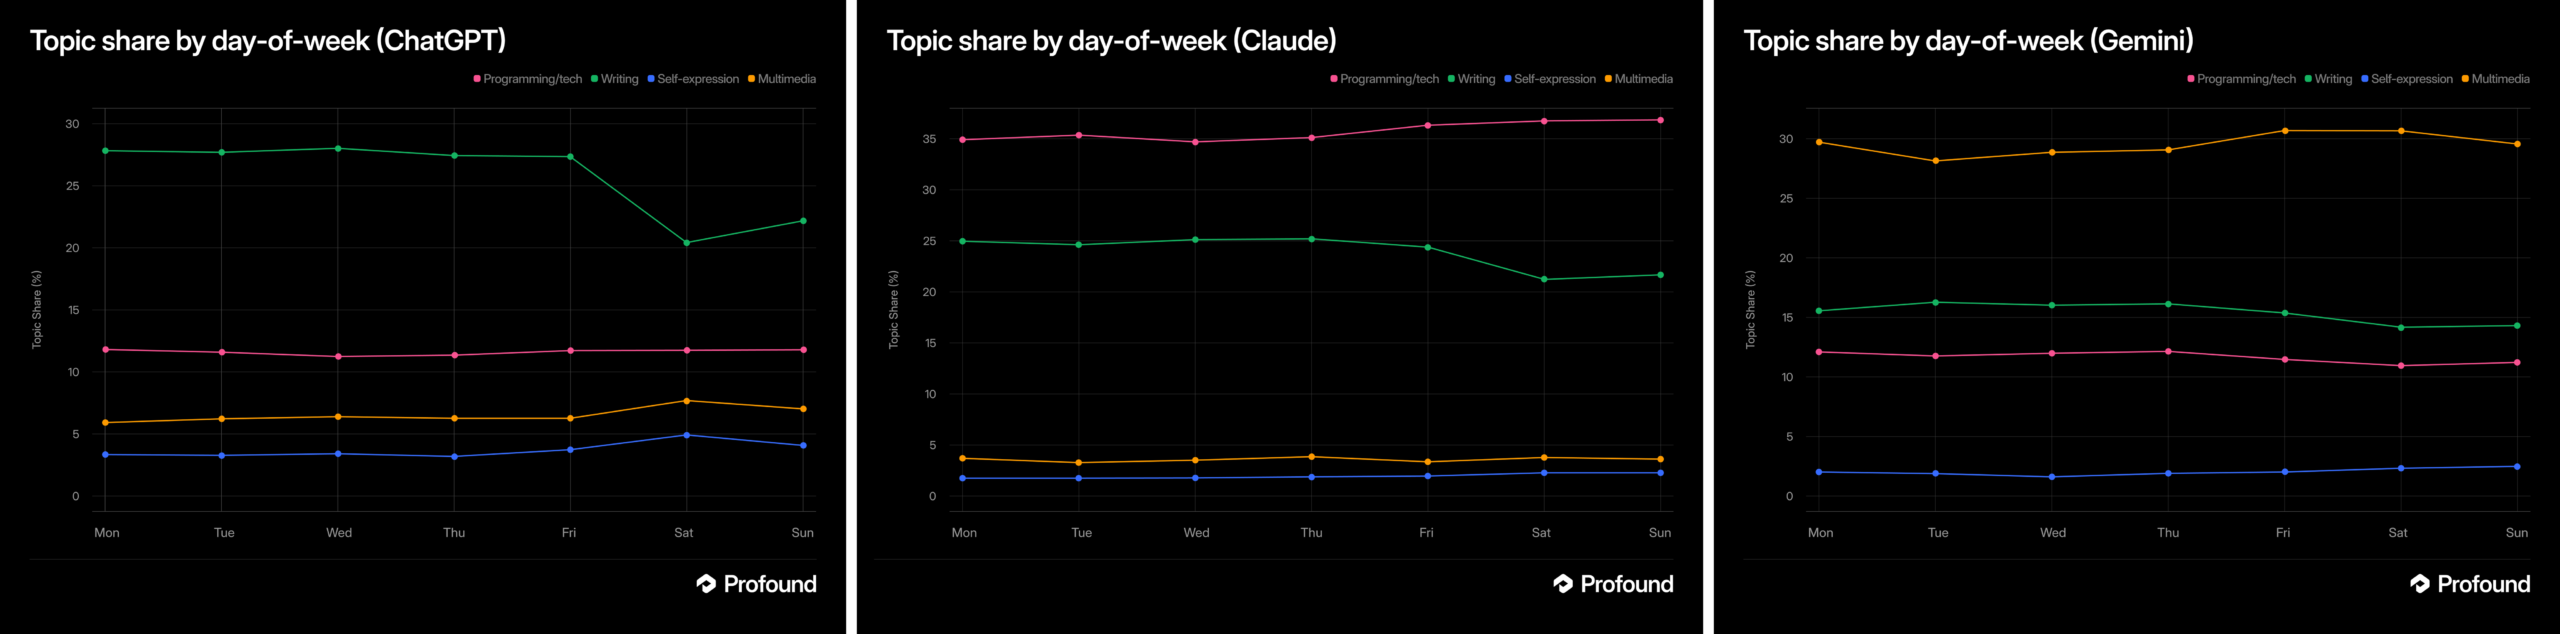
    Three line charts compare topic share by weekday for ChatGPT, Claude, and Gemini across four categories.
    Side-by-side weekday charts show writing highest for ChatGPT, programming/tech highest for Claude, and multimedia highest for Gemini, with weekend shifts.

    Key takeaways

    • AI assistant activity can form recurring daily and weekly patterns.
    • Those patterns may differ across platforms, regions, and individual users.
    • Timing should be evaluated within a defined audience and use case.
    • The source states the principle but does not supply data for specific hours or days.

    How teams can evaluate timing responsibly

    For marketers, publishers, and product teams, the practical response is to examine their own evidence. Analysis should begin with a clear question: which platform, audience, region, and outcome are being measured?
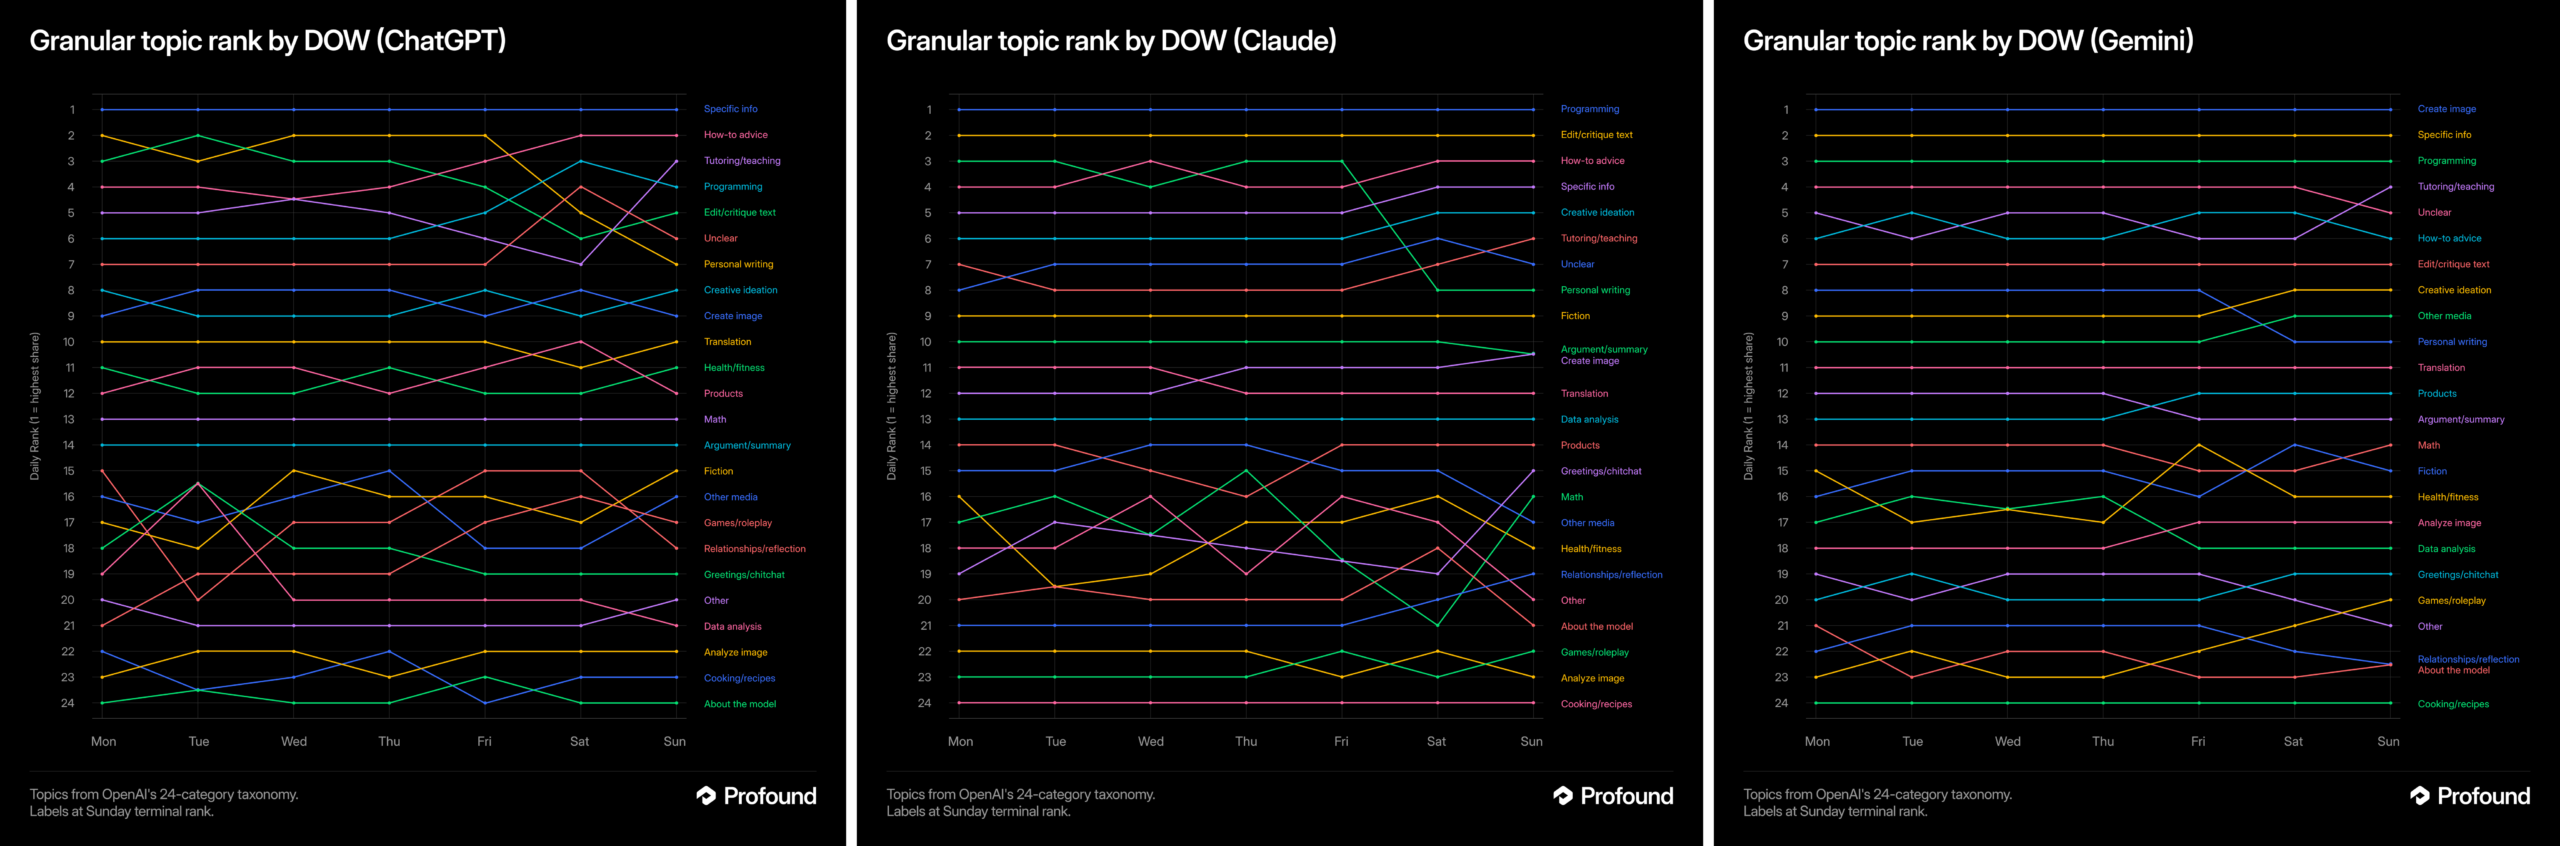
    Three dark line charts compare 24 topic rankings by day of week for ChatGPT, Claude, and Gemini.
    Side-by-side charts titled "Granular topic rank by DOW" trace colored topic rankings from Monday through Sunday for ChatGPT, Claude, and Gemini.

    Teams can then compare consistent time periods, use the relevant local time zone, and separate audience segments where possible. They should also distinguish between activity and impact. A busy period does not necessarily produce the most valuable visits, recommendations, conversions, or customer outcomes.

    Any apparent rhythm should be treated as a working pattern rather than a permanent rule. User behavior, product design, and the mix of use cases can change, so conclusions need periodic review.

    What the source does not establish

    Try Profound Blog does not identify peak hours, preferred weekdays, regional differences, or platform-specific results in the supplied material. It also does not describe a study or methodology. Claims about exact schedules would therefore go beyond the available evidence.

    The defensible conclusion is narrower: AI usage has timing patterns, and context determines what those patterns mean. Organizations that want actionable answers will need to measure the audiences and outcomes that matter to them.


    Inspired by this post on Try Profound Blog.


    crushpress.ai community screenshot
  • Discover How AI Transforms User Behavior in Search Results

    Discover How AI Transforms User Behavior in Search Results

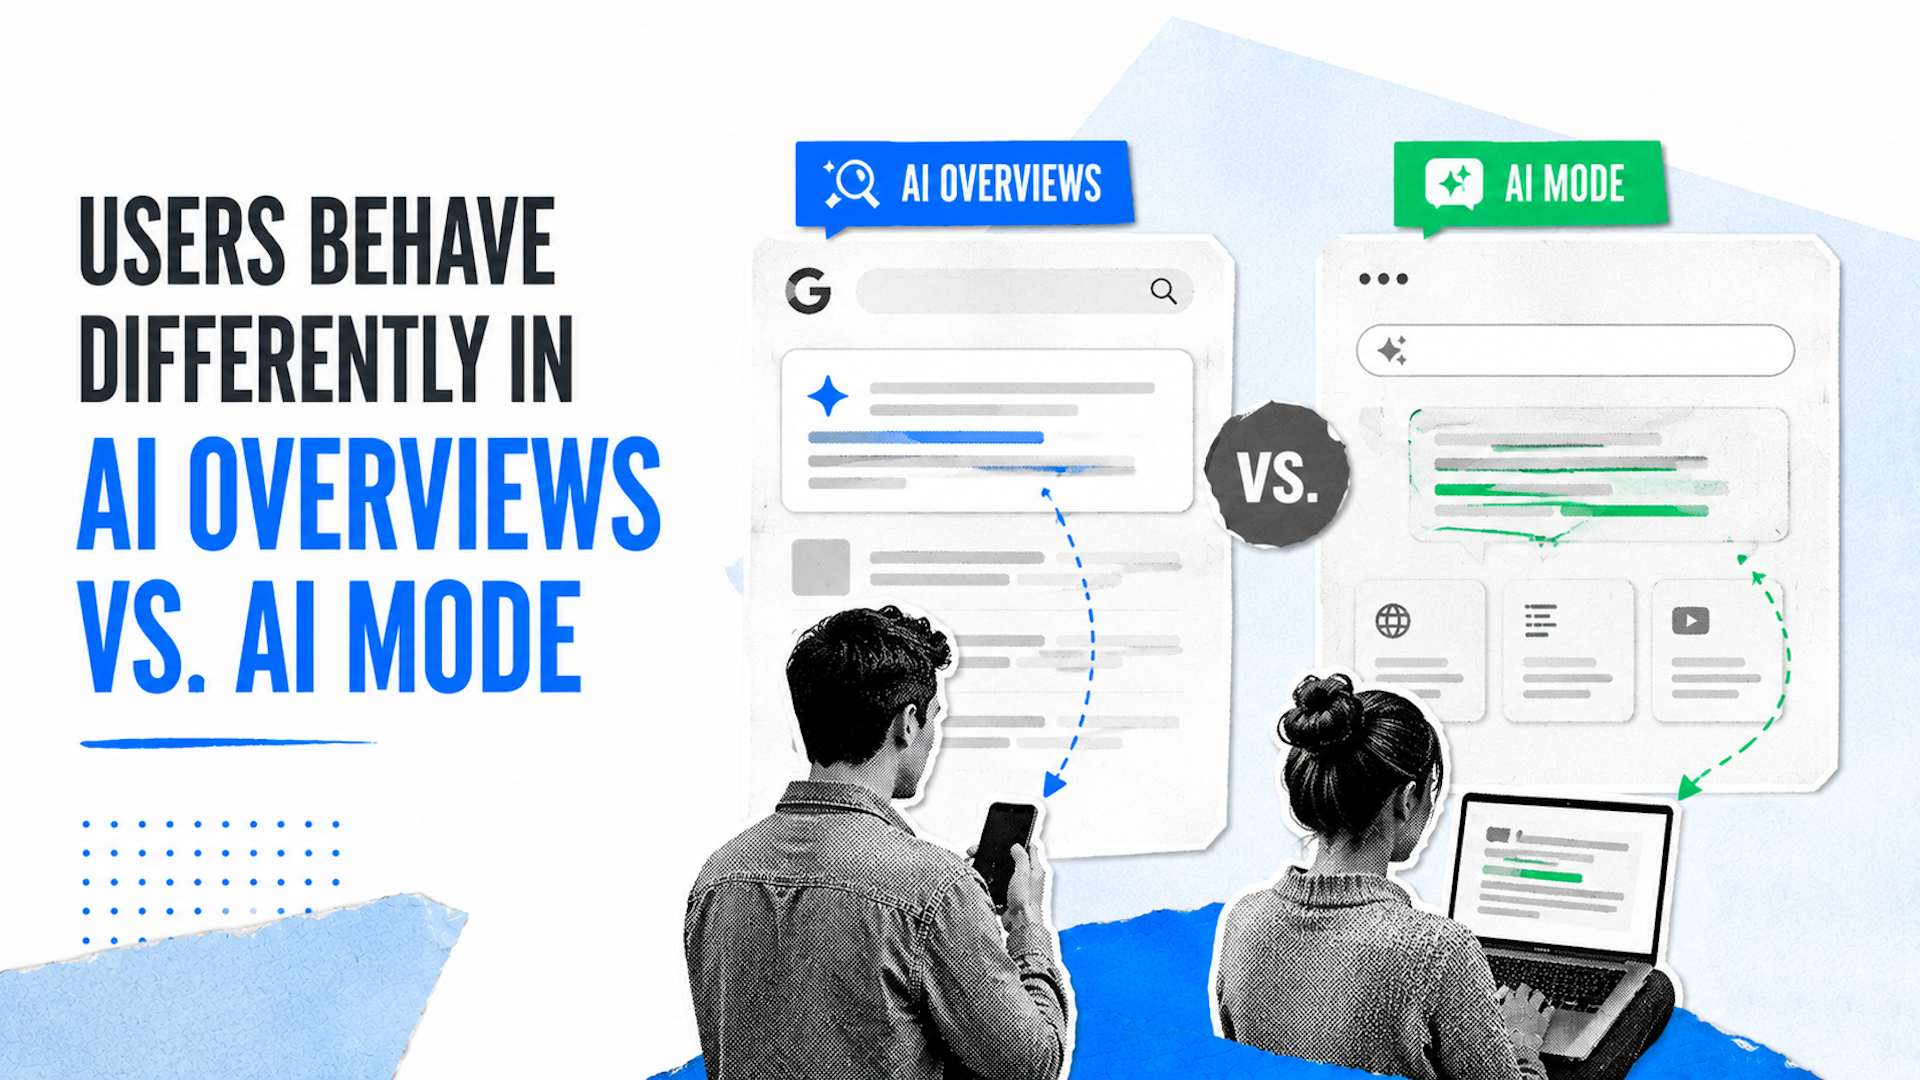
    I find it fascinating that users interact differently when faced with AI Overviews compared to AI Mode. New clickstream data reveals that AI Overviews significantly alter user behavior—from reverse scrolling to extended evaluation of search results across various intents.

    Take Netflix, for example. The average user spends about 18 minutes just browsing. They skim through tiles, watch trailers, and often circle back. It turns out, searching isn’t much different these days, thanks to new insights.

    ```json
{
  "alt": "Decorative black border with molecular design in the center and symmetrical ornate patterns on each side.",
  "caption": "Elegantly symmetrical border featuring a central molecular motif, flanked by intricate, ornamental designs. Perfect for scientific-themed decor!",
  "description": "This image showcases a decorative black border with a central molecular design, symbolizing a connection to science or chemistry. The molecular motif is flanked by symmetrical, ornate designs that add elegance and detail, making it ideal for themed prints or textures. The balance between scientific and artistic elements makes this border versatile for various aesthetic applications."
}
```

    This week, I’m diving into:

    ```json
{
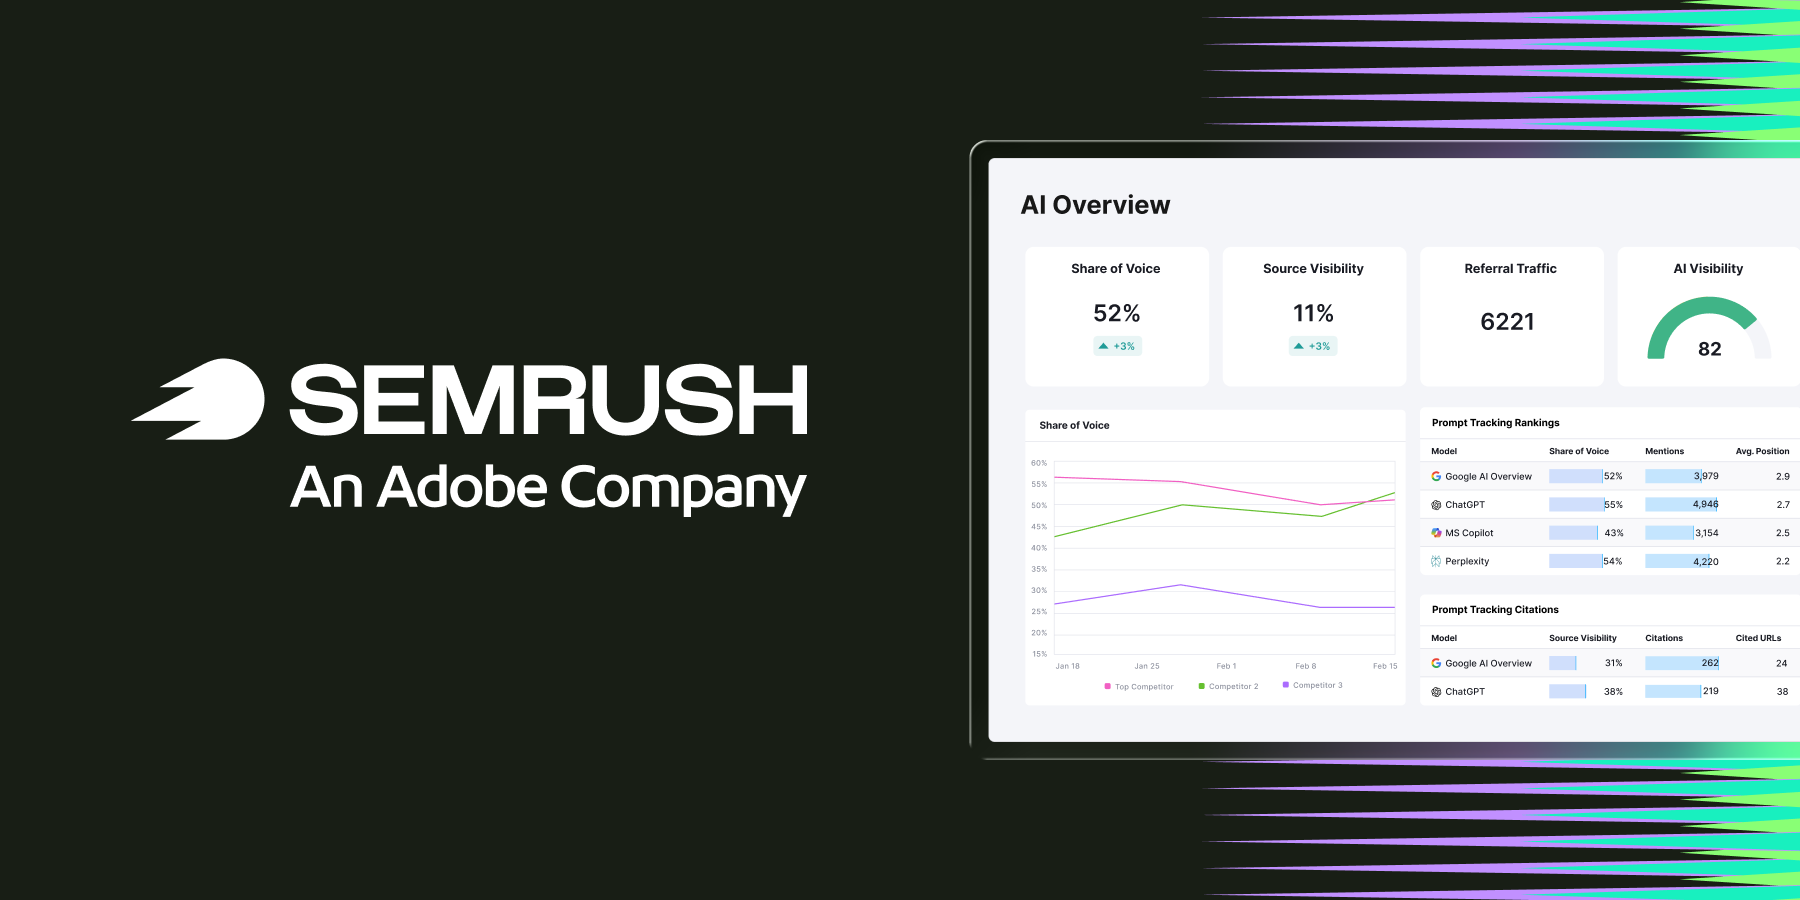
  "alt": "SEMRUSH logo and analytics dashboard displaying AI overview with metrics on a black background.",
  "caption": "Explore insights with SEMRUSH's AI overview dashboard, showcasing key metrics like share of voice and referral traffic for smarter decision-making.",
  "description": "This image features the SEMRUSH logo alongside an analytics dashboard on a sleek black background. The dashboard presents an AI overview with detailed metrics such as Share of Voice at 52%, Source Visibility at 11%, and Referral Traffic at 6221. Graphs and ranking data are also displayed, aiding in visualizing complex data for strategic analysis. Perfect for businesses aiming to enhance their online presence through insightful analytics. Keywords: SEMRUSH, analytics, AI, metrics, dashboard."
}
```
    • Four notable behavioral shifts observed with AI Overviews, gathered from over 846,000 Google sessions.
    • The evolving role of brand-name searches and why they no longer offer the same shortcuts.
    • An insight that might change how you craft title tags and meta descriptions this quarter.
    ```json
{
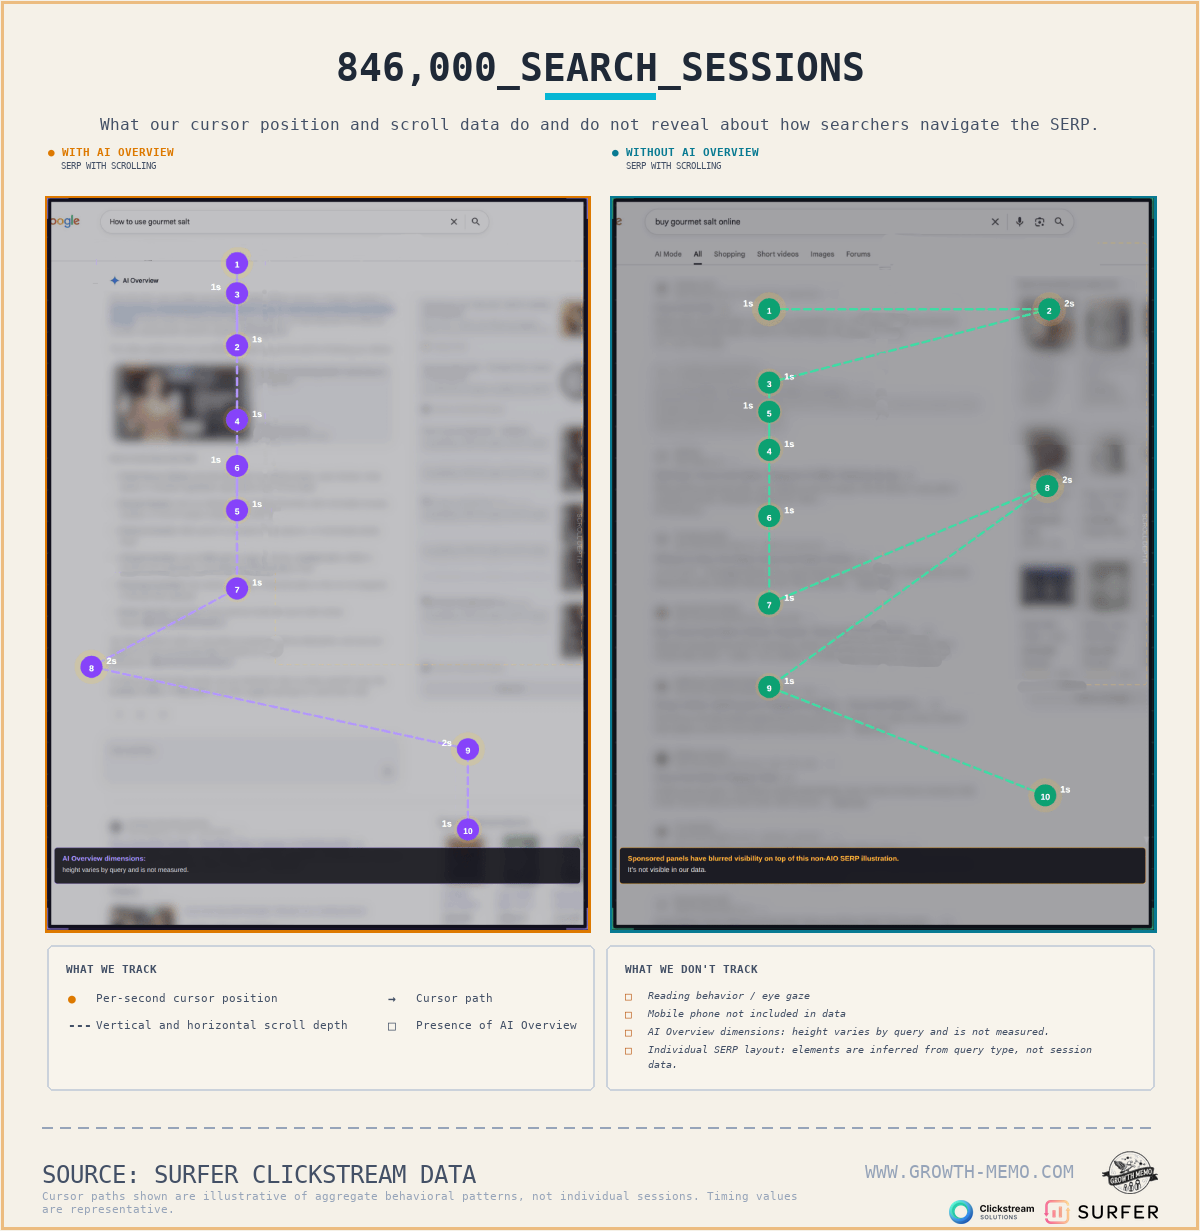
  "alt": "Two SERP screenshots showing cursor paths with and without AI Overview for search queries.",
  "caption": "Exploring user interaction with SERPs: a visual comparison of 846,000 search sessions, highlighting differences in cursor behavior with and without AI Overview.",
  "description": "This image illustrates user cursor paths on search engine results pages (SERPs) with and without AI Overview integration. The left screenshot displays the path for 'How to use gourmet salt,' showing detailed interactions and scrolling. The right screenshot displays 'Buy gourmet salt online' with notable differences in behavior. Data is sourced from Surfer Clickstream, focusing on cursor position tracking, excluding reading behavior, mobile usage, AI dimension metrics, and SERP layout specifics. Ideal for understanding searcher behavior insights."
}
```

    Eric Van Buskirk from Clickstream Solutions mined anonymized clickstream data supplied by Surfer SEO. The study analyzed around 846,000 U.S.-based Google searches from February and March of 2026.

    ```json
{
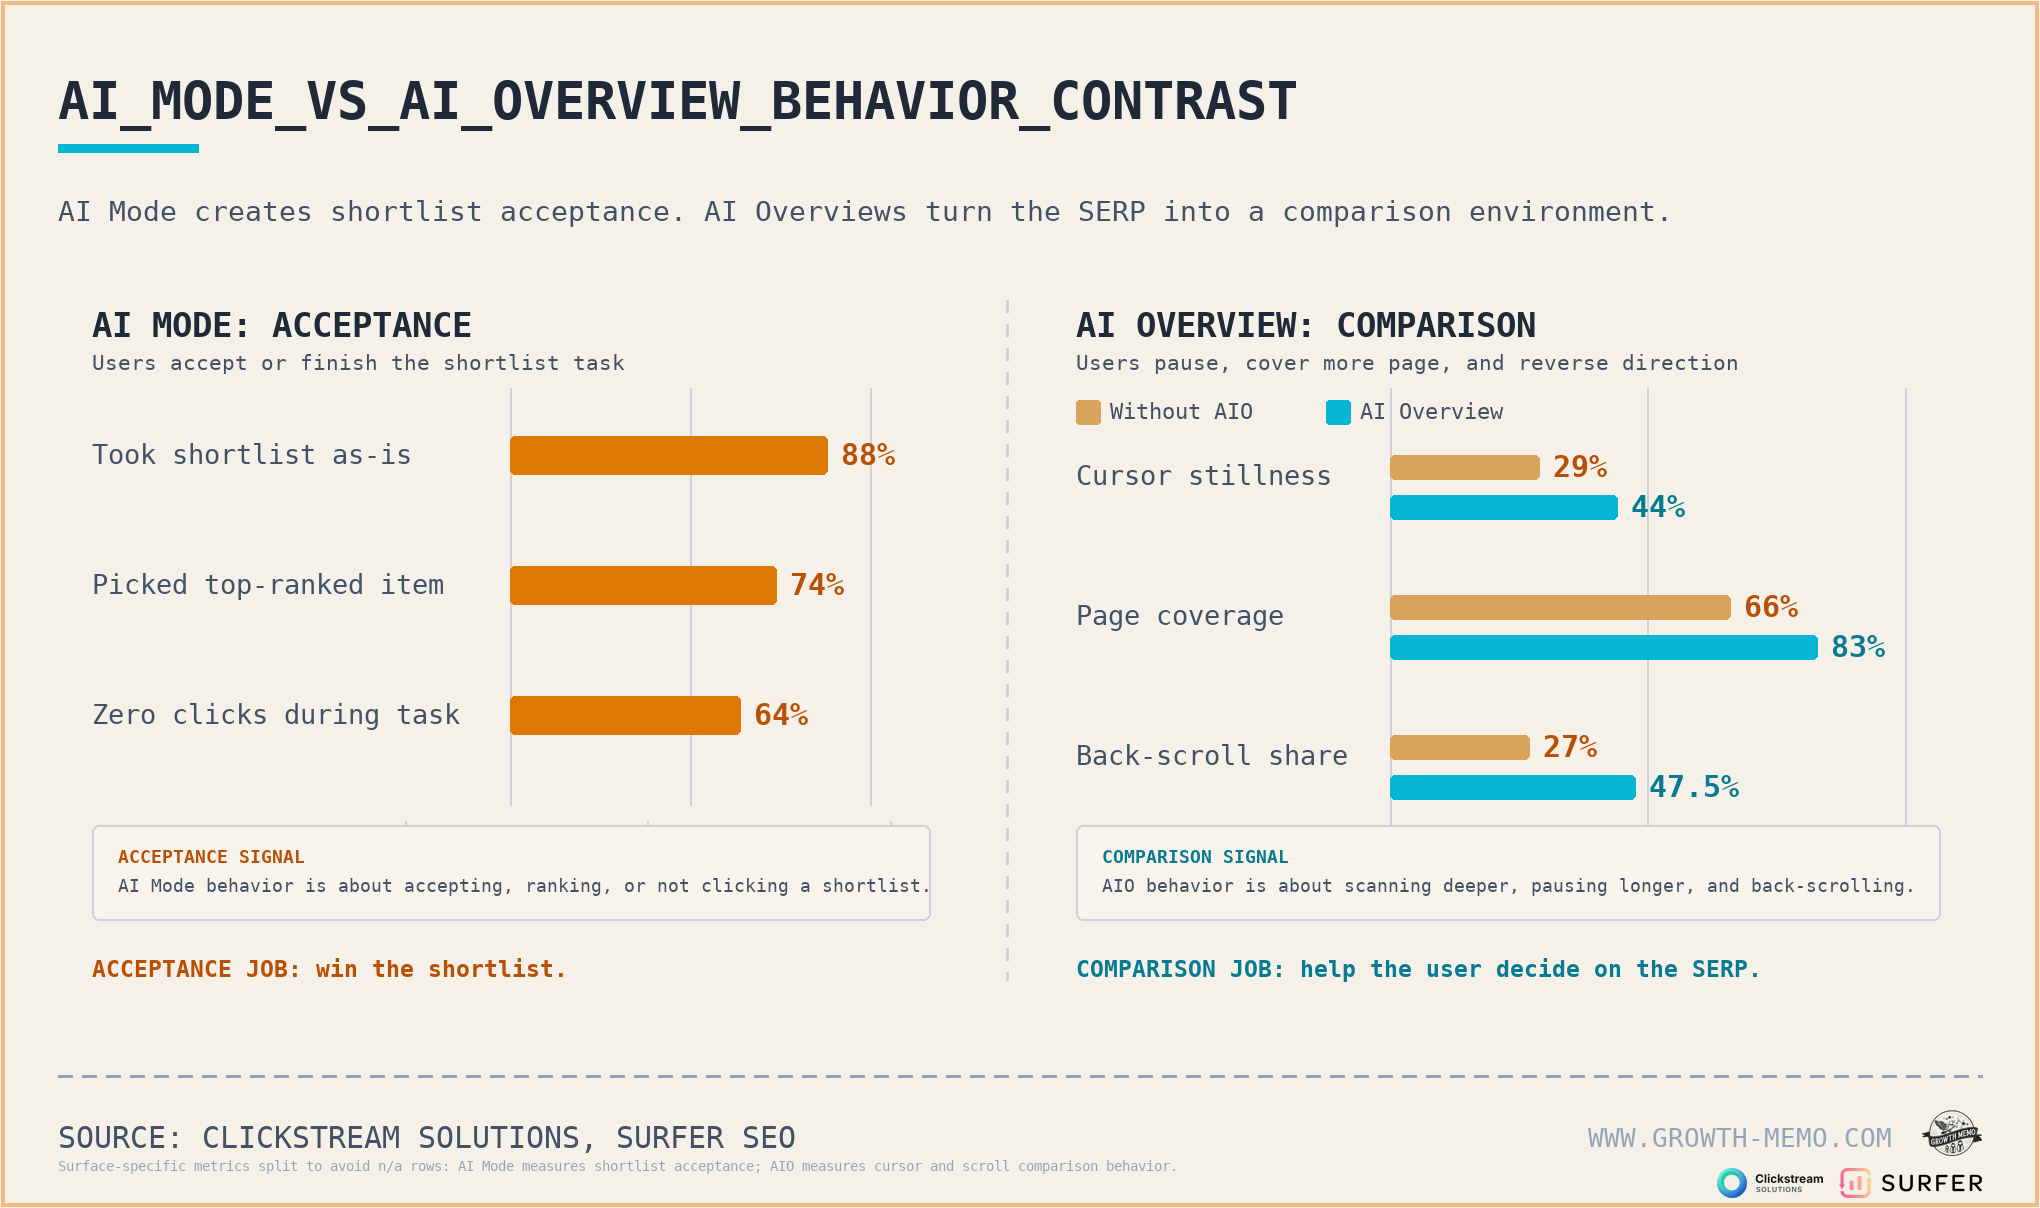
  "alt": "Comparison chart of AI Mode acceptance vs AI Overview comparison behaviors.",
  "caption": "Exploring how AI Mode and AI Overview impact user behavior, this chart reveals acceptance versus comparison tendencies on SERPs.",
  "description": "The image presents a comparison chart illustrating the differences in user behavior between AI Mode and AI Overview. In AI Mode, users largely accept suggestions with 88% taking the shortlist as-is, 74% picking the top-ranked item, and 64% having zero clicks during the task. In AI Overview, users exhibit more comparison behaviors, such as 44% cursor stillness, 83% page coverage, and 47.5% back-scroll share. This data, sourced from Clickstream Solutions and Surfer SEO, highlights how AI features influence search engine result page interactions."
}
```

    This marks the fifth study on user behavior with Google’s AI features over the past year. Earlier, a UX study on 70 users in May 2025 utilized think-aloud and screen recording methods, while a study from October 2025 examined AI Mode specifically. This research trades depth for scale, uncovering patterns too subtle for smaller studies.

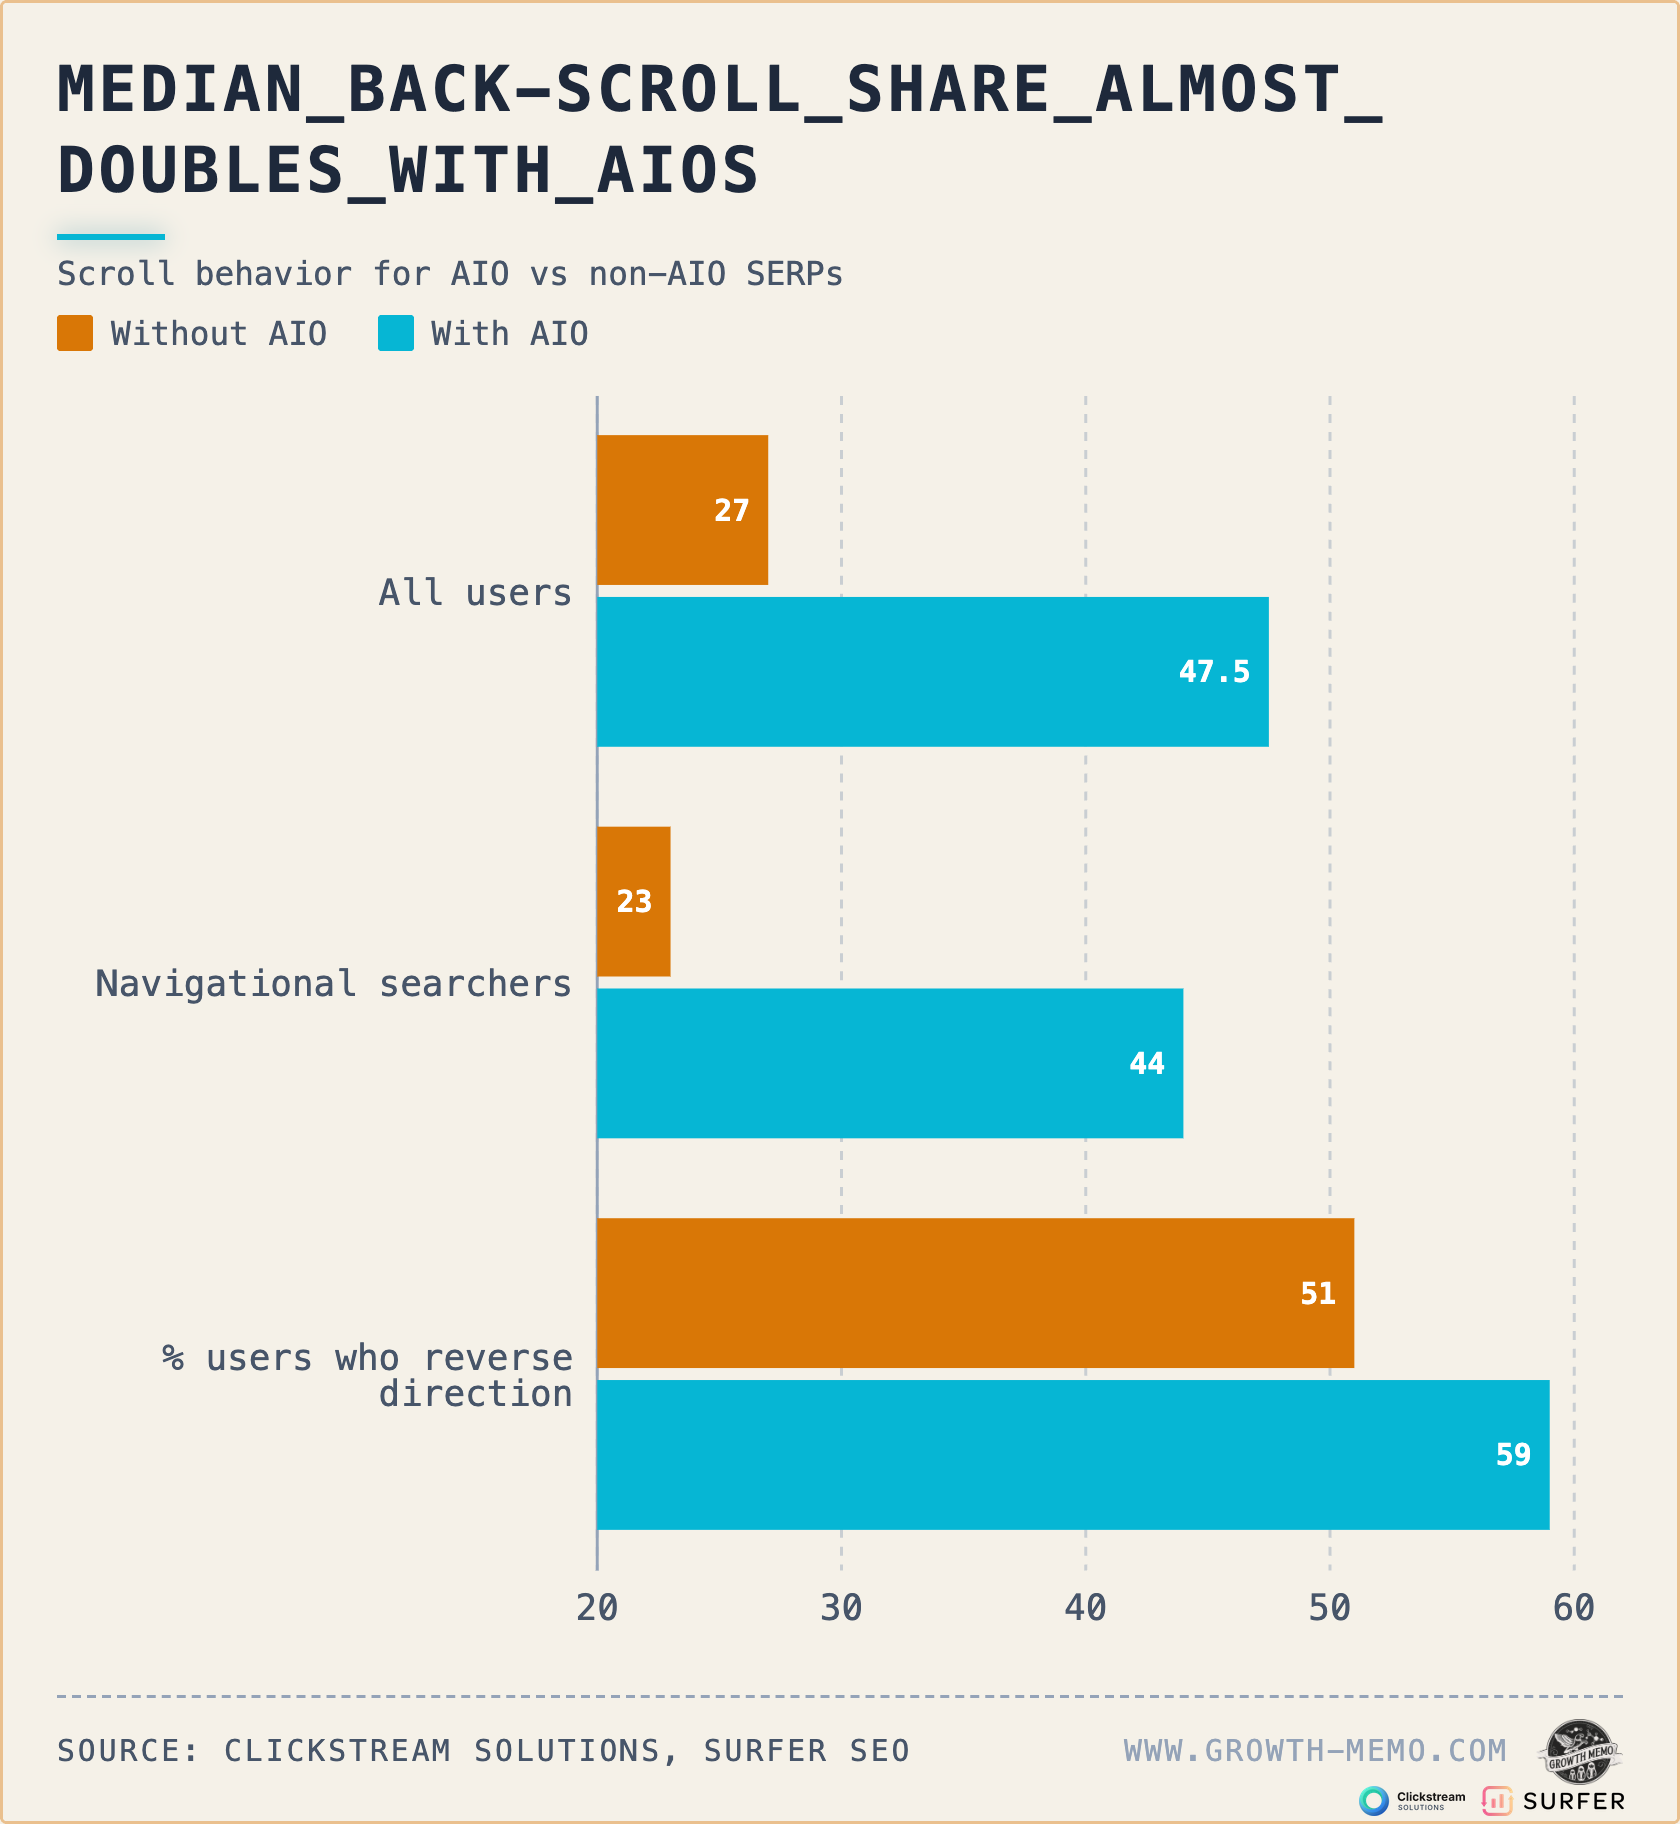
    ```json
{
  "alt": "Graph comparing scroll behavior for AIO versus non-AIO SERPs across different user categories.",
  "caption": "Explore how All-Intent Optimization (AIO) impacts user scroll behavior on search results pages. Discover intriguing differences among user groups!",
  "description": "This bar graph illustrates scroll behavior differences for search engine results pages (SERPs) with and without All-Intent Optimization (AIO). It compares three user categories: all users, navigational searchers, and users who reverse direction. The graph shows a notable increase in back-scroll share for SERPs with AIO, highlighting how AIO impacts user interaction. Data source: Clickstream Solutions and Surfer SEO."
}
```

    For a bit of context, previous SERP mouse-tracking studies involved only a handful of people—this one, however, evaluates queries from tens of thousands of users.

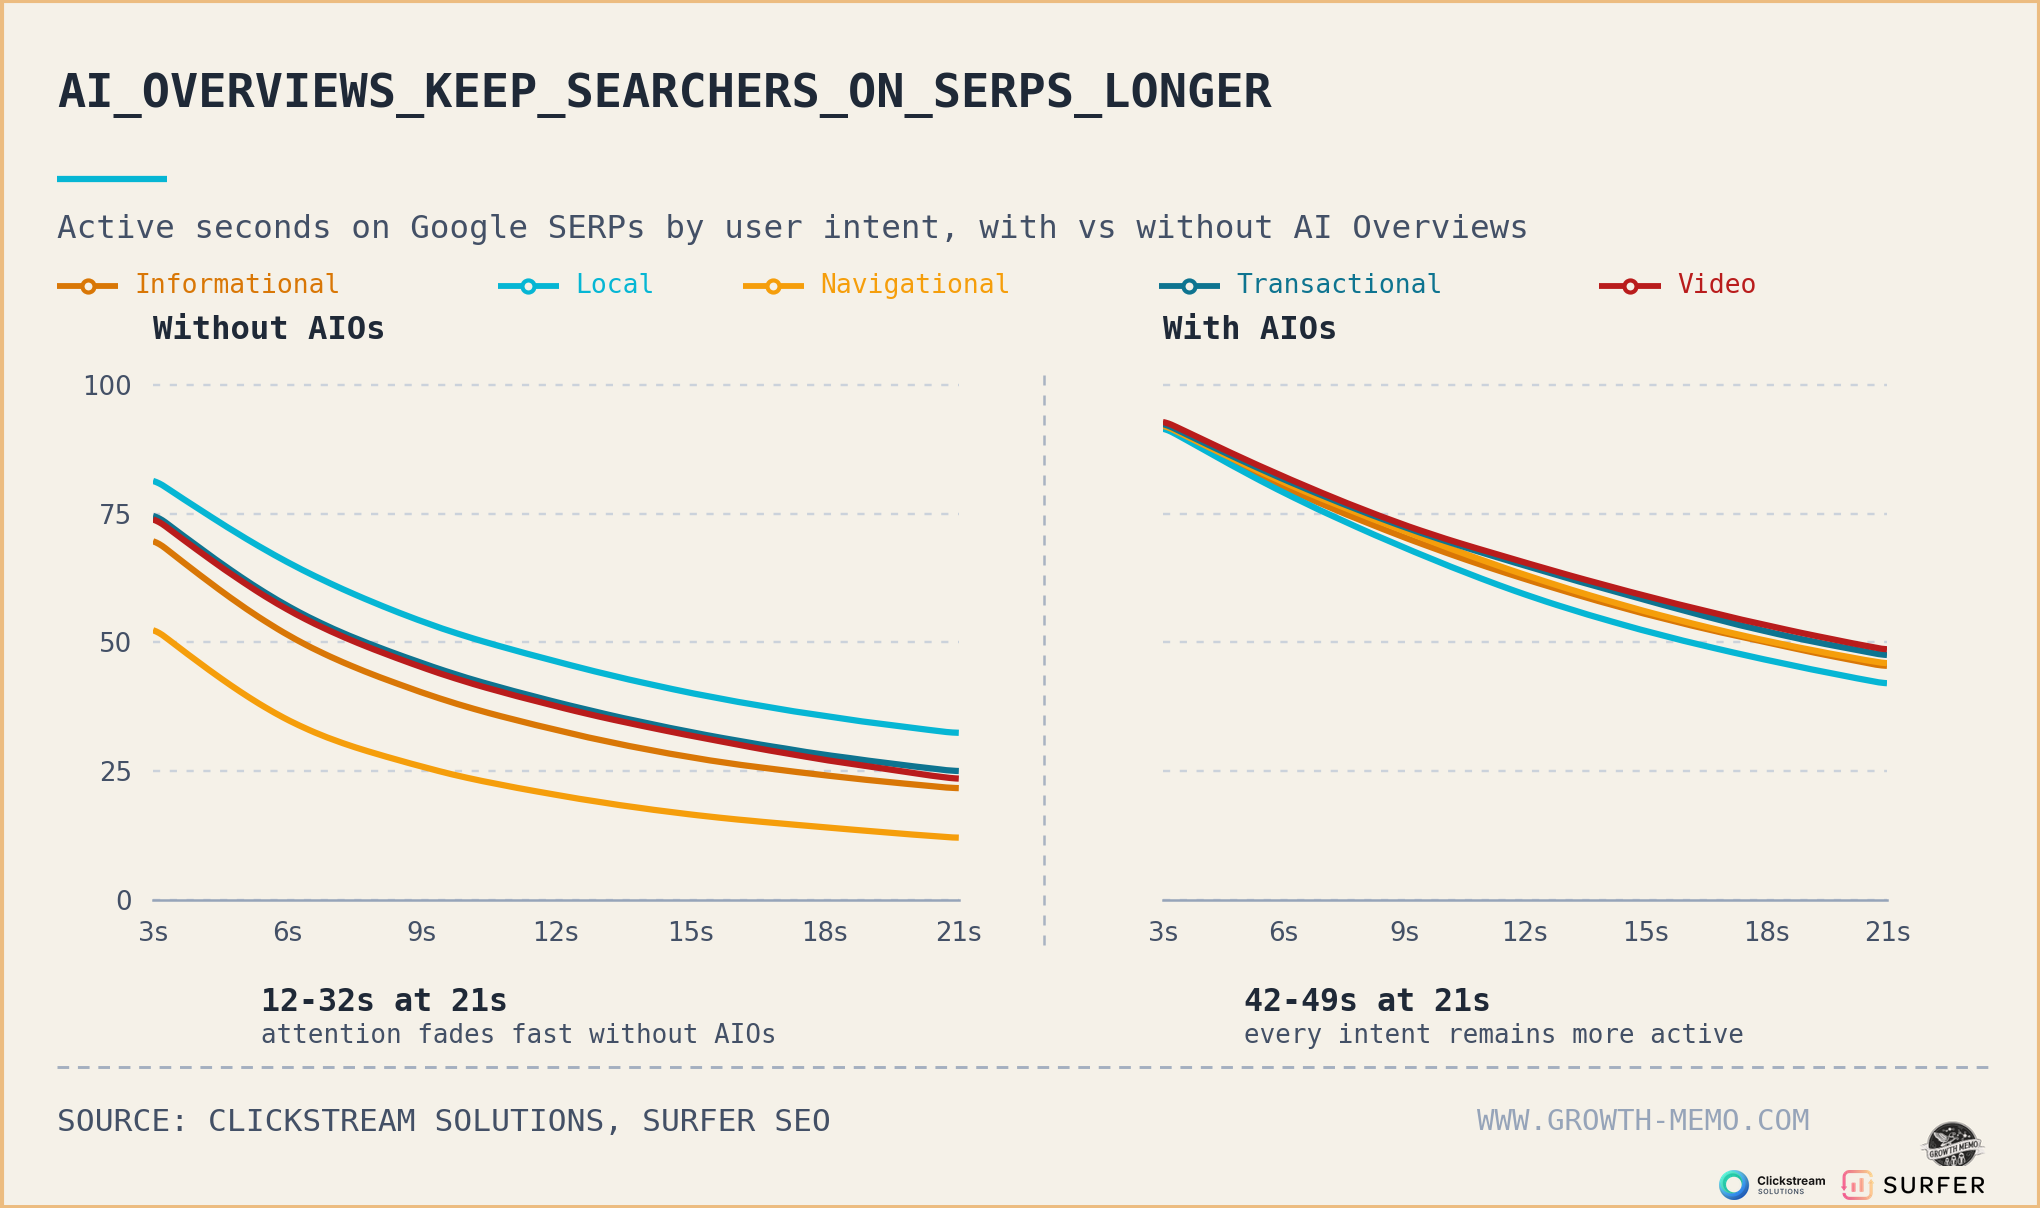
    ```json
{
  "alt": "Comparison of user activity on Google SERPs with and without AI Overviews across different intents.",
  "caption": "AI Overviews enhance engagement on Google SERPs, showing longer activity times across all user intents.",
  "description": "This graph illustrates the impact of AI Overviews on user activity time on Google SERPs by different user intents: informational, local, navigational, transactional, and video. Without AI Overviews, activity drops quickly from 12-32 seconds, while with AI Overviews, activity sustains longer, from 42-49 seconds. The data is sourced from Clickstream Solutions and Surfer SEO, highlighting significant engagement improvements with the integration of AI Overviews on search pages."
}
```

    A fascinating contrast surfaces: User behavior in AI Overviews starkly opposes that in AI Mode, where AI Mode is akin to autoplay, while AI Overviews replicate the browsing experience.

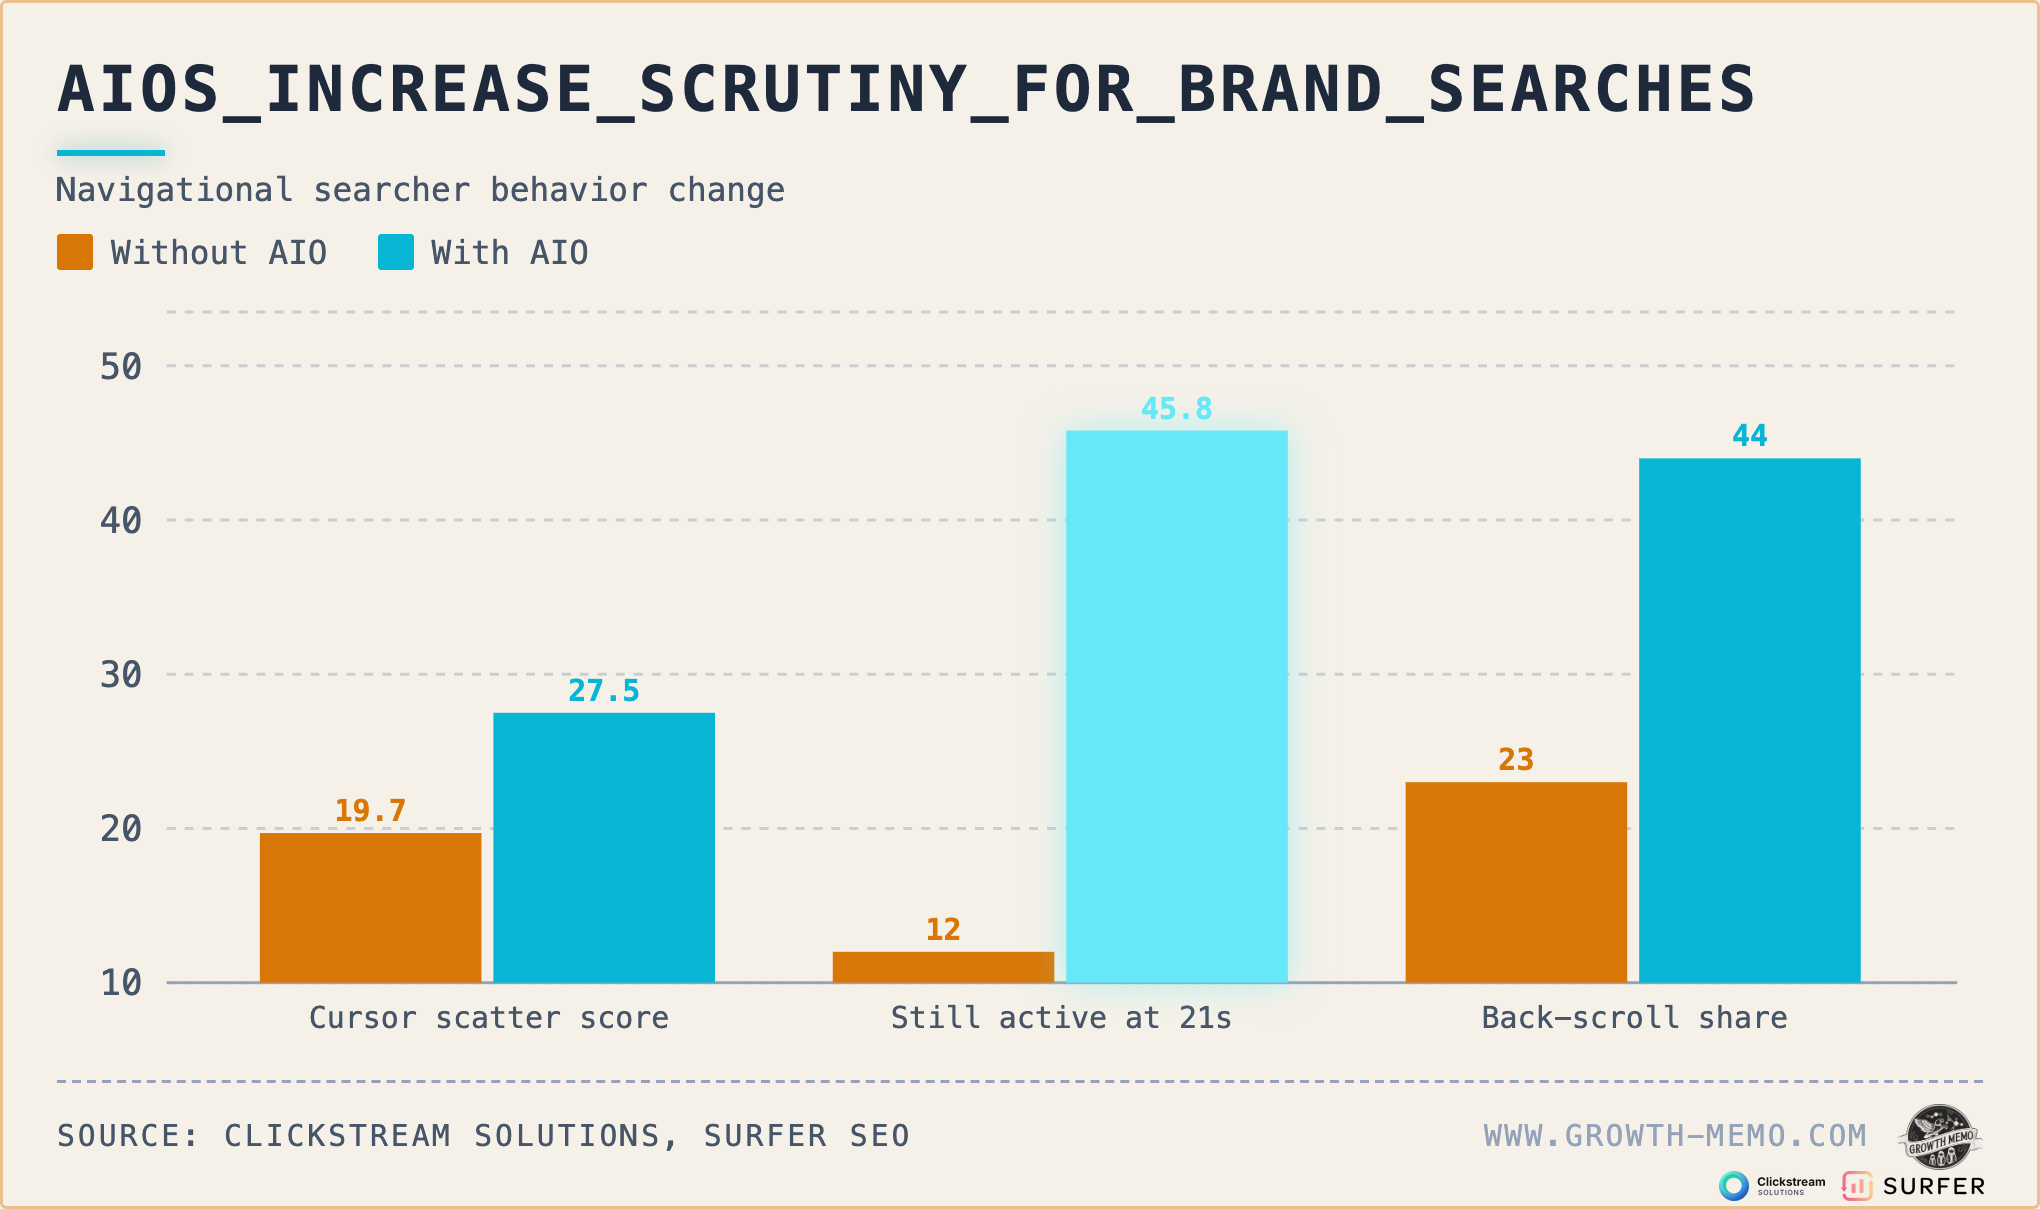
    ```json
{
  "alt": "Bar chart comparing searcher behavior with and without AI assistance in cursor scatter score, activity at 21 seconds, and back-scroll share.",
  "caption": "Discover how AI assistance influences searcher behavior! This chart reveals notable differences in cursor scatter, activity duration, and back-scroll tendencies.",
  "description": "This bar chart illustrates the impact of AI assistance on navigational searcher behavior. It compares metrics such as cursor scatter score, activity at 21 seconds, and back-scroll share with and without AI enhancement. The blue bars represent data with AI, showing higher values across all categories. This visual is sourced from Clickstream Solutions and Surfer SEO, as seen on growth-memo.com."
}
```

    This article outlines four major findings from this recent study and how they might influence your title tags and meta descriptions in 2026. Full methodology available here.

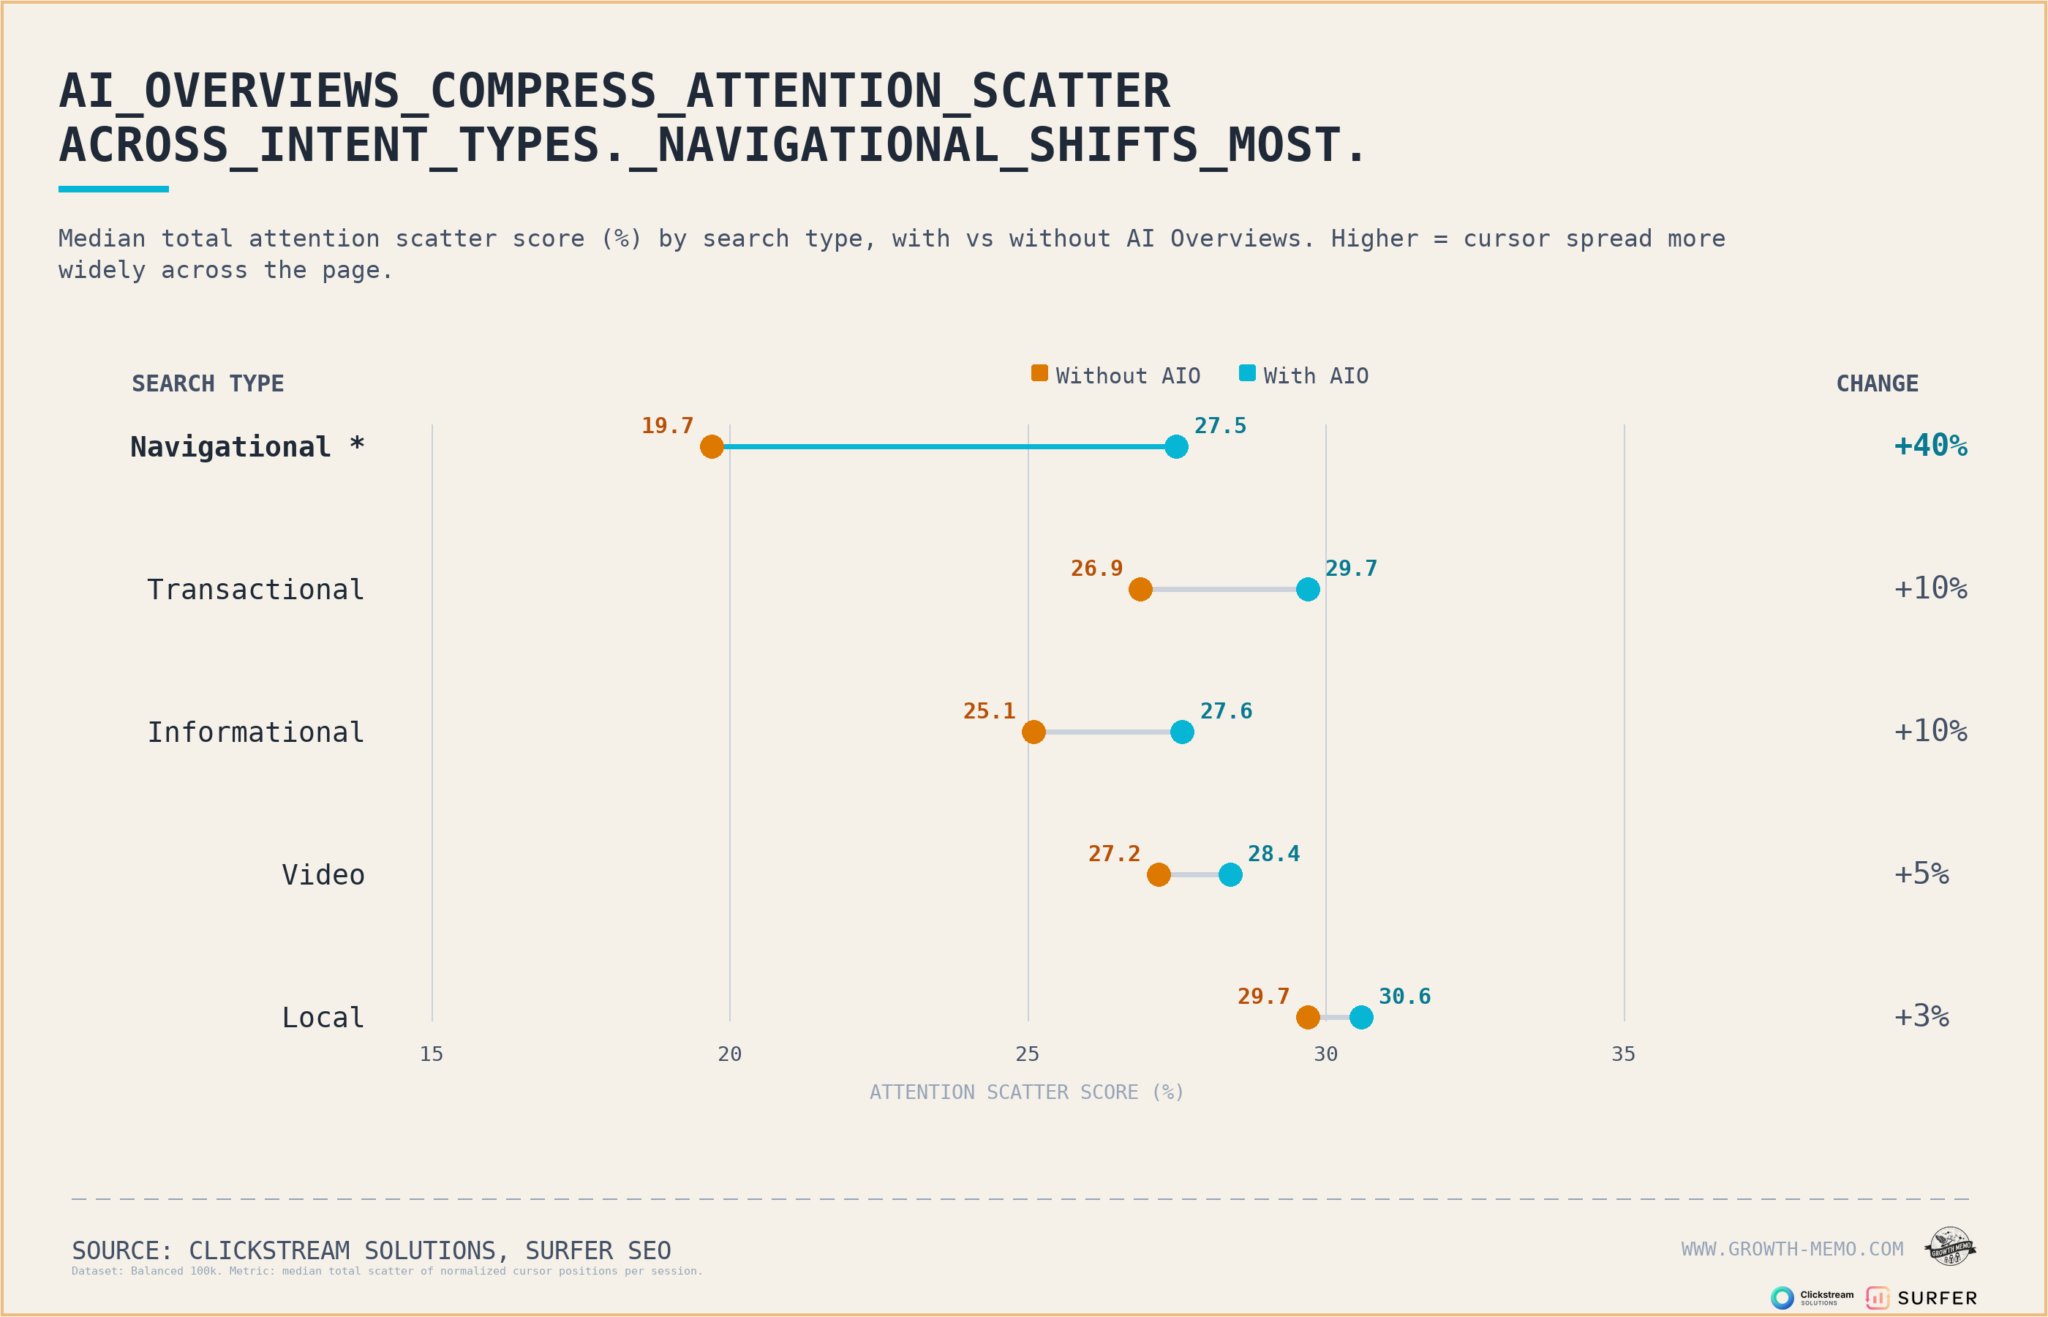
    ```json
{
  "alt": "Chart showing attention scatter scores by search type with and without AI overviews.",
  "caption": "How AI overviews impact attention: navigational searches exhibit the largest change!",
  "description": "This chart compares median attention scatter scores across different search types, both with and without AI overviews. Navigational queries show the most significant change, with a 40% increase when AI overviews are applied. Other types, such as transactional, informational, video, and local, also demonstrate changes in scores. Compiled by Clickstream Solutions and Surfer SEO, the data suggests AI overviews compress attention scatter, especially for navigational intents."
}
```

    With groundbreaking insights, like how nearly half of AI Overview interactions involve reverse scrolling and how search types no longer reliably predict behavior, this data is invaluable. It challenges traditional assumptions and has meaningful implications for e-commerce and decision-heavy categories.

    Surprising findings include brand searches losing their shortcut advantage, implying even users searching specifically for brands might pause to consider adjacent content on the SERP.

    Read more intriguing insights on how the AI landscape shifts user engagement and strategy in SEO.


    Inspired by this post on Search Engine Land.


    crushpress.ai community screenshot