
Build Trust in Your Marketing Data to Eliminate Skepticism

```json
{
  "alt": "Digital representation of an attribution model with colorful data streams labeled Search, Social, Email, and more converging.",
  "caption": "Dive into the digital realm where streams of data converge into an advanced attribution model, illustrating the complexity of modern analytics.",
  "description": "This image shows a futuristic visualization of an attribution model within a high-tech environment. Multiple colorful streams, labeled with digital channels like Search, Social, Email, and Referrals, converge into a central hub. This scene represents the complex intersection of unified data and insights, crucial for digital marketing and analytics. Perfect for illustrating concepts in data analysis, marketing attribution, and business strategy."
}
```

As a marketer, I know how it feels to operate with a hidden skepticism tax. Trusting marketing data can be a challenge, often leading to countless hours spent cleaning spreadsheets and reconciling conflicting reports. And let’s not forget second-guessing those attribution models and AI outputs.

This lack of trust slows down execution, weakens team alignment, and results in decisions built on shaky foundations. A prime example is branded search, which often undeservedly takes credit for conversions that were likely to happen anyway. It’s like crediting a revolving door for everyone who enters a building. This gap between correlation and causation highlights a broader issue in modern marketing—a reliance on fragmented or low-confidence data.

The key isn’t just collecting more data, but building a foundation of data we can actually rely on—through verified identities, unified reporting, cleaner pipelines, and a robust measurement framework designed to distinguish true signals from noise.

Let’s break down some core concepts behind building this foundation and the types of data environments they foster.
```json
{
  "alt": "Diagram ranking data trust levels: email/phone hash at 99%, authenticated login at 90%, device ID at 70%, IP address at 45%, and behavioral signals at 20%.",
  "caption": "Explore the trust scale of various data identifiers, from highly trusted email hashes to lower confidence behavioral signals, illustrating customer data reliance.",
  "description": "This image is a diagram depicting the trust levels of different data identifiers. It ranks email/phone hash match at 99% trust, used for billing and loyalty. Authenticated login holds 90% trust for personalized experiences. Device ID with cookies has 70% trust for retargeting. IP address and browser fingerprint at 45% support geo-targeting. Behavioral signals, with 20% trust, are used for prospecting. Keywords: data trust, customer data, identifiers, privacy."
}
```

Probabilistic vs. Deterministic

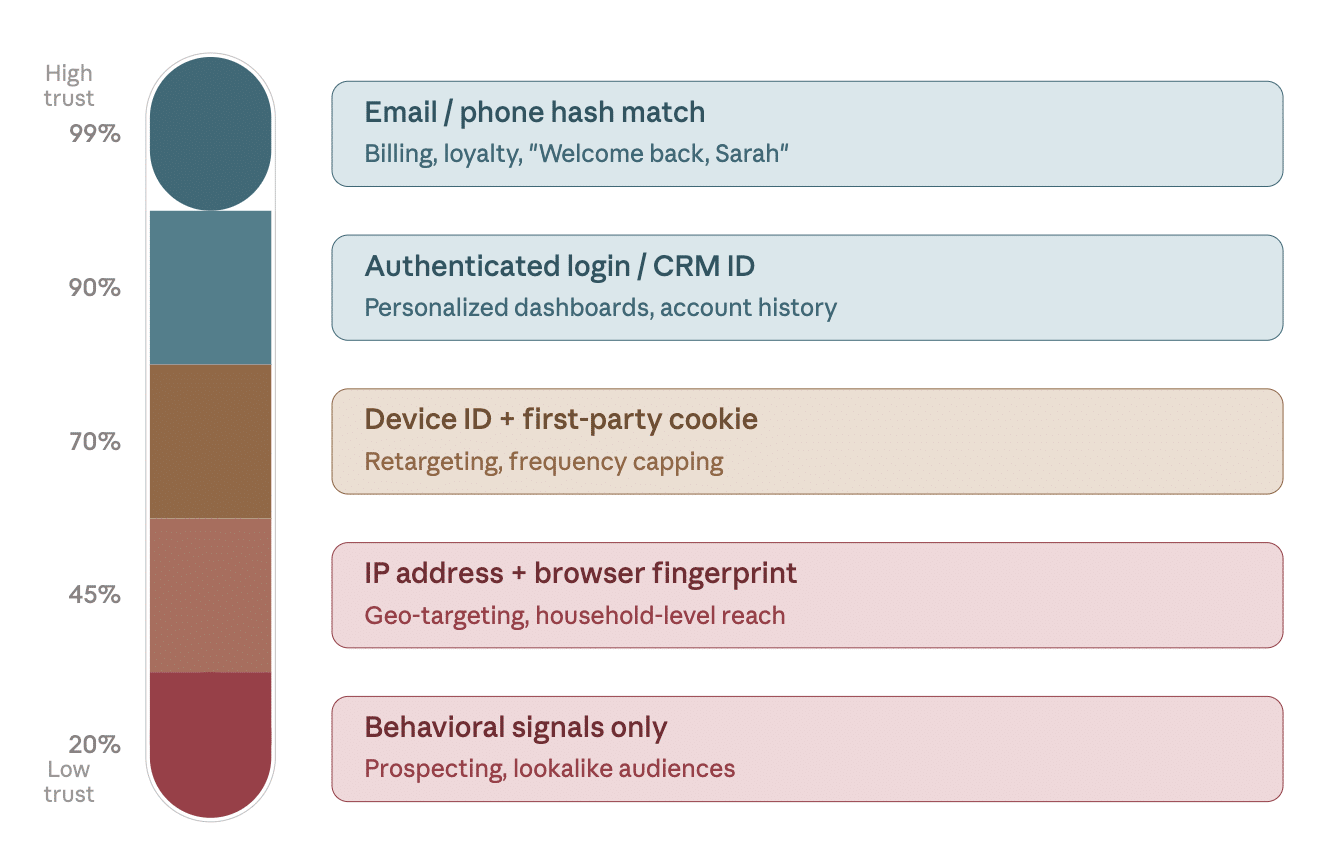
Consider a coffee shop loyalty app to explain probabilistic vs. deterministic data: When a customer logs in and orders, you know it’s Sarah. That’s deterministic. Conversely, if someone on the same Wi-Fi browses your menu without logging in, you might assume it’s Sarah based on the device and location signals—it’s probabilistic. Both have their uses, but assumptions can lead to inaccurate messages, like sending a “Happy Birthday, Sarah!” notification without certainty.

Using a data-to-confidence mapping, like the identity confidence thermometer, can help explain this concept effectively to clients.

Deterministic data sits at the top of the thermometer (100% confidence), with various probabilistic confidence levels descending down to the bottom.

```json
{
  "alt": "The CapmatchOne logo with a gradient circle and bold text.",
  "caption": "Discover innovation with the CapmatchOne logo, featuring sleek typography and a modern gradient circle.",
  "description": "The CapmatchOne logo features bold, modern typography coupled with a gradient circle, symbolizing connection and innovation. The sleek design conveys a sense of progress and creativity. This image can be used for branding or promotional purposes, appealing to audiences interested in innovative solutions and forward-thinking designs."
}
```

Siloed vs. Holistic

Imagine the old tale of blind folks describing an elephant: Marketing describes the trunk as a hose, Sales sees the leg as a tree, and Finance calls the tail a rope. This illustrates the pitfalls of siloed data in ROI reporting. A holistic approach ensures everyone sees the whole elephant.

In a more practical example, a B2B SaaS company runs LinkedIn ads. Marketing registers 5,000 form fills, Sales finds only 2,000 worthy leads in the CRM, and Finance reports 1,200 closed deals attributed to organic traffic due to broken UTMs. Different teams, different truths, zero confidence.

Here’s what these inconsistencies look like, contrasted with a unified data spine approach.
```json
{
  "alt": "Pyramid diagram showing zero-party, first-party, and third-party data in layers with trust and volume indicators.",
  "caption": "Explore the hierarchy of data in this pyramid diagram, highlighting the importance of zero-party data and the impact of cookie deprecation on third-party data.",
  "description": "This image presents a pyramid diagram divided into three layers. The top layer is 'Zero-party' data, labeled as 'Declared,' representing high trust and low volume data such as specific customer preferences. The middle layer is 'First-party' data, labeled 'Observed,' indicating actions like attending open houses. The bottom layer, 'Third-party' data, marked 'Inferred,' is depicted as low trust, high volume, and is affected by cookie deprecation. This visualization captures the dynamics of data collection and privacy concerns."
}
```

Third, First, and Zero-Party Data

Think about buying a house:

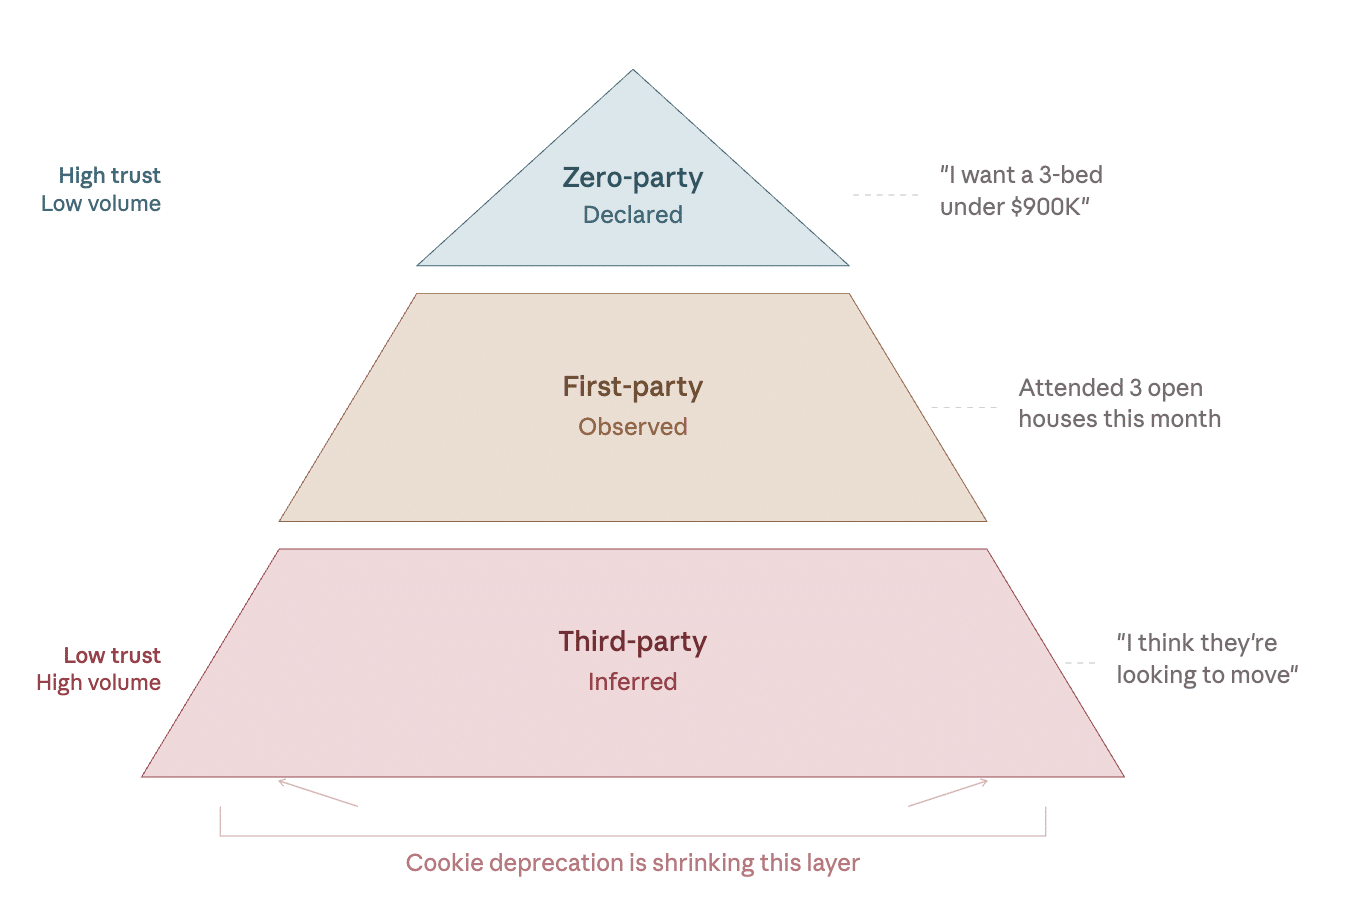
  • Third-party data: a nosy neighbor speculating about a move—it’s just hearsay.
  • First-party data: a realtor who sees them attending open houses—observed behavior.
  • Zero-party data: the buyer expressing intent on a form—it’s direct communication.

As cookies fade away, marketers will shift from widespread hearsay to less frequent but more valuable direct interactions.

Visualize this as a pyramid: third-party data at the base (widest, lowest trust), first-party in the middle, and zero-party at the top (narrowest, highest trust).
```json
{
  "alt": "Flowchart comparing old and new CRM data processing approaches, highlighting data quality improvements.",
  "caption": "Evolving Data Management: A shift from raw CRM data swamps to refined, quality-driven data processing ensures accuracy and reliability in AI models.",
  "description": "This image illustrates a flowchart comparing two approaches to CRM data processing. The old method involves processing 500K raw CRM rows into a 'data swamp' with duplicates and inconsistencies, leading to incorrect AI results. The new approach introduces a 'confidence layer' that validates and formats the data, reducing it to 150K clean rows for accurate AI outcomes, with 350K rows rejected for quality improvement. Keywords: CRM, data processing, AI, data quality, flowchart."
}
```

Big Data vs. Correct Data

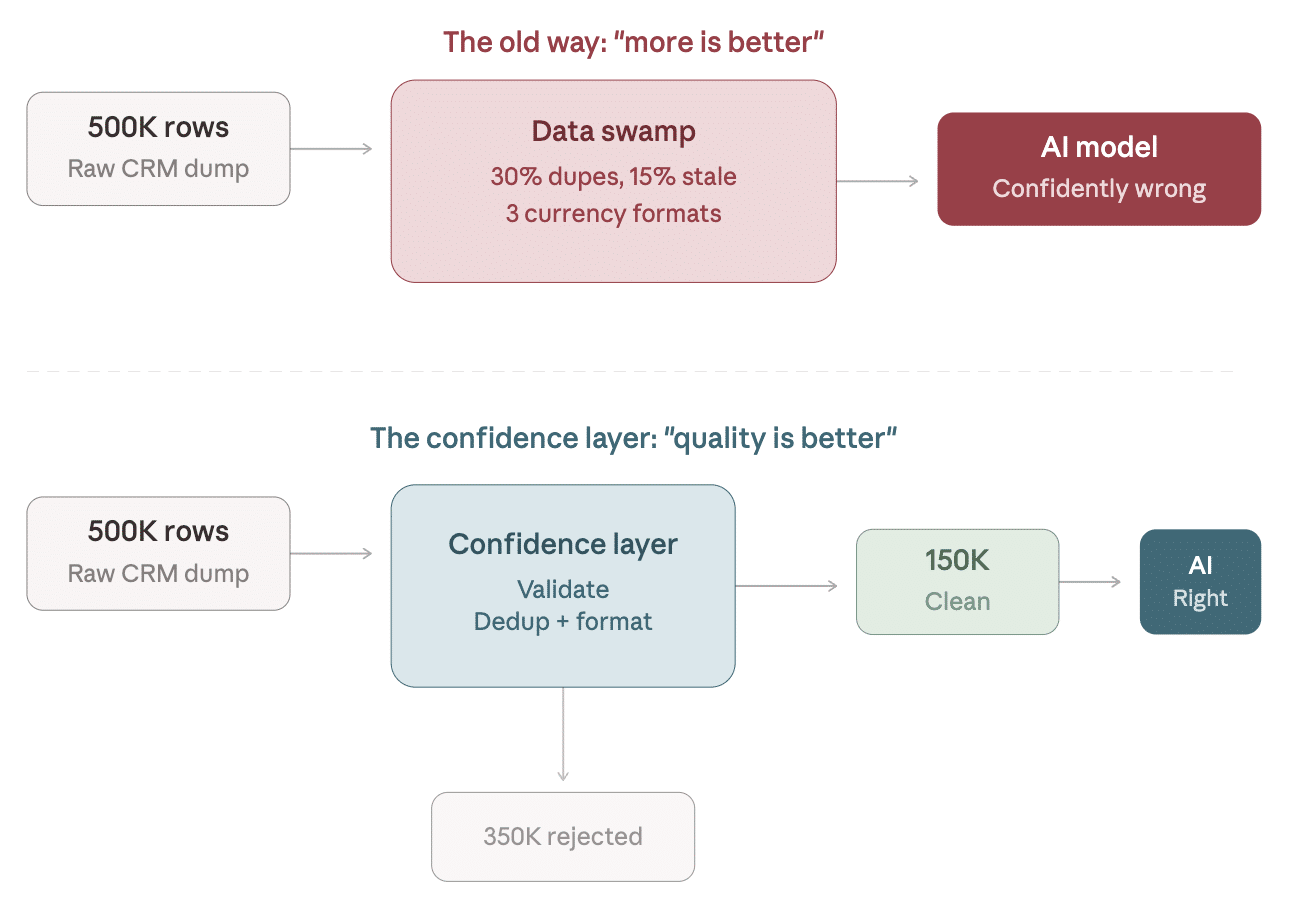
Picture a cluttered kitchen where nothing is ever discarded. The fridge is full, but half the contents have expired, forcing you to sift through it all for a single fresh ingredient. Occasionally, you use something spoiled—this is ‘big data’ for you.

By contrast, ‘correct data’ is a well-organized pantry: fewer items, all fresh, accurately labeled, and easily accessible. Consider feeding an AI model a massive data set with duplicates and errors—it might mislead rather than help you make informed decisions.

Here’s a visual metaphor of raw data flowing into a ‘swamp’ versus passing through a filter into a clean, reliable reservoir.
```json
{
  "alt": "Comparison of Dashboard vs Incremental ROAS for marketing channels showing differences in perceived and actual effectiveness.",
  "caption": "Uncover the truth! See how your marketing dashboard's ROAS estimates stack up against real outcomes, revealing surprising insights in strategic effectiveness.",
  "description": "This image features a side-by-side bar chart comparison of 'Dashboard ROAS' and 'Incremental ROAS' for several marketing channels: Branded Search, Retargeting, FB Prospecting, and YT Awareness. The left chart illustrates the perceived effectiveness according to the dashboard, while the right chart shows the actual results. The stark contrast highlights the difference between correlation on dashboards and true causation, providing a valuable insight for marketing strategy analysis. Keywords: ROAS, dashboard, incremental, marketing channels, effectiveness."
}
```

Correlation vs. Causation

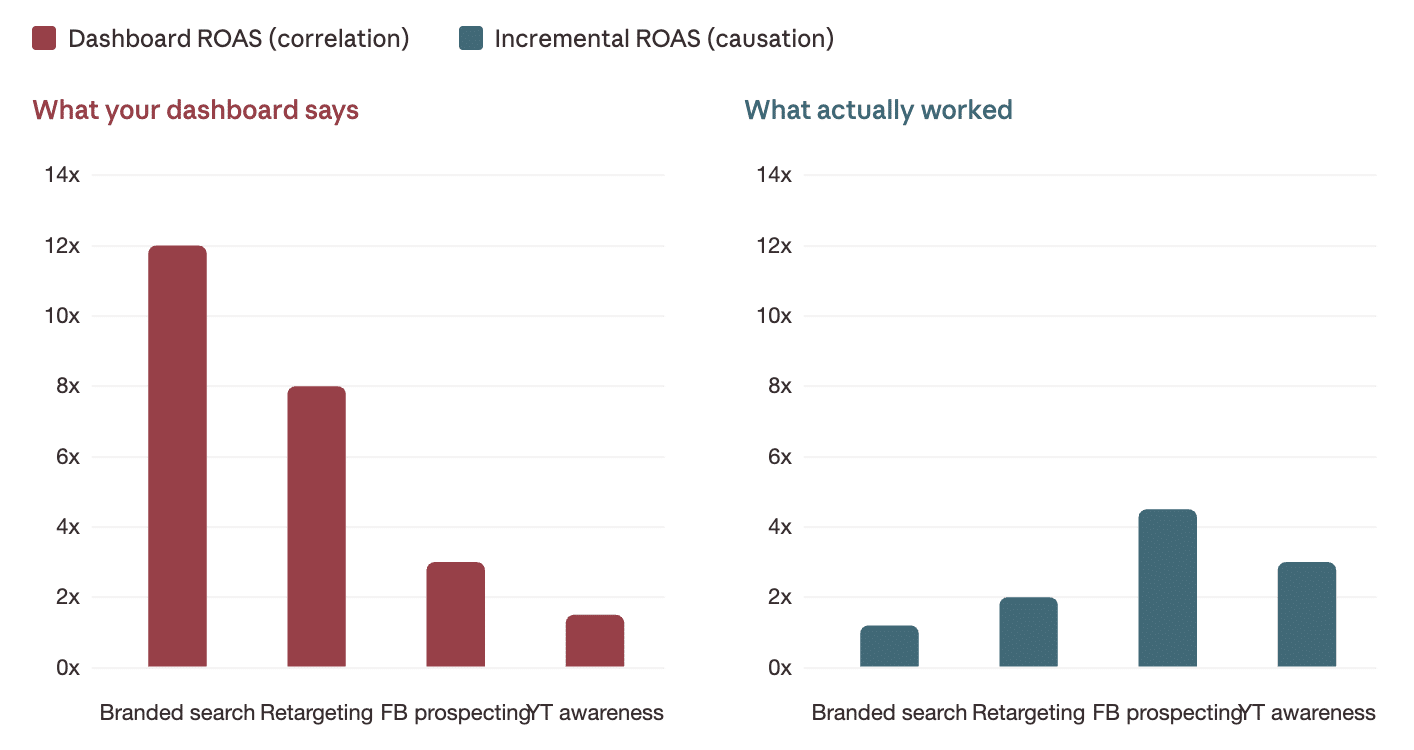
You’ve probably encountered this concept before. In marketing, branded search often seems like a high performer because it records conversions right before purchases, similar to a revolving door taking credit for everyone entering a building.

Correlation identifies that those walking through the door became customers, while causation asks whether they’d have entered regardless of the door. Incrementality testing is key here.

In this test, you hold out a group from seeing ads and compare conversion rates to the exposed group. If both groups convert similarly, ads may be taking credit rather than creating demand.
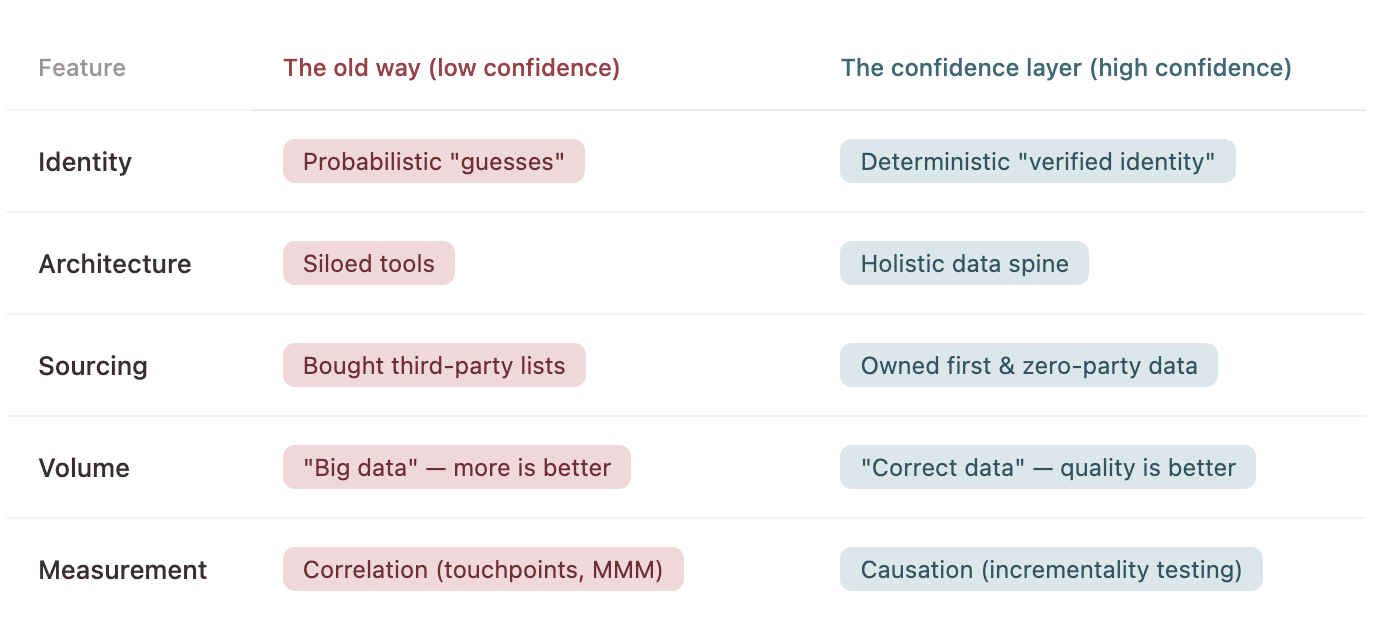
```json
{
  "alt": "Comparison chart of old and new data confidence approaches in identity, architecture, sourcing, volume, and measurement.",
  "caption": "Explore the shift from the old data ways—probabilistic guesses and siloed tools—to the new confidence layer with verified identity and holistic data integration.",
  "description": "This image depicts a comparison chart illustrating the transition from traditional data handling methods to a modern confidence layer. It contrasts old ways, such as probabilistic guesses and siloed tools, with new approaches like deterministic identity verification and holistic data architecture. Key areas of transformation include sourcing, data volume, and measurement strategies, emphasizing quality and integration over quantity and separation. Keywords: data confidence, identity verification, data architecture, sourcing, measurement."
}
```

An example might show branded search with inflated ROAS compared to a more accurate, incrementality-adjusted view emphasizing prospecting channels.

Building a Stronger Marketing Confidence Layer

To establish cross-team confidence, consider these data foundation tools:

  • Identity confidence thermometer: Go from probabilistic data (low confidence) to deterministic data (high confidence).
  • Siloed vs. holistic: Transition from siloed data to a holistic view for greater confidence.
  • Data trust pyramid: Move from third-party (low confidence) to first- and zero-party data (high confidence).
  • Big data vs. correct data pipeline: Filter raw data to reliable outputs, moving away from a ‘confidently wrong’ AI.
  • Correlation vs. causation ROAS: Shift from identifying correlations to proving causation with a scientific approach.

While AI can automate countless tasks, effective decision-making must be upheld by experienced marketers applying good judgment. These data foundations help us move closer to achieving that.


Inspired by this post on Search Engine Land.


crushpress.ai community screenshot

FAQs

Why does skepticism around marketing data slow down decision-making?

The post explains that low trust in marketing data creates a hidden skepticism tax: teams spend time cleaning spreadsheets, reconciling reports, and second-guessing attribution or AI outputs. That slows execution, weakens alignment, and leads to decisions built on shaky foundations.

What is the difference between deterministic and probabilistic marketing data?

Deterministic data is based on verified identity, such as a logged-in customer placing an order. Probabilistic data relies on assumptions from signals like device, location, IP address, or behavior, which can be useful but carry lower confidence.

How does a holistic data approach improve marketing confidence?

A holistic approach connects marketing, sales, finance, CRM, and attribution data so teams are not working from separate versions of the truth. The article contrasts siloed reporting with a unified data spine that helps everyone evaluate performance from the same foundation.

Why are zero-party and first-party data more trusted than third-party data?

Zero-party data is information a customer directly provides, while first-party data is observed from direct interactions. The article describes third-party data as inferred and lower trust, especially as cookies fade away, making direct customer signals more valuable.

Why is correct data more useful than simply having big data?

The post argues that large datasets with duplicates and errors can mislead teams and AI models. Correct data is cleaner, accurately labeled, filtered, and easier to use for reliable decision-making.

How can marketers separate correlation from causation in ROAS reporting?

The article uses branded search as an example of a channel that can appear to drive conversions simply because it appears near the purchase. Incrementality testing, such as holding out a group from ads and comparing conversion rates, helps determine whether ads created demand or only took credit.

Comments

Leave a Reply

Your email address will not be published. Required fields are marked *