
Your ads can look healthy while the business result quietly deteriorates. A visual asset may be winning clicks but sending the wrong audience. A feed delay may suppress eligible products while the campaign settings remain untouched. A polished dashboard may hide either problem because its blended totals still look plausible.
Modern PPC needs an operating system, not a longer optimization checklist. You have to manage three connected layers: the experience people see, the inputs advertising systems use, and the reporting that tells you what to change. This framework will help you find the failing layer before you spend money fixing the wrong one.
Key takeaways
- Treat each image, headline, description, product record, and landing page as an independent campaign input. Automated systems cannot rescue an asset that lacks a clear message or role.
- Monitor feed health as a delivery dependency. A feed problem can resemble weak demand, an auction change, or poor campaign management unless you inspect product eligibility separately.
- Give each data system a defined responsibility. Ad platforms explain delivery, Merchant Center explains product eligibility, GA4 explains post-click behavior, and business systems explain realized value.
- Build reports around decisions and exceptions, including budget variance, zero-conversion spend, feed degradation, weak post-click behavior, and creative fatigue.
- Investigate performance in causal order: platform availability, item eligibility, ad delivery, on-site behavior, and business value. That order prevents downstream symptoms from being mistaken for upstream causes.
Build campaigns around assets, not just ads
The old keyword-to-text-ad model is no longer a sufficient mental model for PPC. Conversational discovery, interactive showroom ads, visual experiences, and emerging gaming placements create journeys in which a person may inspect, compare, and refine an idea before producing anything that resembles a conventional search click.
That changes your unit of optimization. You are no longer managing only ads or campaigns. You are managing a library of components that an automated system can select, combine, and distribute across different contexts.
Give every asset a specific job
Start by assigning each asset a funnel role. A visual can orient someone to the category, demonstrate a product, make a comparison easier, establish trust, or support an action. If you label everything as generic creative, you will know which file received impressions but not why it worked.
- Orientation: Show what the product or service is without requiring supporting copy to make it intelligible.
- Context: Show the offer in the situation where someone would use, choose, or evaluate it.
- Detail: Make an important feature, difference, or constraint visible.
- Validation: Reinforce the brand, proof, or reason a buyer should trust the offer.
- Action: Make the next step and the value of taking it unambiguous.
Visuals belong across the funnel, not only in awareness or remarketing. At the same time, every asset should remain recognizably yours. Brand-forward visuals and curated creative libraries matter because automated distribution can place one component in contexts you did not manually assemble.
Maintain an asset register beside the media plan. Record the asset identifier, concept, offer, format, funnel role, intended audience, landing page, launch point, and current status. Use stable identifiers in both the ad platform and the reporting layer. A filename such as image-final-new is useless when you need to connect a result to a creative decision.
Use AI as a selection system, not a substitute for judgment
Automation needs good inputs: first-party data, creative assets, copy, website content, goals, and budgets. It can evaluate combinations and expose niche winners, but it cannot decide what your brand should mean or whether an isolated claim is persuasive. Individual asset performance can reveal which components deserve replacement and which niche performers deserve closer attention.
Do not respond by replacing the whole library at once. Preserve strong components, remove clearly weak ones, and introduce distinct alternatives. A bulk replacement destroys your ability to tell whether the concept, format, offer, or audience match caused the change.
Before uploading an asset, ask:
- Can someone understand the central promise if this component appears without its preferred companion asset?
- Does it add a genuinely different concept, or is it a cosmetic variation of material already in the library?
- Is the brand identifiable without overwhelming the useful part of the message?
- Can the asset be mapped to one business objective and one landing-page experience?
- Will its identifier survive exports, blended reports, and future creative revisions?
This discipline reduces asset overlap. It also makes automated performance easier to interpret: the system may choose the components, but you retain control over what each component is capable of communicating.
Treat product feeds as production infrastructure
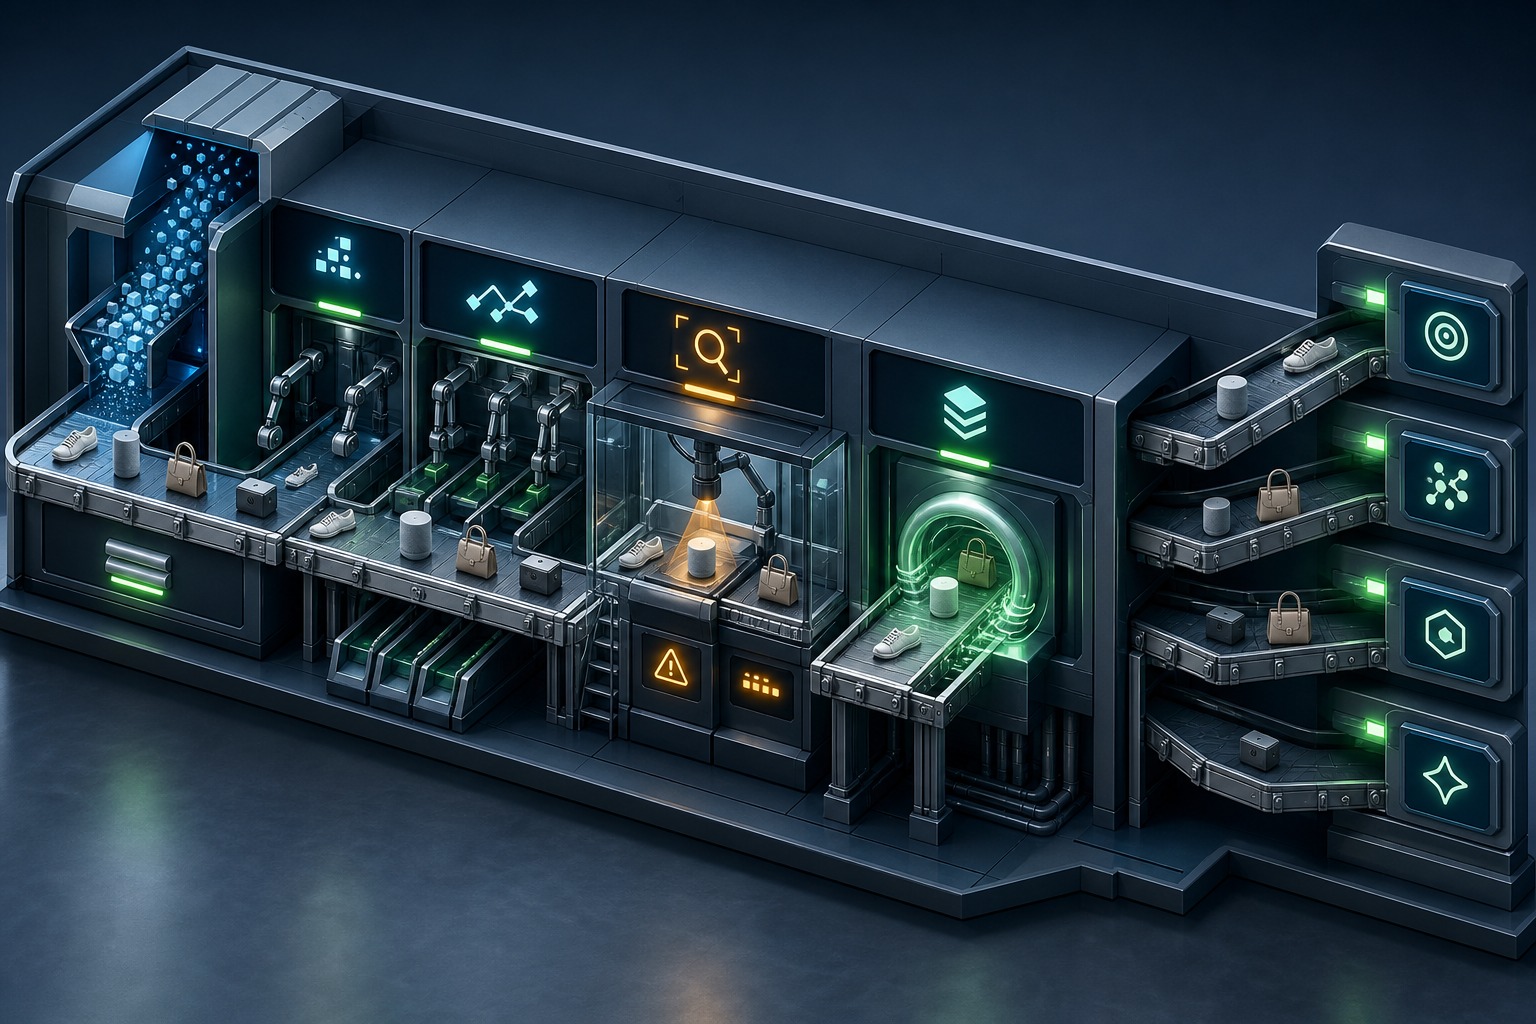
A retail campaign cannot advertise a product reliably if the advertising system cannot ingest, approve, or refresh its record. That makes the feed part of campaign delivery, not a back-office file owned exclusively by merchandising or development.
The operational risk is real even when campaign settings have not changed. In one Merchant Center service disruption, the feed incident began on February 4, 2026, and was still under investigation in the February 20 status update. The available notice did not establish the cause, affected scope, or resolution time. That uncertainty is exactly why your monitoring has to distinguish platform availability from a defect in your own data.
Map the feed pipeline as four separate states:
- Source state: The catalog, inventory, price, availability, destination URL, and other product data are correct in the system that owns them.
- Export state: The scheduled file, API process, or connector emits the expected records and completes successfully.
- Ingestion state: Merchant Center receives and processes the feed without an abnormal delay or unexpected drop in item count.
- Eligibility and delivery state: Products remain approved, current, and able to participate in the campaigns and free listings that depend on them.
A green export job proves only the second state. It does not prove that Merchant Center processed the file, that products remained eligible, or that campaigns continued serving them.
Use a feed incident protocol that preserves evidence
When product delivery falls unexpectedly, capture the current state before making repairs. Save the feed completion time, processed item count, approval and disapproval pattern, affected product segments, campaign delivery change, and any platform status notice. Without that snapshot, a later recovery can erase the evidence you need to identify the cause.
- Check scope. Determine whether the problem affects the entire catalog, one market, one destination, one product type, or a recently edited segment.
- Check timing. Compare the first visible delivery change with the last successful source update, export, ingestion event, and platform notice.
- Check the status dashboard. A broad service notice does not prove your account has the same problem, but it changes the order of investigation.
- Inspect diagnostics. Separate delayed processing from new disapprovals, missing products, and stale price or availability data.
- Limit intervention. If the evidence points to a platform disruption, avoid rewriting a previously valid feed merely to force a refresh. That can introduce a second failure and make recovery harder to interpret.
- Validate recovery by layer. Confirm processing, item counts, approval status, campaign delivery, and business outcomes before releasing a backlog of unrelated feed changes.
A platform incident usually has broad timing and multiple affected records. A local transformation problem is more likely to follow a catalog or connector change and affect a coherent subset. Normal feed diagnostics combined with falling spend point you back toward campaign eligibility, auction conditions, budgets, or demand. Do not pause an entire account simply because revenue fell; first establish whether the feed is actually the failing layer.
Build reporting that can identify the failing layer

A useful PPC dashboard does more than reproduce platform totals. It connects delivery to post-click behavior and business outcomes while making missing or delayed inputs visible.
GA4 and Looker Studio solve different parts of that problem. GA4 uses an event-based model for website and app interactions. Looker Studio is designed to combine and present data, with connections to more than 800 data sources, calculated fields, blending, interactive controls, and scheduled report delivery. Neither should be treated as the sole owner of PPC truth.
Assign ownership before you blend anything
- Advertising platforms: Own impressions, clicks, spend, placement, bidding, and platform-attributed actions.
- Merchant Center diagnostics: Own feed processing, product approval, and product-level eligibility evidence.
- GA4: Own the configured view of sessions, engagement, events, and other website or app behavior after the click.
- CRM or commerce systems: Own qualified leads, orders, realized revenue, and other downstream business states.
- Looker Studio: Presents and calculates across those systems. It does not repair inconsistent definitions in the underlying data.
GA4 can natively import cost, click, and impression data from additional advertising platforms, including Meta and TikTok, but strict UTM matching and limited campaign-name cleanup can constrain the result. Native ingestion reduces manual work; it does not remove the need for a campaign naming standard.
Write the join plan before building charts. Specify the date grain, channel definition, account identifier, campaign identifier, creative identifier, currency, time zone, and conversion definition. Normalize labels in a controlled field rather than editing historical campaign names to make a chart look tidy. If two datasets have multiple rows for the same join key, aggregate them to the intended grain before blending; otherwise cost or conversions can be duplicated.
Organize the dashboard around decisions
A decision-grade PPC report needs four views:
- Outcome and pacing: Show spend against plan, primary outcomes, efficiency, and downstream value. If the monthly plan is intentionally linear, the expected spend point halfway through the month is 50% of the budget. If demand or promotions are not linear, replace that line with the actual spending plan rather than pretending uniform pacing is desirable.
- Delivery and feed health: Show changes in eligible products, product diagnostics, impressions, clicks, and spend together. This view tells you whether falling revenue began before or after the click.
- Creative performance: Display the actual visual beside its stable asset identifier, spend, click response, conversion result, and post-click quality. Looker Studio’s IMAGE function can place creative previews inside a report table, making the discussion about the asset rather than an opaque ad-group name.
- Waste and post-click quality: Surface spend with no recorded conversion above a threshold chosen for the account. Pair click response with engagement and lead quality so a high click-through rate cannot disguise a poor landing-page or audience match.
Calculated fields should translate platform activity into business language. Profit can be calculated by subtracting cost from revenue, while ROAS can connect CRM revenue with advertising cost. Document which revenue state you use. Booked revenue, collected revenue, predicted value, and platform-attributed conversion value answer different questions and should not share an unlabeled metric name.
Add a trust panel to every report. Include the last successful refresh, source coverage, reporting time zone, currency treatment, primary conversion definition, attribution scope, exclusions, and known incidents. A viewer should be able to tell whether a flat line means no activity or failed data retrieval.
Keep performance observations separate from explanations. An annotation such as “cost per lead increased after the promotion ended” records a sequence. “Competitor aggression caused the increase” is a hypothesis unless you have supporting evidence. Labeling the difference protects the dashboard from turning a plausible story into an accepted fact.
Complex dashboards also create a reliability problem of their own. Heavy use of GA4 widgets and concurrent views can run into API quotas. For demanding reporting environments, extracting GA4 data to BigQuery before connecting Looker Studio can reduce quota pressure and improve report performance. Before adding another chart, ask what decision it changes; fewer meaningful queries are easier to trust than a wall of fragile widgets.
Use one operating sequence for every performance anomaly
The same symptom can come from several layers. A revenue decline might begin with product eligibility, creative-message mismatch, landing-page behavior, tracking, lead quality, or actual demand. Use the earliest reliable evidence to decide where to investigate.
| What you notice | Check first | What to do next |
|---|---|---|
| Product impressions and spend fall suddenly | Feed processing, item counts, diagnostics, eligibility, and platform status | Isolate the affected product set and preserve the last known valid feed configuration while you identify the failing state. |
| Delivery is stable but click response weakens | Asset, format, placement, audience, and offer breakdowns | Replace a weak component with a meaningfully different alternative while retaining stable winners. |
| Clicks remain stable but engagement or leads deteriorate | Landing-page behavior, conversion collection, page-message continuity, and audience quality | Investigate the post-click path before changing bids or product data. |
| Spend is ahead of plan | Planned pacing, current demand, outcome quality, and budget configuration | Decide whether the variance is productive before reducing delivery solely to match a straight line. |
| Platform ROAS falls while recorded business revenue is stable | Attribution scope, conversion definitions, join logic, and data refresh timing | Reconcile measurement before reallocating budget on the assumption that demand collapsed. |
| Several dashboard charts flatten or fail together | Connector refreshes, source credentials, API quotas, and source coverage | Restore reporting reliability and mark the affected period instead of interpreting missing data as zero performance. |
Work from cause to consequence
- Availability: Can each required platform and connector process or return data?
- Eligibility: Are the intended ads, products, assets, destinations, and audiences allowed to participate?
- Delivery: Did impressions, clicks, spend, format mix, or product coverage change?
- Behavior: Did people engage with the landing experience and complete the configured events?
- Value: Did those actions become qualified leads, orders, revenue, profit, or another business outcome?
Keep a decision log beside the dashboard. Record the observed condition, affected scope, evidence, working hypothesis, action, owner, and validation signal. Where practical, change only one causal layer at a time. If you rewrite the feed, replace the creative library, alter bids, and edit conversion definitions together, even a recovery will teach you very little.
Start with the report you already use. Add its last refresh, feed status, spend against plan, primary business outcome, and known incident state. Then make your next optimization only after you can name the layer that failed. That small change turns PPC reporting from a record of what happened into a control system for what you do next.
References
- Search Engine Land – Embracing AI and Visuals: The Future of PPC Advertising
- Search Engine Land – Google Merchant Center Feed Issue: How It Impacts Your Ads
- Search Engine Land – Master GA4 and Looker Studio for Enhanced PPC Reporting

Leave a Reply