You have until June 15, 2026, to remove the back button code before Google starts taking action.
I’ve just heard from Google about a new warning aimed at websites using back button hijacking tactics. These sites have been given a two-month deadline to remove or disable these sneaky techniques. If not, they risk facing manual spam actions or automated demotions in Google Search.
Back button hijacking. Google explained that, when we click the back button in our browser, we expect to return to the previous page. Back button hijacking disrupts this expectation. Google elaborated:
“It occurs when a site interferes with a user’s browser navigation, making it impossible to use the back button to immediately return to the original page. Users might instead be redirected to pages they didn’t visit, shown unsolicited ads or recommendations, or otherwise prevented from browsing normally.”
June 15, 2026. From June 15, 2026, Google will start enforcing this action. Google emphasized, “We prioritize user experience. Back button hijacking interrupts the expected browsing journey and leaves users frustrated. People feel manipulated, and this makes them hesitant to visit unfamiliar sites.”
Why now? Google has observed an increase in this type of behavior. “This is why we are marking it as an explicit violation of our malicious practices policy, which states:”
“Malicious practices create a mismatch between user expectations and the actual outcome, leading to a negative and deceptive user experience, or compromised user security or privacy.”
Google is giving us a two-month notice to implement changes. “By providing this policy now, two months ahead of the enforcement date, we are offering site owners the time needed to make adjustments before June 15, 2026,” Google stated.
Why this matters to me. If I’m using this technique, it’s crucial to remove it from my pages. I have a short window to make these changes before my website might face penalties or corrective actions.
I keep hearing about AI search as if it’s become the norm for everyone—an inevitable shift in how we discover information. But in reality, it’s not so simple.
AI search is indeed on the rise, but it’s not being adopted equally. The real divide comes down to something rarely discussed: household income.
My agency started closely monitoring search behaviors back in early 2025. In our latest study, we took a closer look through the lens of household income.
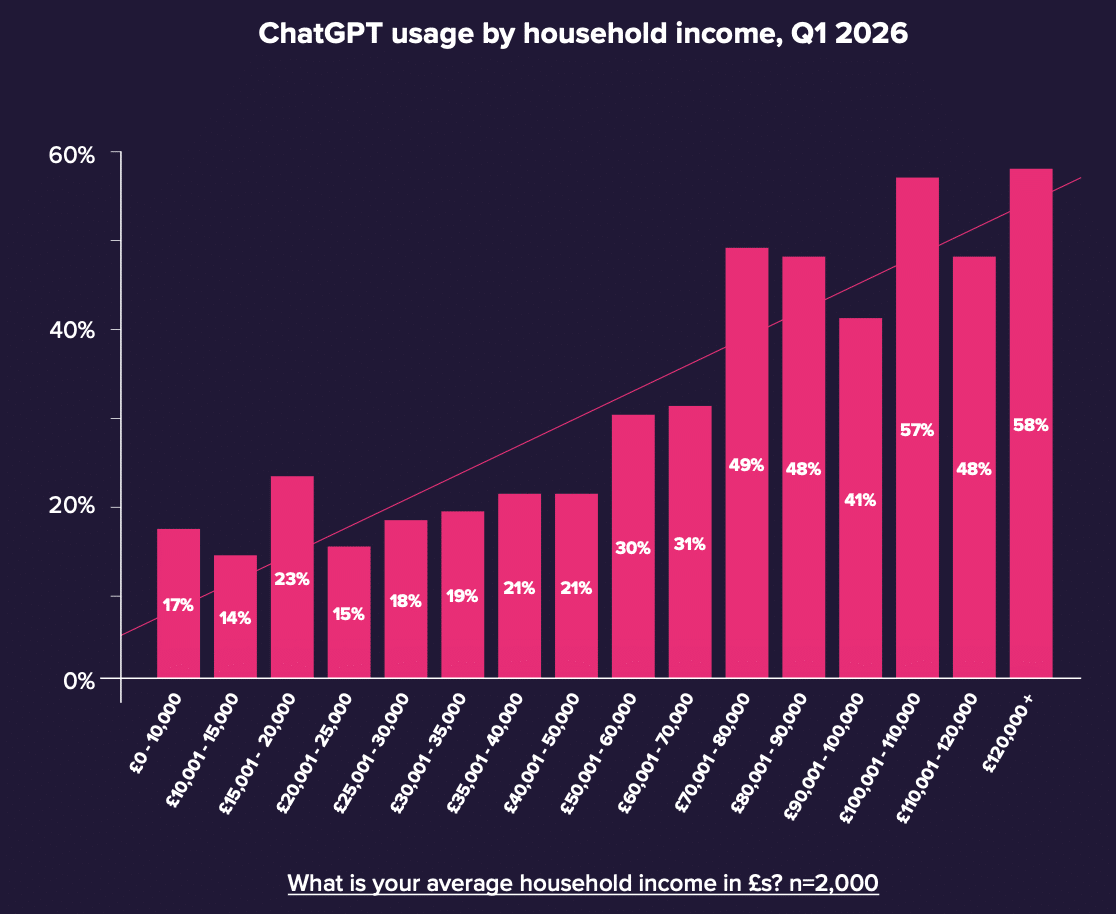
The results? A significant divide emerged. While a general 27% of users claim to regularly use ChatGPT, income-specific data paints a different picture.
In essence, higher-income households are significantly more likely to use generative AI tools.
This major variation challenges the common assumption that AI adoption progresses uniformly across demographics.
We’re seeing a new layer of digital inequality in accessing information. This divide, visible across the UK, is adding to an existing digital skills gap.
AI adoption relies on more than just having the right tools. It’s also influenced by:
If you work in certain sectors like digital or corporate, you’re more likely to be encouraged to incorporate AI into your daily routines.
Capability plays a role, too. For some, using AI tools comes naturally. For others, it’s an intimidating process without proper guidance.
Then there’s confidence—trust in AI tools varies. In our research, users on platforms such as Perplexity report high levels of trust, but they remain niche.
These disparities mean that AI literacy is quickly becoming another possible layer of the digital divide, augmenting the advantage of the digitally savvy.
For businesses, this division has tangible implications. Different audiences are developing distinct behaviors:
This isn’t a minor shift. Making incorrect assumptions about user behavior could lead to strategic missteps, like over-investing in one area and neglecting another.
Yet, there’s an upside. Fast adopters of AI are often the very decision-makers and high-income consumers that brands value most.
These users are frequently termed “digital explorers” and see AI as an integral part of their decision-making process.
Behavior and confidence are intertwined, shaping how far users will go with AI.
To respond to these fragmented behaviors, brands need to:
A comprehensive understanding of AI’s role at every step of the customer journey becomes essential.
Ultimately, as AI weaves deeper into our lives, the human element remains paramount in determining the future of search.
As I delve into the vast realm of AI, I’ve realized how integral Large Language Models (LLMs) are to virtually every aspect of our lives—be it work, leisure, shopping, or health. They are the ignition point for nearly everything we do.
But here’s something that often goes unnoticed: how these models wrap up their interactions. They don’t just stop; they subtly guide us forward, and that’s a game-changer.
It’s as if LLMs adopt a “no, you hang up first” approach, perpetually inviting us to continue. They ask things like, “Would you like me to draft that travel itinerary for you?” or, “Shall I compare the Nike and New Balance running shoes for your marathon?”
These gentle nudges make it incredibly easy to stay engaged. More often than not, I find myself responding with a simple “sure” or “sounds good,” eager to see what’s offered next.
Such nudges are pivotal in shaping consumer behavior. Where the LLMs lead us truly matters.
If you represent a premium brand and an LLM suggests a price comparison, it might not align with your strategy, but it’s vital to grasp and react appropriately.
We’ve delved into various LLMs to understand these nudges across different platforms, seeking patterns that shape user behavior and signaling what it means for brands aiming to steer the digital journey.
What LLM Nudges Look Like Across Platforms
Budget and Deals Dominate
Across the board, LLMs frequently suggest follow-ups related to budgets and deals, with about 45% of mentions falling into this category. Though not uniformly distributed, these elements are often default interests for consumers.
For instance, Perplexity and ChatGPT feature over 60% of budget-related suggestions, while Meta doesn’t lean as heavily into this assumption.
Comparisons Drive the Next Step
Product comparisons are the second most common type of suggestion. LLMs compare everything from retail products to financial services and health treatments, touching various industries.
Specs Play a Minor Role
While there’s a common belief that providing detailed specifications is vital, these comprise only a small fraction of the LLMs’ recommendations. That said, they do add ranking value, even if LLMs typically don’t extend conversations in this manner.
How Each Platform Uses Nudges Differently
In our research, we’ve noticed that each LLM has a unique style of extending conversations, offering insights into how these platforms subtly influence consumer behavior.
Platform
Dominant Nudge Style
Key Characteristic
ChatGPT
“If you want…”
Heavy commerce focus: Primarily nudges toward deals and product comparisons.
Microsoft Copilot
“If you tell me…”
Interactive/clarifying: Frequently asks for more user data to refine recommendations.
Google Gemini
“Would you like me…”
Polite and permission-based: Exclusively uses this formal invitation to continue helping.
Perplexity
“I can help…” / “If you’d like…”
Service-oriented: Uses varied phrasing to offer utility and assistance.
Meta AI
“Let me know…”
Casual and passive: Primarily nudges toward product comparisons and specs with a less aggressive tone.
What Actions to Take Based on AI Nudges
These nudges are not just to keep the dialogue open; they also push users to explore further, greatly influencing consumer behavior and the entire customer journey.
As data becomes more plentiful, we’ll better optimize for these nudges. For now, our insights are somewhat limited to individual interactions.
Here are three key actions to prioritize, largely tied to the content you create across various channels:
Capitalize on the “Support” Gap
Proactive nudges related to troubleshooting and support are significantly lower in frequency than commerce-driven themes.
Focus on owning the post-purchase “how-to” and technical support space to establish long-term authority where AI currently isn’t as assertive.
Strengthen “Product A vs. Product B” guides to capture AI’s primary next step.
Maximize the “Budget and Deals” Opportunity
Pricing and discounts are the top drivers of AI nudges, comprising 48% of all prompts.
Ensure your site maintains structured, real-time deal data to become a preferred destination for AI-driven commerce referrals.
As the LLM landscape rapidly evolves, these platforms will become the main touchpoints for consumer research and decision-making. Understanding how LLMs discuss your brand and how these conversational nudges affect users is essential.
By dissecting these automated cues across platforms like Gemini, ChatGPT, and Perplexity, we can see where consumers are being steered—whether towards budget-friendly alternatives, product comparisons, or technical specifications.
Recognizing these trends enables us to shift from mere observation to actionable strategies, ensuring our value proposition remains clear, even when an LLM reframes the conversation around cost or competitors.
Monitoring these shifts is key to maintaining brand authority as AI-driven interactions increasingly dictate the customer journey.
I recently delved into the intricate world of Google Discover, uncovering how its 20 pipelines and 42 million cards shape the landscape for publishers. This exploration reveals how trends, news, videos, and advertisements flow through the digital pipelines, achieving broadcast-level reach for some content.
Metehan Yesilyurt’s SDK analysis brought the pipeline names to my attention, and I meticulously collected data over three months to decipher each pipeline’s function—including volume, reach, timing, and dominance. Let’s dive into what the examination of 42 million cards reveals about Discover’s inner framework.
Our journey took three months (December 2025 – February 2026), where I analyzed real Discover feeds from hundreds of devices. The result was the analysis of 42 million feed cards intricately linked to their selecting pipelines.
This analysis built on existing knowledge from the SDK, as you might have encountered in Metehan’s SDK Analysis. My objective was to illuminate what each pipeline actively accomplishes—how much content it picks, how many devices view it, the pace at which it operates, and which publishers it highlights. That’s the story my data tells.
Four metrics were computed for every pipeline:
Reach — the percentage of devices showing each URL daily
Speed — the median age of articles when they appear
Exclusivity — the percentage of URLs exclusive to the pipeline
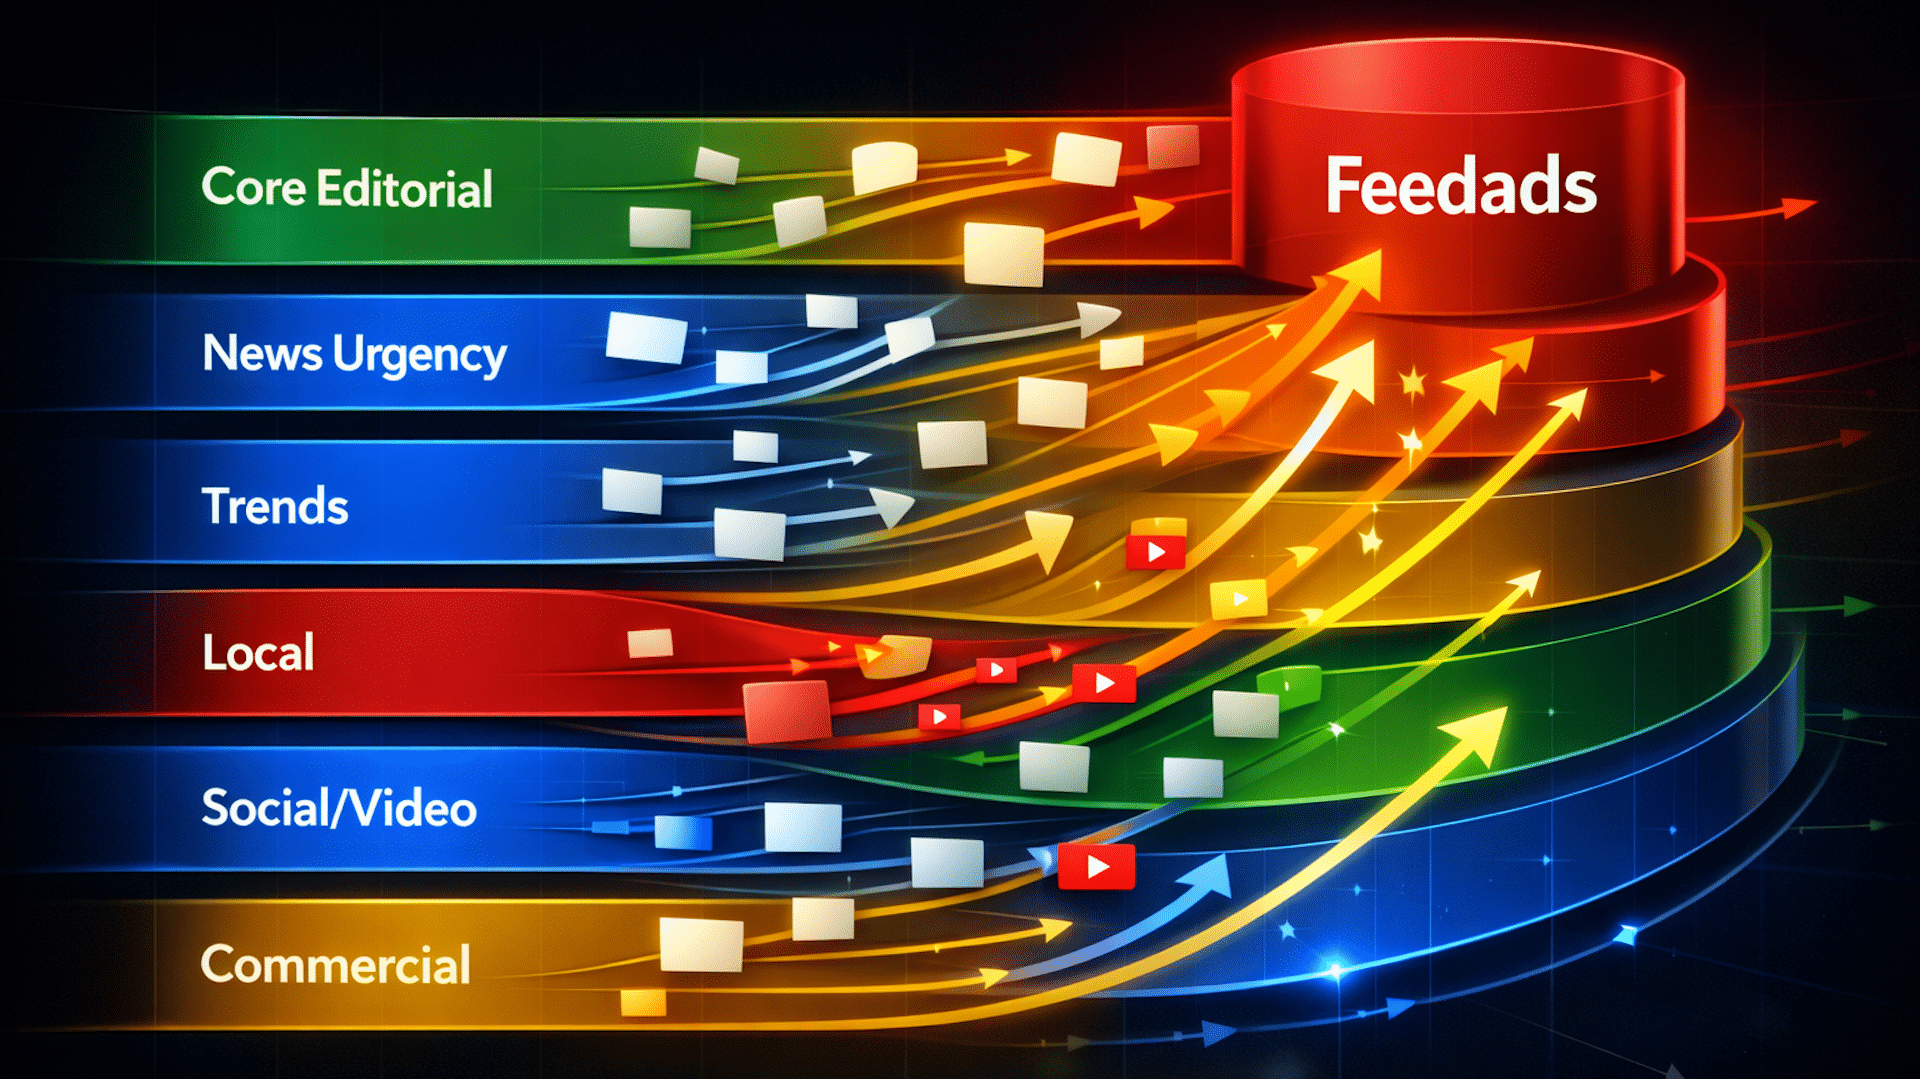
Diving deeper, many believe Discover operates on just one recommendation algorithm. However, our results tell a different tale—a sophisticated system with six layers, each with its unique logic, pace, and audience.
The six layers include:
Core editorial — various content types leading with editorial consistency.
News urgency — swift distribution of must-see news content.
Trends — pipelines dedicated to detecting and maintaining trends.
Local/geo — focusing on geotargeted stories and content.
Social/video — elevating YouTube video content into prominence.
Commercial — enhancing advertisements’ reach through platforms like YouTube.
In my exploration, I found peculiarities unique to the English Discover feed, including a YouTube content journey expanding through three successive pipelines. This system brings significant amplification to the reach of content that passes through it.
English Discover has also incorporated AI Overviews, an AI-generated summary, although this has been limited to English feeds only. Furthermore, a surprising revelation was the systemic under-representation of Premier League content across numerous pipelines, unlike other sports.
In conclusion, the Discover ecosystem continually evolves. Observing these changes provides valuable insights into the system’s architecture and potential influential power for publishers.
Data Source: 42 million Discover cards from December 2025 to February 2026. Analysis by 1492.vision with recognition to Metehan Yesilyurt for his work on Google SDK analysis.
Have you ever felt like there’s a disconnect between what your webpage is saying and what your audience is actually searching for? You’re not alone. This mismatch has always existed, but the stakes have become much higher now.
When your page doesn’t align with user intent, it risks not appearing on AI-powered search platforms. Instead, search engines will prioritize pages that fulfill user needs more precisely. Although the gap is apparent, quantifying it can be challenging. Luckily, Google’s Search Console holds the key to unlocking this data.
Analyzing your pages can reveal how well your content aligns with the searches your audience is conducting. Here, I’ll guide you through the process of measuring these intent gaps using a free tool.
The tool uses your Google Search Console data to compare the positioning of your page with real search demand. It gives you insight into where your content aligns or falls short, helping you identify areas for improvement.
Now, let’s dive into how we can measure the gap between your page’s positioning and audience demand.
Measuring the Gap Between Positioning and Demand
I’ve noticed that most web content today is designed to cater to multiple target audiences, sometimes aiming for tens or hundreds of keywords alongside brand positioning. This can cause the content to drift away from addressing the problems people are trying to solve.
Numbers can create urgency and inspire action in a way that observations alone cannot. The data you need is right there in your Google Search Console. The intent gap analysis tool will harness that data, providing you with numbers and insights.
This tool captures what your audience searches for when they find each page, comparing it with the page’s meta description. It scores the distance between these elements, giving you a clear picture of how well your content aligns with audience queries.
Connecting Positioning to Demand
Meta descriptions should indeed serve as a compelling pitch, convincing users that your page holds what they’re seeking, as outlined in Google’s Search Central documentation.
For AI ecosystems, achieving durable visibility requires consistent use of metadata, provenance, and trust signals interpretable by search crawlers and generative engines. An anchor in audience behavior, like those found in Google Search Console, is crucial for evaluating meta descriptions accurately.
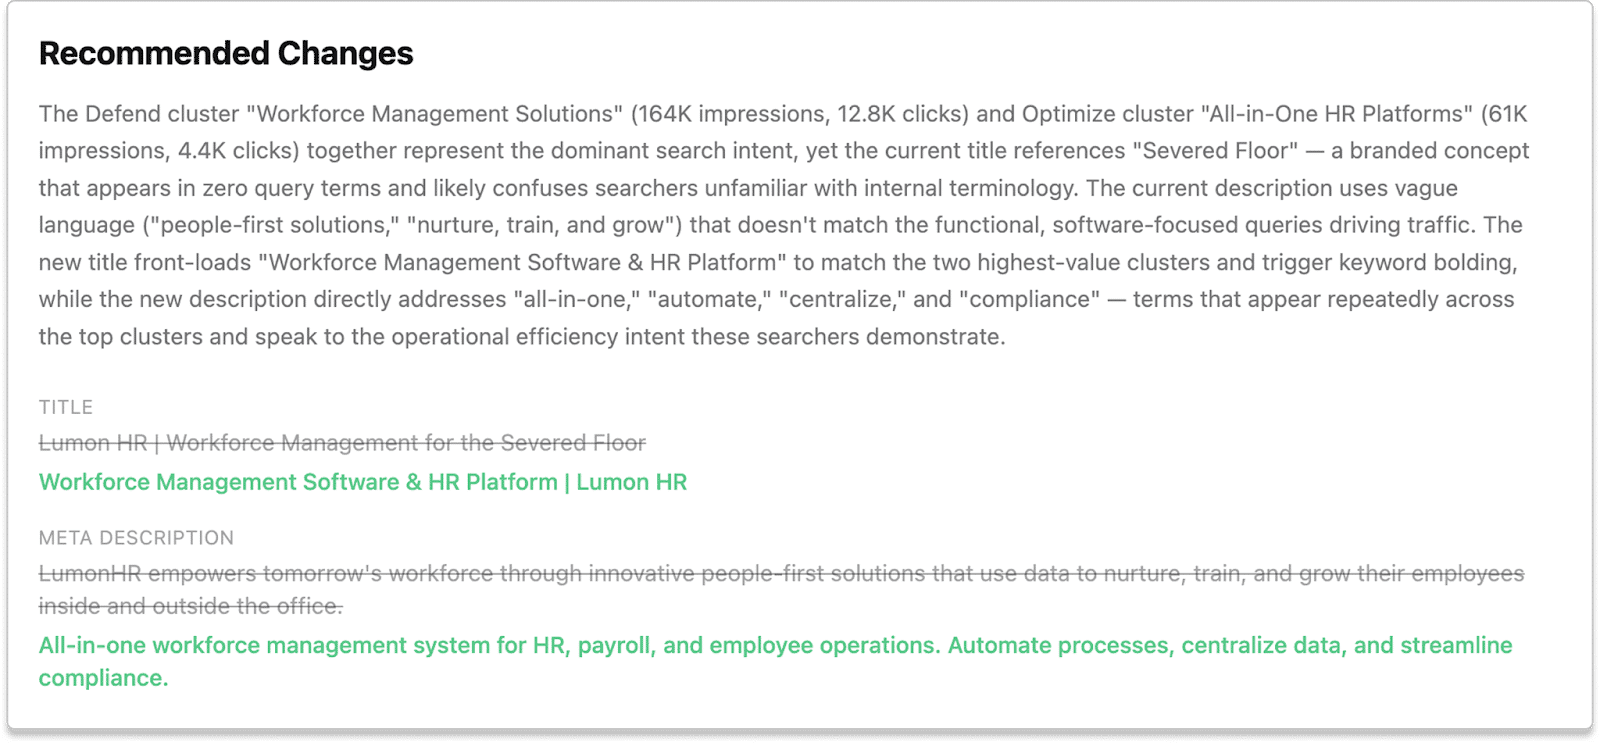
The intent gap analysis tool expresses this gap with a score, helping you to see exactly where your page aligns with demand—and where it doesn’t. An example from a fictional SaaS platform showed that vague language in the meta description failed to attract the intended software-focused audience.
Why Intent Is Measurable Now
Search engines now rely heavily on vector embeddings to match content with queries, focusing on meaning rather than just keywords.
These embeddings provide a glimpse into how search engines perceive content, using semantic similarity as a key factor to determine which pages should be shown to users.
Where Existing Tools Stop
Traditional tools like N-gram analysis and TF-IDF have their limitations, as they focus on matching words rather than understanding intent.
While these methods can highlight repeated phrases or important terms, search engines are more concerned with meaning. This means that relying solely on word-matching puts you at a disadvantage.
Measuring Meaning, Not Words
Vector embeddings allow us to plot meta descriptions and audience queries on the same map. This helps us measure the distance between them, revealing gaps where the demand isn’t being met.
By understanding this distance, we can ensure our content addresses what the audience is actually searching for.
Your Data, Your Score: Running the Intent Gap Analysis
To run the analysis on your own pages, you’ll need to follow a few steps with the provided tool.
The process involves exporting your page data from Google Search Console and uploading it to the tool for scoring. You can then explore a detailed map of alignment and demand, review the breakdown by cluster, and receive rewrite recommendations to better capture your audience’s attention.
Understanding this data allows you to make informed decisions about your content strategy, ensuring you’re meeting audience demand more effectively.
Turning the Score into a Decision
The intent gap score translates the gap into actionable insights. It helps guide conversations around either modifying or defending specific page elements.
By closely monitoring these signals, you can adapt and ensure that your content continues to meet evolving audience needs. The tool created by Robin Tully, co-founder at Forecast.ing, empowers us to bridge these gaps effectively.
I recently discovered that HubSpot has decided to shake things up by rebranding their annual conference, taking it from ‘Inbound’ to the innovative ‘Unbound’. This change is certainly a nod to the evolving landscape of marketing and strategy.
If you’ve tucked away your inbound strategy tools over the past year, maybe it’s time to do the same with those ‘Inbound’ conference mugs and swag as well. It’s a fresh start.
This coming September, HubSpot’s annual gathering in Boston will reflect this transition. As noted on their event site, the reasoning behind this shift is clear:
“This evolution is our response to that reality. INBOUND is becoming UNBOUND because growth no longer fits within a single framework or function. Today, it covers marketing, sales, service, and operations across the full customer journey in an AI-driven environment. UNBOUND reflects that expanded reality and the mindset required to lead through it.”
It’s fascinating to consider how HubSpot, the pioneers of inbound marketing, are now expanding beyond what they once set in motion—using content and search rankings for attracting and converting visitors.
I’ve also noted that recent changes in Google’s algorithm seem to have affected the HubSpot blog, possibly as a result of content drifting away from core topics like CRM, sales, and marketing.
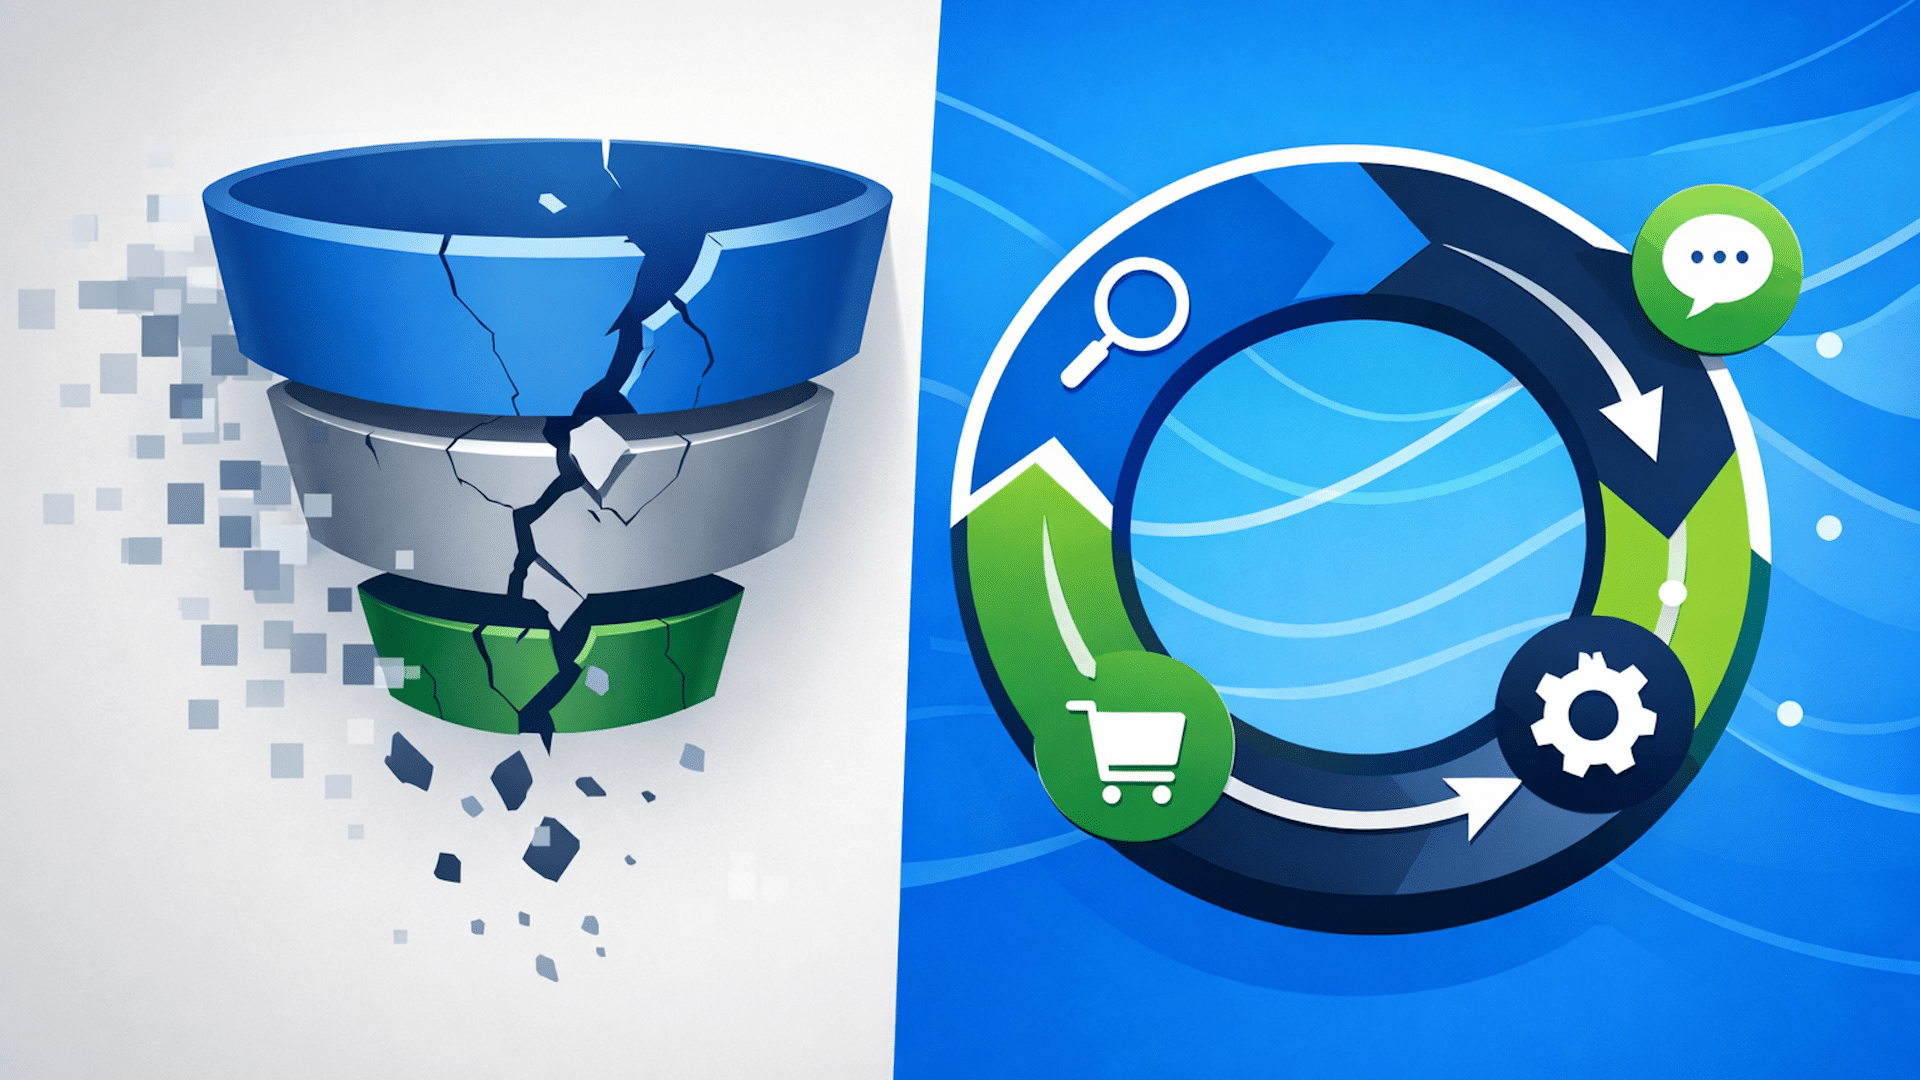
It’s clear that the traditional inbound strategy has lessened in impact as platforms like Google shift towards AI models such as ChatGPT, affecting website traffic and clicks.
Back in 2025, HubSpot introduced their Loop marketing strategy, aiming to educate consumers in this rapidly advancing AI world.
The move to ‘Unbound’ acknowledges that no singular approach is sufficient in today’s dynamic marketing environment. It’s a brave new shift, one that reflects a deeper understanding of the expansive realities we’re working within.
Recently, I read an eye-opening report stating that AI bot activity skyrocketed by 300% in 2025. As someone deeply interested in digital publishing, I couldn’t help but feel the strain it puts on media and publishing industries.
Why this matters to me. I’m increasingly aware of how AI bots are revolutionizing content discovery and consumption. They’ve shifted the dynamics by directing users from traditional search clicks to direct answers via chat interfaces. For publishers like us, this means fewer organic visits and a lack of attribution in AI-generated responses, which undermines revenue from ads and subscriptions.
The threat we face. In our publishing niche, we’re confronted with two significant AI bot threats:
– Training bots that are fed our content models.
– Fetcher bots that extract our real-time content to provide instant answers, posing a severe risk by capturing the value as soon as it’s created.
The impact I notice. It’s disheartening to see page views sink while operational costs escalate. Scraping bots consume our server and CDN resources without adding revenue, decreasing brand visibility.
– AI chatbot referrals result in about 96% less traffic compared to traditional search.
– Only about 1% of users click on sources cited in AI-generated answers.
Our solutions. As a proactive step, I see publishers like us leaning toward nuanced controls instead of outright banning AI bots. We adapt by:
– Monitoring and categorizing bot traffic efficiently.
– Selectively blocking malicious scrapers or slowing them down using techniques like tarpitting.
– Authorizing bots that are linked to licensing deals or partnerships.
In their words. As per Akamai’s insights:
– “These bots are more than just a security issue; they pose a profound business challenge that threatens the sustainability of quality journalism in a zero-click search and AI-generated content era.”
– “Publishing faces an existential crisis… Readers still appreciate genuine content, but they seek instant answers via AI-driven platforms like ChatGPT and Gemini rather than search results.”
What’s ahead? There’s talk about a “pay-per-crawl” model. Tools such as identity verification (Know Your Agent) and platforms like TollBit are aiming to authenticate bots and charge for real-time access.
– The aim is to convert scraping into a manageable and monetizable transaction.
About the data. The Akamai report scrutinized bot management data from July to December 2025, which included application-layer traffic across websites, apps, and APIs.
Most product feeds are traditionally geared towards paid media. But I’ve discovered aligning them with organic search behaviors significantly enhances visibility across Shopping and AI platforms.
When I ask most e-commerce brands who manages their product feed, the response is usually the same: the paid media team is in charge.
Often, a feed management tool is categorized under PPC. It might even be a relic created by the shopping team years ago, with titles that haven’t been updated since. SEO, unfortunately, rarely has its say in these strategies.
Whether you’re focused on AI-powered search or traditional clicks, excluding SEO from your product feed strategy means missing out on substantial opportunities.
AI Shopping Results Are Connected to Google Shopping Data
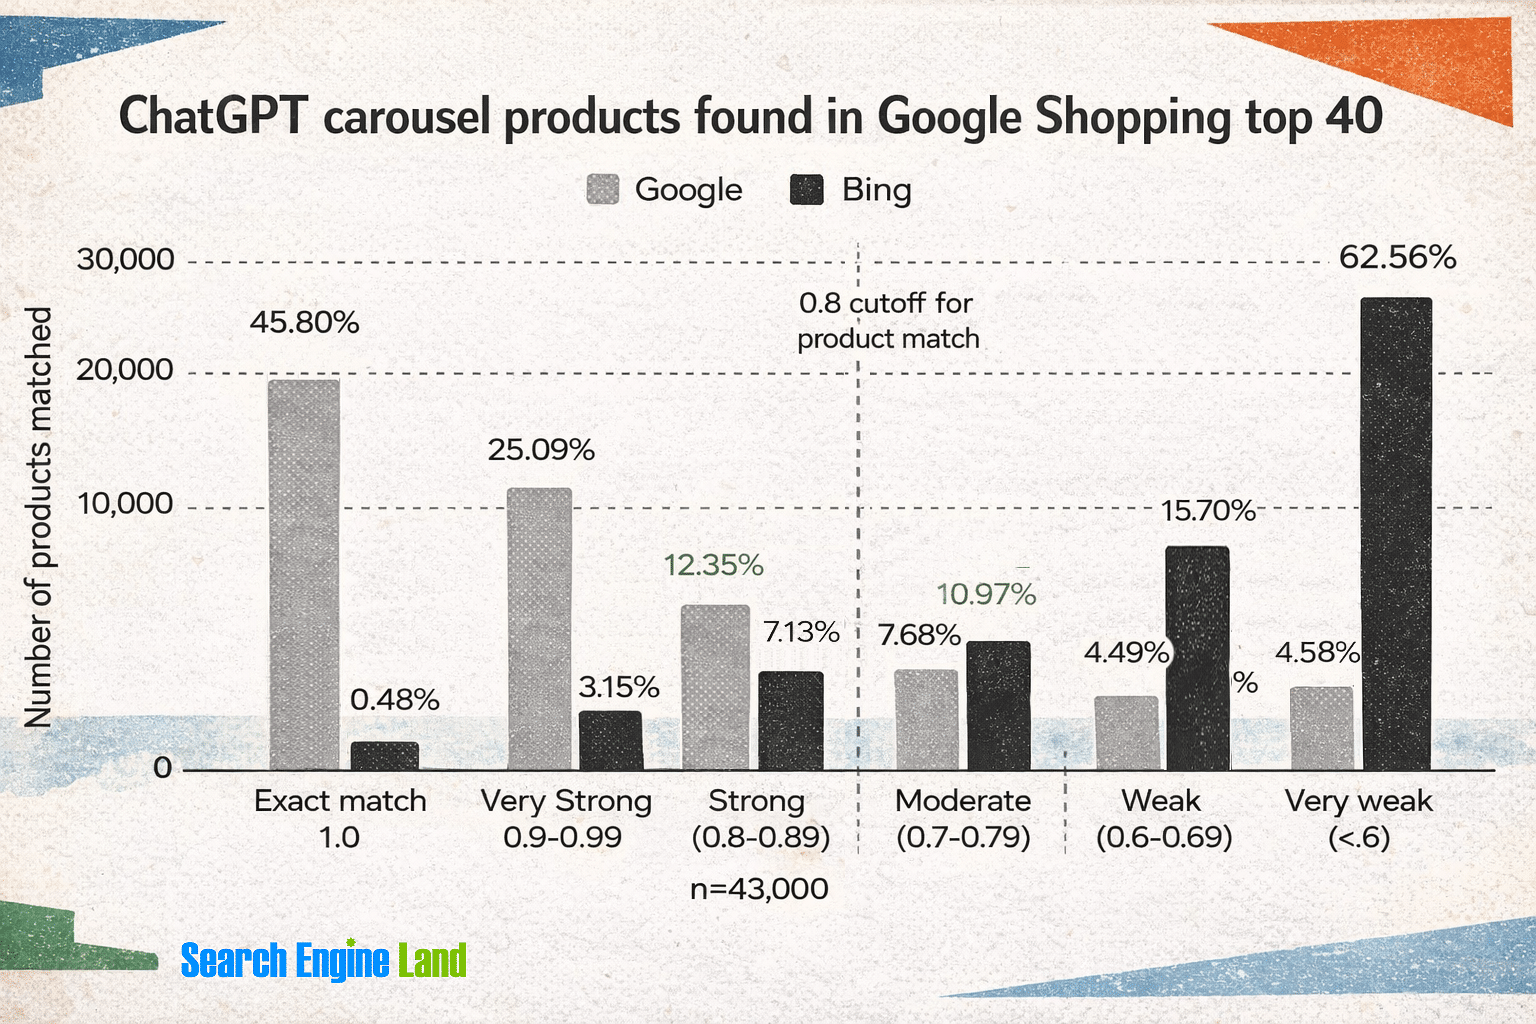
According to a recent Peec AI study, up to 83% of ChatGPT carousel products reflect Google’s organic Shopping results—and 60% of those are from Shopping positions 1-10.
Data shows how ChatGPT’s product carousel matches Google Shopping’s organic results, with Google dominating over Bing.
On Google’s side, their Shopping Graph includes over 50 billion product listings, directly feeding AI Overviews, AI Mode, and Gemini. AI Overviews now appear in about 14% of shopping inquiries, a leap from roughly 2% in late 2024. As I’ve seen, AI search results are still largely based on the traditional search engine result page (SERP).
SEO is vital for establishing brand authority. It opens up valuable opportunities to collaborate across channels for improved search visibility. It’s time for SEOs, commerce, and paid media teams to come together.
The Case for a Dedicated Organic Feed
Most brands run a single product feed aimed at Google paid shopping campaigns. The focus is often on optimizing titles for bid relevance and descriptions for Quality Score rather than for user search behaviors.
As user search habits evolve, aligning product data with search queries becomes increasingly important. A title with too many paid-friendly modifiers doesn’t necessarily match natural search queries.
When we tested this with a major ecommerce brand, our agency’s AI SEO team worked with the commerce team to create a dedicated product feed just for organic listings. Optimizing specifically for organic visibility made a world of difference.
After implementation, we saw the following results:
Organic listing CTR increased by 10% month over month and purchasing rates rose by 4%.
A product-level test revealed a 92% increase in revenue for free listings, with an 83% increase in visibility and a 14% rise in add-to-cart rates.
Organic optimizations alone generated 35,000 impressions with a 1.4% CTR—55% higher than paid CTR for the same period.
We recognized that our paid and organic strategies serve different needs, so they should be optimized independently. Organic feed titles should reflect how customers naturally search.
What to Prioritize in an Organic Feed Strategy
Not all feed attributes are equally important. Whether you’re setting up a dedicated organic feed or auditing an existing one, these elements are essential starting points.
Focus on Titles as the Key Lever
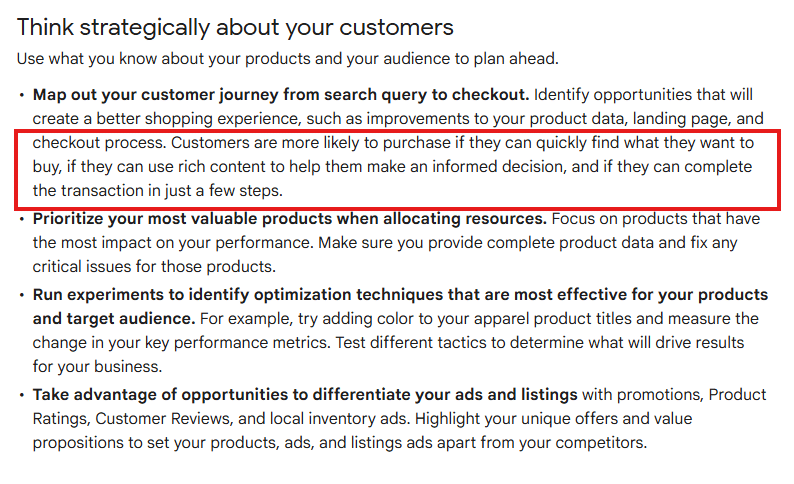
Google’s algorithm favors feed titles highly in matching products to queries. As Google documentation suggests, including significant attributes can lift performance. Consider what customers might conversationally say when searching for your product.
Google’s Merchant Center documentation emphasizes aligning your feed strategy with how customers shop, enhancing their search journey.
Don’t Neglect Global Trade Item Numbers (GTINs)
According to Google’s GTIN documentation, products with accurate GTINs gain significant visibility. Data shows well-matched products can attract up to 40% more clicks and are key in aggregating reviews.
Images Add Value
Images are often flagged in Merchant Center disapprovals. Products with both standard and lifestyle images engage more users. Google’s Product Studio can assist in editing, helping SEO and creative teams work together on feed assets.
Optimize Key Attributes: product_highlight and product_detail
product_highlight allows you to add concise benefit statements in Shopping views. Descriptions like “water-resistant for light rain commutes” are more beneficial than vague terms like “high-quality material.”
product_detail gives structured specs that influence Google’s filters in product grids.
The semantic optimization SEOs apply to product pages should guide feed attributes. Product and content teams’ insights are vital not just for PDPs but also for feeds.
Your Feed is Your Agentic Commerce Foundation
Investing in feed optimization for organic visibility will prepare your brand for the agentic commerce landscape.
Google’s Universal Commerce Protocol is essential for AI agents to complete transactions directly in AI Mode and Gemini. Feeds entering the Shopping Graph fuel AI responses to shopping requests.
Google added the native_commerce attribute for UCP-powered buy buttons across Google services. Several new conversational commerce attributes will soon be available, which means feed and on-page content must be in sync.
Building a Cross-Channel Strategy for AI Search
Product feed strategy is ideal for cross-team collaboration to test, execute, and measure brand visibility. A harmonized approach across all surfaces benefits both traditional and AI-driven search outcomes.
SEOs contribute keyword intelligence and semantic insights about AI system matching.
Commerce teams manage product data and retail relationships.
Paid teams have the infrastructure and expertise in feed health management.
These teams should collaborate to create a unified AI SEO strategy. Reviewing existing feeds and gathering all relevant stakeholders is essential to developing a comprehensive and effective product feed strategy.
As someone who’s been closely observing AI advancements, I found Google’s AI Overviews to have improved significantly. By February, they correctly answered standard factual benchmarks 91% of the time, a notable rise from 85% back in October. This assessment came from a rigorous analysis conducted by The New York Times in collaboration with the AI startup, Oumi.
Yet, considering Google processes more than 5 trillion searches annually, this still implies that millions of answers could be incorrect every hour. In essence, there’s much room for improvement.
Why it matters to me. My interactions with Google have evolved from just link clicks to encountering AI-generated summaries. This evolution suggests that while AI Overviews have gotten better, they still mix accurate responses with poor sourcing and blatant errors, potentially misleading searchers and affecting visibility for many publishers.
The nitty-gritty details. Oumi put 4,326 Google searches to the test using SimpleQA, a benchmark known for measuring factual precision in AI systems. AI Overviews hit a 91% accuracy rate post-upgrade to Gemini 3 from Gemini 2’s 85%.
The more pressing issue for me is the sourcing. Oumi discovered that more than half of February’s correct responses were ‘ungrounded,’ meaning the linked references didn’t fully back the answers.
This lack of grounding makes verification a challenge. Even if the answer is correct, the linked pages might not sufficiently illustrate the reasoning.
What shifted. While the accuracy saw improvements from October to February, grounding declined. In October, 37% of accurate answers were ungrounded; by February, this figure increased to 56%.
Real-world examples. The Times pointed out several inaccuracies: For instance, Google incorrectly dated when Bob Marley’s home became a museum. Google’s answer was 1987, but the actual year was 1986, and the cited sources conflicted. A search about Yo-Yo Ma and the Classical Music Hall of Fame yielded a link to the Hall’s site, yet Google stated he wasn’t inducted. Moreover, while Google got Dick Drago’s age at death right, it flubbed his date of death.
Google’s standpoint: Google contested the Times’ findings, arguing that the benchmark used in the study was flawed and didn’t mirror actual search behavior. Google spokesperson Ned Adriance mentioned that the study had some ‘serious holes.’
Furthermore, Google asserted that its AI Overviews utilize search ranking and safety measures to minimize spam and has consistently cautioned that AI responses might contain errors.
Have you ever wondered why AI often misunderstands your content? It all comes down to how AI systems label and score your content before ranking it. This process, known as annotation, determines how you’re perceived and whether you’ll succeed online.
Imagine my surprise when Google once attributed two of Barry Schwartz’s articles from Search Engine Land to me. This misclassification briefly altered authorship in Google’s systems, inaccurately listing me as the author.
For those few days, if you searched for specific articles written by Schwartz, Google misidentified me as the author, connecting these articles to my Knowledge Panel. This mishap highlights a critical aspect often overlooked in the SEO industry: annotation, not the content itself, is key to visibility and success.
How Google Misannotated and Got the Author Wrong
When Googlebot crawled those pages, it prominently noted my name below the article—my author bio appeared as the first recognized entity. The annotation algorithms then wrongly classified me as the author with high confidence.
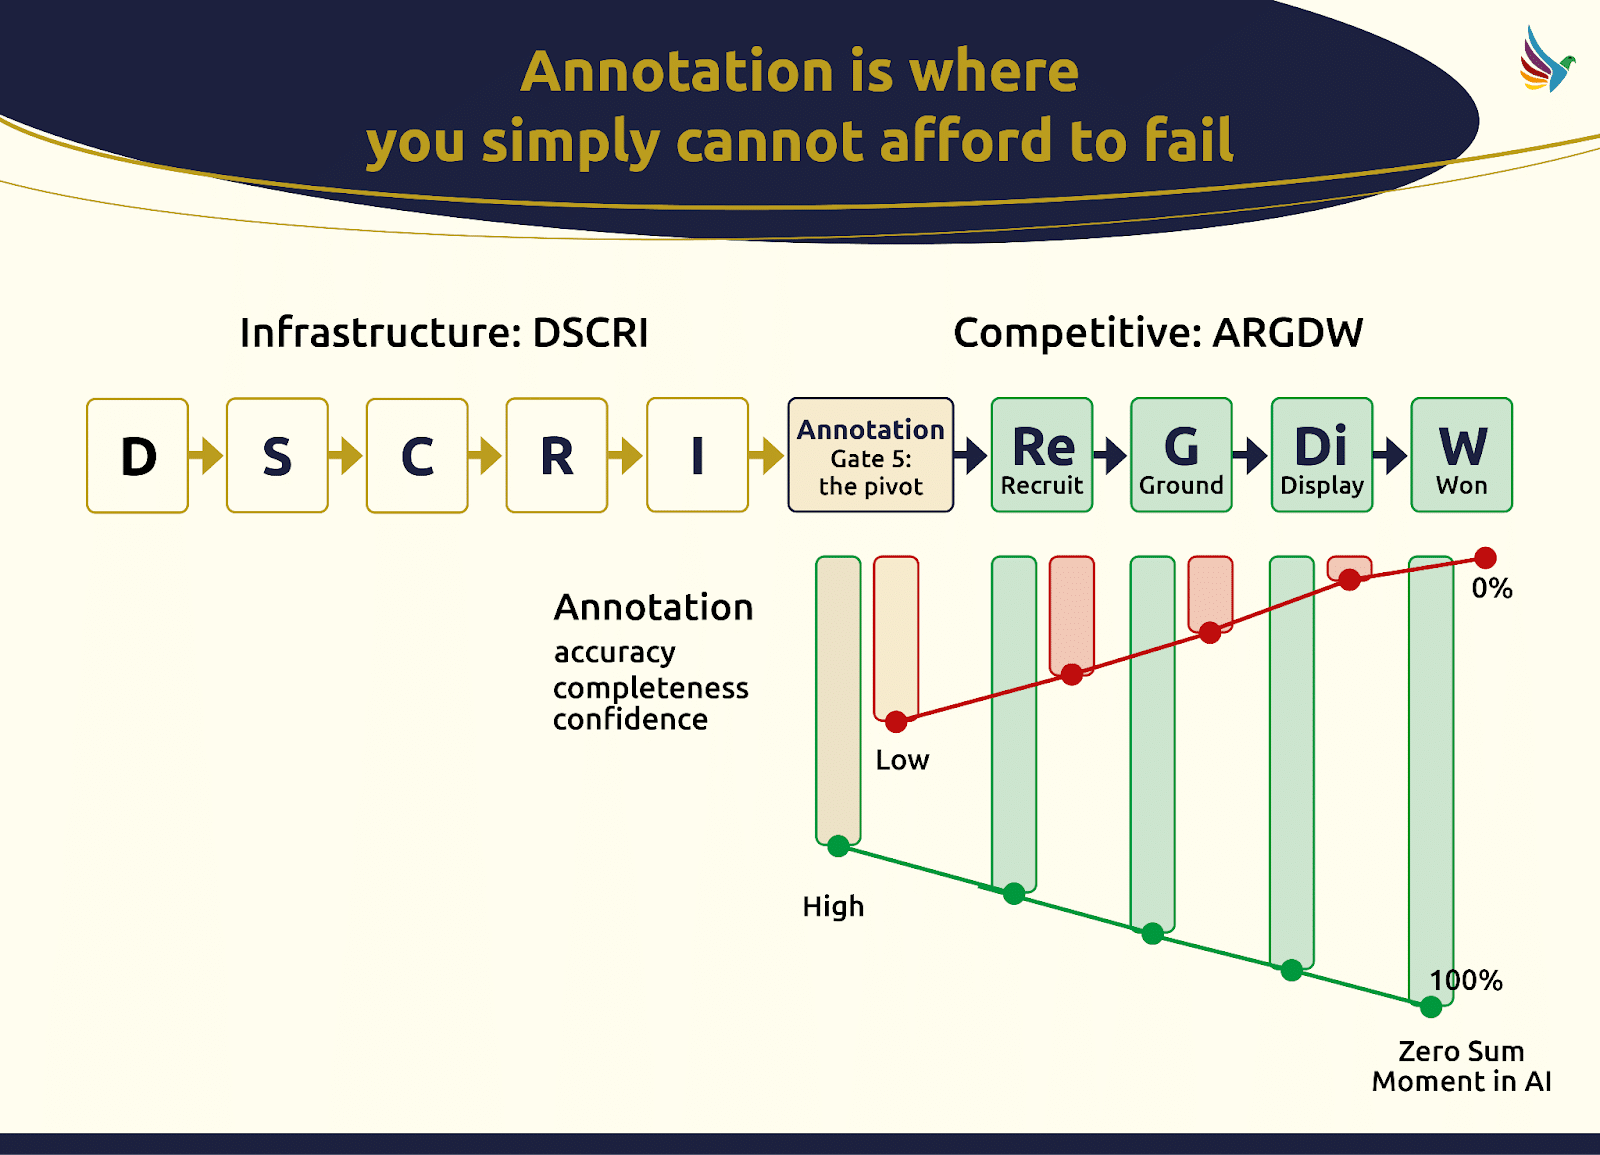
This highlights the importance of annotation as a defining gate that influences everything downstream, from recruitment to ranking. Although this was simply an authorship error, imagine if it involved a product, price, or crucial attribute—that would severely impact your competitive standing.
Annotation serves as a vital gate in taking your brand from being discovered to winning, for whatever search intent or engine you’re optimizing for.
While indexing breaks your content into chunks and stores it, annotation labels these chunks with classifications based on confidence. It’s a pragmatic labeler, describing what the chunk contains, when it could be useful, and its trustworthiness.
Annotation remains largely impartial, tagging content without bias. Microsoft’s Fabrice Canel notes that filtering occurs later at query time, meaning annotation is neutral at the crawl stage, classifying without knowing its future retrieval context.
This insight transformed my approach to “crawl and index.” The real action happens with annotation: an indexed page with poor annotation is invisible to algorithms across search engines, language models, and knowledge graphs.
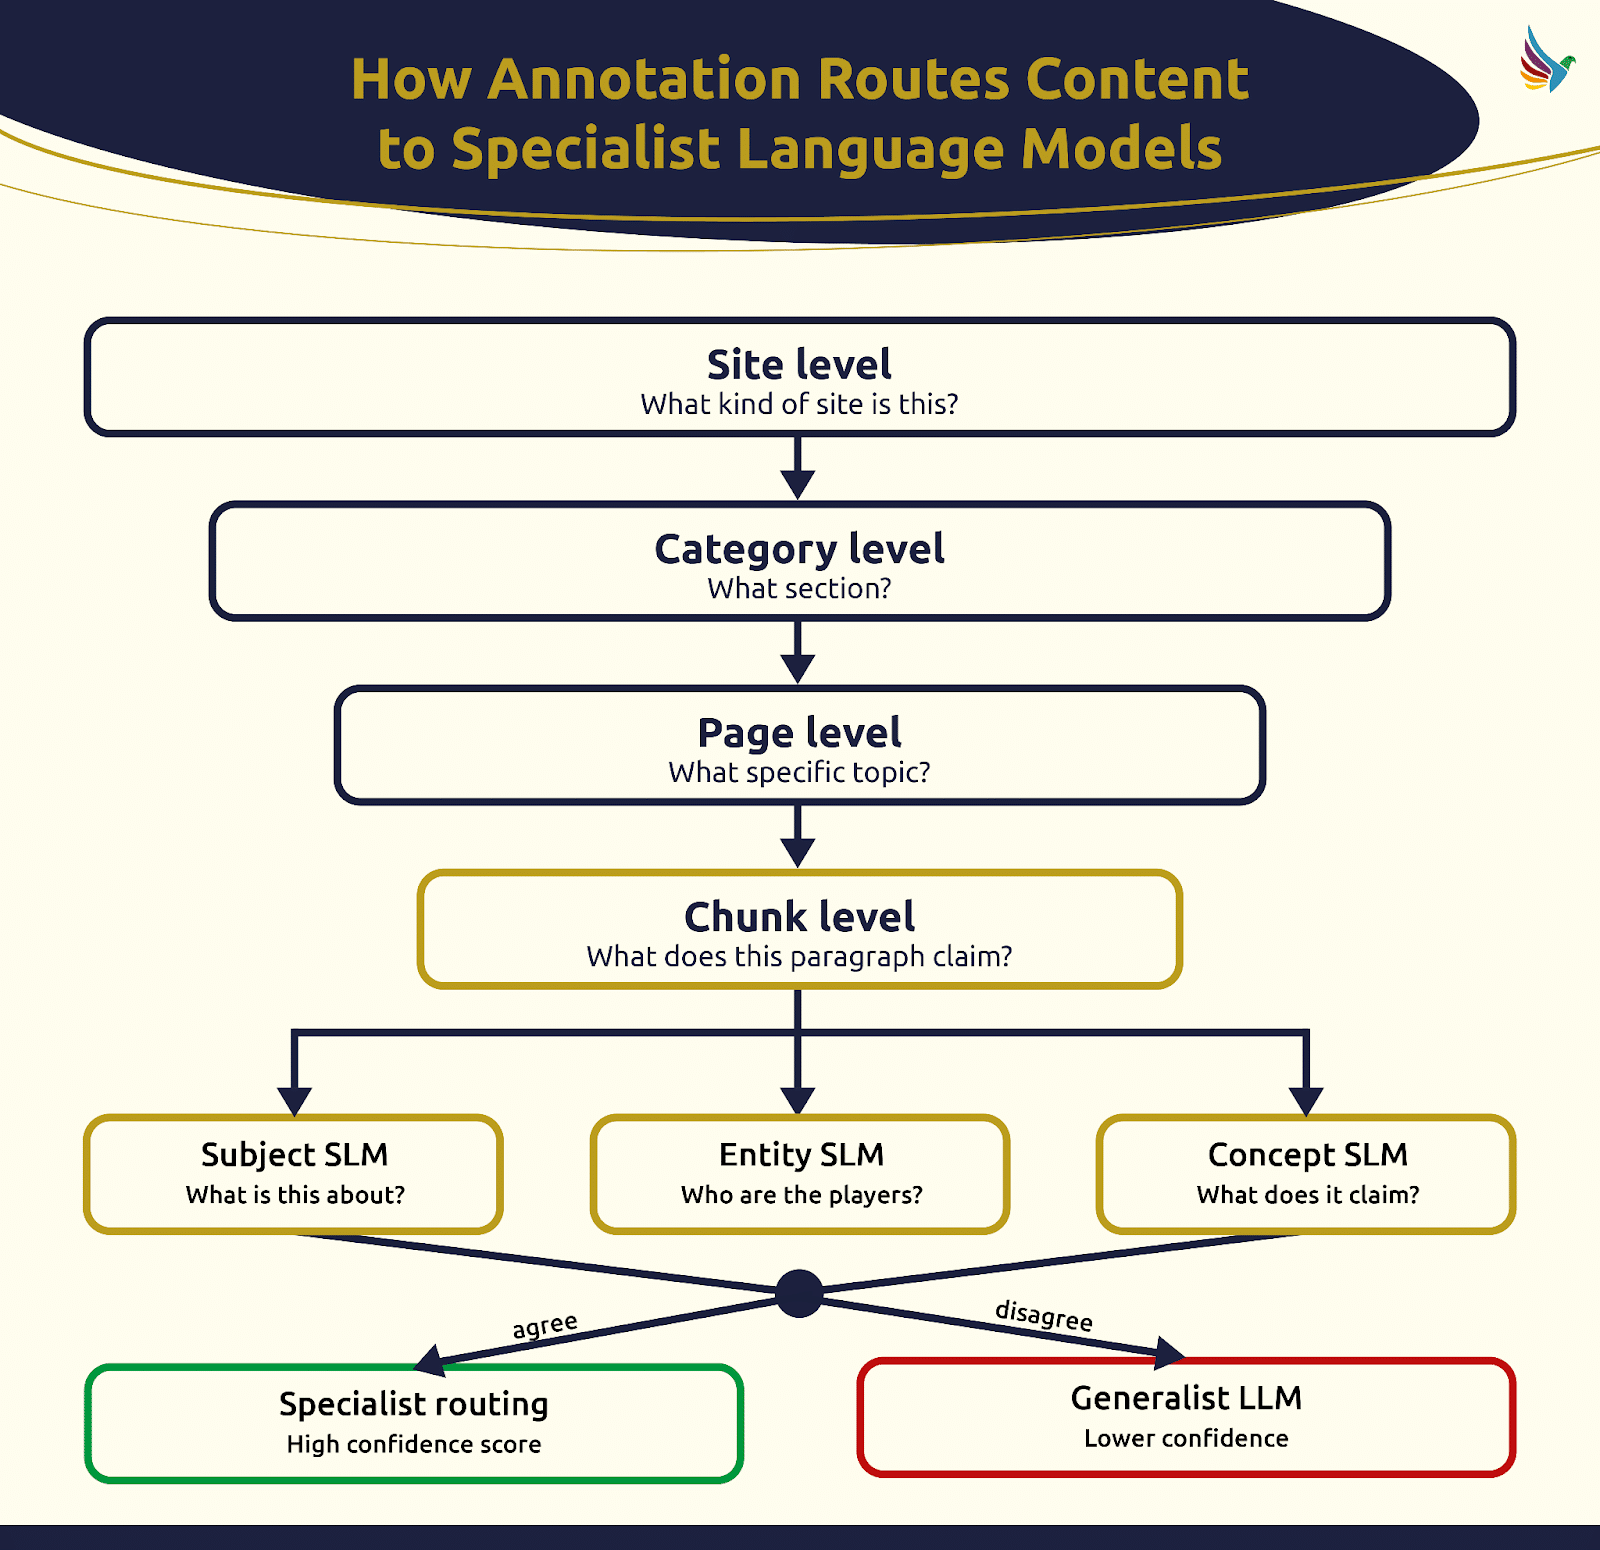
Annotation analyzes each chunk in the context of the whole page, using multiple language models, the web index, and a knowledge graph to determine context and confidence. Poor page-level understanding affects every chunk’s annotation.
Algorithmic systems use annotation to absorb content during recruitment, influenced by different criteria. A low-confidence or misclassified chunk results in a weaker competitive standing.
Annotation is a critical midpoint in the content pipeline, where strategy shifts from infrastructure to competition.
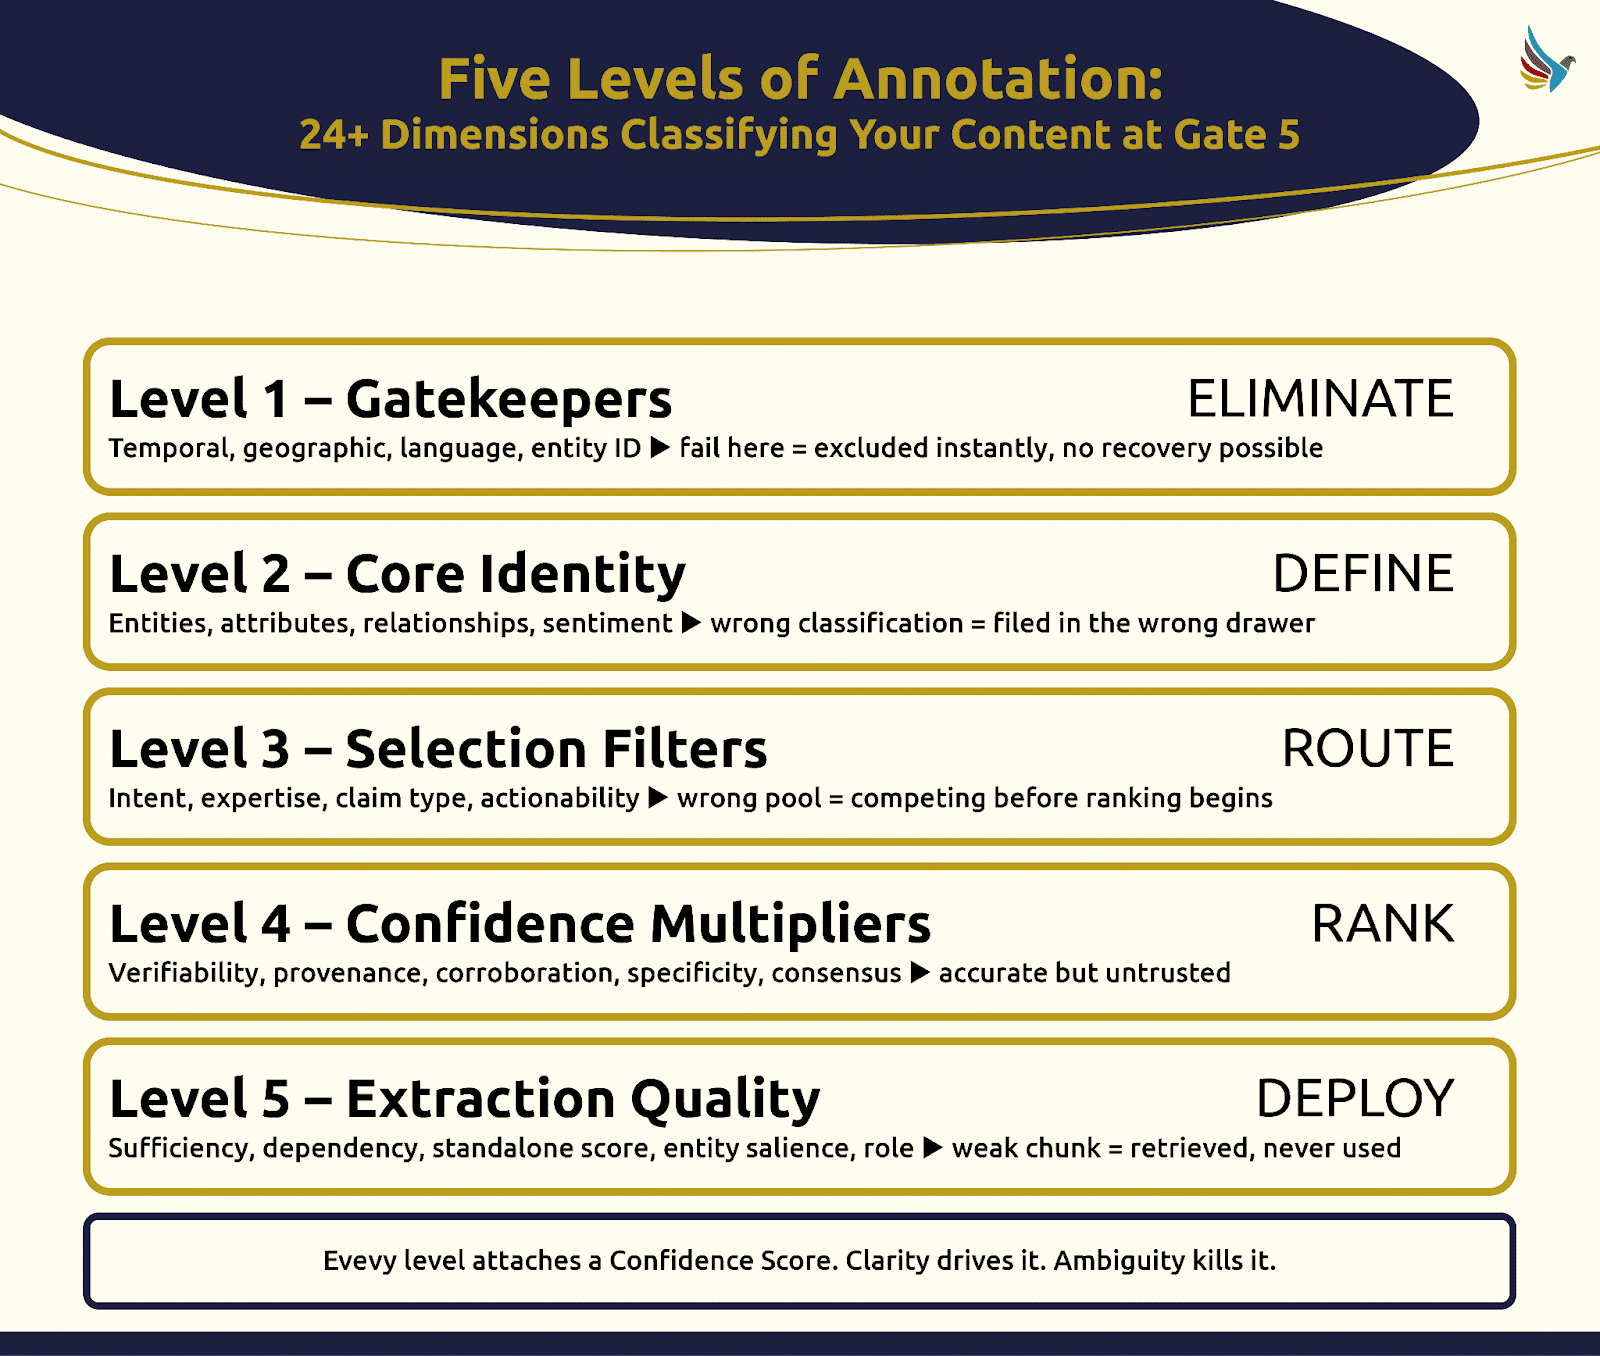
The Five Levels of Annotation
Annotation has five functional categories, each essential in the classification process. Here’s the taxonomy I’ve identified:
Level 1: Gatekeepers
Temporal scope, geographic scope, language, and entity resolution, determining pass or fail.
Failures here instantly remove content from competitiveness.
Level 2: Core Identity
Entities, attributes, relationships, and sentiment are defined.
Without a strong identity, chunks lack significance.
Level 3: Selection Filters
Intent, expertise, claim structure, and actionability determine competition pools.
Mismatched pools mean competing against better-suited content.
Level 4: Confidence Multipliers
Factors like verifiability and corroboration scale rankings.
Confidence impacts all other signals profoundly.
Level 5: Extraction Quality
Determines content’s sufficiency and context need.
Impacts how content appears in outputs.
Annotation Is Where the Game is Won
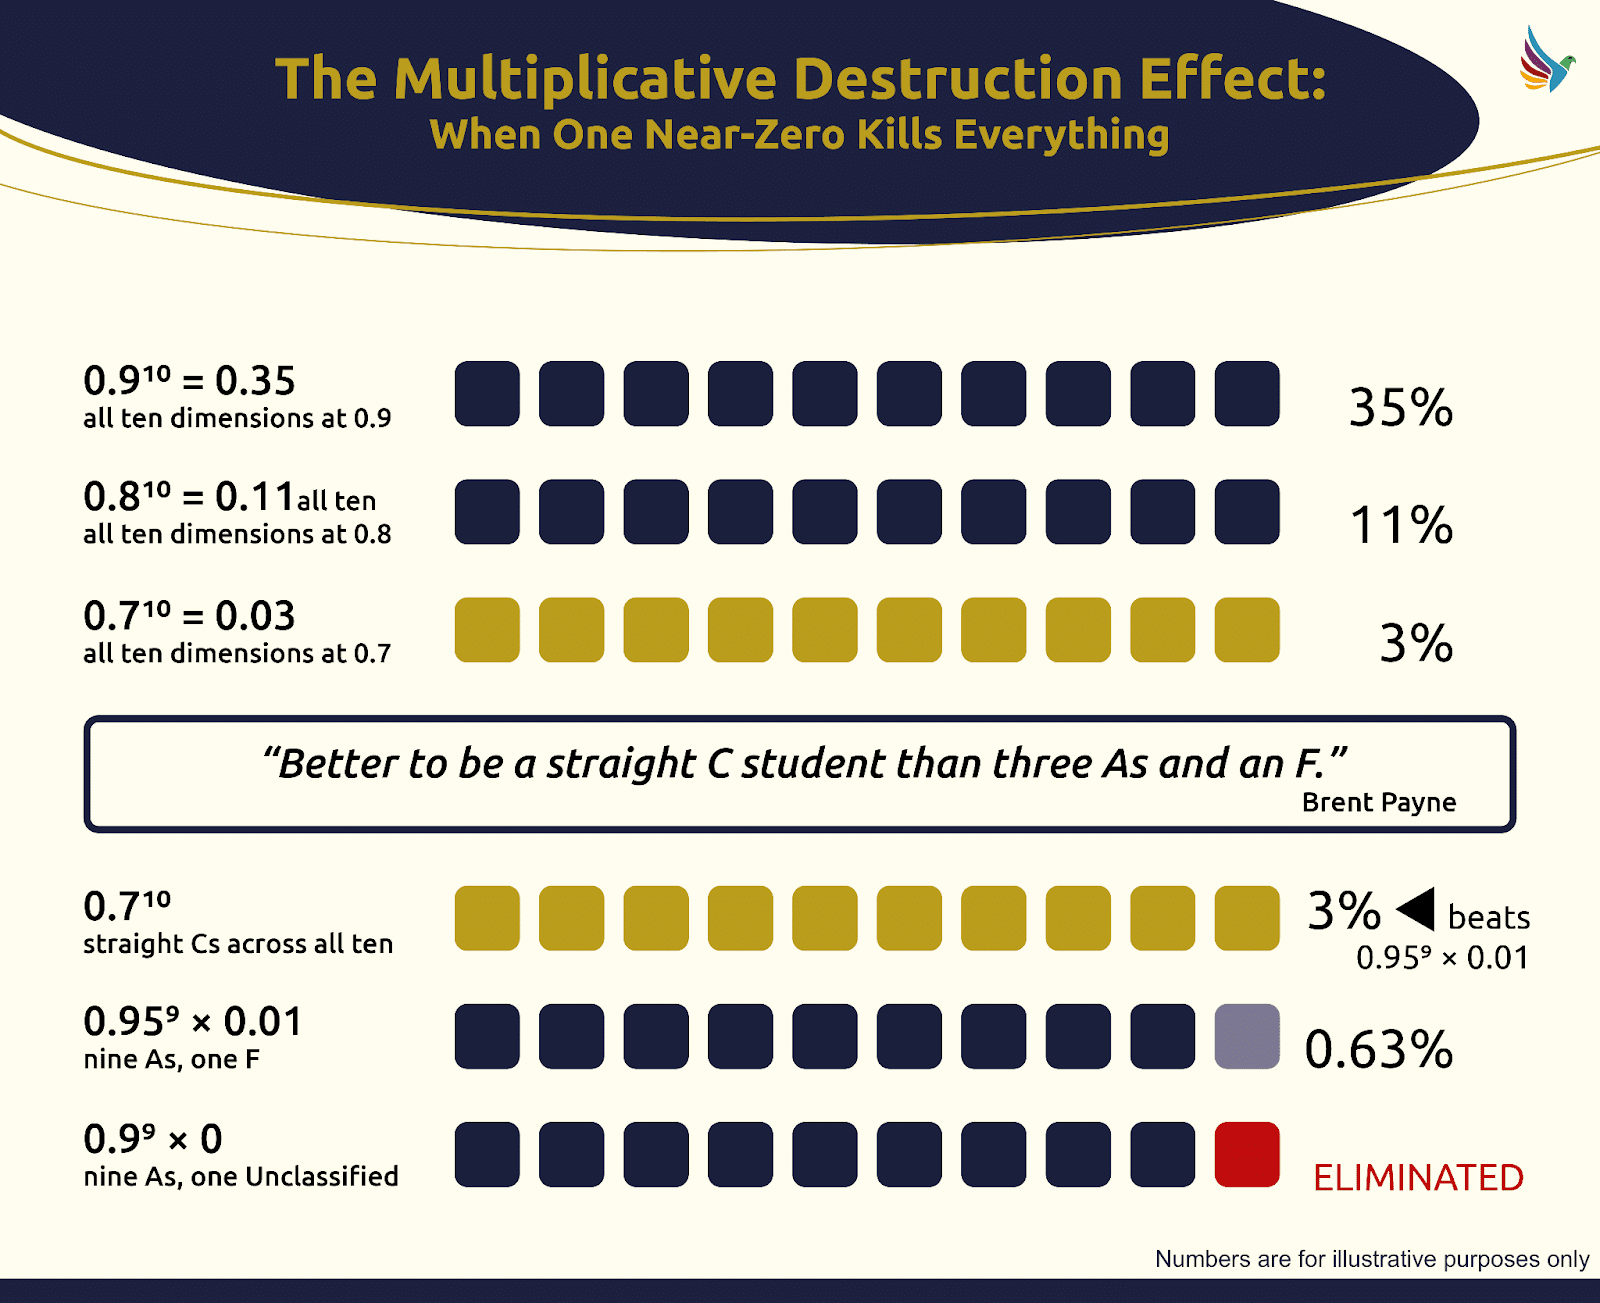
Annotation scores in each level reflect confidence in various aspects of content. Misclassified or low-confidence annotations can doom content before it truly competes.
Annotation fundamentally shapes the understanding algorithms have of your content, making it a crucial aspect of content strategy.
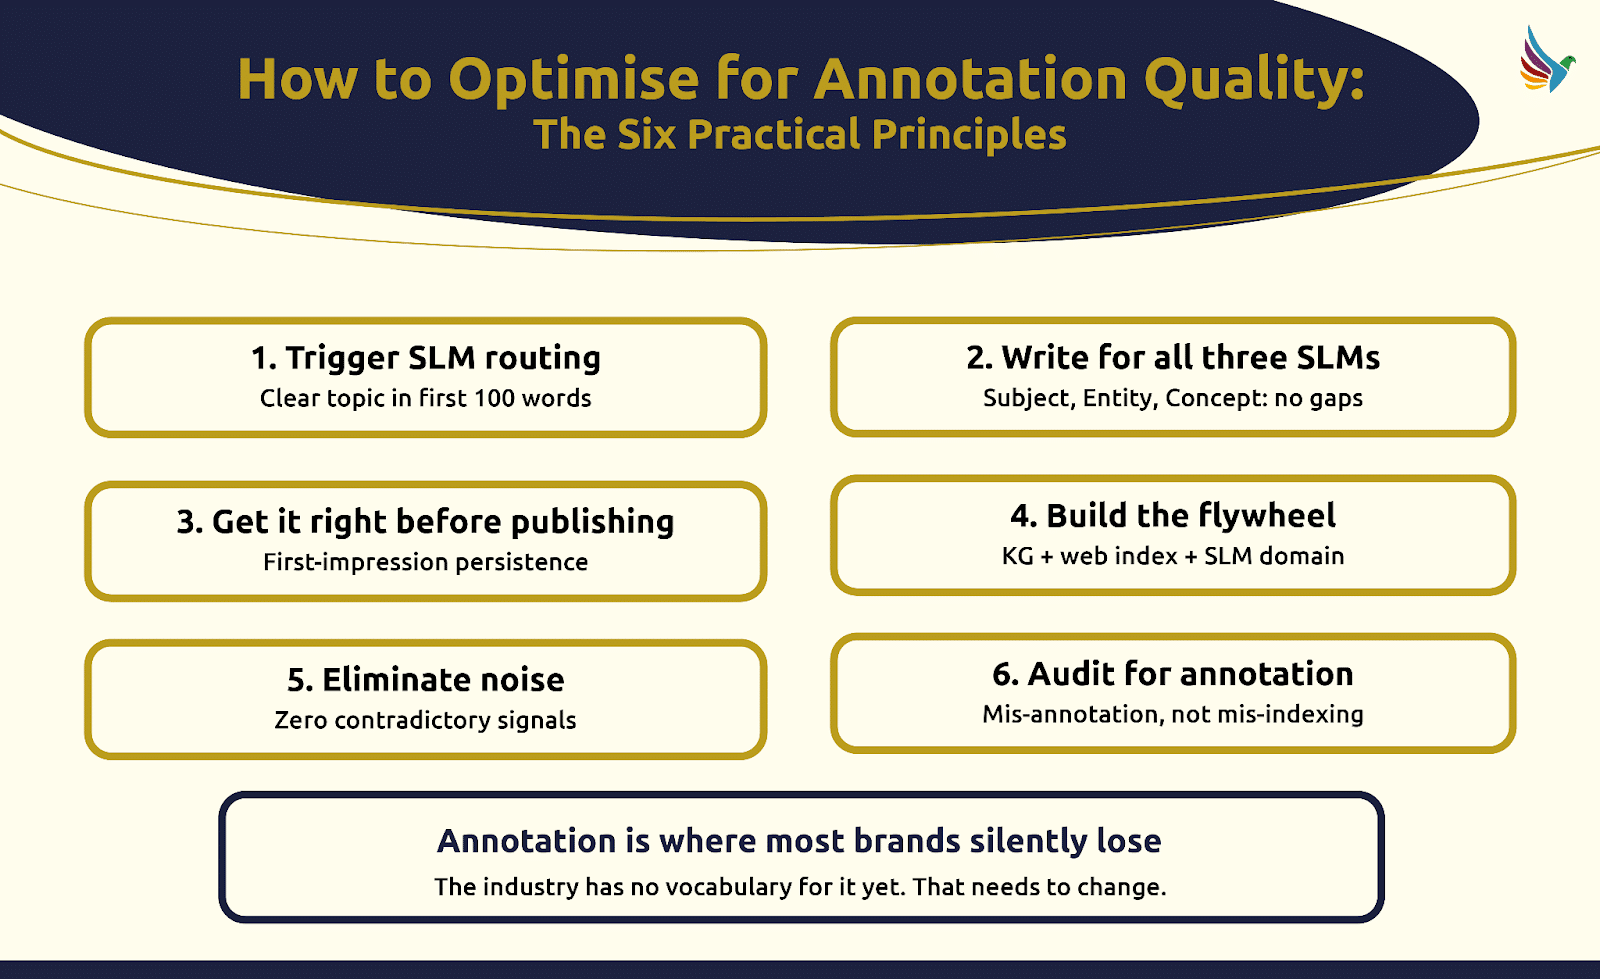
How to Optimize for Annotation Quality
The key to success is optimizing for annotation, not just indexing. Follow these principles:
Ensure category clarity early in content.
Write for subject, entity, and concept clarity.
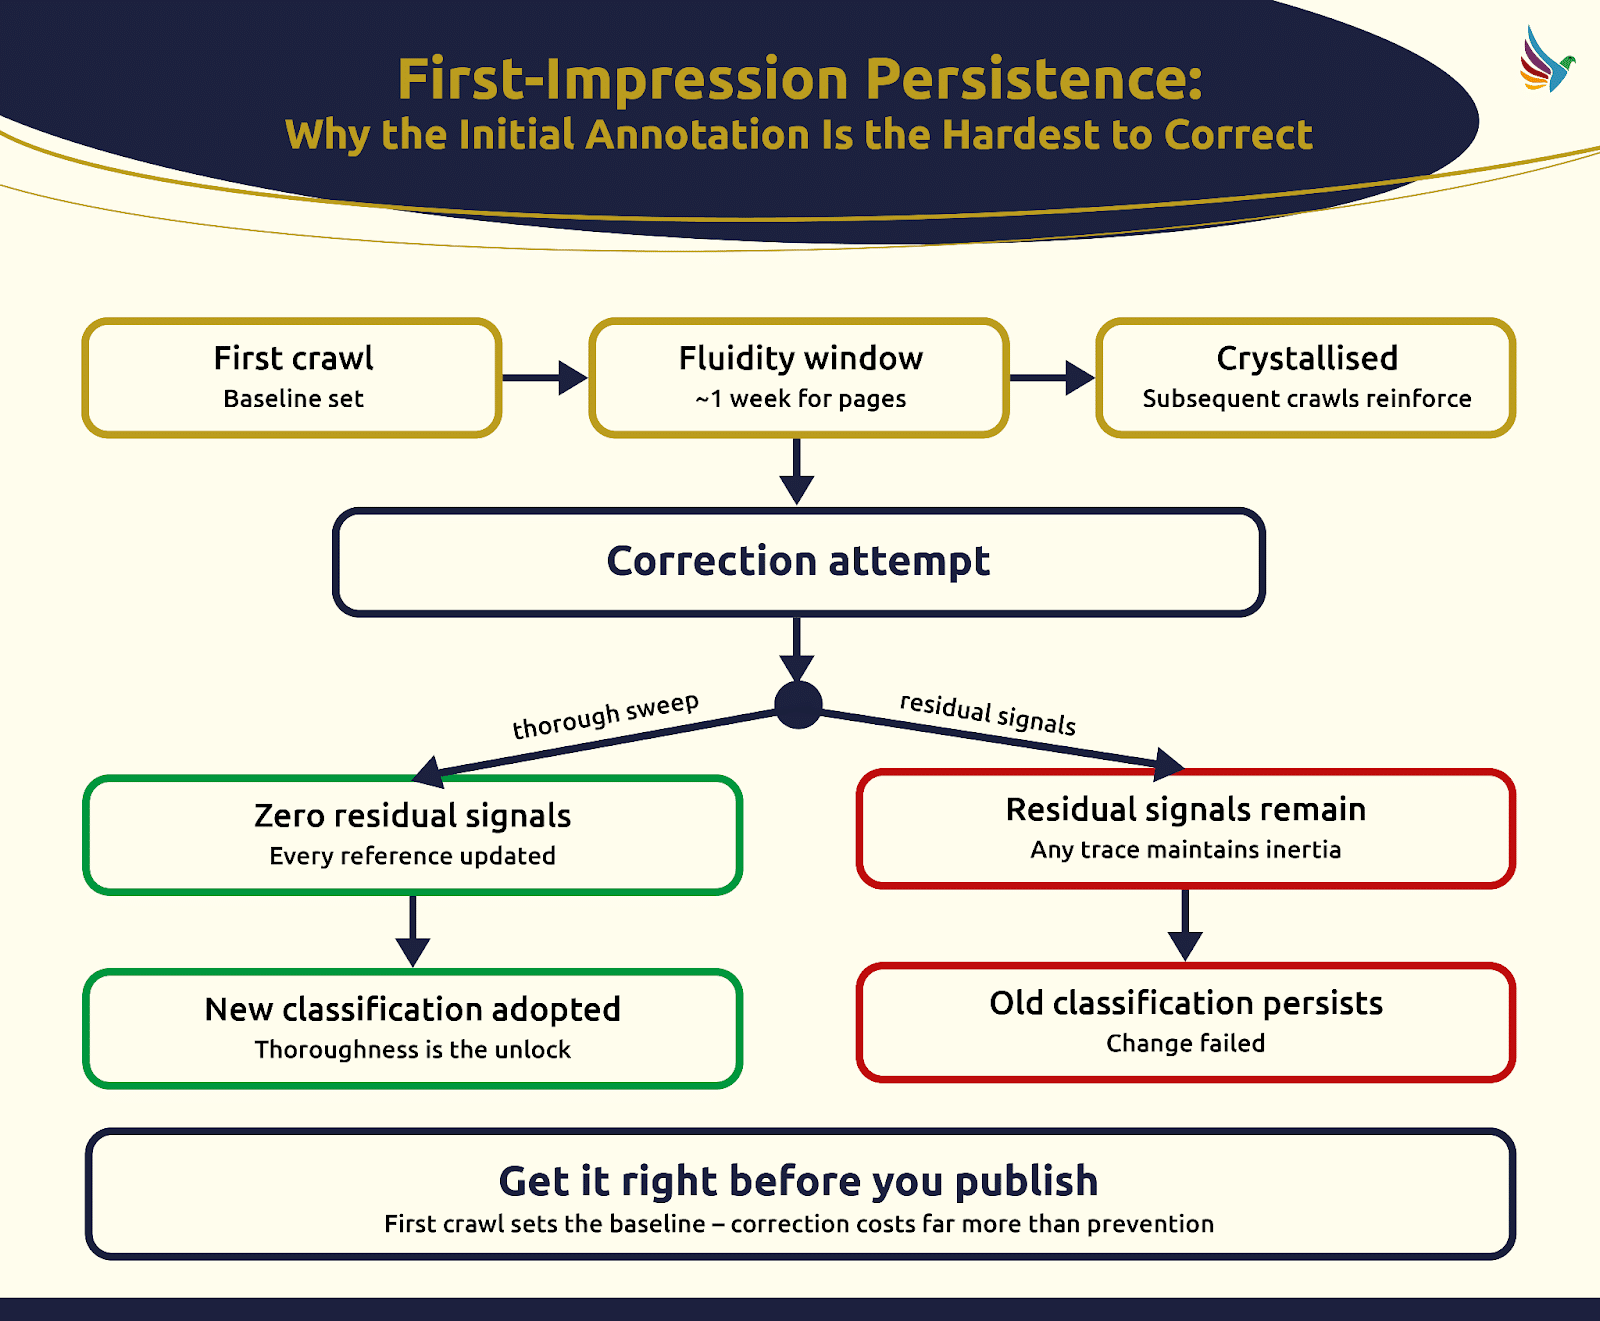
Get annotation right on initial publish.
Invest in a solid entity foundation.
Eliminate contradictory signals promptly.
Audit for annotation accuracy.
Why Annotation Matters
Annotation is your last solo run before entering the competitive fray. Once classified correctly, you’re better positioned to win at recruitment and beyond. Fix it here, or face persistent issues downstream.