Month: July 2026

  • AI Agent Website Accessibility: A Practical Framework

    AI Agent Website Accessibility: A Practical Framework

    AI agent website accessibility is the ability of an automated assistant to discover a page, retrieve its contents, identify the relevant facts, and cite the business as the source. A site can work well for a human visitor yet fail this sequence when important information is hidden, dynamically rendered, ambiguous, or difficult to fetch.

    The practical goal is not to redesign every page for bots. It is to ensure that decision-critical facts survive the agent’s path from search to answer, especially when a prospective buyer asks about pricing, features, integrations, security, or compliance.

    Agent accessibility is a chain, not a page feature

    An agent typically starts with a task rather than a preferred website. It searches for relevant pages, fetches their contents, extracts an answer, and identifies sources it can cite. Failure at any stage can remove the vendor from the resulting answer even if the information appears somewhere on its site.

    This makes agent accessibility broader than visual presentation. A polished pricing grid offers little machine value if its values appear only after client-side code runs. A detailed PDF may contain the answer but make individual plan terms difficult to isolate. A contact-sales page may be accessible and accurate, but it cannot support a numeric answer that the company has chosen not to publish.

    This operational definition should not be confused with, or used as a replacement for, accessibility for people with disabilities. Human accessibility and agent accessibility address different users and failure modes, even though clear structure and understandable content can benefit both.

    Pricing exposes weaknesses that other product facts do not

    A geometric AI assistant faces layered website panels where pricing symbols are visible on one panel but obscured behind a modal and fragmented elements on others.

    A CrushPress.AI analysis conducted with Siteline founder David Kaufman examined three buyer tasks across 100 B2B products. The agent had to find each official vendor site without being given a starting URL, and each task was run five times to account for variable model behavior.

    Buyer taskFirst-party answer rateFirst-party citation share
    Pricing and features79%84%
    Integrations93%99%
    Security and compliance92%99%

    According to the analysis, pricing and feature research generated 77% of all third-party citations in the study. The contrast matters because pricing is both commercially sensitive and central to comparison. Integrations and security information can often be stated as straightforward facts; pricing may depend on plans, billing periods, usage, optional services, negotiated terms, or eligibility rules.

    Non-disclosure was only part of the problem. When a vendor did not publish a real price, 45% of pricing runs cited at least one third-party source. When a numeric public price was present, third-party sources still appeared in 18% of runs. Publishing information therefore improves the opportunity for first-party attribution, but does not guarantee that an agent can extract or trust it.

    Three failure gates determine whether the vendor remains the source

    Disclosure: is there a direct answer?

    The first gate is whether the company states the requested fact. If a price is unavailable, the page can still give an authoritative first-party answer by clearly saying that pricing is customized or requires sales contact. Vague packaging language creates a larger information gap, which third parties may fill without the vendor controlling the context.

    Extraction: can the fact be separated from the interface?

    The second gate is machine-readability. The source identified JavaScript interfaces, calculators, toggles, screenshots, PDFs, and ambiguous tables as potential obstacles. Its Zendesk example described a pricing grid that loaded for people but left the agent without usable plan data, leading to a 53-second process involving six tool calls before the agent turned to third-party blogs.

    The underlying editorial requirement is precision. A price needs an associated plan, unit, billing period, qualification rule, and any material condition. If those relationships are conveyed mainly through layout or interactive state, an agent may retrieve the values without understanding what they mean.

    Reachability: can the page be fetched consistently?

    The third gate is access. Fetch failures, blocking, rate limits, or unreachable pages appeared in 7% of all runs reported by CrushPress.AI, but their effect was disproportionate. Within pricing runs, an access error was associated with third-party fallback in 77% of cases, compared with 17% when no access error occurred.

    The study also compared high- and low-friction runs at the 90th and 10th percentiles. It reported a 4.4-fold cost difference, a 4.7-fold token difference, and a twofold time difference. Those costs are borne by the agent operator rather than the website, but they indicate how quickly retrieval friction can make an alternative source more attractive.

    A practical audit should follow the agent’s full journey

    A luminous AI agent travels through search, web document, fact extraction, and source-link stations along a pathway with three gateways and one blocked side route.

    Start with buyer questions, not page templates

    An audit can begin with the questions a buyer would delegate: What does the product cost? What is included? Which systems does it integrate with? Which security or compliance claims does the vendor make? Testing should begin from external discovery rather than a supplied page URL, mirroring the study’s method and revealing whether the intended first-party page can be found at all.

    Separate essential facts from interactive presentation

    Core plan and product facts should appear as clear page text that a fetcher can retrieve, even when the human experience also uses toggles or calculators. Labels should make relationships explicit: which plan a value belongs to, what the billing basis is, and which conditions change the amount. Complex pricing can remain complex, but its methodology should be explained in a form that can be quoted and cited without reconstructing the interface.

    Evaluate the answer and the citation separately

    A successful audit asks two different questions: did the agent produce an accurate answer, and did it support that answer with the vendor’s page? An answer sourced from a directory or editorial site may appear satisfactory while still showing that the vendor has lost control of attribution. In the reported pricing fallbacks, editorial pages accounted for 52.2% of fallback citations, directories for 45.7%, and ecosystem pages for 2.1%.

    Repeated testing is important because one successful retrieval does not establish reliable access. Results should be checked across multiple attempts, with special attention to blocked fetches, empty dynamic components, inconsistent plan labels, and facts that change when an interface control is activated.

    Key takeaways

    • Agent accessibility depends on discovery, retrieval, extraction, interpretation, and citation; a failure at any gate can push the answer to another source.
    • Pricing is a demanding test because disclosure choices and technical presentation can both prevent first-party attribution.
    • Publishing a number is insufficient when its plan, billing basis, conditions, or surrounding methodology remain ambiguous.
    • Access errors were uncommon in the reported study but sharply increased third-party fallback when they occurred.
    • Audits should test realistic buyer questions from search, repeat the attempts, and score answer accuracy separately from first-party citation.

    As agents assume more research and comparison work, the most resilient sites will treat machine access as part of publishing quality. The priority is a first-party record that remains understandable and citable after the interface itself is removed.


    References

  • What a Potential EU Google Search Ruling Could Change

    What a Potential EU Google Search Ruling Could Change

    A pending European Union decision could change how Google presents its own shopping, travel, and other specialized services alongside competing results. The central issue is whether Google has given its products an unlawful advantage within search.

    The outcome remains expected rather than final. Based on reporting summarized by Search Engine Land, however, the case may affect commercial search visibility, access to search data, and the features available to third-party AI providers.

    The expected decision centers on Google’s dual role

    Google operates the general search platform while also offering specialized services that can appear within its results. That dual role matters because placement on a search results page can influence which services users encounter when they are comparing products, planning travel, or making other purchase-oriented decisions.

    Search Engine Land reports that the European Commission is expected to find that Google illegally favored its own vertical services over rivals. The anticipated decision would be made under the Digital Markets Act. Because no final ruling is described in the source material, the specific obligations and their practical effects should not yet be treated as settled.

    Key takeaways

    • EU regulators are expected to rule on how Google displays its own specialized services compared with competing services.
    • Changes could affect visibility for comparison websites, travel platforms, shopping services, and other businesses seeking organic traffic from commercial queries.
    • The Commission is also expected to address third-party access to ranking, query, click, and view data.
    • A related question is whether third-party AI providers should receive access to features available to Gemini.

    Commercial search visibility could be redistributed

    If the Commission requires Google to alter the presentation of its services, rival platforms may gain additional opportunities to appear in prominent search positions. That possibility is especially relevant in categories where users arrive with strong commercial intent and where visibility can direct valuable organic traffic.

    The effect would not necessarily be uniform. A display change could influence comparison services differently from travel or shopping platforms, depending on which search features are covered and how Google implements any order. The reported case therefore signals a potential change in opportunity, not a guaranteed traffic increase for every competitor.

    For search marketers, the useful distinction is between rankings and presentation. A business may retain the same conventional organic position while receiving more or less attention because surrounding modules, specialized results, or Google-owned features have changed. Any assessment of the ruling’s impact should therefore examine actual result-page layouts as well as ranking reports.

    Futuristic web browser and analytics dashboard overlap amid neon data streams, illustrating the convergence of SEO, PPC and AI-driven search marketing.
    Organic visibility, paid media and artificial intelligence merge into one connected search ecosystem, where vivid data streams link a creative website with a powerful analytics dashboard.

    Financial penalties could accelerate compliance

    According to the report, the Commission is expected to impose fines totaling hundreds of millions of euros across two Digital Markets Act decisions. Google could also face daily penalties if it does not comply with parts of the orders within 60 days.

    Those reported enforcement measures matter because the consequences may extend beyond a one-time financial penalty. A compliance deadline could require operational changes on a defined schedule, while the possibility of continuing penalties would add pressure to complete them. The source does not specify the final fine, the exact daily penalty, or the complete design of any required search changes.

    Data access raises a separate privacy dispute

    The Commission is also expected to decide whether Google must provide third-party search engines with access to search data. The reported categories include ranking, query, click, and view information. Such data can be valuable because it may help a search provider understand user demand, evaluate result quality, and improve how information is retrieved and ordered.

    Google disputes that proposed access, arguing that data sharing would endanger user privacy and go beyond the Commission’s authority. This creates a distinct policy tension: regulators may view access as a way to reduce structural advantages, while Google presents privacy and legal scope as limits on what should be shared. The source provides Google’s position but does not report a final resolution of that disagreement.

    AI access could broaden the decision’s reach

    The Commission is reportedly considering whether third-party AI providers should receive access to the same features available to Gemini. That question connects the search dispute to competition in AI services, although the source does not identify the features at issue or explain how access would be implemented.

    The most important next step is the final text of the Commission’s decisions. It should determine whether the expected findings become formal obligations, which services and data are covered, and what Google must change. Until those details are available, businesses should treat shifts in search visibility and data access as credible possibilities rather than completed outcomes.


    Inspired by this post on Search Engine Land.


    crushpress.ai community screenshot
  • Performance Max Placement Controls Enter an Early Alpha

    Performance Max Placement Controls Enter an Early Alpha

    A limited Performance Max alpha could give selected advertisers a consequential new choice: whether a campaign includes Search Partners and the Google Display Network. The reported setting does not dismantle campaign automation, but it may let advertisers define two important boundaries around the inventory that automation can use.

    The distinction matters for both expectations and testing. This is a reported network-level control, not evidence of comprehensive placement management, and its value will depend on whether advertisers can measure the effects of each configuration reliably.

    Key takeaways

    • CrushPress.AI reported that a Partners (Alpha) setting is appearing in some Performance Max campaigns.
    • The reported interface provides separate inclusion choices for Search Partners and the Google Display Network.
    • Because the setting is labelled Alpha and has limited availability, it should be treated as an experiment rather than an established campaign feature.
    • The most useful evaluation is a controlled comparison based on business outcomes such as cost per acquisition or return on ad spend.
    • The reported controls apply to networks; they should not be interpreted as proof of granular control over individual websites, apps, searches or placements.

    The alpha changes the boundary of automation

    According to CrushPress.AI’s report, advertisers with access can use checkboxes to include or exclude Search Partners and the Google Display Network. The publication said both networks had previously been included automatically in Performance Max without a corresponding exclusion option.

    That makes the test notable without making Performance Max a manually managed campaign type. Google would still automate decisions within the inventory available to the campaign; the advertiser would gain a higher-level choice about whether two sources of inventory are available at all. In practical terms, the control changes the perimeter in which the system operates rather than replacing automated delivery.

    The terminology also deserves care. Although network selection affects where ads may appear, the reported setting is broader than a conventional placement exclusion. It does not, based on the available report, establish controls for selecting particular sites, apps, pages or search contexts.

    Why network choice could improve campaign diagnosis

    An analyst compares two separated streams of generic advertising inventory connected to one automated campaign engine.

    When several inventory sources contribute to one automated campaign, an aggregate result can show whether the campaign succeeded without fully explaining which environments helped or hurt. An option to remove Search Partners or the Google Display Network creates a clearer diagnostic question: does the campaign produce stronger business results when either network is unavailable?

    That question should be framed around the campaign’s actual objective. CrushPress.AI identified return on ad spend and cost per acquisition as relevant measures for evaluating the setting. Advertisers may also need to examine whether changes in those outcomes accompany changes in conversion volume, reach or delivery stability. A lower cost per acquisition is less useful if the configuration can no longer produce the required volume, while additional reach is not automatically valuable if it fails to support the campaign goal.

    The setting may also help separate an inventory concern from a broader campaign problem. If excluding a network does not materially improve the chosen outcome, attention may be better directed toward inputs such as creative, offers, audience signals, conversion measurement or landing-page experience. If performance changes consistently, the result supplies a more focused basis for deciding which inventory belongs in the campaign.

    A useful test requires more than toggling a checkbox

    Two matched campaign pathways use different switch settings in a controlled side-by-side testing setup.

    A credible comparison begins with a decision rule established before the configuration changes. The advertiser should specify the primary business metric, the acceptable trade-off between efficiency and volume, and the conditions that would justify retaining or reversing the exclusion. This reduces the risk of choosing whichever metric looks most favorable afterward.

    The comparison should also avoid unnecessary simultaneous changes. Major adjustments to budgets, conversion definitions, creative assets or landing pages can make it difficult to attribute a result to network selection. Normal volatility and automated learning further argue against drawing a conclusion from a brief movement in performance.

    Interpretation should account for interaction effects. Excluding inventory can change the opportunities available to the campaign, which may alter how automation distributes delivery elsewhere. The meaningful comparison is therefore the campaign’s total outcome under each configuration, not an assumption that removed activity would have transferred unchanged to another network.

    What remains unresolved while access is limited

    The available evidence is preliminary. CrushPress.AI described the control as an Alpha available to a limited group and reported that Google had not announced whether or when it would become more broadly available. The report attributed the discovery to PPC Growth Strategist Saquib Syed, who shared the setting on LinkedIn.

    The report does not establish how eligibility is determined, whether the interface will remain unchanged, or whether Google will add related reporting and controls. Those omissions are especially important because a network toggle is most actionable when advertisers can clearly evaluate the inventory affected by it.

    The next meaningful signal will be broader availability accompanied by documented behavior and sufficient reporting to support sound comparisons. Until then, advertisers with access can treat the alpha as a structured learning opportunity, while those without it should avoid planning around a control that has not been confirmed as a general release.

    References

  • Google AI Mode Visibility Is Splitting Into Three Channels

    Google AI Mode Visibility Is Splitting Into Three Channels

    Commercial visibility in Google AI Mode is developing along several paths at once. Advertisers can buy placements, publishers and brands can earn citations, and businesses can appear through Google-hosted profiles or product panels.

    Two separate reports show why these surfaces should not be treated as one ranking system. Paid coverage is expanding across commercially valuable queries, while Google is also becoming a more prominent source inside its own AI-generated answers. The practical payoff is a clearer way to assign budgets, ownership and measurement.

    Key takeaways

    • CrushPress.AI’s summary of an SE Ranking study reported text ads on 29.45% of the commercial AI Mode queries examined.
    • Ad incidence rose with keyword cost, but the study did not find the same relationship with search volume or keyword difficulty.
    • Paid placement provided little overlap with cited or traditionally ranked URLs, indicating that advertising, citations and organic search require separate strategies.
    • A second CrushPress.AI report said google.com became AI Mode’s second-most-cited domain in Profound’s tracking, driven mainly by Google Business Profiles and Product Knowledge Panels.
    • Commercial visibility therefore depends on both website performance and the quality of information presented on Google-controlled surfaces.

    Commercial visibility now has three distinct layers

    The reports describe complementary changes rather than competing explanations. The SE Ranking analysis covered paid text placements, whereas Profound tracked the domains AI Mode cited. Together, the findings suggest that appearing near an AI-generated response can happen through three substantially different mechanisms: an ad auction, selection as a cited source, or a Google-hosted information surface.

    The distinction matters because each layer answers a different business need. Advertising can provide purchased exposure on a relevant query. A citation can establish a website as supporting material for the generated answer. A Google Business Profile or Product Knowledge Panel can present decision-making information without requiring the user to reach the company’s website first.

    Profound’s tracking, as summarized by CrushPress.AI, found that citations to google.com increased 8.4-fold in roughly two months, making it the second-most-cited domain in the data. The report attributed almost all of that increase to Google Business Profiles and Product Knowledge Panels. Its analysis ran from April 15 through June 30 and covered more than 32 million google.com/searchviewer instances.

    The reported shift was especially relevant to local searches in hospitality and travel, home services, restaurants and dining, real estate, and healthcare. For product-oriented queries, panels appeared more often around comparisons, compatibility and specifications. These are situations in which structured facts can influence consideration before a conventional website visit.

    Paid reach follows commercial value, not general popularity

    CrushPress.AI’s account of the SE Ranking study reported ads across 14,733 queries, or 29.45% of the commercial searches analyzed. The study examined 50,032 U.S. keywords across 20 niches, using results collected on June 30. It focused on queries eligible for text ads and excluded product carousels.

    Cost per click was the clearest reported indicator of whether an ad appeared. Ad incidence was 24.33% among keywords with CPCs below $2, 32.45% in the $2-to-$10 group and 53.56% for keywords at $10 or more. Search volume and keyword difficulty did not show the same relationship in the study. This pattern supports a cautious interpretation: AI Mode ad deployment appears more closely aligned with the economic value of a query than with its popularity or organic competitiveness alone.

    When an ad block appeared, it usually included more than one advertiser. The study found two ads in 71.1% of ad-triggering responses and one ad in the remaining 28.9%. Category results varied sharply, from a reported 72.38% ad rate for pets to 2.64% for healthcare. Those differences warn against using the overall 29.45% rate as a forecast for every market.

    The study also noted that AI Mode results can vary between sessions. Its percentages should therefore be read as observations from the stated collection date and methodology, not permanent delivery guarantees. The source further cautioned that the pattern could change as Google introduces more AI-specific advertising formats.

    Buying an ad does not secure the other layers

    Three separate glass corridors contain bid tokens, connected source pages, and a digital storefront with products.

    The most consequential finding for planning was the limited overlap between advertisers and unpaid visibility. According to the SE Ranking analysis summarized by CrushPress.AI, only 11.53% of advertiser domains appeared among cited sources for the keywords on which they advertised. At the individual URL level, overlap fell to 1.95%.

    Traditional organic results showed a similar separation. Just 2.32% of advertised URLs also ranked organically for the corresponding queries, while domain-level overlap reached 15.35%. In other words, approximately 85% of advertisers did not appear in organic results for the same keywords, according to the source.

    Visibility comparisonReported overlapPlanning implication
    Advertiser domain and cited domain11.53%Paid reach is not a substitute for earning citations.
    Advertised URL and cited URL1.95%The landing page is rarely the exact source selected for the answer.
    Advertiser domain and organic domain15.35%Advertising and domain-level organic visibility remain largely separate.
    Advertised URL and organic URL2.32%Buying exposure does not ensure that the same page ranks.

    The researchers reportedly compared advertisers with similar non-advertising domains while accounting for domain strength, backlinks, referring domains and organic visibility. Even so, the findings are observational. They do not establish that advertising causes or prevents citation and ranking outcomes. They do show that purchasing an AI Mode placement should not be assumed to improve either one.

    A practical operating model for AI Mode visibility

    An operations table is divided into zones for paid media, source citations, and product profiles, each with separate measurement tools.

    Organizations can respond by assigning each visibility layer a distinct job. Paid-search teams can evaluate AI Mode ads according to query economics, placement availability and conversion performance. SEO and content teams can monitor whether the brand’s pages are cited or ranked, then improve the relevance and usefulness of the pages intended to earn that exposure.

    Local and commerce teams need a third workstream for Google-hosted information. Business hours, locations, photos and reviews can become part of the AI Mode experience through Google Business Profiles. Product specifications and compatibility information may surface through Product Knowledge Panels. Because those details can be encountered before the website, maintaining them is part of commercial presentation rather than a secondary listing task.

    Reporting should preserve the same separation. A combined visibility score can conceal whether progress came from spending more, earning stronger source selection, improving organic rankings or maintaining a more complete Google-hosted profile. Channel-specific reporting makes it possible to connect each outcome to the team and investment responsible for it.

    The next useful evidence will be longitudinal: whether ad incidence continues to rise, whether new formats change advertiser competition, and whether Google’s share of citations remains concentrated in its own local and product surfaces. Until those patterns are clearer, the sound approach is to manage AI Mode as a portfolio of paid, earned and platform-hosted visibility rather than as a single search position.

    References

  • How to Build an Integrated Search and Discovery Strategy

    How to Build an Integrated Search and Discovery Strategy

    An integrated search and discovery strategy starts with a practical observation: customers may encounter a brand on a recommendation platform, investigate it through an AI-generated answer, validate it on Google and convert through a paid or organic visit. Treating each of those encounters as a separate contest obscures how the decision develops.

    The useful question is therefore not whether SEO, paid search or social media should win the budget. It is which combination can create demand, answer questions, establish confidence and convert attention efficiently.

    Key takeaways

    • Plan around the customer’s decision process rather than treating search, social and AI as isolated channels.
    • Measure visibility and influence as well as clicks because many searches now end without a website visit.
    • Assign paid, organic, local and discovery media different jobs according to the market, customer and economics.
    • Manage brand visibility, media reach and post-click experience as one performance system.

    Why the SEO-versus-PPC contest no longer describes the market

    The traditional channel debate assumed that a customer entered a query, saw a reasonably stable results page and selected either an advertisement or an organic listing. Under that model, SEO and PPC could be evaluated as alternative ways to acquire substantially the same click.

    The article SEO vs. PPC Is Over: Why AI Makes Integration Essential describes a different environment. It reports that 68.01% of U.S. Google searches during the first four months of 2026 ended without a click, compared with 60.45% in 2024. It also cites Seer Interactive findings in which the average organic click-through rate for queries displaying AI Overviews fell from 1.76% to 0.61%. These are source-reported figures rather than independently verified measurements, but they illustrate why rankings and traffic can no longer provide a complete account of search performance.

    The same article cites SparkToro and Datos research spanning 41 platforms. In that research, Google accounted for 73.7% of desktop searches, while traditional search engines collectively represented about 80%. Commerce platforms accounted for roughly 10%, social platforms for 5.5% and AI tools for 3.2%. It further reported that Amazon, Bing and YouTube each handled more search activity than ChatGPT. The implication is not that Google has become unimportant. It is that information seeking is distributed across environments with different interfaces and forms of influence.

    Integration addresses two related forms of compression. AI-generated answers can satisfy some needs before a click occurs, while crowded results pages can push even a top organic result below advertisements, local features and other links. A brand must consequently earn recognition before the query, be credible within answer and validation surfaces, secure prominent access when commercial intent appears and make any resulting visit more valuable.

    Model the journey from passive discovery to commercial action

    One person progresses from noticing a recommendation to researching, comparing, validating, and making a purchase.

    The beginning of a buying journey may now be an unsolicited recommendation rather than an expressed query. Why Your Next Customer May Find You on TikTok Before Google explains how TikTok can infer interests from signals such as watch time, rewatches, pauses, shares and saves. The article also cites a Google executive’s statement that almost 40% of young people looking for somewhere to eat turn to TikTok or Instagram instead of Google Search or Google Maps.

    That pattern is especially relevant where appearance, atmosphere or demonstration affects confidence. The TikTok article identifies restaurants, hotels, beauty, fitness and retail as examples in which short-form video can create an initial preference before formal research begins. Google, Maps, reviews and a business’s website may then serve as confirmation and transaction surfaces.

    Decision stageCustomer behaviorPrimary strategic jobUseful measurement
    DiscoveryEncounters an idea without requesting itUse native video, creators, communities or editorial distribution to earn relevant attentionQualified reach, viewing depth, saves and subsequent brand interest
    ExplorationLooks for explanations, comparisons or possibilitiesPublish useful material that search engines, social platforms and AI systems can interpretTopic visibility, engaged visits, mentions and assisted actions
    ValidationChecks reputation, location, suitability and alternativesCoordinate organic results, local profiles, reviews, brand information and selective paid coverageBranded demand, profile actions, qualified inquiries and conversion paths
    Action and captureVisits, inquires, purchases or continues a longer evaluationReduce friction, clarify the offer and obtain permission for an ongoing relationship when appropriateConversion quality, acquisition cost, lead progression and customer value

    This model also turns discovery platforms into research inputs. The TikTok article points to Creator Search Insights as a source of rising topics, unanswered questions and content gaps. Those observations can inform search pages, FAQs, local content, editorial planning and product positioning. The purpose is not to duplicate one asset everywhere, but to carry a coherent answer across formats suited to each environment.

    Assign channels by the constraint they can resolve

    A fixed channel hierarchy fails because businesses need different volumes, types and timings of demand. The two client examples reported in SEO vs. PPC Is Over demonstrate the contrast.

    In the first example, an architect held top organic rankings for apparently valuable terms but received few leads. The article reports that advertisements, a search feature and local listings placed roughly 20 links ahead of the number-one organic result. Search Console showed about 300 monthly searches and a click-through rate near 1%, equating to approximately three clicks. Moving part of the SEO budget into paid search improved performance because the immediate problem was insufficient visibility where users were looking.

    The second example involved a clinical psychologist whose capacity could be filled with only two or three high-quality inquiries per week. According to the article, a focused combination of a rebuilt website, on-page and local SEO, a Google Business Profile and relevant citations produced enough visibility across Maps, local organic results and AI-generated results. Paid reach was unnecessary because the constraint was not lead volume; it was attracting a small number of suitable local prospects.

    These cases suggest a more disciplined allocation test. A business should identify whether its binding constraint is awareness, answer visibility, results-page prominence, local credibility, conversion capacity or lead quality. Paid search can bridge a prominence or timing gap. Organic and local work can build durable relevance and confidence. Recommendation media can introduce options before explicit demand exists. AI visibility can influence research even when no referral click follows.

    Budget should follow the constraint and the marginal value of resolving it, not a predetermined percentage for each channel. A top organic position with negligible exposure may be less useful than paid placement, while a low-capacity specialist may gain little from purchasing additional volume. The relevant outcome is qualified business contribution across the journey.

    Manage media economics and measurement as one system

    Several colored channel streams converge in a central measurement hub before continuing toward a customer outcome.

    Integration also changes how rising acquisition costs should be diagnosed. Why I See CPC Inflation Starting Before the Search Auction argues that cost pressure begins upstream when AI answers absorb clicks, organic traffic contracts and more advertisers pursue the remaining commercial opportunities. The article cites a WordStream cross-industry average cost per click of $5.42 and Stackmatix estimates that Google Search CPCs rose 14% to 18%. Those benchmarks may not describe every account, but the reported direction supports examining more than bids and ad copy.

    The CPC article organizes the response around brand, reach and experience. Brand activity can increase recognition across publications, communities, organic results and AI answers before an auction occurs. Reach management includes targeting, match types, creative, bidding automation and guardrails, as well as testing less-crowded inventory. The article proposes measured experiments involving Microsoft Advertising, Reddit, LinkedIn Thought Leader Ads, niche newsletters, connected television, podcasts and emerging AI search advertising rather than abandoning Google Search.

    Experience determines the value recovered from an acquired visit. The same source notes that landing-page experience contributes to Google’s Quality Score and argues that stronger pages can improve both conversion economics and auction competitiveness. For longer decisions, the page may also need to capture first-party permission or support a later return rather than forcing an immediate sale.

    Measurement should mirror these connected roles. Discovery reporting can examine attention quality and later changes in brand interest. Search reporting can separate informational, navigational and transactional demand instead of blending unlike queries. Conversion reporting can follow qualified leads or revenue beyond the first click. Controlled budget tests, consistent campaign naming and shared definitions of a qualified outcome can help distinguish genuine contribution from platform-claimed credit.

    No single metric will reconcile a journey distributed across recommendation feeds, AI answers, search features, advertisements and websites. The practical operating model is a shared evidence loop: discovery signals shape content, content strengthens validation, paid media covers consequential gaps, and conversion evidence informs the next allocation decision. As interfaces continue to change, organizations that maintain that loop will be better equipped to adapt without rebuilding strategy around every new platform.

    References

  • How AI Search Is Becoming the New Digital Storefront

    How AI Search Is Becoming the New Digital Storefront

    AI search is creating a commercial interface between brands and buyers before many people reach a company’s website. That interface can introduce the brand, assemble a consideration set, compare alternatives and move a buyer closer to a decision.

    Two complementary ideas clarify what marketers need to manage. HiGoodie describes AI-generated brand representation as an unofficial homepage, while Profound’s shopping research frames the product shortlist as a new digital shelf. Together, they suggest that the emerging AI storefront has both a narrative layer and a selection layer.

    One storefront, two distinct commercial layers

    The homepage metaphor concerns interpretation. An AI answer may summarize what a company does, associate it with a category, explain its benefits and cite sources that influence the resulting description. HiGoodie’s account argues that brands already have this kind of model-generated presence, even though they did not design or publish it themselves.

    The shelf metaphor concerns consideration. When an answer recommends several products, the named options become the immediately visible assortment. A brand can therefore be described accurately yet still be commercially absent if it does not appear when the model constructs a shortlist.

    These layers depend on related but different signals. Citations and distributed information help shape the brand story; recommendation visibility determines whether the brand enters the comparison. Treating AI search only as a referral channel misses both functions. The answer itself is part of the customer experience, not merely a link leading to it.

    The shortlist evidence points to influence, not proven causation

    Profound reported a behavioral study conducted with Kevin Indig and Clickstream Solutions in which 56 participants completed 221 shopping tasks. According to the published account, brands that appeared more often in ChatGPT answers were also more likely to be selected by participants.

    The same source reported that 57.1% of sessions ended with participants ready to decide, while another 36.5% reached active comparison. Within the boundaries of that study, AI-assisted shopping generally advanced the decision rather than leaving the participant at an early discovery stage.

    That is meaningful evidence of an association between answer visibility and choice, but it should not be converted into a causal claim. A brand might appear frequently because it is already prominent, well documented or suitable for the task. The study nevertheless highlights a practical risk: exclusion from the generated set can remove a product from consideration before conventional website analytics register a visit.

    Storefront influence varies sharply by category

    A shopper stands at the center of pathways leading to differently illuminated displays for electronics, personal care, furniture, and everyday goods.

    The reported relationship was not uniform. Profound’s category ranking showed a +0.97 correlation for grocery and a -0.98 correlation for coaching between ChatGPT visibility and participant choice. These figures came from the source’s study and should be read as category-specific findings, not universal benchmarks.

    The contrast matters because an AI shortlist does not play the same role in every purchase. In some categories, recognizable products and comparable attributes may make the generated set especially useful. In others, personal fit, trust or evaluation outside the answer may dominate. The evidence therefore supports category testing rather than a single visibility target applied across an entire portfolio.

    A useful assessment asks where the answer sits in the decision process. It may function as an initial orientation, a comparison aid or a near-final recommendation. The closer it sits to selection, the more consequential shortlist inclusion becomes. Where it mainly supplies context, accurate representation and credible citations may deserve greater attention than raw mention frequency.

    Managing the AI storefront requires broader measurement

    Analysts examine an abstract interface connecting AI discovery, product selection, a website, a retail shelf, and a purchase point.

    The first management task is to separate representation from recommendation. Teams can examine recurring customer questions and record how AI systems describe the brand, which claims they emphasize, what sources they cite, which competitors appear and whether the brand reaches the shortlist. This produces a more useful view than a single visibility score because it reveals the role assigned to the brand in each answer.

    Distribution is part of that work. HiGoodie argues that AI search rewards broad visibility, complicates selective partnerships and weakens the value of exclusivity. The strategic implication is not indiscriminate publishing. It is that a polished corporate site alone may be insufficient when models also rely on information encountered through other cited sources. Consistency across credible, relevant coverage becomes part of storefront management.

    Measurement also has to extend beyond ordinary referral reports. Profound characterizes the decision moment inside ChatGPT as difficult for traditional analytics to observe. A website can measure visitors who arrive, but it cannot directly show how often an answer excluded the brand or persuaded someone to choose a competitor without clicking. Prompt-based visibility monitoring, citation reviews and controlled customer research can help examine that missing part of the journey, while on-site data remains useful for the traffic that does arrive.

    Any resulting program should distinguish four questions: Is the brand represented accurately? Is it supported by appropriate citations? Does it enter relevant comparison sets? Does its presence align with customer choice in the category being studied? Keeping those questions separate reduces the temptation to treat every mention as equivalent commercial value.

    Key takeaways

    • The AI storefront has a narrative layer that explains the brand and a selection layer that determines whether it enters consideration.
    • Profound’s study found a strong relationship between ChatGPT visibility and participant choice, but the reported association does not by itself prove causation.
    • The sharply different grocery and coaching results show why AI-search performance should be evaluated by category and decision context.
    • Brands need to review answer quality, citations and shortlist inclusion alongside conventional traffic and conversion measures.

    As AI answers take on more of the work once performed by search results, homepages and comparison pages, the central challenge will be to connect accurate representation with meaningful inclusion at the moments when buyers narrow their options.

    References

  • The Economics Behind ChatGPT’s $100 Billion Ad Target

    The Economics Behind ChatGPT’s $100 Billion Ad Target

    ChatGPT advertising is being framed as a potential bridge between conversational AI and the large budgets already committed to digital media. The central economic question, however, is not whether ads can appear in a chatbot. It is whether the format can attract enough demand, usage and measurable commercial activity to support OpenAI’s reported revenue ambitions.

    A comparison reported by CrushPress.AI illustrates the uncertainty: OpenAI’s projection for its own advertising business is dramatically larger than Emarketer’s forecast for the entire U.S. standalone-chatbot advertising market. Understanding that discrepancy requires separating the headline numbers from their scope and underlying assumptions.

    Key takeaways

    • CrushPress.AI reported that OpenAI projected $2.5 billion in advertising revenue for the year discussed in the source and $100 billion by 2030.
    • The same article cited Emarketer’s forecast of less than $1 billion for the U.S. standalone-chatbot advertising market in that year and $5.41 billion by 2030.
    • The figures signal a major expectations gap, but they are not necessarily like-for-like because Emarketer’s estimate is limited to the United States and a defined set of standalone chatbot experiences.
    • Reaching OpenAI’s target would likely require more than inserting conventional ads into conversations; it would depend on substantial advertiser demand, commercial user activity and credible measurement.

    The forecasts describe radically different economic outcomes

    According to CrushPress.AI, OpenAI began testing ChatGPT ads in February and, by April, was projecting that advertising revenue would reach $100 billion within five years. The article also reported a $2.5 billion advertising-revenue projection for the year covered by the forecast.

    Emarketer’s outlook, as presented in the article, is much smaller. It estimated that U.S. advertising across standalone chatbots would generate less than $1 billion in the same year and rise to $5.41 billion by 2030. CrushPress.AI characterized OpenAI as being on course to miss its 2030 target by roughly 90% if the market develops along Emarketer’s forecast.

    ForecastNear-term figure reported2030 figure reportedStated scope
    OpenAI advertising projection$2.5 billion$100 billionOpenAI’s advertising business; geography was not specified in the supplied report
    Emarketer market forecastLess than $1 billion$5.41 billionU.S. standalone-chatbot advertising market

    The contrast is economically significant even before attempting a direct comparison. One outlook anticipates a very large revenue stream for a single company, while the other expects the defined market category to remain comparatively modest through 2030.

    The scope mismatch matters as much as the revenue gap

    A large sphere of conversation bubbles outweighs a smaller geographically bounded cluster on a balance scale.

    Emarketer’s forecast covered standalone chatbot products in the United States. CrushPress.AI said the category included ChatGPT, Microsoft Copilot, Google AI Mode and Amazon Alexa for Shopping, formerly known as Rufus. OpenAI’s target, by contrast, was presented as a company advertising goal without an equivalent geographic or product-boundary definition in the supplied article.

    That makes the comparison useful as a stress test, but not a definitive like-for-like verdict. OpenAI could be assuming revenue from markets outside the United States, advertising products that extend beyond a narrow standalone-chatbot definition, or commercial experiences that Emarketer classifies elsewhere. The source does not establish that those possibilities are included, so they should be treated as potential explanations rather than facts.

    The reverse caution also applies. A broader addressable market does not automatically produce broader revenue. OpenAI would still need to turn that potential into inventory advertisers value, demand they are willing to fund and outcomes they can evaluate.

    What would have to be true for the target to work

    A central conversational portal connects to an audience, a storefront, a measurement gauge and a privacy shield.

    CrushPress.AI described OpenAI’s forecast as resting on several ambitious assumptions: capturing search-advertising budgets at scale, leading a mature chatbot-ad market and outperforming previous advertising formats. Each assumption represents a separate economic hurdle.

    • Budget transfer: Advertisers would need to treat conversational placements as a meaningful destination for money currently assigned to established channels, rather than merely adding small experimental budgets.
    • Commercial intent: ChatGPT usage would need to produce enough moments in which an ad is relevant to a purchase or business decision. High overall usage alone does not establish high-value advertising inventory.
    • Pricing power: Advertisers would need evidence that chatbot placements generate sufficient value to support attractive prices. That normally depends on relevance, scarcity, audience quality and demonstrated outcomes.
    • Measurement: The format would need dependable ways to distinguish exposure, influence and conversion. Conversational journeys can complicate familiar attribution models because an answer may inform a decision without producing an immediate click.
    • User acceptance: Commercial messages would have to coexist with useful answers without weakening confidence in the product. If monetization reduces engagement, additional ad load can undermine the inventory it was intended to create.

    These conditions are connected. Strong purchase intent can improve pricing, credible measurement can accelerate budget movement, and user trust can protect continued engagement. Weakness in any one of them can constrain the others.

    How advertisers should interpret the opportunity

    The reported forecasts do not support treating chatbot advertising as either a guaranteed successor to search advertising or an irrelevant niche. They support a staged approach in which advertisers evaluate the channel based on observed behavior rather than the platform owner’s long-range target.

    Early assessments should distinguish inventory volume from inventory quality. Useful indicators would include whether placements appear during commercially relevant conversations, how clearly sponsored material is identified, what controls advertisers receive and which outcomes can be measured. Comparisons with paid search or other performance channels should use consistent conversion definitions and time horizons.

    The most informative signal will be whether chatbot advertising develops incremental demand of its own or primarily redistributes existing digital-ad budgets. OpenAI’s reported goal appears to require a market much larger than Emarketer’s defined U.S. category, making the eventual boundaries of the product and the source of advertiser spending central to the economics.

    As testing develops, the debate should become less dependent on top-down forecasts and more grounded in observable pricing, advertiser retention, measurable commercial outcomes and the effect of ads on user behavior.

    References

  • Multimodal SEO for a Search Journey Built Around Images

    Multimodal SEO for a Search Journey Built Around Images

    Visual discovery is becoming a journey rather than a single search feature. People can encounter an idea in an image gallery, inspect it through a social video, refine it with a multimodal query and, in some cases, ask an AI search experience to generate a new visual without visiting a publisher.

    For search teams, the practical challenge is therefore larger than image optimization. Multimodal SEO must make pages, media, structured data and distributed brand profiles easy for machines to interpret and useful enough for people to continue exploring.

    Visual discovery is moving ahead of the conventional query

    Two reported Google changes illustrate how the opening stage of search may be changing. The Google Images redesign article describes a personalized, browseable homepage built around an immersive gallery rather than the service’s historically dominant search box. Search by text, voice or image reportedly remains available, but browsing, saving and returning to visual collections become more prominent parts of the experience.

    That distinction matters because a gallery can create demand before a person has formulated a precise query. Instead of asking for a known object, destination or style, a user can move among related images and gradually clarify an interest. Saved collections can also extend that process across sessions. In this environment, relevance is not limited to matching a typed phrase; an asset must also be suitable for recommendation, visual comparison and thematic grouping.

    The travel SEO source reports a parallel pattern in a commercially important category. It describes search results in which hotel tools, prices, maps, advertisements, directory modules and social videos can appear before a conventional organic listing. For discovery-oriented travel searches, it also reports short-form material from TikTok, Instagram and YouTube appearing within Google’s results. The Images report focuses on Google’s own gallery, while the travel analysis focuses on blended search surfaces, but together they point to the same strategic shift: discovery can happen through a sequence of visual modules without beginning or ending on a brand website.

    This does not make the website irrelevant. It changes its role. A site becomes one authoritative node in a larger system that may include image results, business listings, social profiles, video platforms, structured feeds and AI-generated answers.

    Multimodal visibility depends on interpretable page structure

    A layered webpage illustration connects images, video, page sections, and metadata-like nodes with luminous lines.

    Image quality alone cannot explain how a machine should understand a visually complex page. The visual-semantics source argues that document meaning is communicated through layout, hierarchy and function as well as text. Cards, calculators, comparison modules, tables, filters and buttons establish relationships that may not be expressed in an ordinary paragraph. A price beside one hotel image, for example, must not be confused with the price attached to an adjacent property.

    The source connects this problem to research and patents involving vision-based page segmentation, HTML-aware processing, structured information cards and layout-aware document understanding. These materials do not establish that every described method is a current ranking system. They do, however, illustrate the underlying retrieval problem: a search engine needs boundaries that reveal which labels, values, images and actions belong together.

    This makes multimodal SEO partly an information-architecture discipline. Semantic HTML, coherent component boundaries, descriptive headings and clear associations among captions, controls and media help define the meaning of a region. The objective is not decorative polish for its own sake. It is a page whose visible and structural hierarchies agree about the primary purpose.

    The same source discusses Google’s concept of a “centerpiece annotation” as a way of identifying primary content. It also reports a large programmatic case study in which a calculator was moved from the bottom of a page to the top and made visually prominent as part of 19 changes. Across more than 100,000 pages, the source reported clicks rising from 3.47 million to 4.53 million and impressions from 84.1 million to 167 million after the broader update. The author explicitly cautioned that the effect of the calculator could not be isolated perfectly, so the result should be treated as directional evidence rather than a controlled proof.

    The more transferable lesson is that a page’s principal utility should be easy to locate and extract. The travel analysis reaches a compatible conclusion from a different angle: concise entries, interactive maps and clearly separated itinerary, cost and timing information can serve fragmented user needs more directly than a long, undifferentiated guide. Both sources support designing content in meaningful modules, although neither justifies fragmenting a page merely to manufacture more components.

    Search assets now extend beyond images and webpages

    A multimodal strategy has to distinguish between assets a brand controls and experiences a platform assembles. On the controlled side are original images, page modules, video, structured data, inventory feeds and profile information. On the assembled side are galleries, carousels, maps, AI summaries and other interfaces that decide how those inputs are combined.

    The travel source makes this distinction concrete. It recommends treating real-time accommodation prices, availability, inventory, taxes and fees in Google Hotel Center as essential search infrastructure. It likewise emphasizes accurate Google Business Profile categories, amenities, location information and other attributes. Its argument is that visibility for a filtered request can depend on structured facts, review sentiment and geographic information, not persuasive destination copy alone.

    The same analysis treats social profiles as distributed landing pages because travelers may use public videos and posts for reassurance without reaching the primary domain. That approach implies consistent branding and factual context across each asset: the subject should be recognizable, the location should be unambiguous and the account should connect visibly to the business or entity it represents. The source also reports that Google Search Console introduced social and video content analytics, reinforcing the need to evaluate search exposure beyond conventional webpage clicks.

    Google’s reported addition of text-to-image generation inside AI Overviews introduces a different kind of competition. According to the source, the feature uses Google’s Nano Banana model to create a custom image from a prompt and was announced for English-language rollout in regions supporting image creation in AI Mode. Because the source describes an announced rollout rather than a mature outcome study, its traffic implications remain uncertain.

    Even so, the strategic tension is clear. A gallery can recommend an existing publisher image, while a generative interface can satisfy some visual needs by producing a new one. Publishers therefore cannot rely solely on being the nearest aesthetic match to a prompt. Assets gain defensibility when they carry information or evidence that generation cannot simply substitute: an original product view, a documented location, a useful comparison, a demonstration, a current inventory state or a recognizable brand perspective.

    A practical model for multimodal SEO

    Multiple cameras capture an object while connected image, video, three-dimensional, augmented-reality, and synthetic visual assets branch outward.

    A useful audit can examine four connected properties: findability, interpretability, usefulness and continuity. Findability asks whether important media and data are available to search systems through crawlable pages, supported feeds and public profiles. Interpretability asks whether the entity, subject, location and relationships among page elements are clear. Usefulness asks whether the asset helps someone compare, decide or act. Continuity asks whether the same facts and identity remain consistent as the journey moves between the website, image search, maps, social platforms and AI interfaces.

    At the page level, the audit should begin with the centerpiece. The principal image, tool or answer should align with the page title and visible heading, while unrelated navigation and promotional elements should not interrupt its meaning. Each repeated card or listing needs a stable internal structure so that its name, image, attributes, price and action remain associated. Mobile presentation deserves particular attention because a component that appears coherent on a wide screen can become ambiguous when its elements stack.

    At the asset level, optimization should preserve factual context rather than reducing every image to a keyword target. Descriptive surrounding copy, captions where they help readers, meaningful file handling and accessible alternatives all contribute to understanding. Originality should also have a purpose: a distinctive visual is more valuable when it demonstrates something, documents something or makes a decision easier.

    At the ecosystem level, the canonical business facts should agree across the site, feeds, profiles and public media. Measurement should then separate exposure from destination traffic. Search impressions and clicks remain useful, but they do not capture every discovery touchpoint described in the sources. Teams also need to watch the visibility of visual assets, engagement with off-site content, feed accuracy and the actions users take after arriving. Because the reported interfaces can satisfy needs within Google, a fall in click-through rate does not automatically reveal whether visibility, demand or commercial outcomes have weakened.

    Key takeaways

    • Visual discovery can begin with browsing and recommendation before a user enters a fully formed query.
    • Multimodal SEO includes layout, component boundaries and structured relationships, not just image files and alternative text.
    • Feeds, business profiles and social accounts can function as search assets alongside the primary website.
    • Generative images may reduce some visits for generic visual needs, increasing the value of original, factual and decision-supporting media.
    • Performance measurement should connect cross-surface exposure with user actions and business outcomes instead of relying on webpage clicks alone.

    The next advantage will come from connecting disciplines that are often managed separately: technical SEO, visual production, interface design, structured data, social distribution and analytics. As search becomes more capable of browsing, interpreting and generating visuals, the strongest assets will be those that retain clear meaning wherever the journey encounters them.

    References

  • Why AI Assistant Usage Follows Different Daily Rhythms

    Why AI Assistant Usage Follows Different Daily Rhythms

    AI assistants may be software, but the people using them still follow schedules. That creates patterns in when AI tools attract attention, answer questions, and influence decisions.

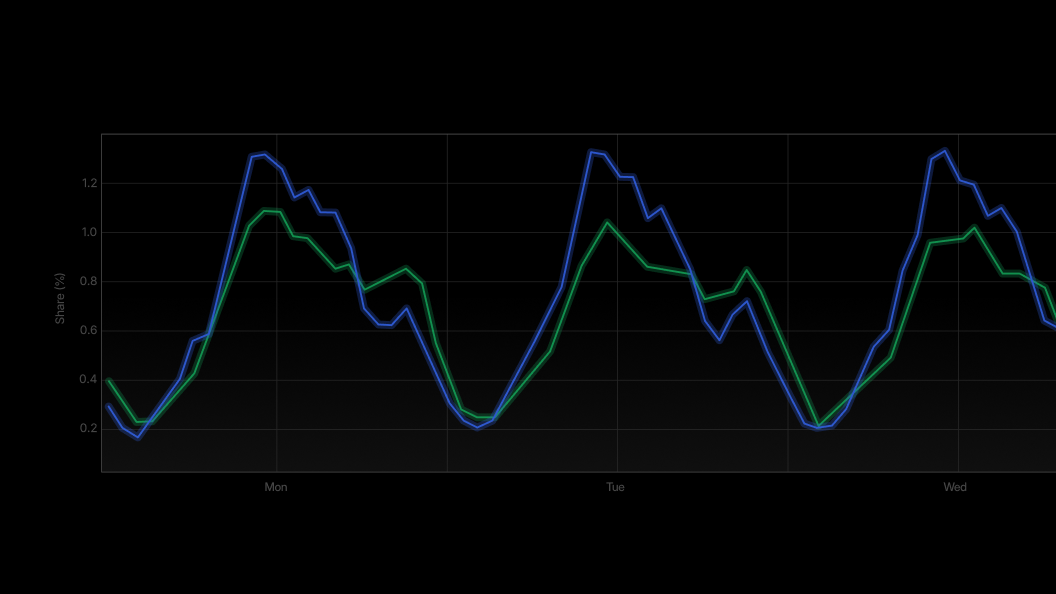
    Try Profound Blog offers one central observation: every AI assistant has a daily and weekly rhythm, but that rhythm varies by platform, region, and user. The source does not provide supporting measurements, so the useful takeaway is a framework for investigation rather than a universal timetable.

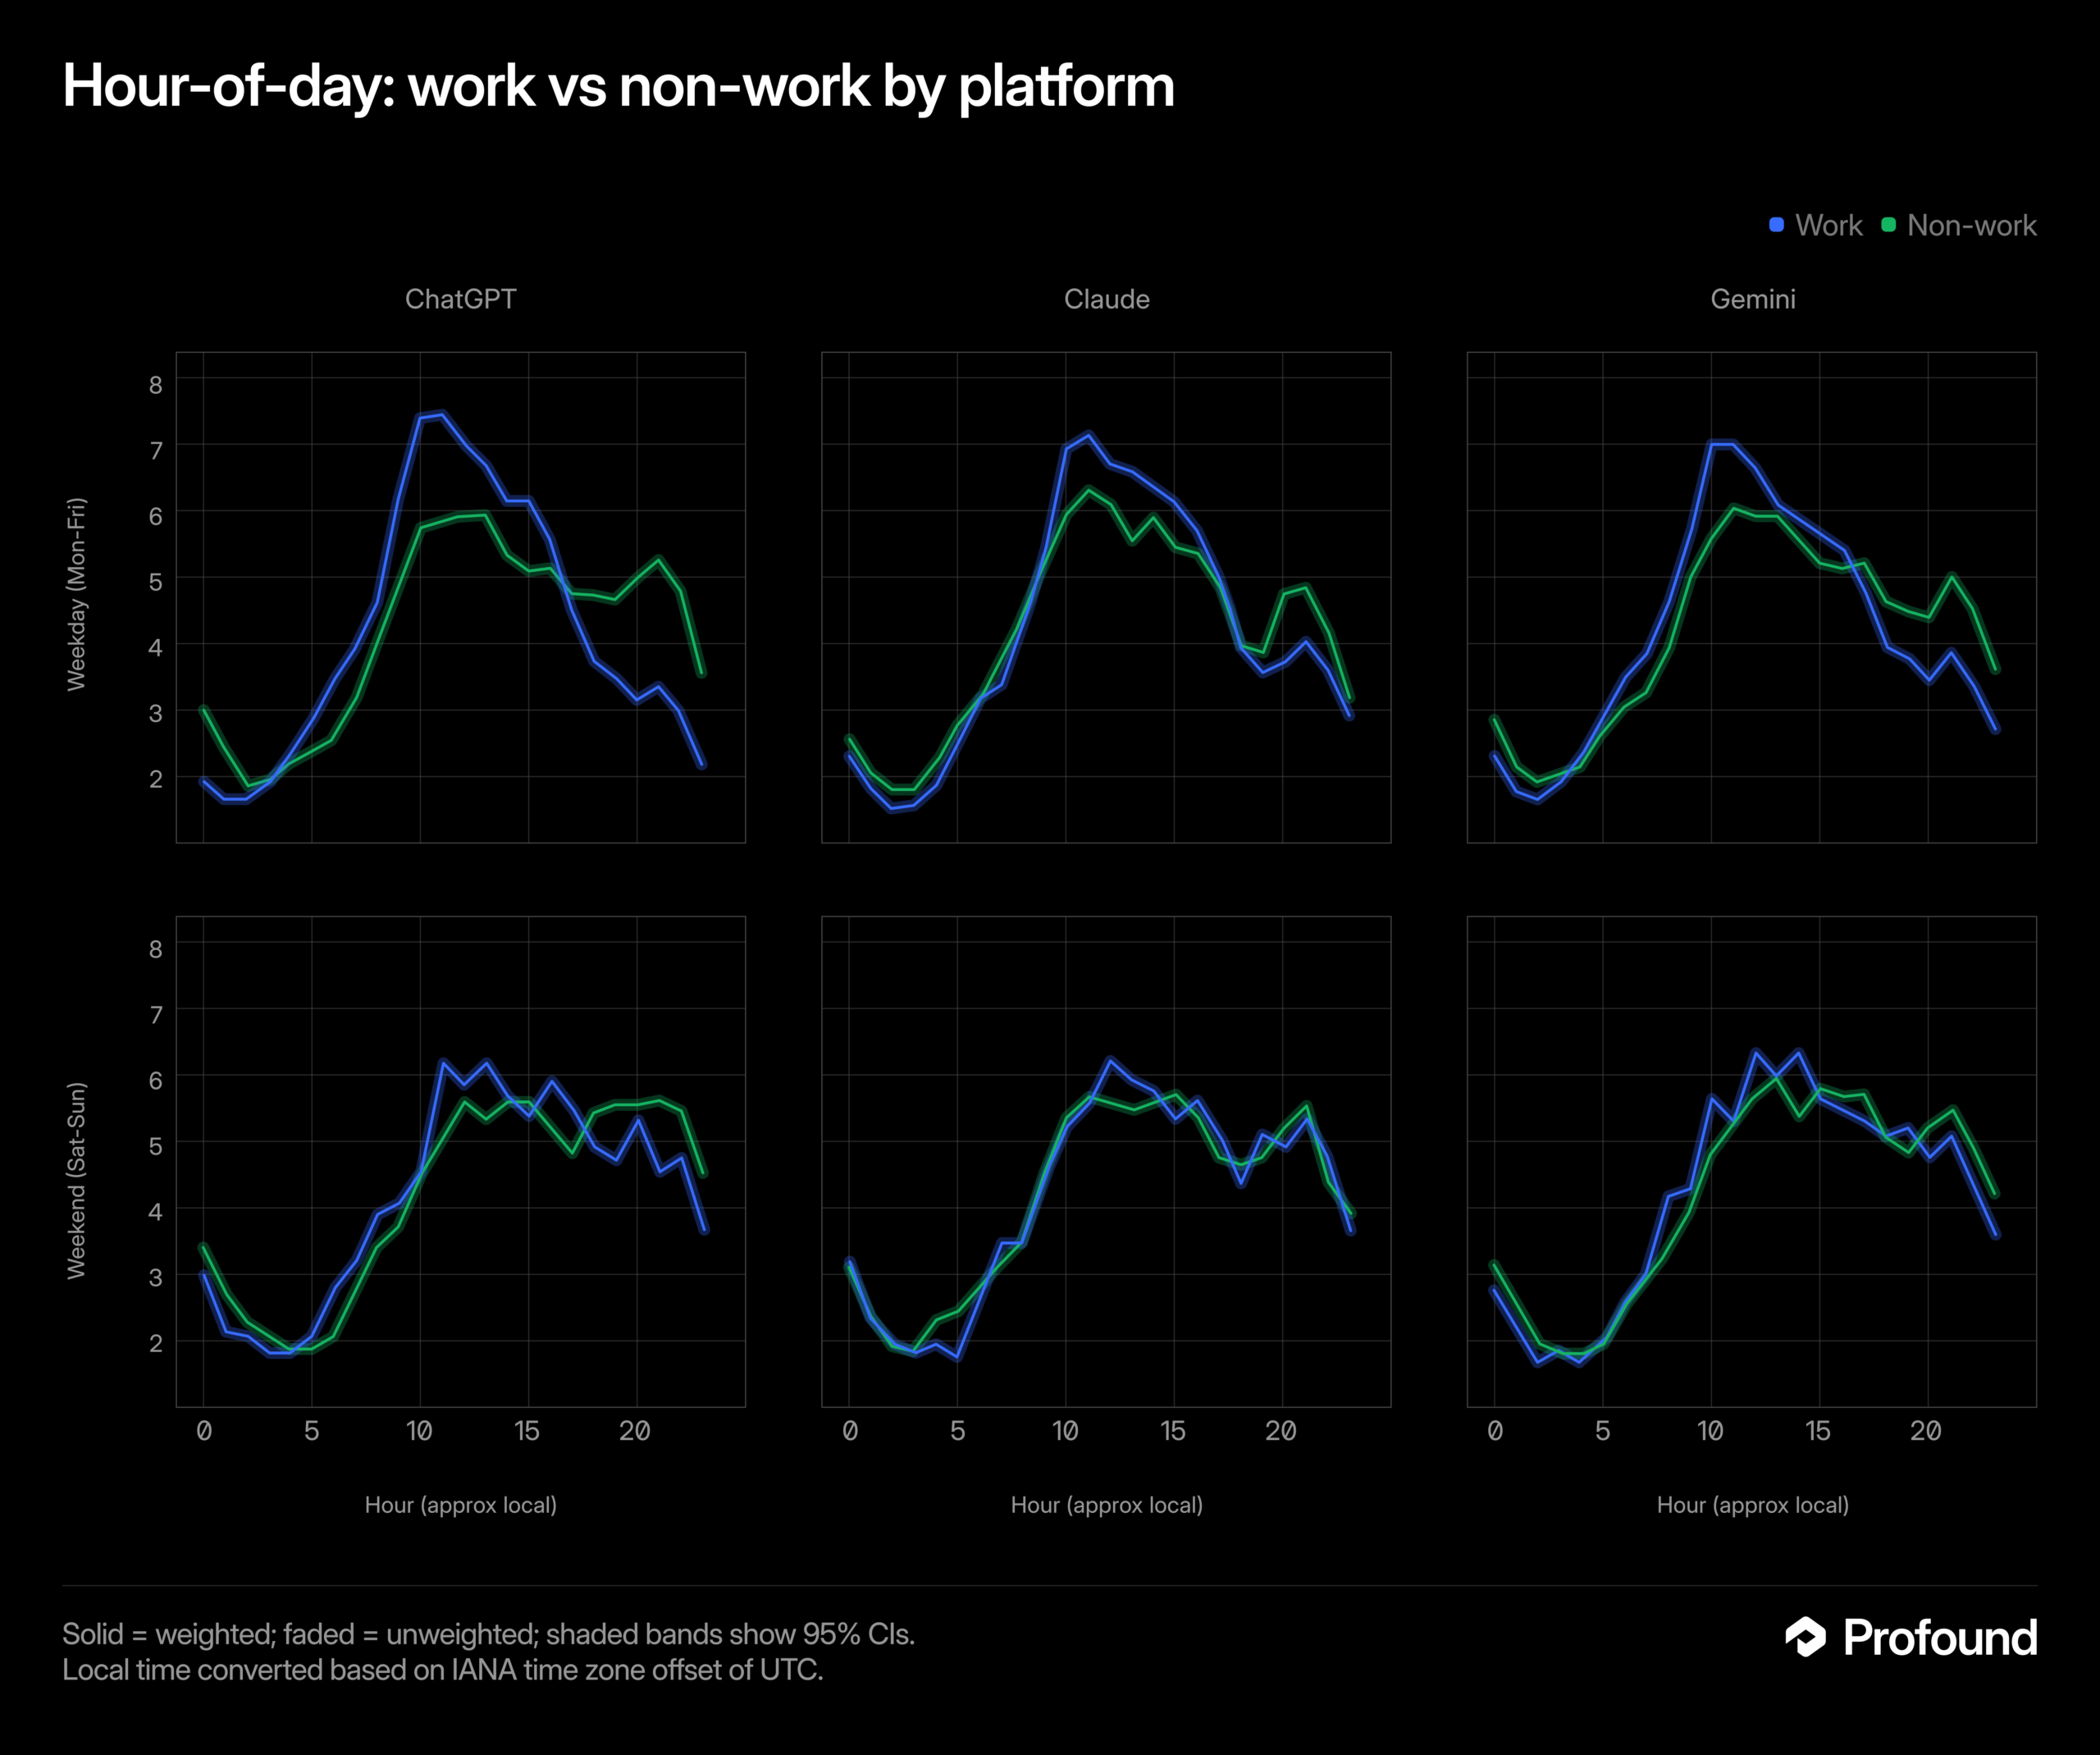
    Six line charts compare work and non-work hourly patterns for ChatGPT, Claude, and Gemini on weekdays and weekends.
    Blue work and green non-work lines show hourly patterns for ChatGPT, Claude, and Gemini, split into weekday and weekend rows, with most curves highest around late morning to afternoon.

    The rhythm belongs to usage, not the assistant

    An AI system does not begin a workday in the human sense. Any apparent schedule is more likely to reflect when people open a platform, what they use it for, and how it fits into their routines.

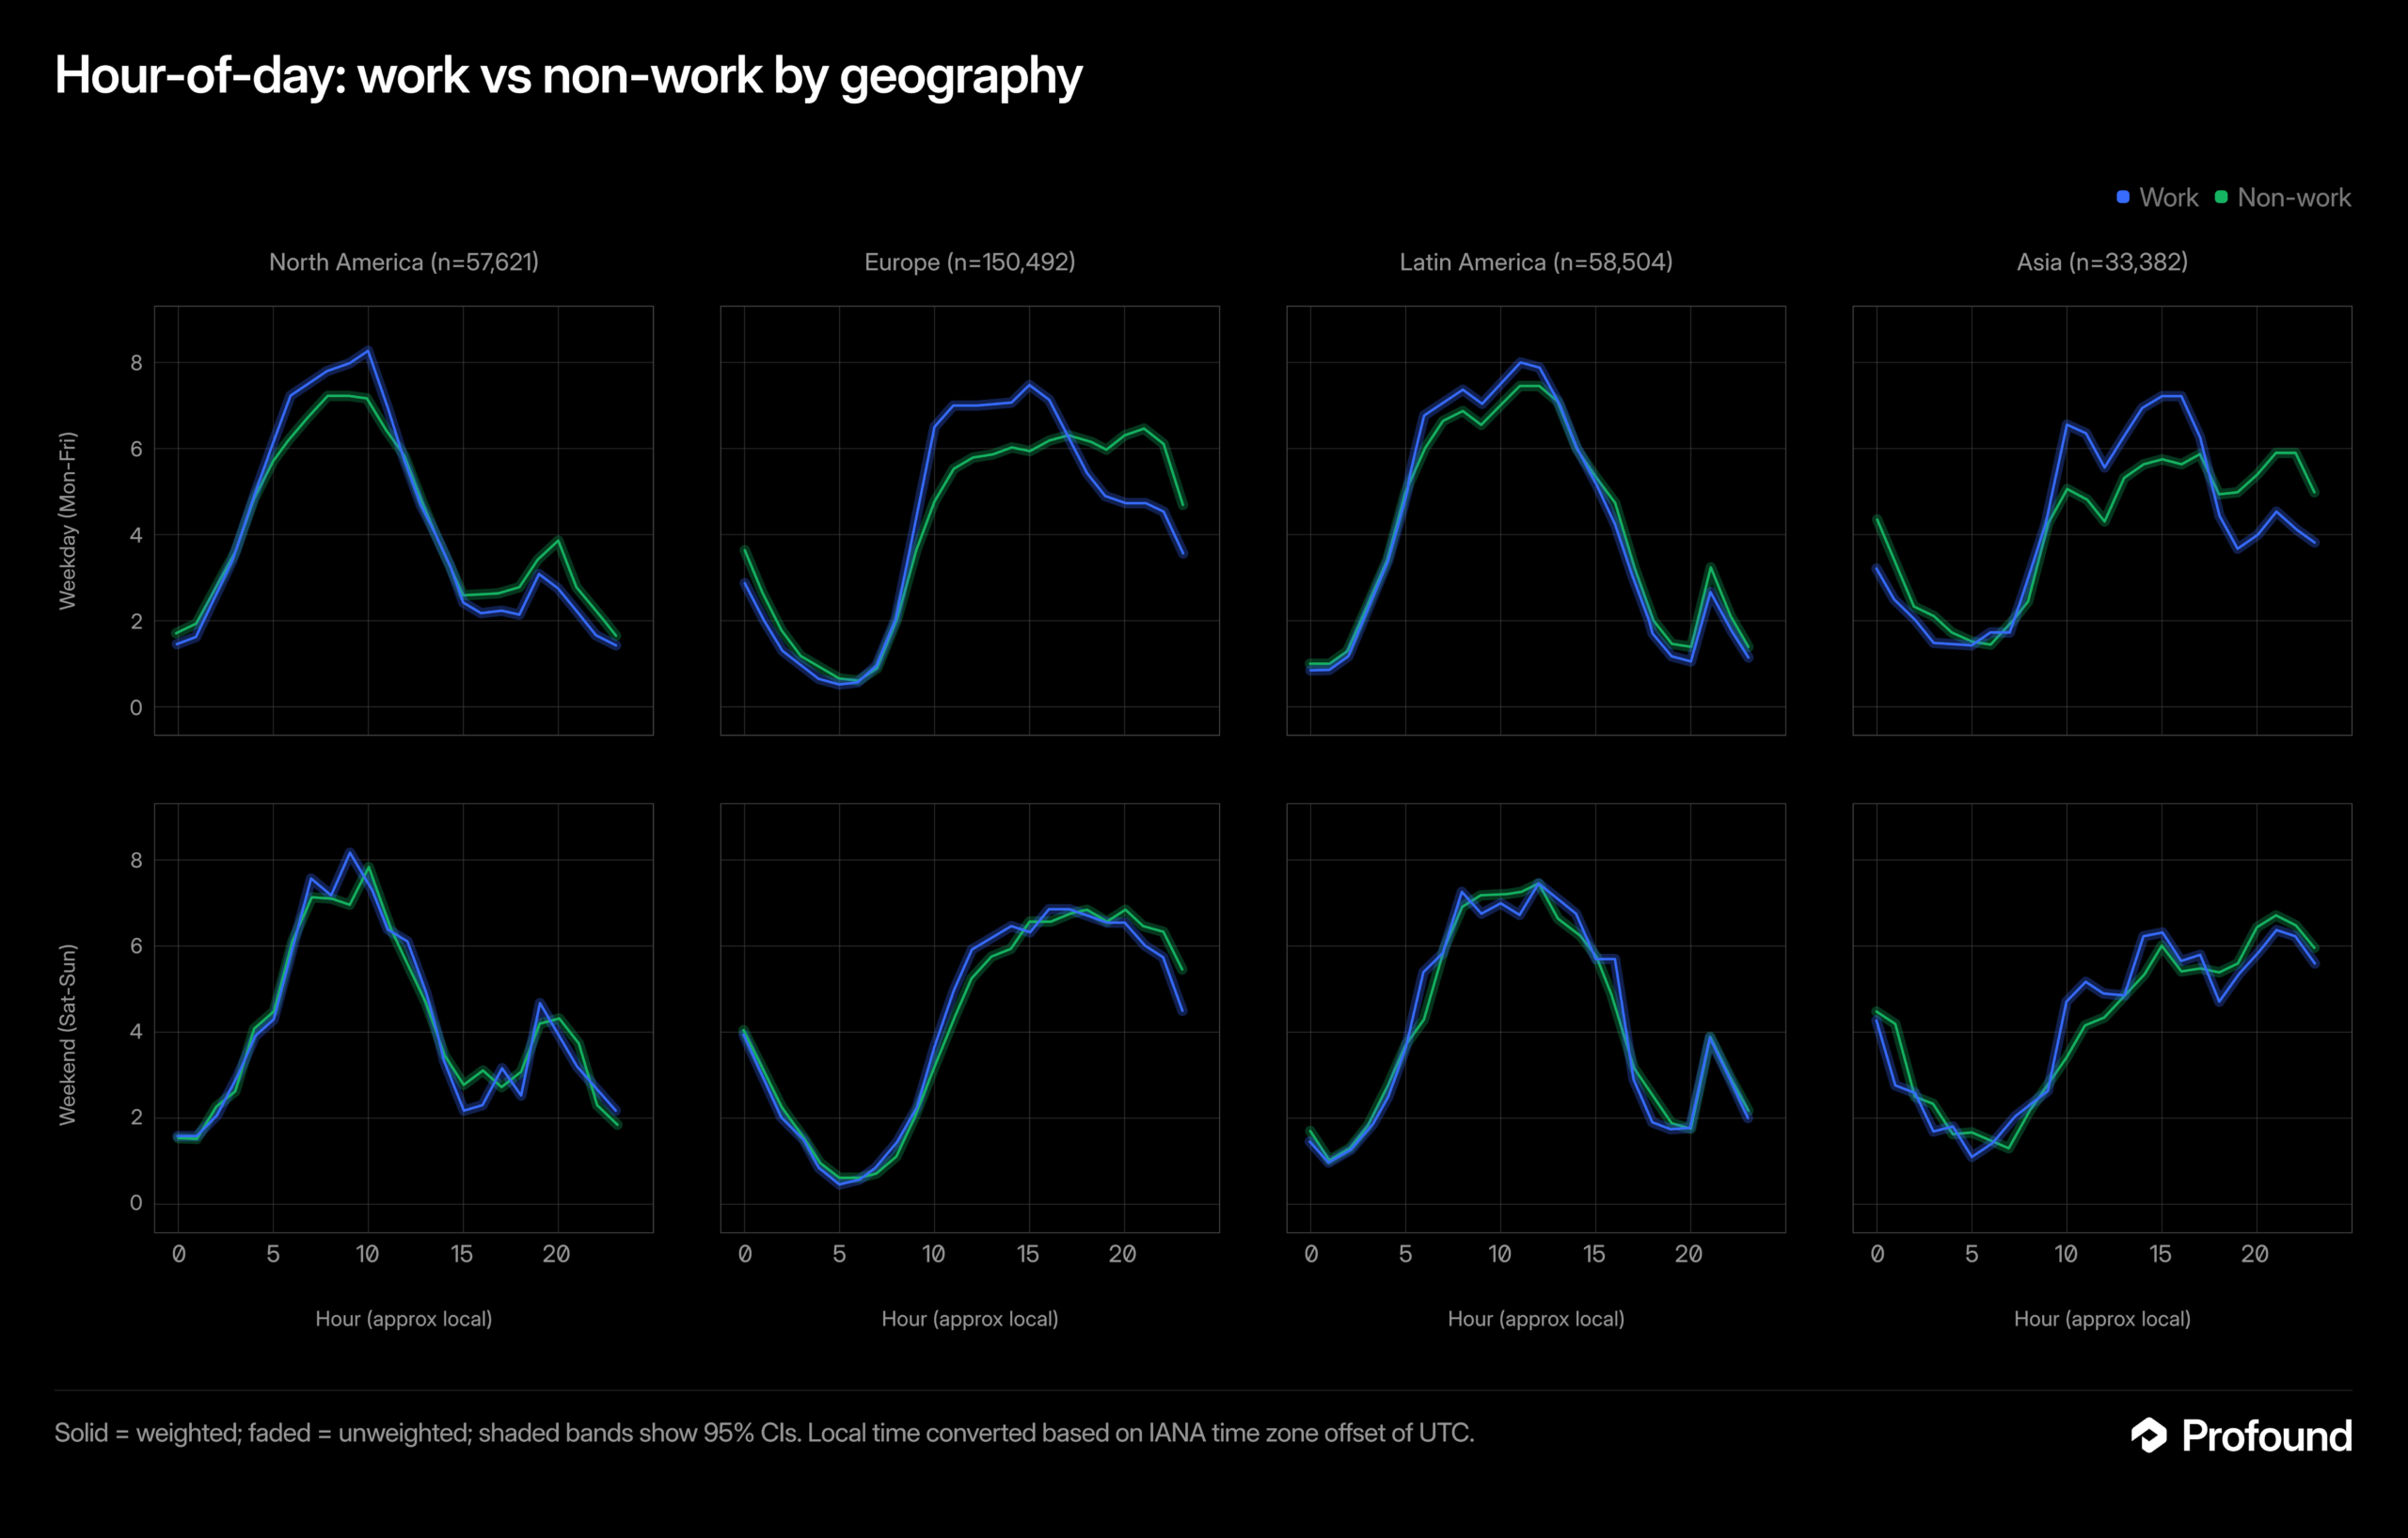
    Eight line charts compare hourly work and non-work patterns across four regions on weekdays and weekends.
    Blue work and green non-work lines trace hour-of-day patterns for North America, Europe, Latin America and Asia, split into weekday and weekend rows.

    A tool associated with professional tasks may see a different pattern from one used for personal questions. The distinction matters because a broad label such as “AI traffic” can hide meaningful differences among audiences and use cases.

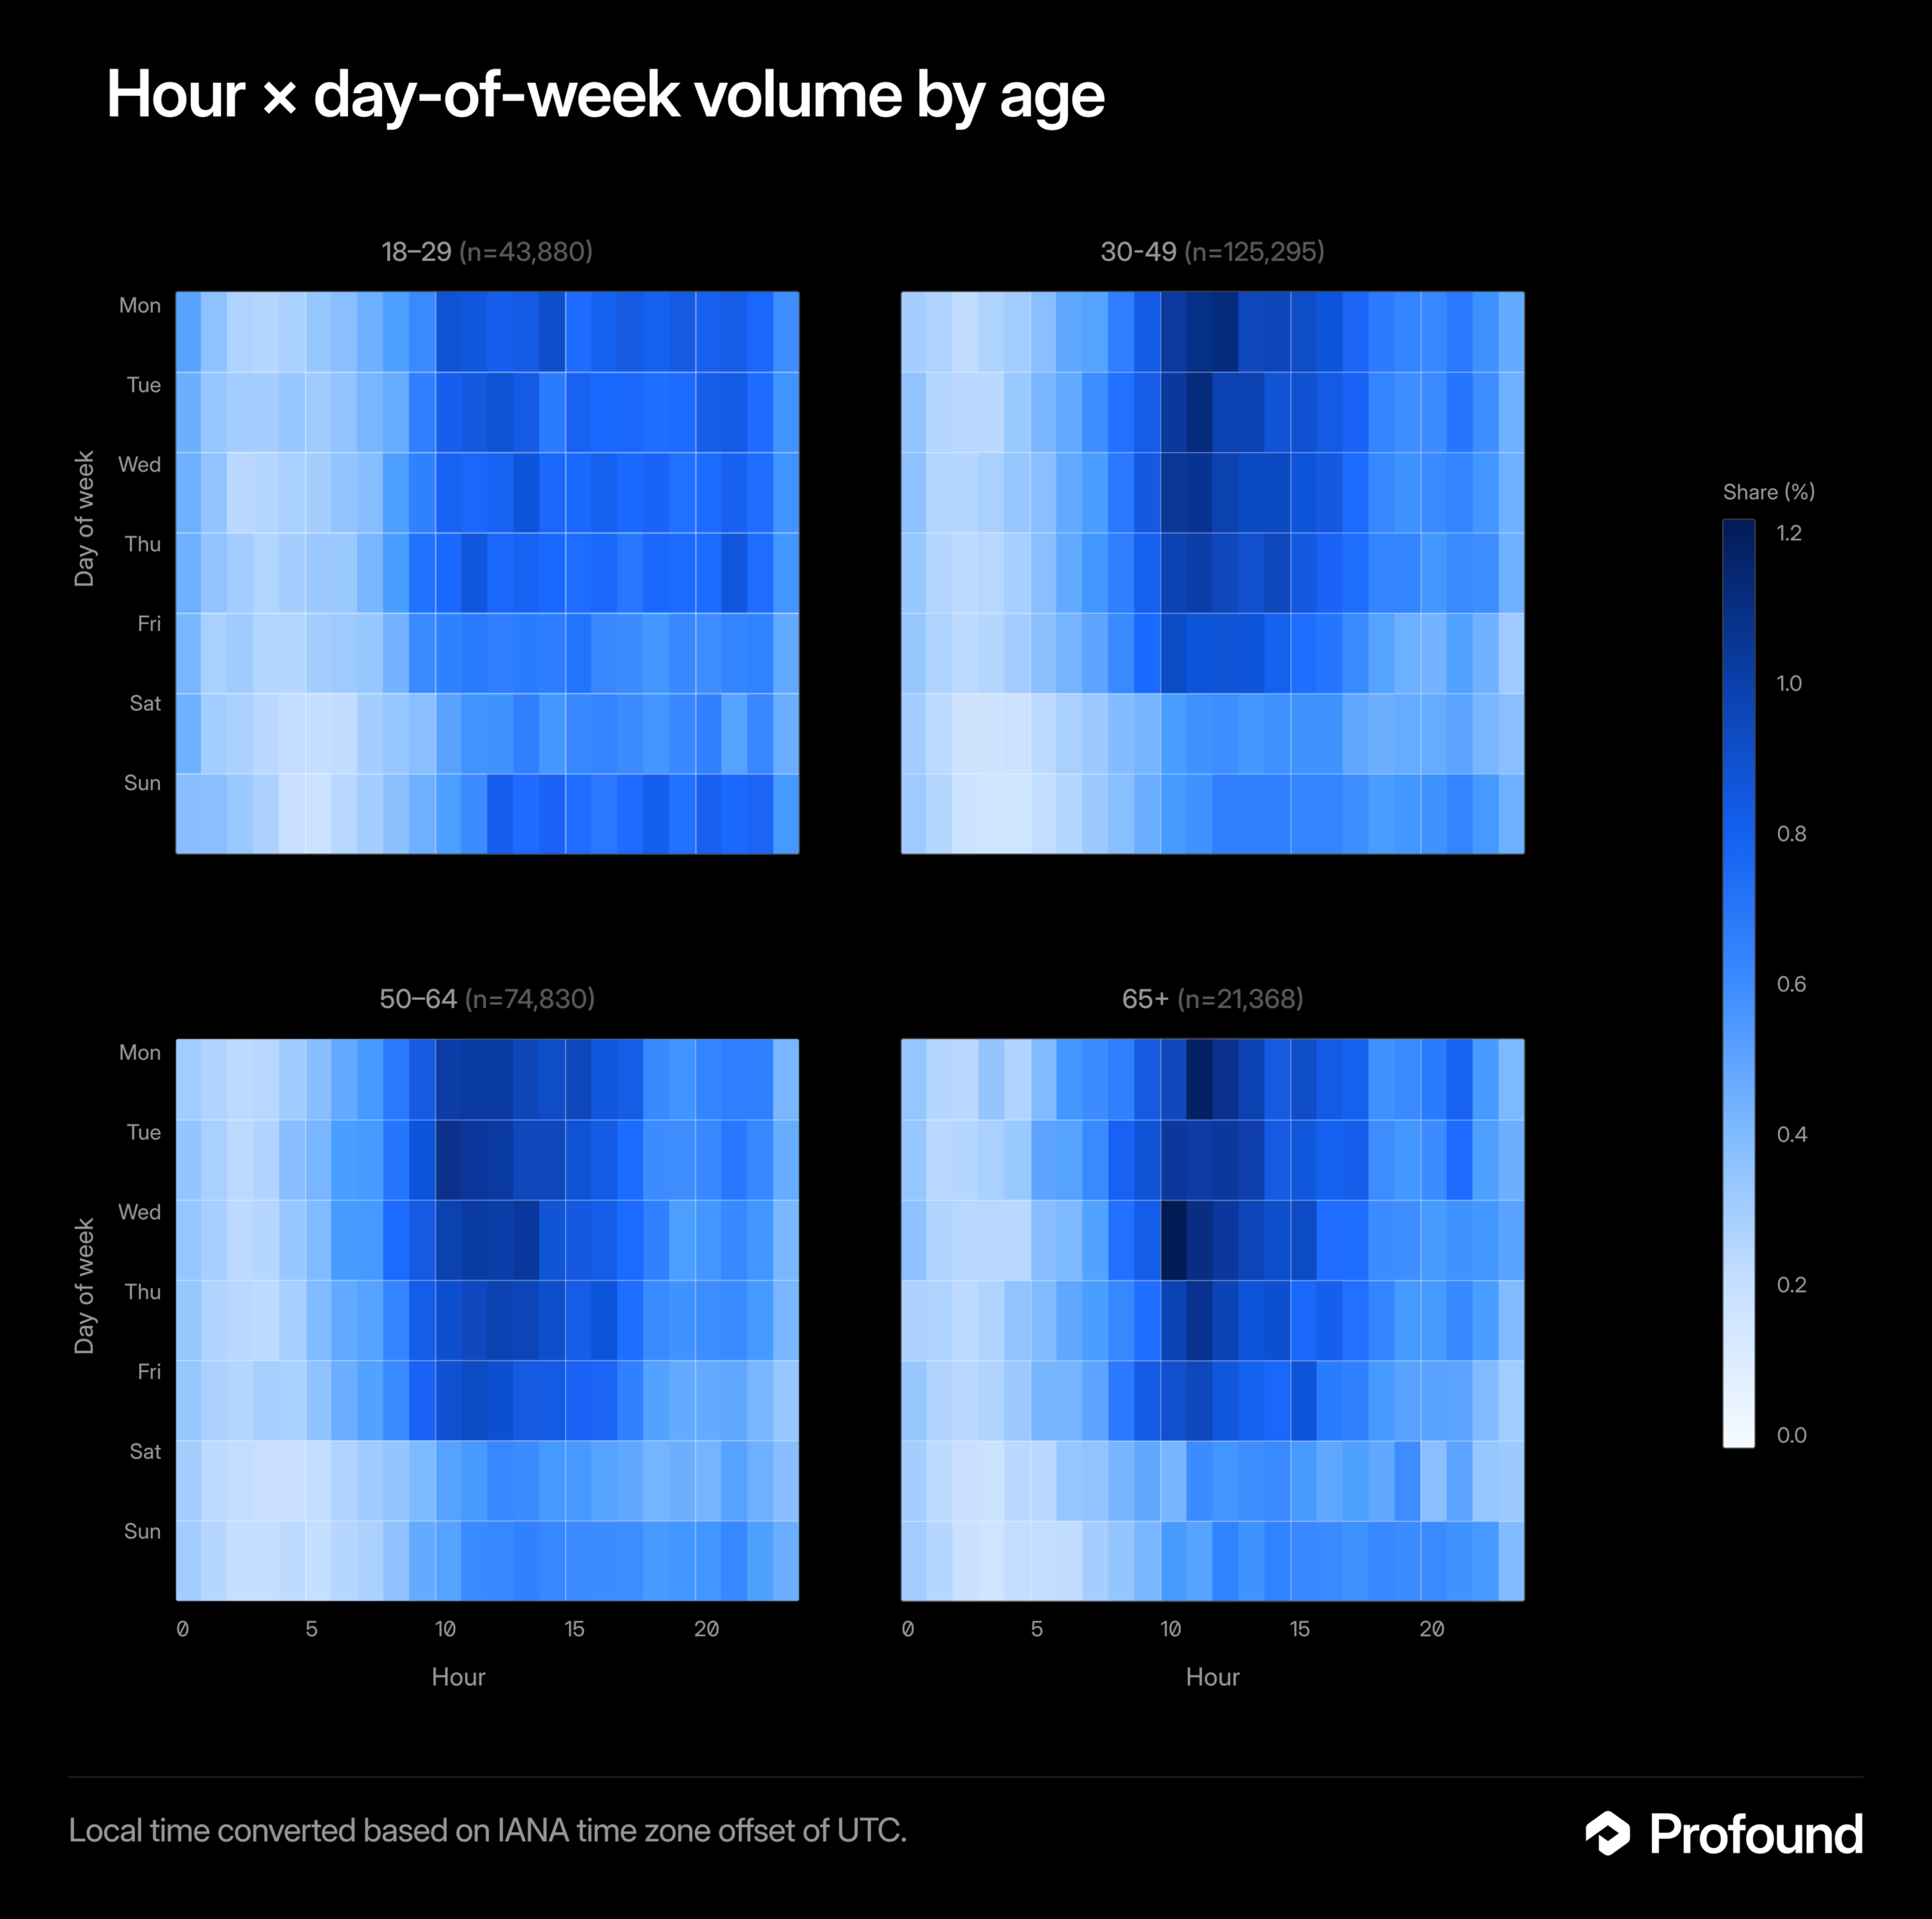
    Four blue heatmaps compare hourly, weekday volume shares across age groups from 18-29 to 65+.
    Four heatmaps plot share by hour and day of week for ages 18-29, 30-49, 50-64 and 65+, with the darkest weekday bands around late morning.

    Why one schedule cannot describe every audience

    The source specifically cautions that timing is not consistent across platforms, regions, or users. Each dimension can change how an observed pattern should be interpreted:

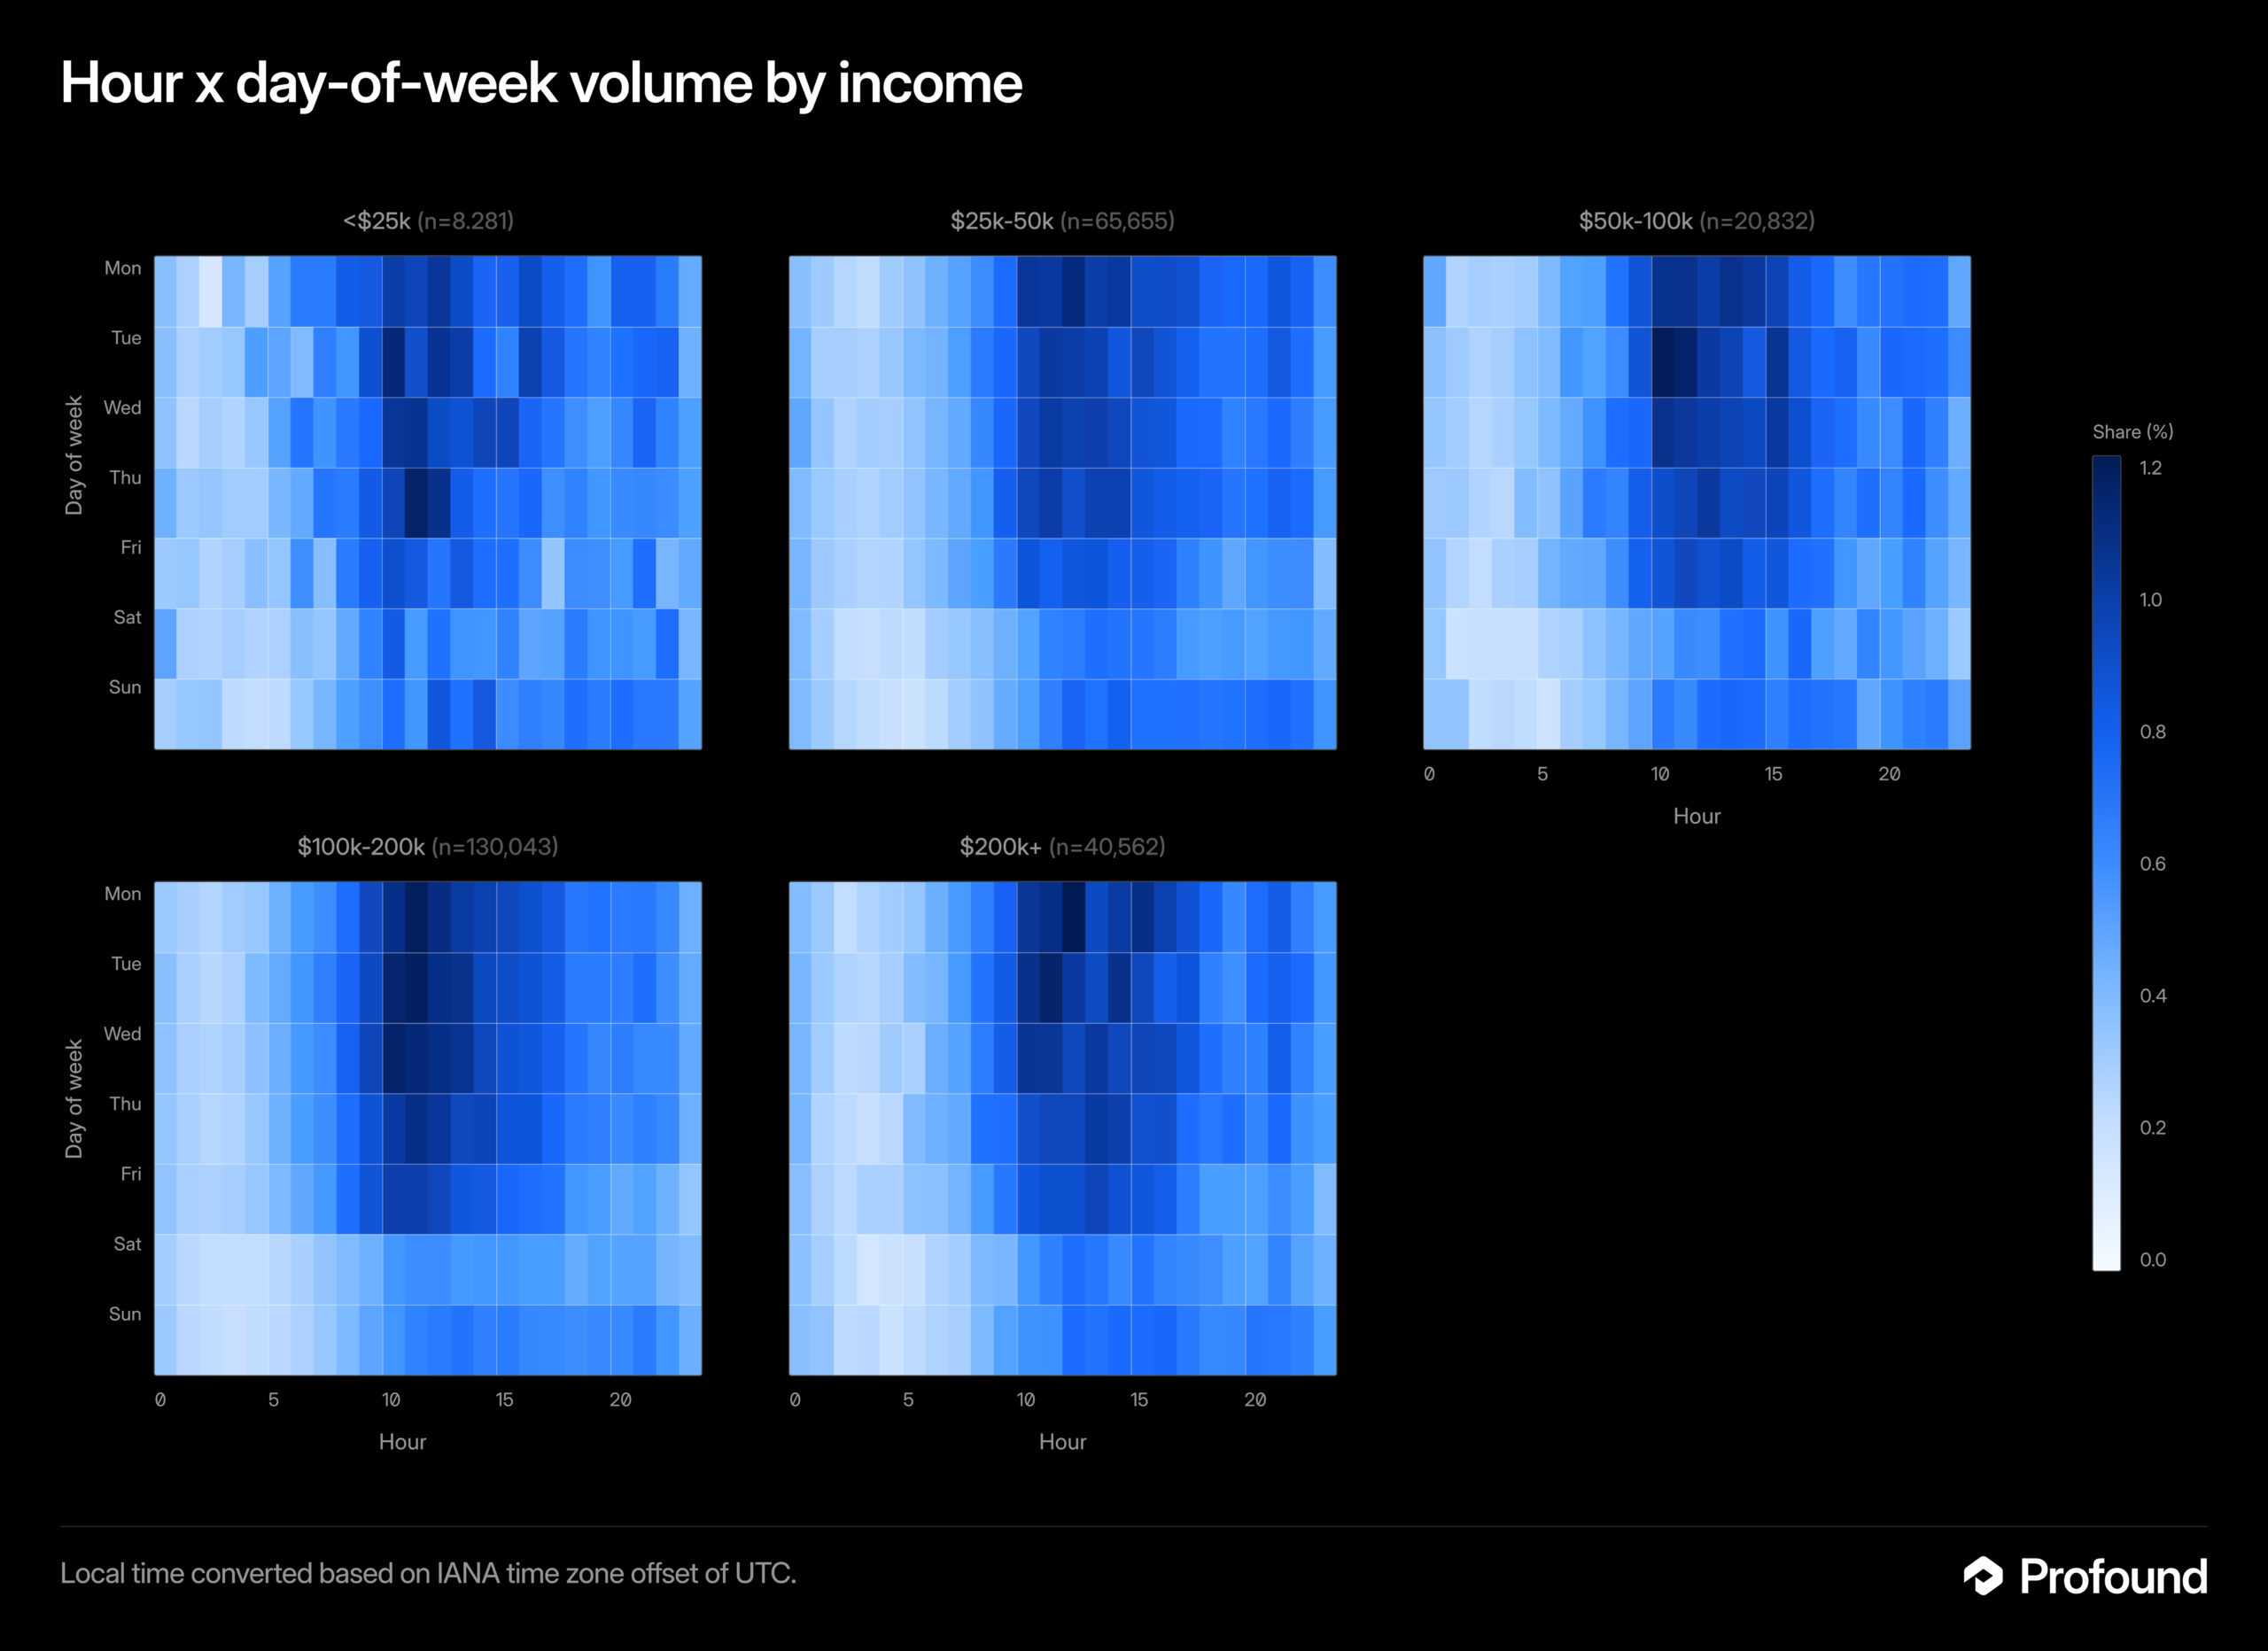
    Five heatmaps compare hourly, weekday volume shares across income brackets from under $25k to $200k+.
    The five blue heatmaps show share percentages by hour and day of week for income groups, with many darker cells appearing from late morning through afternoon.
    • Platform: Different products can serve different purposes and attract different usage habits.
    • Region: Local time, working patterns, and audience location can shift periods of activity.
    • User: Individual needs determine whether an assistant is used for work, study, research, planning, or another task.

    These variables make a single global “best time” an unreliable assumption. A pattern found in one segment should not automatically be applied to another.

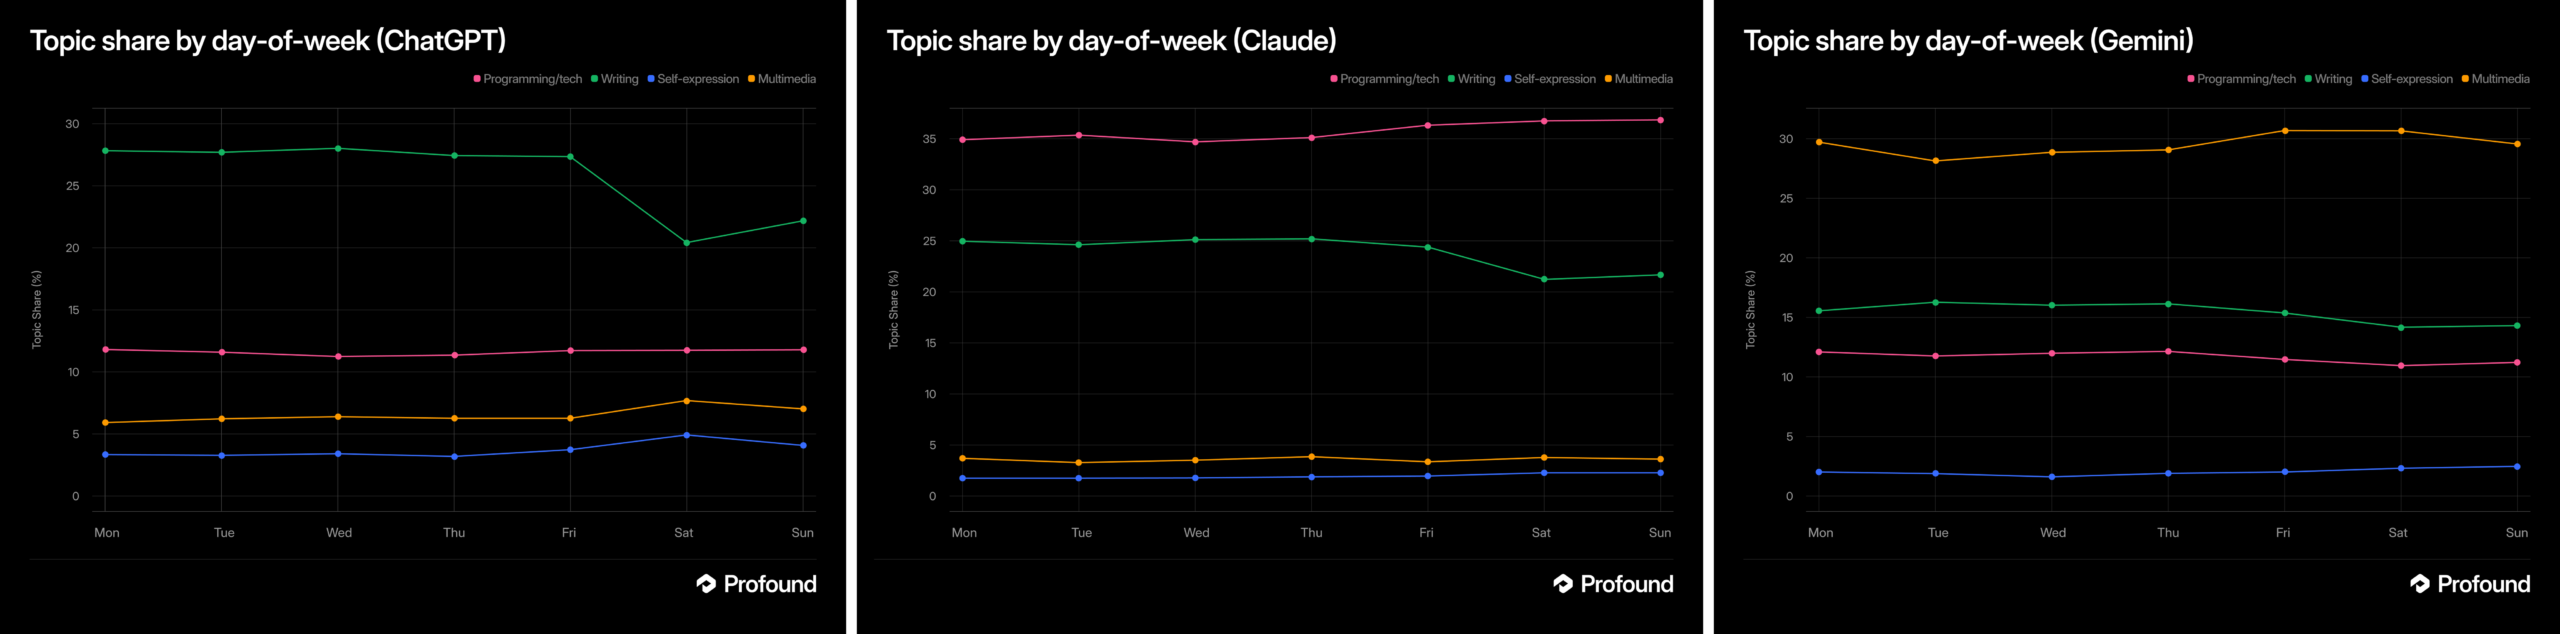
    Three line charts compare topic share by weekday for ChatGPT, Claude, and Gemini across four categories.
    Side-by-side weekday charts show writing highest for ChatGPT, programming/tech highest for Claude, and multimedia highest for Gemini, with weekend shifts.

    Key takeaways

    • AI assistant activity can form recurring daily and weekly patterns.
    • Those patterns may differ across platforms, regions, and individual users.
    • Timing should be evaluated within a defined audience and use case.
    • The source states the principle but does not supply data for specific hours or days.

    How teams can evaluate timing responsibly

    For marketers, publishers, and product teams, the practical response is to examine their own evidence. Analysis should begin with a clear question: which platform, audience, region, and outcome are being measured?

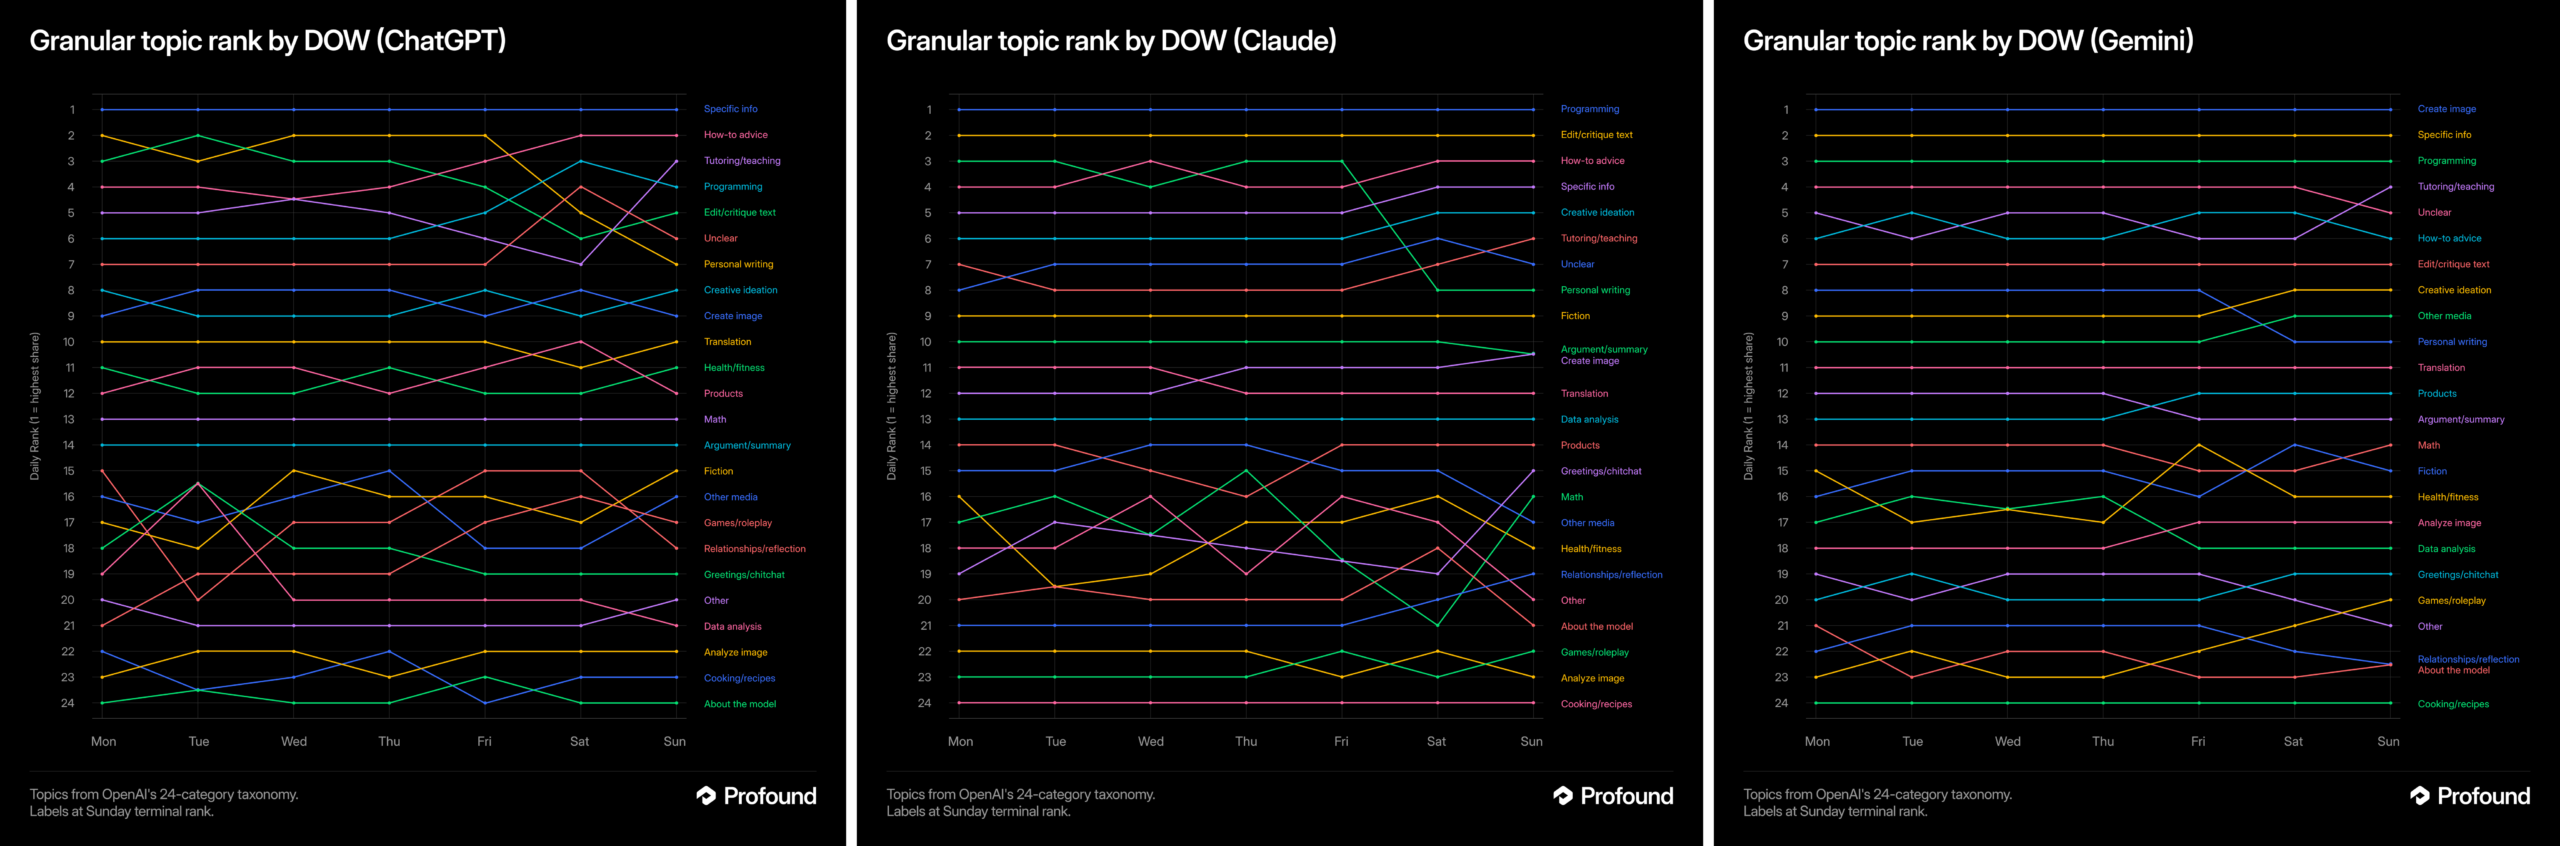
    Three dark line charts compare 24 topic rankings by day of week for ChatGPT, Claude, and Gemini.
    Side-by-side charts titled "Granular topic rank by DOW" trace colored topic rankings from Monday through Sunday for ChatGPT, Claude, and Gemini.

    Teams can then compare consistent time periods, use the relevant local time zone, and separate audience segments where possible. They should also distinguish between activity and impact. A busy period does not necessarily produce the most valuable visits, recommendations, conversions, or customer outcomes.

    Any apparent rhythm should be treated as a working pattern rather than a permanent rule. User behavior, product design, and the mix of use cases can change, so conclusions need periodic review.

    What the source does not establish

    Try Profound Blog does not identify peak hours, preferred weekdays, regional differences, or platform-specific results in the supplied material. It also does not describe a study or methodology. Claims about exact schedules would therefore go beyond the available evidence.

    The defensible conclusion is narrower: AI usage has timing patterns, and context determines what those patterns mean. Organizations that want actionable answers will need to measure the audiences and outcomes that matter to them.


    Inspired by this post on Try Profound Blog.


    crushpress.ai community screenshot
  • Brand Visibility in AI Search Depends on Source Trust

    Brand Visibility in AI Search Depends on Source Trust

    Brand visibility in AI search is not simply a matter of ranking highly or publishing more content. It depends on whether an AI system can find credible sources that mention the brand, support relevant claims and provide enough context to construct an answer.

    The source material points to a practical shift: brands must manage a portfolio of evidence rather than optimize for one universal result. Audience relevance, model-specific citation preferences, factual accuracy, freshness and platform-hosted business data can all influence which version of a brand appears.

    Source trust has become a distribution layer

    Traditional search encouraged brands to think primarily about pages and positions. Generative systems add another layer because they assemble answers from selected sources. A brand can therefore be visible indirectly through a publisher, community, reference site, video platform, business profile or product panel even when its own website is not the principal destination.

    This helps reconcile several of the reports. research described by Search Engine Land argues that repeated associations across credible, niche-relevant channels can strengthen a brand’s entity authority. Separately, Profound’s comparison of Google AI products found that their visibility differences reflected which brands and supporting sources they selected, rather than a large difference in the number of brands mentioned per answer.

    Together, those findings suggest that AI visibility has at least two dimensions. The first is inclusion: whether the brand enters the system’s available evidence. The second is interpretation: whether the selected evidence supports an accurate and favorable description. A mention can help with the first while hurting the second if the underlying information is obsolete, ambiguous or false.

    Trust should therefore be treated as contextual rather than as a single score. A source can be influential because it is authoritative, closely aligned with an audience, frequently used by a particular AI product or embedded in a platform’s own information environment. None of the reports establishes a universal hierarchy that applies to every query and model.

    Audience relevance can outweigh headline reach

    A focused beam illuminates a small attentive audience while a broader faint beam spreads across a large distant crowd.

    The clearest challenge to reach-first media planning comes from the publisher-affinity study. According to the Search Engine Land account, the niche publishers examined achieved 1.7 times the audience affinity of major media outlets despite receiving 130 times less traffic. The reported analysis covered audiences in eight industries and used SparkToro affinity data alongside conventional metrics such as organic traffic, domain rating and referring domains.

    The implication is not that large publications have lost their value. The same report presents mainstream and specialist coverage as complementary: major outlets can deliver scale and broad validation, while focused publishers can establish stronger topical and audience associations. A sensible source portfolio uses each for the job it performs rather than treating traffic as a complete proxy for influence.

    This changes media selection. A placement should be assessed not only by how many people might encounter it, but also by who relies on the outlet, how precisely the outlet covers the subject and whether its coverage adds substantive evidence. A smaller trade publication may provide detailed category context that a general-interest mention cannot. Conversely, a major outlet may provide wider recognition that a specialist source cannot match.

    The same reasoning extends beyond publishers. The affinity research considered websites, YouTube channels, podcasts, social accounts and community-led platforms. That broader view is consistent with the model comparison, which reported citations from editorial, reference, social and user-generated sources. Brand authority in AI search is consequently better understood as a network of corroborating contexts than as the product of one prominent link.

    Visibility changes when the model changes

    Three translucent lenses use different source objects to cast varying levels of light on the same unbranded object.

    A source strategy cannot assume that Google’s generative products return interchangeable representations. Profound reported tracking 15,155 brand configurations daily in May 2026 and found a median eight-point gap between each brand’s best- and worst-performing Google model. Gemini, AI Overviews and AI Mode reportedly mentioned a similar number of brands per response, averaging between 4.4 and 5.0, but differed in the brands selected and the sources cited.

    In that dataset, Gemini leaned more heavily on editorial and reference sources, including Reddit, YouTube and Wikipedia. AI Overviews and AI Mode relied more on social and user-generated platforms and produced roughly twice Gemini’s citation depth per run. These are reported observations from one analysis, not proof of a permanent sourcing rule. They nevertheless show why a visibility score from one interface cannot stand in for the entire AI-search environment.

    AI Mode introduces an additional platform consideration. Profound reported that Google.com had become AI Mode’s second-most-cited domain, with Google Business Profiles and Product Knowledge Panels appearing inside answers. The report highlights particular consequences for local-intent searches and physical products: the decision journey may proceed through Google-hosted information before a user reaches the brand’s site.

    For measurement, the useful unit is therefore a query-model-source combination. Teams need to compare how different systems answer the same meaningful questions, which claims each one makes and which citations or hosted data support those claims. For operations, this means that publisher outreach, community presence, video or reference visibility, product feeds, business-profile accuracy and review management can contribute through different routes.

    Accuracy and freshness determine whether visibility helps

    More visibility is not automatically beneficial. Profound’s FactCheck announcement describes a system for breaking AI answers into brand claims and tracing them to owned pages and third-party citations. Its example concerned an incorrect claim that Relay ERP was deployed on premises when the cited verified information described the product as cloud-native. The case illustrates the operational distinction between being mentioned and being represented correctly.

    Freshness creates a related problem. A Search Engine Land account of AI reputation management describes an old story about a customer-service incident at a Midwestern grocery chain resurfacing in Google AI Overviews after the issue had been resolved. The article argues that conventional suppression is insufficient because an AI system may still retrieve and cite an older source after it has faded from prominent search positions.

    These reports reveal three separate failure modes. A source may contain a false claim, a once-accurate source may no longer reflect the current situation, or an accurate source may lack the context needed for a balanced answer. Publishing more pages does not directly resolve any of them. The corrective evidence must itself be clear, credible, current and accessible to the systems producing the answer.

    Audit questionRisk it exposesPractical response
    Which claims recur across AI products?A repeated error may be becoming entrenched.Trace the claim to its cited or likely supporting sources and correct the evidence at the source where possible.
    Which sources appear for priority queries?The brand may depend on a narrow or poorly aligned evidence base.Develop credible coverage across relevant specialist, mainstream, community and platform-hosted sources.
    Does each source reflect the current business?Old reporting or stale profile data may distort the answer.Request appropriate updates and publish dated, verifiable context about what changed.
    Do results differ by model?A strong result in one product may conceal weak or inaccurate representation elsewhere.Repeat the same query set across multiple interfaces and record claims, citations and answer changes separately.

    This approach joins reputation management with AI visibility measurement. The objective is not to erase every unfavorable source or manufacture unanimity. It is to ensure that systems have access to a sufficiently broad body of reliable evidence, while genuine inaccuracies and obsolete information are addressed transparently.

    Key takeaways

    • AI visibility depends on the sources selected to support an answer, not only on the brand’s own rankings or content.
    • Niche publishers can add audience and topical relevance even when their traffic is modest; mainstream outlets still provide complementary scale and validation.
    • Gemini, AI Overviews and AI Mode should be measured separately because reported sourcing patterns and brand selections differ.
    • Google-hosted profiles and product information can influence AI Mode visibility before a user visits a brand-controlled website.
    • Claim accuracy and source freshness must be monitored alongside mention volume because an incorrect or outdated citation can turn visibility into reputation risk.

    As AI products continue to develop distinct source preferences, durable visibility will come from maintaining evidence that travels well across systems: accurate first-party data, relevant independent coverage and timely context when the business changes. The strategic advantage will belong to brands that can see not only whether they appear, but also why a model trusts the version of the story it tells.

    References