Tag: Ecommerce

  • How Black Friday Tests AI’s Understanding of E-commerce

    How Black Friday Tests AI’s Understanding of E-commerce

    Every year, Black Friday offers a unique glimpse into how consumers search, compare, and decide. This year, it added another layer: it became a real-world arena to see how AI models comprehend commerce amidst genuine demand.

    I embarked on a journey to test major large language models (LLMs), analyzing 10,000 responses to understand how these systems perceive the retail landscape and the signals that shape their responses.

    As I dissected the dataset, a pattern was unmistakable: Black Friday acts as a genuine stress test for AI-driven discovery.

    The sheer number of queries and the diversity of categories reveal the sources, structures, and behaviors LLMs rely on for reasoning about products, retailers, and consumer intent.

    The outcomes offer a sneak peek into how AI search is transforming—and how this will impact the broader commerce ecosystem.

    TLDR; LLMs lean heavily on a limited range of external domains with YouTube, large retailers, and U.S. review media leading the charge.

    Generalist retailers dominantly capture nearly half of all retail citations, serving as the recurring funnel LLMs use to address shopping queries.

    Social and user-generated content see an 8.1% surge during Black Friday, as conventional retail and media sites experience a decline.

    Off-page signals like Reddit, YouTube, Amazon, and Consumer Reports are vital, equally important as on-page content for shaping LLM comparisons and recommendations.

    Structured comparison content wields significant influence, far surpassing branded assets.

    The behavior of LLMs differs not only from Google but also from each other, with each platform like Gemini, OpenAI, and Perplexity offering unique formats, lengths, and reasoning patterns.

    Unlike traditional search, where the process begins with a query leading to a list of ranked results, AI search reverses this. It starts with a model’s internal web of relationships, sources, and signals to construct a response.

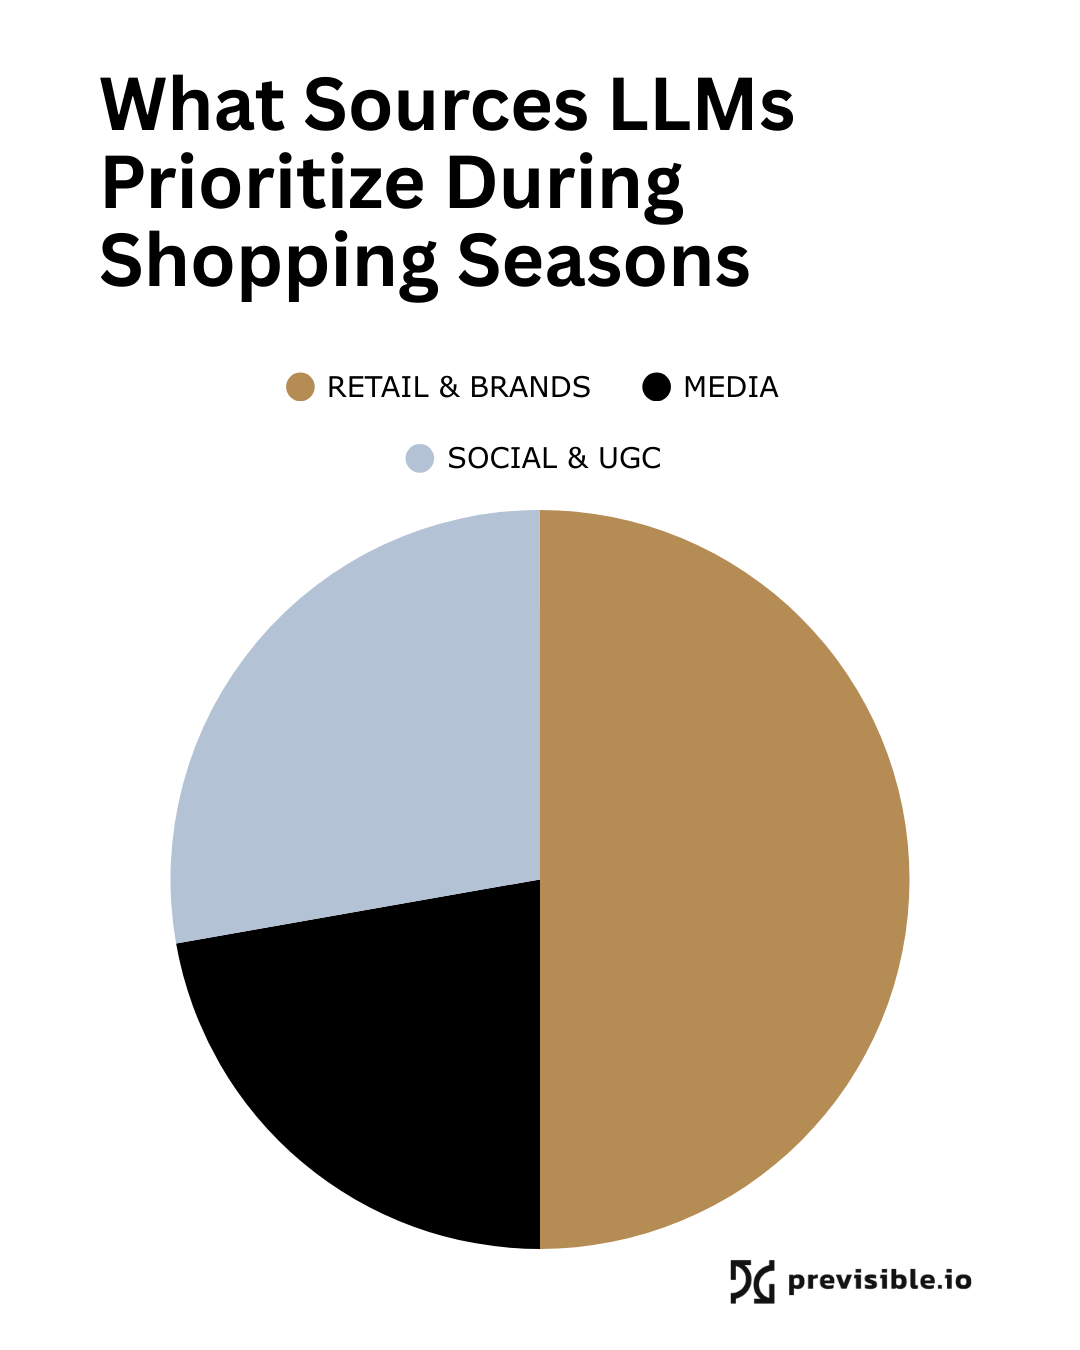
    In our review of the top 50 most-cited domains across 10,000 LLM responses—all centered around deals, reviews, and product recommendations—the distribution was notably skewed:
    ```json
{
  "alt": "Pie chart showing sources LLMs prioritize during shopping seasons, divided into retail & brands, media, and social & UGC.",
  "caption": "Discover the key sources that Language Learning Models favor during shopping seasons with this insightful pie chart, highlighting retail & brands, media, and social platforms.",
  "description": "This image features a pie chart illustrating the sources that Language Learning Models (LLMs) prioritize during shopping seasons. The chart sections are color-coded: brown for 'Retail & Brands', black for 'Media', and light blue for 'Social & UGC'. The pie chart visually represents the proportion of focus each source receives. The visual is branded with 'previsible.io'. This informative chart serves as a tool for understanding the data priorities of LLMs in a commercial context."
}
```

    YouTube led with 1,509 citations, followed by Best Buy with 950, Walmart with 885, Target with 477, TechRadar with 355, RTings with 342, and Consumer Reports with 325.

    This cluster shapes much of the commercial “knowledge” from which LLMs draw. It gravitates towards large retailers, global media outlets, and platforms specializing in comparisons and reviews.

    In analyzing 10,000 responses, I compared the week leading up to Black Friday with the event itself. Pre-Black Friday, responses reins focused on planning behavior.

    Retail and brand domains: 59.6%

    Media: 23.4%

    Social and user-generated content: 17%

    When Black Friday commenced, the mix rapidly evolved. Social and UGC content jumped to 25.1%, gaining significant share, while retail and media slightly retreated.

    This shift within the models mirrors consumer behavior but also highlights the models’ reliance on conversation-driven content for in-the-moment decision cues.

    One of the most transparent insights is the weight third-party domains carry on AI reasoning. Today’s LLMs thrive by absorbing as much human interest in products as possible. Huge volumes of consumer insights, reviews, product demos, sentiment, and structured data guide how models reason and decide.

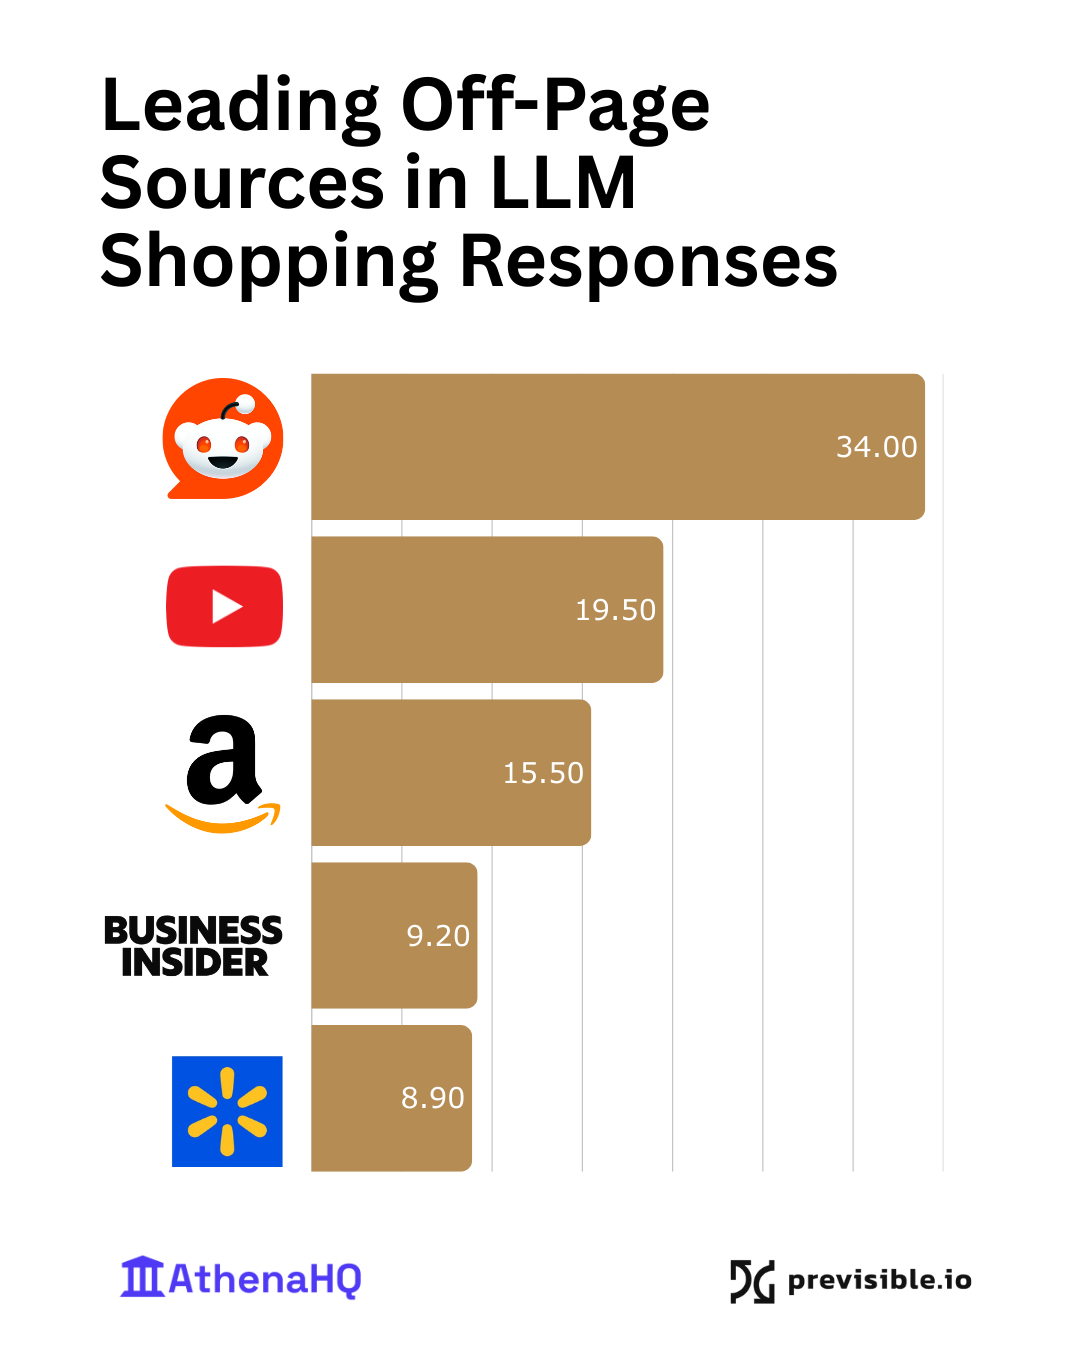
    An analysis revealed key off-page signals LLMs depend on:

    Reddit: 34%

    YouTube: 19.5%
    ```json
{
  "alt": "Bar chart showing leading off-page sources in LLM shopping responses with Reddit, YouTube, Amazon, Business Insider, and Walmart.",
  "caption": "Discover which off-page sources influence LLM shopping responses the most. Reddit leads the charge, followed by YouTube and Amazon in this engaging analysis.",
  "description": "This bar chart illustrates the leading off-page sources influencing LLM shopping responses. Reddit tops the list with a score of 34, followed by YouTube at 19.5, Amazon at 15.5, Business Insider at 9.2, and Walmart at 8.9. The chart highlights the impact of these platforms in shaping purchasing advice, presented by AthenaHQ and Previsible.io. It's a visual exploration of digital influence in consumer decisions."
}
```

    Amazon: 15.5%

    Business Insider: 9.2%

    Walmart: 8.9%

    Each domain influences different aspects of the model’s decision-making. Across the board, LLMs lean on content that captures human interest, organizes consumer options, and mitigates uncertainty through verifiable data.

    While third-party domains reign supreme, brand websites still hold measurable sway. They are vital for any consumer brand aiming to excel in AI discovery.

    A site’s architecture plays a crucial role in how a model interprets a brand. Homepages account for 40% and serve as the primary identity layer—establishing tone, positioning, and offering quick semantic signals to models.

    Blogs and product pages clarify brand definitions and long-tail context, providing the factual details models need.

    Brands that rely too heavily on promotional copy, weak hierarchies, or thin product content risk sacrificing major visibility.

    Across the entire dataset, certain retailer categories led the charge in model responses.

    Generalist retailers hold 48% of the conversation. Walmart, Target, and Best Buy capture almost half of all retail citations. Their range, familiarity, and content depth make them central figures in LLM commerce reasoning.

    Electronics specialists grasp 23% of the share. Best Buy leads, trailed by Newegg and Micro Center, with tech-focused queries often directing models toward these sources.

    Other verticals lag behind. Despite strong category leaders, sectors like fashion, beauty, and home capture smaller portions due to the content volume disparity compared with generalist retailers.

    ```json
{
  "alt": "Pie chart depicting retailer share in LLM responses during Black Friday, including big box, electronic, fashion, beauty, and specialized retailers.",
  "caption": "Retailer dynamics during Black Friday revealed: Big box stores lead in LLM responses, followed by electronic specialists and others. Uncover how different sectors stack up!",
  "description": "This image shows a pie chart titled 'Retailer Share in LLM Responses During Black Friday' from previsible.io. The chart segments the market share among different types of retailers: big box retailers, electronic specialists, fashion and sports, beauty and pharmacy, and specialized retailers. The largest share is claimed by big box retailers, highlighted in black, with electronic specialists in brown and smaller segments for other categories. This visualization is ideal for understanding competitive dynamics and market distribution during the Black Friday shopping period."
}
```

    Reviewing the platforms uncovered another pattern: major LLMs not only offer different answers but exhibit distinct thinking styles. Each platform has its own rhythm, structures, and styles for presenting commercial information.

    Gemini provides the most detailed responses, with essays averaging 606 words, using lists and headings extensively.

    OpenAI stands in the middle, averaging 401 words per response, with high list usage and balanced headings.

    Perplexity shifts towards brevity with an average of 288 words, favoring short summaries akin to executive briefs.

    These differences define unique retrieval and reasoning methods, shaping how each platform interprets brands, categories, and commercial intent.

    The data presents a clear direction: AI search is forging its ecosystem, driven by familiar SEO inputs, source quality, content structure, and off-page signals, all interpreted to deliver precise answers.

    If your content isn’t well-structured and present across the web, it risks becoming invisible to AI platforms delivering answers or product suggestions.

    As this new environment evolves, it’s crucial for retailers and brands to rethink their communication strategies across the entire digital landscape.

    On-page actions that matter:

    Develop semantically coherent homepages that convey the brand, product categories, and relevance to core queries. LLMs prioritize clarity over cleverness.

    Strengthen product pages with factual content, clear specifications, and Q&A sections aligned with user research intents.

    Establish educational content clusters tied to core product themes, serving as reusable frameworks for AI models.
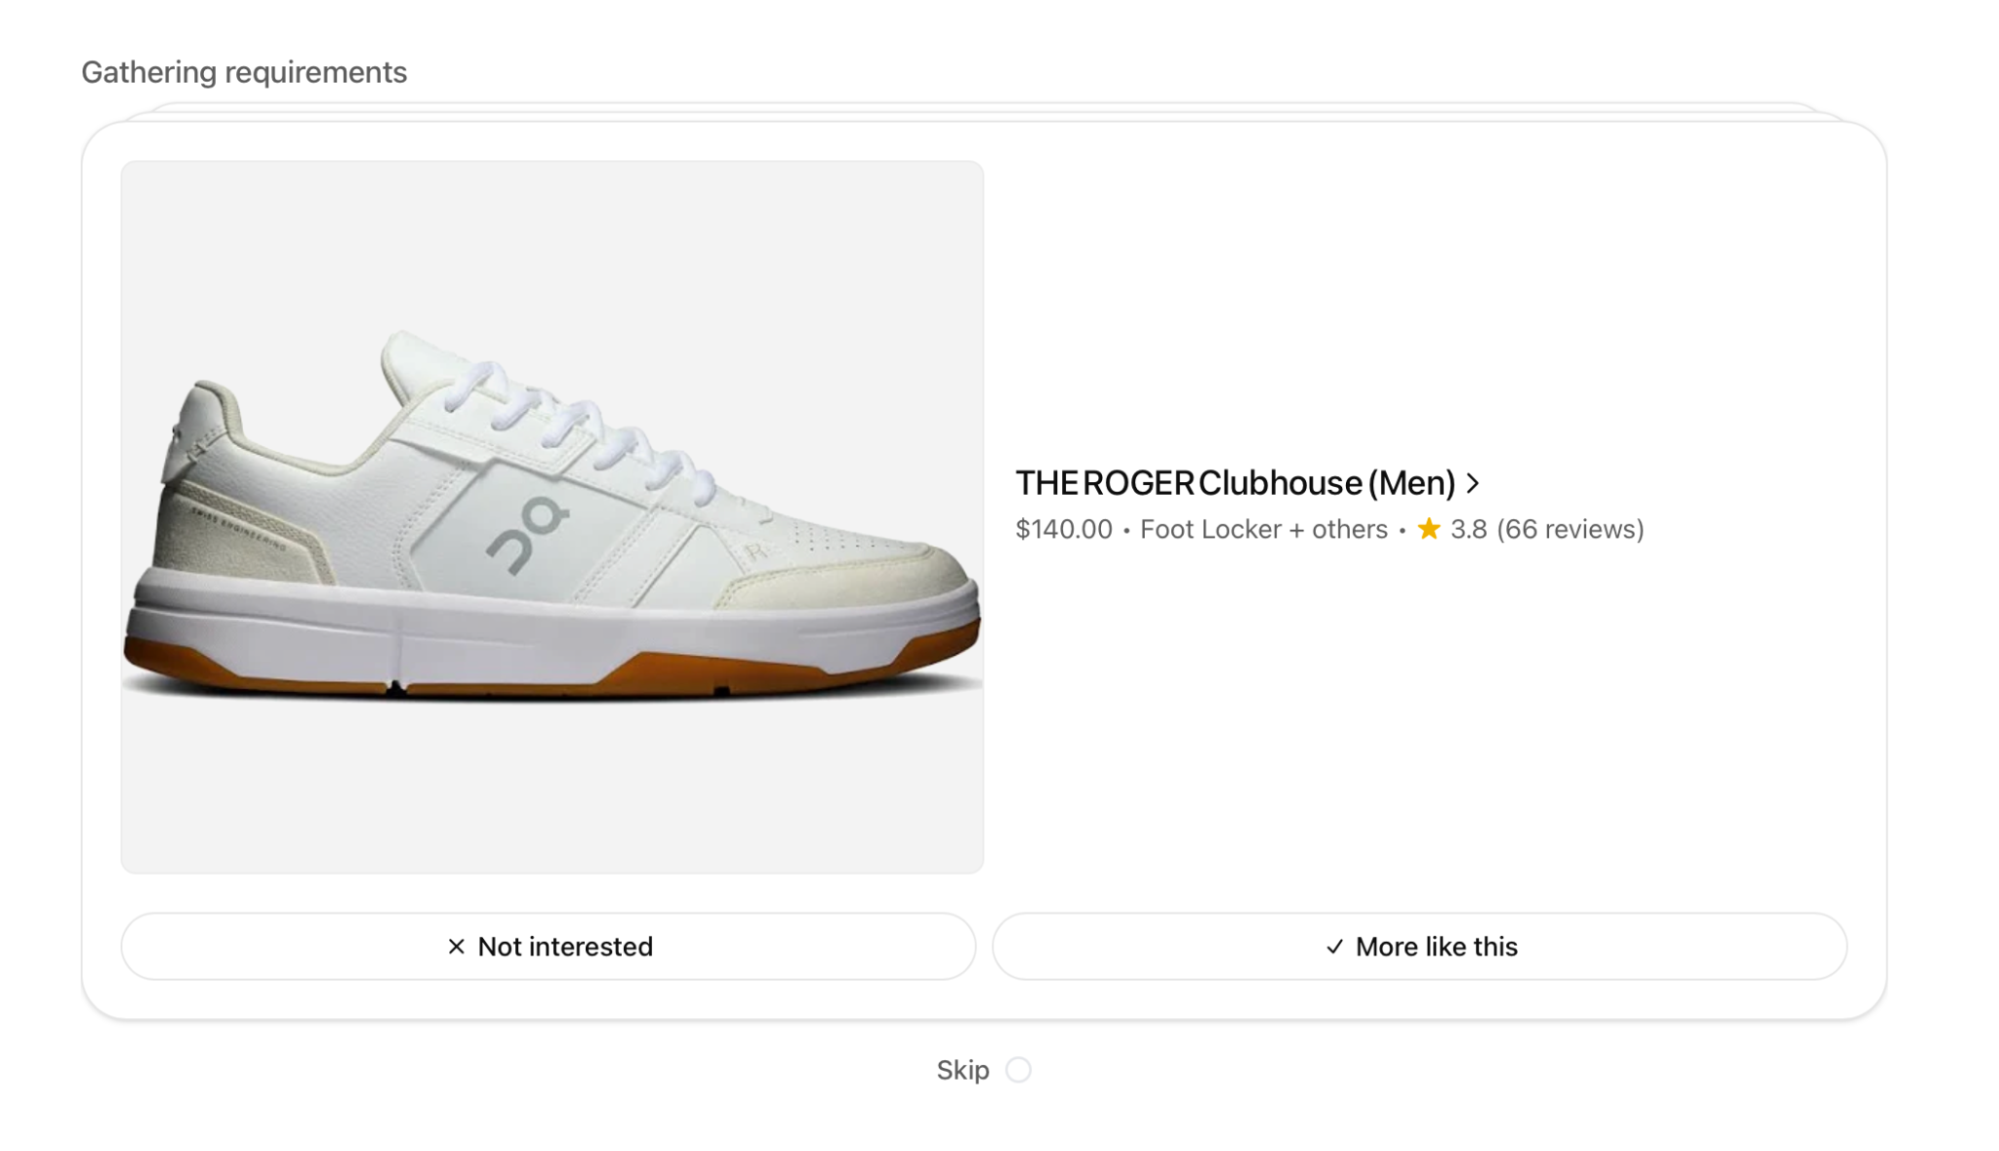
    ```json
{
  "alt": "White THE ROGER Clubhouse shoe, priced at $140, available at Foot Locker with 3.8-star rating from 66 reviews.",
  "caption": "Step up your game with THE ROGER Clubhouse sneakers. Stylish and comfortable, these shoes are perfect for anyone looking to enhance their sneaker collection.",
  "description": "The image features a white THE ROGER Clubhouse men's sneaker with a sleek design. Priced at $140, it's available at Foot Locker and other retailers. The shoe has garnered a 3.8-star rating from 66 reviews. The design includes a leather upper with a modern aesthetic, ideal for both casual and sporting wear. Its rubber sole provides excellent grip and durability."
}
```

    Off-page actions that matter:

    Foster comprehensive review ecosystems and discussion forums to validate trust signals LLMs recognize with product quality.

    Ensure visibility in media driven by comparisons and recommendations. Regularly appear in “best of” lists, product roundups, and influencer content.

    Invest in rich media showcasing product value, particularly on YouTube and TikTok. Video content helps train LLMs on product use cases, reflecting sentiment, and experiential value.

    Maintain accurate, indexable product data in marketplaces like Amazon, Walmart, and Etsy to enhance AI discovery pathways.

    OpenAI’s Shopping Research announcement escalates the stakes. With ChatGPT, OpenAI tracks real-time consumer research behavior, turning preferences into a user-trained targeting engine for commerce.

    This isn’t just AI learning about your product. It’s AI absorbing consumer shopping behavior, revolutionizing discovery through an active AI participation model.

    Brands not infused into these AI systems risk invisibility during AI-driven consumer journeys.

    What Black Friday revealed was more than top-selling products; it showed how LLMs operate under real demand, revealing their reasoning, referencing, and prioritizing patterns.

    The advent of AI-native visibility requires structured, semantically rich content, adequately represented across the right off-page ecosystems to align with major AI models’ reasoning.

    Black Friday might be the stress test, but the real transformation is only just beginning.


    Inspired by this post on Search Engine Land.


    crushpress.ai community screenshot
  • Boost Your Reach with Shopify’s New Product Network

    Boost Your Reach with Shopify’s New Product Network

    I’ve just come across some exciting news from Shopify. They’ve launched something called the Product Network, which essentially allows advertisers to connect with potential shoppers across various merchant sites using contextually relevant products. It’s a game-changer!

    What’s amazing is that this system can suggest products from other merchants, even when I’m shopping at a store that doesn’t have what I’m looking for. For instance, if I search for “organic cleaning supplies” and the store doesn’t carry them, the Product Network might still offer me alternatives from different merchants. This means I can add everything to a single cart, without even realizing some items come from other merchants.

    Here’s how Shopify is positioning themselves: It reminds me of ad platforms like Google Performance Max or Meta Advantage+ Shopping, where advertisers set a cost-per-acquisition goal, and the platform handles the rest. But Shopify is focusing more on the merchandising aspect rather than traditional advertising, which I find quite refreshing.

    Amanda Engelman, who’s their advertising product director, summed it up nicely by saying, “It’s just a different approach to the world.”

    Historically, Shopify has shied away from profiting heavily off advertising. Their Audiences program is a good example; it creates customer segments for various channels like Google and Meta, but doesn’t take a share of the ad spend.

    For merchants, there’s an added incentive to join the network. They earn commissions on the sale of products from other merchants, either in cash or Shopify ad credits. It’s like getting extra ad budget support without the usual upfront investment.

    In the early stages, placements in the Product Network are determined by context rather than being driven by revenue targets, though there’s potential for optimization in favor of higher commission items.

    The reason this is relevant is that Shopify’s Product Network now allows brands to extend their reach with ease. Shoppers are introduced to relevant products seamlessly, as these can be featured on search results or even on different stores’ homepages.

    Unlike typical ads, the focus here is on driving conversions through relevant, context-driven placements rather than simply filling ad space. This could mean better traffic quality and merchants benefiting from third-party sales commissions, thereby expanding the network’s reach and impact.

    Looking ahead, Shopify is planning to further enhance the personalization and monetization of this network, all while keeping users within their ecosystem. The whole aim is to support merchants in selling more, even if the products aren’t their own.


    Inspired by this post on Search Engine Land.


    crushpress.ai community screenshot
  • AI Shopping Insights: Google vs. ChatGPT Citation Trends

    AI Shopping Insights: Google vs. ChatGPT Citation Trends

    I recently came across some eye-opening data highlighting the distinct approaches Google AI and ChatGPT take in citing sources when it comes to retail information. While Google mentions retailers only 4% of the time, ChatGPT cites them 36% of the time. This significant gap of nearly nine times suggests that each platform guides shoppers in noticeably different directions, and this insight comes from the latest BrightEdge data.

    Why is this important to us? Nowadays, millions of shoppers are relying on AI to discover deals and gift ideas. However, the process differs greatly between the top AI search platforms. Google tends to focus on what users are saying, while ChatGPT zeroes in on where you can actually purchase items.

    Regarding what each AI prioritizes, Google AI Overviews are inclined to reference YouTube reviews, Reddit discussions, and various editorial sites. In contrast, ChatGPT frequently cites retail giants such as Amazon, Walmart, Target, and Best Buy.

    Let’s break down the priorities further. Google AI Overviews tend to cite:

    • YouTube reviewers and unboxings.
    • Reddit threads and community consensus.
    • Editorial reviews and category experts.

    Meanwhile, ChatGPT emphasizes:

    • Major retailer listings.
    • Brand and manufacturer product pages.
    • Editorial sources (secondary).

    This citation divide is quite telling. On Google, retailers show up only about 4% of the time, as it leans more towards user-generated content and expert reviews—acting more as a research tool rather than a purchase assistant. Top reference sources include:

    • YouTube
    • Reddit
    • Quora
    • Editorial sites like CNET, The Spruce Eats, and Wirecutter

    Conversely, ChatGPT features retailers about 36% of the time, functioning as both an explainer and a shopping assistant, hence why retailer links are far more prevalent. Key sources often cited include:

    • Amazon
    • Target
    • Walmart
    • Home Depot
    • Best Buy

    About the data: BrightEdge scrutinized tens of thousands of e-commerce prompts across Google AI Overviews and ChatGPT during the 2025 holiday season, identifying and categorizing citation sources. Domains were sorted by type—retailer, UGC/social, editorial, and brand—and directly compared using identical prompts.

    The detailed report is available here: Who Does AI Trust When You Search for Deals? Google vs. ChatGPT Citation Patterns Reveal Different Shopping Philosophies


    Inspired by this post on Search Engine Land.

    crushpress.ai community screenshot
  • Unlock Regional Shopping Deals with Google’s New Ad Feature

    Unlock Regional Shopping Deals with Google’s New Ad Feature

    I’ve recently discovered that Google is testing an intriguing beta feature in Shopping ads, which allows merchants to offer region-specific loyalty prices. This innovation can help retailers tailor their promotions to local audiences more efficiently.

    Personally, I find this feature fascinating because it provides a fresh opportunity for merchants to customize pricing based on regional markets. By highlighting loyalty benefits directly within the ads, there’s potential for increased conversions and more sign-ups.

    Here’s how it works: Merchants need to participate in Google’s loyalty add-on, define regional settings within the Merchant Center, and incorporate loyalty_program attributes — such as program label, tier, and price — into their regional inventory feeds.

    As someone who’s been following this development, it’s important to note that when a shopper clicks on an ad, Google adds a region ID to the URL. Consequently, the merchant’s landing page must dynamically showcase the appropriate member price.

    However, the caveat is that this feature is still in beta, with limited visibility, and is only accessible in markets supporting both RAAP (regional availability and pricing) and loyalty programs.

    In my opinion, enabling regional member pricing empowers retailers to localize incentives and distinguish value across various markets without needing to create separate promotions for each region. It seems to be a clever strategy for reaching customers at a local level.

    If you’re interested, you can find out more about how to set up regional member pricing from Google’s official announcement.


    Inspired by this post on Search Engine Land.

    crushpress.ai community screenshot
  • Master Ecommerce PPC: Boost Campaign Performance

    Master Ecommerce PPC: Boost Campaign Performance

    I’ve delved deep into four key areas that shape how ecommerce PPC campaigns perform: mastering the essentials of Performance Max, leveraging Amazon’s conversion power, building social audiences, and crafting insightful dashboards.

    PPC in ecommerce differs vastly from PPC for lead generation or SaaS. The mechanics of campaigns, the conversion data volume, and each platform’s unique role demand a specialized approach.

    Entering the ecommerce realm helped me identify which fundamentals truly matter. Let’s look at how the core differences between ecommerce and non-ecommerce models influence PPC strategy and how to play to each platform’s strengths.

    1. Performance Max is Built for Ecommerce

    Google Ads is essential for ecommerce, primarily because of Performance Max campaigns, or PMax. It’s tailored for ecommerce, where data flows from high sales volumes and lower ticket sizes, allowing rapid learning and improvement.

    To maximize PMax’s potential, optimizing your feed, segmenting your campaigns, and ensuring conversion tracking are crucial steps.

    ```json
{
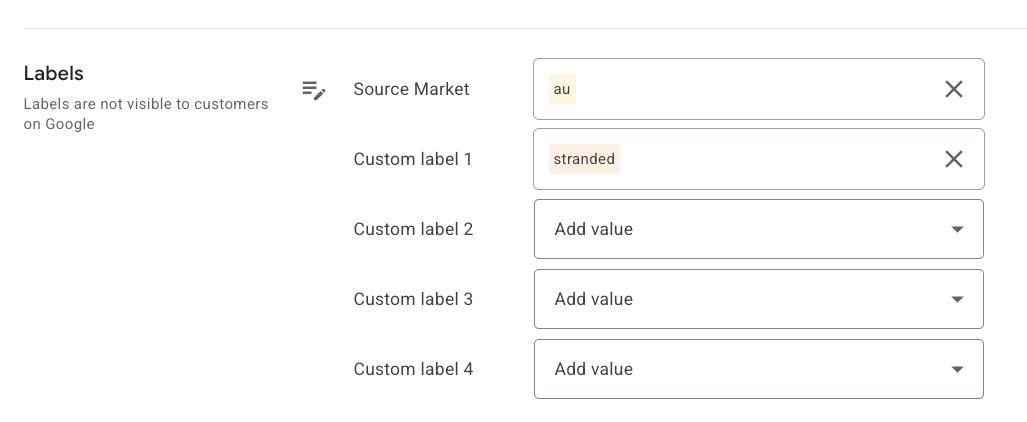
  "alt": "Interface showing Google Ads labels with 'Source Market' and 'Custom labels'.",
  "caption": "A glimpse into organizing data with Google Ads labels—where Source Market and Custom labels streamline categorization.",
  "description": "The image displays the 'Labels' section of Google's interface, featuring 'Source Market' with a label 'au' and 'Custom label 1' marked 'stranded'. Other custom labels are yet to be filled, providing a flexible setup for organizing and filtering data within Google Ads. These labels assist in categorizing and managing marketing campaigns more effectively."
}
```

    Feed Optimization

    Optimizing your feed can dramatically enhance PMax performance. Ensure your product titles and descriptions are well-structured, utilize character limits, and incorporate keywords effectively.

    Campaign Segmentation

    By categorizing your feeds effectively, you can segment campaigns for better results. Utilize default and custom labels in Google Merchant Center to achieve precise targeting and higher ROAS.

    Conversion Tracking

    Accurate conversion tracking is critical. Integrating with tools like Shopify to sync data with Google Ads enables automated bidding strategies and campaign experiments for enhanced ROI.

    2. Amazon Excels in Ecommerce Advertising

    Amazon is an advertising powerhouse for ecommerce, offering transparency and deeper insights through its platform, which results in higher conversion rates compared to competitors.

    ```json
{
  "alt": "A table displaying search query data with metrics like volume, impressions, and clicks.",
  "caption": "Dive into detailed search query metrics—explore volume, impressions, click through rates, and brand shares to fine-tune your strategy.",
  "description": "The image presents a detailed table of search query analytics divided into columns such as Search Query Score, Volume, and two funnels: Impressions and Clicks. Each funnel includes Total Count, Brand Count, and Brand Share with respective numerical values. This visualization offers insights into online search performances, crucial for data-driven marketing strategies, and highlights metrics like click-through rates. Ideal for SEO analysis and performance optimization."
}
```

    Transparency

    Amazon provides detailed reporting, enabling clear insights into conversion performance at both the keyword and market level, setting it apart from platforms like Google and Meta.

    Higher Conversion Rates

    Amazon’s unified platform leads to seamless transactions, resulting in higher average conversion rates and more reliable attribution data, minimizing guesswork.

    Rankings Philosophy

    Amazon’s approach to linking ads and organic rankings provides clarity and allows advertisers to precisely strategize on improving offers and performance based on conversion metrics.

    3. Social Media: Not the Conversion Leader

    While social platforms are crucial for brand awareness and audience building, they typically aren’t optimal for direct conversions, making them secondary to platforms like Amazon Ads and PMax.

    ```json
{
  "alt": "Table showing search funnel data for cart adds and purchases including total count, rates, brand counts, shares, and shipping speed.",
  "caption": "Unveiling e-commerce insights: A table showcasing the search funnel metrics from cart adds to purchases, revealing customer behavior patterns and brand impact.",
  "description": "This image displays a detailed table of e-commerce search funnel data, illustrating metrics from cart adds to purchases. Columns include Total Count, Cart Add Rate, Brand Count, Brand Share, and Same Day Shipping Speed for both stages. This data helps in understanding user interaction and conversion through the sales funnel, highlighting conversion rates and brand influence in online shopping. Keywords: e-commerce, customer behavior, sales funnel, conversion rates, brand impact."
}
```

    Building Customer Lists

    Using social channels to host giveaways can substantially grow your customer lists, which are invaluable for targeted marketing efforts such as promotions and cross-selling.

    Awareness

    Utilize social media to build brand visibility with cost-effective campaigns, focusing on awareness over immediate sales for new-to-market products.

    Remarketing

    Social media excels in creating remarketing funnels that engage customers more deeply, enhancing overall campaign effectiveness.

    4. Dashboarding for Clarity and Success

    Effective dashboarding is vital for maintaining clarity across multiple platforms. A good dashboard distills complex data into actionable insights, critical for profitability and strategy alignment.

    With tools like Sellerboard, you can connect revenue and costs down to the SKU, providing clarity and revealing which platforms and strategies are truly driving success.

    Guide to Next Steps in Ecommerce PPC

    Recognizing the nuances of ecommerce PPC is crucial for making informed decisions that result in campaign success. These insights continue to guide my strategy and I hope they do the same for you.


    Inspired by this post on Search Engine Land.

    crushpress.ai community screenshot
  • Transforming B2B eCommerce: Slava Kravchuk’s Vision for 2026

    Transforming B2B eCommerce: Slava Kravchuk’s Vision for 2026

    In my recent dialogue with Slava Kravchuk, the Founder and CEO of Atwix, we delved into the future of B2B eCommerce and the key elements businesses need to thrive beyond 2026. Drawing from Atwix’s 15+ years of industry experience with manufacturers, distributors, and wholesalers, Slava shared invaluable insights on the rapidly evolving marketplace.

    Slava started his journey with Atwix back in 2006, and the transformation in the B2B eCommerce realm since then has been nothing short of remarkable. Initially, the majority of B2B firms lacked a digital presence, but today, eCommerce is indispensable. Slava highlighted how COVID-19 rapidly accelerated digital transformation, compressing a decade’s worth of changes into mere quarters. This urgency pushed countless businesses to embrace digital commerce as a means of survival and growth.

    We discussed the ongoing debate about selecting the right eCommerce platform. Slava emphasized that it’s not about the ‘best’ platform but choosing one that meets a business’s specific needs. Atwix offers expertise across various platforms like Adobe Commerce, Magento, Shopify Plus, and Shopware, because of their diverse capabilities. For complex B2B operations, Adobe Commerce and Shopware are often ideal due to their flexible architecture suited for intricate business requirements.

    Another crucial aspect of B2B eCommerce is effective ERP integration. Slava insists that seamless eCommerce and ERP connectivity is vital to avoid data errors and ensure customer satisfaction. Atwix’s proprietary tool, Sirius, allows businesses to integrate their ERPs with their eCommerce frontends smoothly. This tool has transformed customer experiences, enabling real-time order tracking and payment capabilities.

    We also touched on the decision-making process between building a custom solution or utilizing a platform. Slava advised starting with a platform due to the efficiencies and flexibility they offer. He stressed the importance of customizing smartly to avoid technical debt and ensuring a platform can evolve with the business’s future needs.

    Slava’s approach is one of partnership. He believes in engaging with clients to map out a strategic vision before any development begins. This foresight helps prevent costly setbacks and aligns the technology with long-term business goals. For example, Byrne Electrical’s rapid development during the pandemic was successful due to careful, phased planning upfront.

    Looking ahead to 2026 and beyond, Slava predicts that AI, integrated experiences, and personalization will be the driving forces of change in B2B eCommerce. AI advancements are already shaping product discovery and customer interactions. Meanwhile, customers now expect integrated, personalized experiences akin to B2C interactions.

    For businesses contemplating digital transformation, Slava’s advice is clear: start with a minimal viable product and continuously refine it based on feedback. Choosing the right partner who understands your industry is crucial for building lasting, adaptable eCommerce solutions. The time for B2B companies to embark on their digital journey is now.


    Inspired by this post on First Page Sage Blog.


    crushpress.ai community screenshot
  • Unlocking Black Friday 2025: Costs Rise but Engagement Thrives

    Unlocking Black Friday 2025: Costs Rise but Engagement Thrives

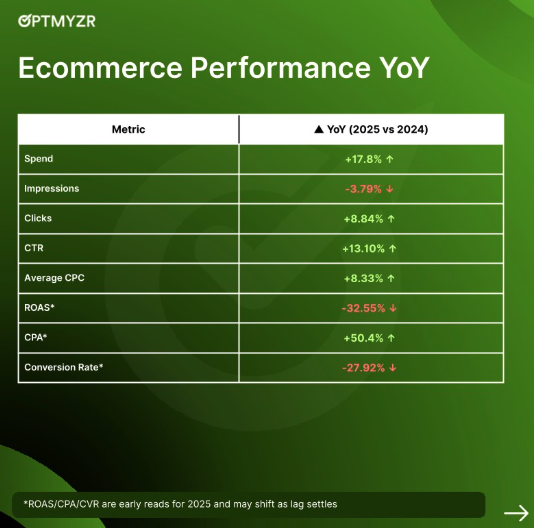
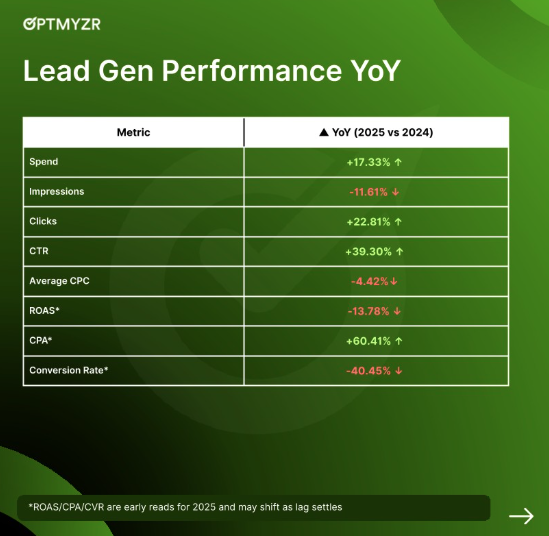
    I found Black Friday 2025 to be a puzzling experience. Although advertising costs went up, impressions decreased. Yet, clicks and engagement didn’t falter, which feels like both a challenge and an opportunity.

    Here’s what I’ve gathered from the data so far:

    I’ve been analyzing data from over 5,000 e-commerce and 16,000 lead generation advertisers who were active this year and last. While we’re still waiting on final numbers for conversion value and ROAS, the early insights are telling.

    The insights:

    Visibility Costs Increased Significantly.

    It’s clear to me that spending rose by about 17% for both e-commerce and lead generation, even as impressions saw a reduction. Essentially, advertisers like us are paying more to reach a similar audience.

    ```json
{
  "alt": "Table shows eCommerce performance metrics year-over-year, with increases in spend, clicks, CTR, and CPA, and decreases in impressions, ROAS, and conversion rate.",
  "caption": "Ecommerce metrics reveal an upward trend in spend, clicks, and CPA for 2025, despite declines in ROAS and conversion rate compared to 2024.",
  "description": "This image presents a table of year-over-year eCommerce performance metrics from Optmyzr, comparing 2025 to 2024. Key metrics include a 17.8% increase in spend, 8.84% rise in clicks, and 50.4% growth in CPA. However, impressions fell by 3.79%, ROAS dropped by 32.55%, and the conversion rate decreased by 27.92%. The table provides insight into advertising performance, with early reads for ROAS, CPA, and conversion rates that may shift as data stabilizes. Keywords: eCommerce, year-over-year, metrics, performance, Optmyzr."
}
```

    Engagement Metrics Held Strong.

    Despite the rise in costs, clicks and CTR improved across various sectors. Lead generation, in particular, enjoyed lower CPCs and an uptick in clicks, showing that people are still actively responding to ads.

    Implications for the Future:

    Expect High Costs Ahead. Given the heightened competition during Black Friday, I anticipate this trend of higher costs per reach to continue into Q1 2026.

    Clicks Are Not the Final Goal. The real challenge now lies in what happens after the click. Returns, conversions, and overall efficiency will be crucial, rather than just focusing on traffic volume.

    ```json
{
  "alt": "Lead generation performance chart showing year-over-year changes in metrics for 2025 vs 2024, including spend, impressions, clicks, and conversion rates.",
  "caption": "Year-over-year lead generation insights reveal increased spend and clicks, alongside a decrease in conversion rates and impressions for 2025 vs 2024.",
  "description": "This image displays a table of lead generation performance metrics comparing year-over-year changes from 2024 to 2025. Key metrics include a 17.33% increase in spend, an 11.61% decrease in impressions, a 22.81% rise in clicks, and a 40.45% drop in conversion rates. The chart notes that ROAS, CPA, and conversion rate are preliminary reads and may adjust. The table is set on a green background, indicating a market trend analysis by Optmyzr."
}
```

    Enhance Post-Click Strategy. I believe that improving landing pages, offers, checkout processes, and lead follow-up mechanisms will be key in turning clicks into conversions.

    Here’s Why This Matters: Black Friday 2025 indicates that while getting attention is still feasible, turning that attention into results demands enhanced strategies post-click. The cost of ignoring these shifts is high – you might spend more while yielding lower returns.

    Bottom Line: Staying visible during Black Friday 2025 came with a higher price, but engagement remains robust. The task ahead is not just driving traffic, but converting that traffic efficiently into results.

    Dig Deeper: Explore the Black Friday year on year PPC performance snapshot for more insights.


    Inspired by this post on Search Engine Land.

    crushpress.ai community screenshot