As I navigated through 2025, I kept hearing the same narrative from my SEO peers: organic traffic seemed to be dwindling, clicks were on the decline, and attribution models just didn’t make sense anymore.
The evolution of AI-driven search experiences, with zero-click results and platform-level answers, has further complicated the gap between discovery and actual visits. This has made it even tougher to report accurately on organic performance.
For many, the impact was clear—visible through double-digit declines in organic traffic and leads, year-over-year.
Leaders rightfully asked, “Why are clicks dropping? Why does organic traffic appear 25% lower than last year? Is SEO failing us?”
The truth is, organic search hasn’t ceased to be effective. Instead, our measurement methods haven’t kept up with current discovery patterns.
Why Last-Touch Attribution is Outdated
We haven’t been measuring organic search accurately.
Many organizations still cling to last-touch attribution, only spotlighting the journey’s end rather than its beginning.
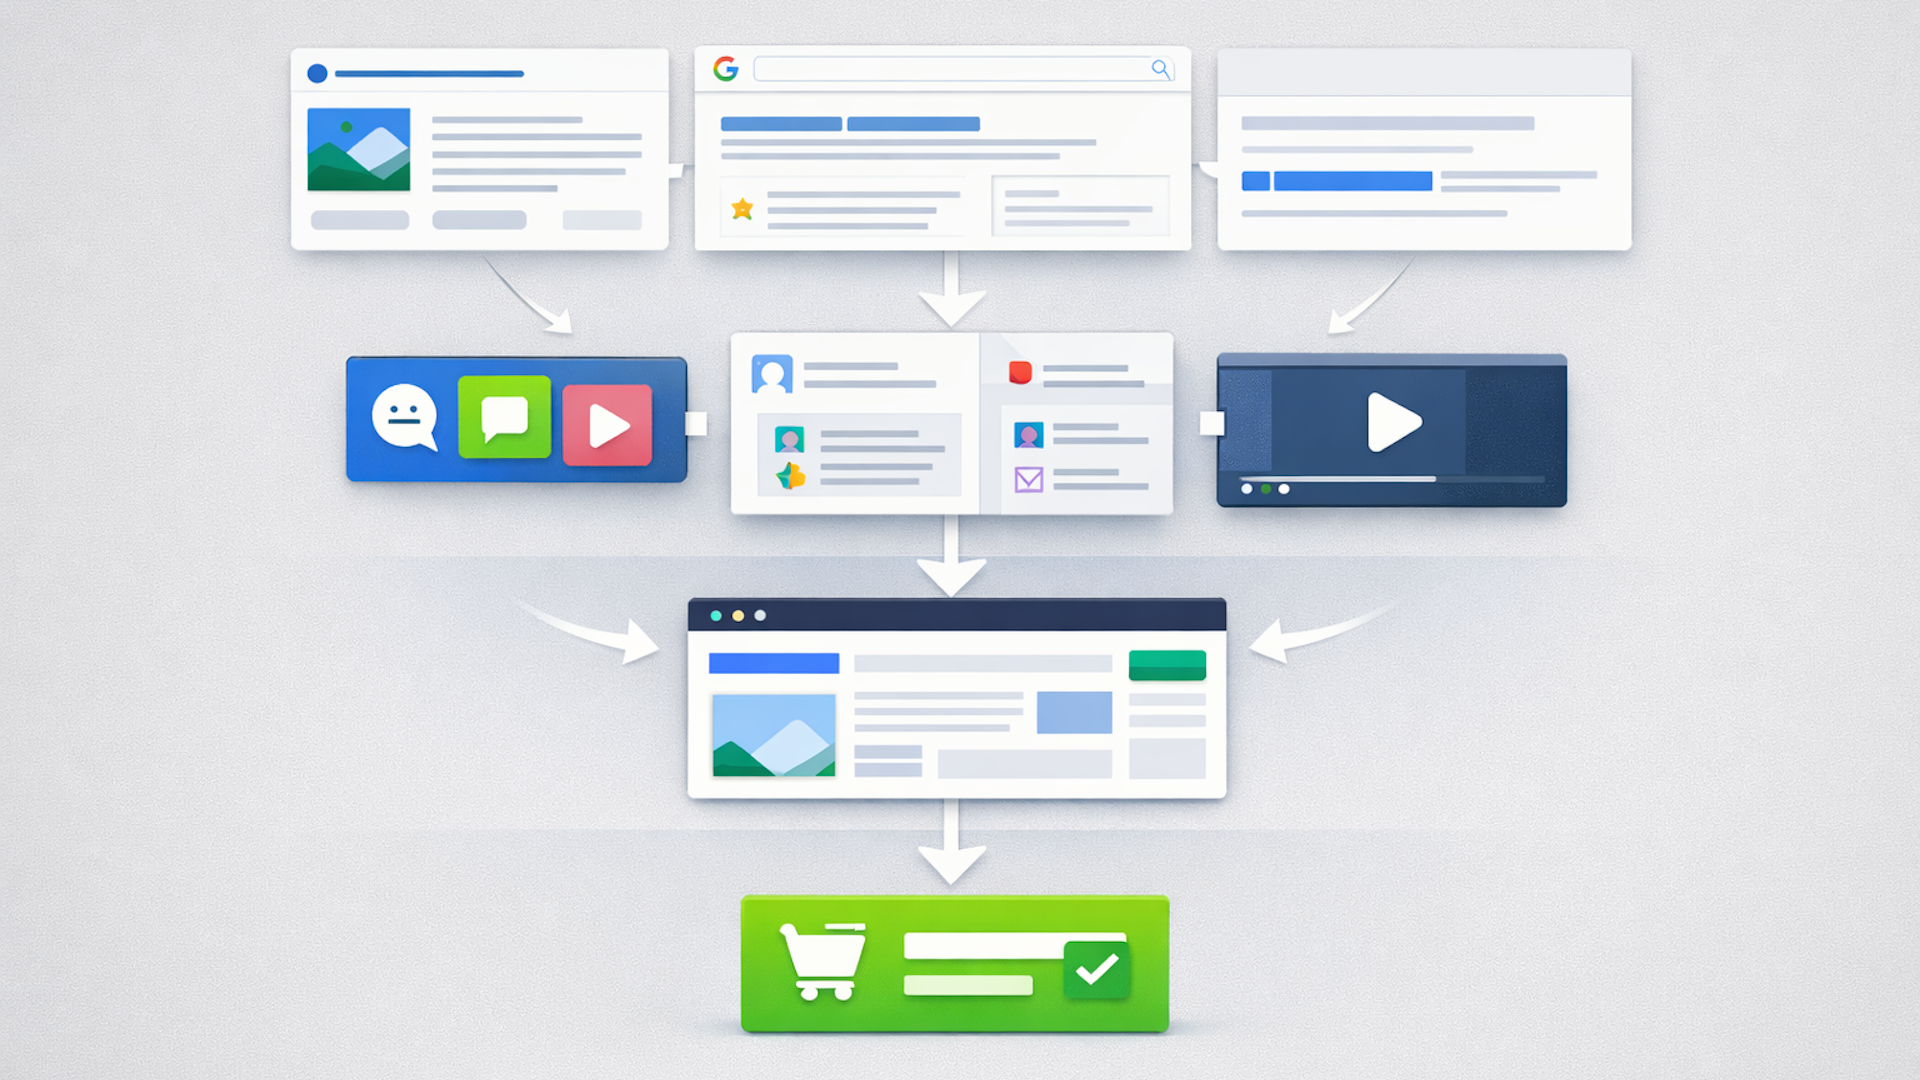
Our attribution models, often linear – Search → Click → Convert – fail to capture the intricate user behavior today.
Traditional models assume that discovery leads directly to a measurable click, but AI-driven SERPs are challenging that assumption.
Last-touch attribution focuses on the finish line, ignoring the starting point of the customer journey.
In this AI-first, zero-click landscape, the gaps in attribution widen, particularly for organic search.
Our measurement isn’t entirely broken but outdated. It doesn’t tell the complete story.
We need to rethink our KPIs and redefine success metrics, painting a full picture of the customer journey from beginning to end.
Your organic dashboard can look healthy while your brand is missing from the AI answers prospects see. The reverse can happen too: search traffic stays flat, yet an answer names your company, cites your page, represents your offer accurately, and sends an identifiable visitor.
Rankings and clicks cannot distinguish those situations. You need a measurement system that shows where your brand entered the answer, how it was represented, and whether that exposure led to anything valuable. AI search therefore needs separate measures for visibility, citations, and impact across AI platforms, reported alongside traditional SEO rather than hidden inside it.
Measure the answer chain, not a single visibility score
There is no single metric that captures AI search performance. A brand can be mentioned without being cited, cited without being recommended, recommended with an inaccurate description, or represented correctly without generating a trackable visit. Calling all of those outcomes visibility removes the distinction you need to decide what to fix.
Start by defining an observation as one captured answer to one fixed prompt on one identified AI surface under logged conditions. Score each observation at several layers:
Measurement layer
Operational KPI
Calculation
Decision it supports
Answer presence
Brand presence rate
Valid observations naming your brand divided by all valid observations
Whether your entity enters relevant answers at all
Source attribution
Citation presence rate
Valid observations citing your domain divided by observations on a citation-capable surface
Whether your pages are being used as visible supporting material
Source competition
Owned citation share
Unique citations to your URLs divided by all unique citations captured in the measured answer set
How much of the cited-source space your site occupies
Representation
Accurate representation rate
Accurate brand descriptions divided by all brand descriptions reviewed
Whether visibility is helping or creating a correction problem
Recommendation
Recommendation inclusion rate
Choice-oriented observations presenting your brand as a suitable option divided by valid choice-oriented observations
Whether the brand appears when the user is evaluating options
Traffic
AI referral conversion rate
Desired actions from identifiable AI referral sessions divided by identifiable AI referral sessions
Whether trackable AI traffic completes the action the page is meant to support
Business outcome
Qualified AI-sourced outcomes
Qualified leads, purchases, sign-ups, or other accepted outcomes connected to direct or declared AI discovery
Whether AI discovery contributes value beyond exposure
Keep these metrics separate in the working dashboard. A composite score can be useful for an executive summary, but it should never be the only view. If the score falls, the team must be able to see whether the problem is lost presence, fewer citations, an accuracy error, weaker traffic, or lower conversion.
The distinctions are operational. A brand mention without a link is evidence of answer presence, not citation performance. A linked page with no brand recommendation is evidence of source use, not preference. A recommendation containing an incorrect product claim is a visibility gain and a representation failure at the same time. Preserve both labels.
Build a prompt panel you can measure repeatedly
An AI search dashboard is only as credible as its prompt set. If the prompts change every time someone checks, movement in the dashboard may reflect different questions rather than different performance. Build a fixed panel for trend measurement and a separate exploratory panel for discovering new behavior.
Start with the decision, topic, and audience
Write down the decision the measurement should inform before collecting answers. Should you update category explainers, strengthen comparison content, correct entity information, improve a landing page, or investigate a competitor’s citation advantage? A metric without a pending decision becomes a trophy.
Then set the scope. Name the product or service category, audience, market, language, and stage of consideration. Do not combine unrelated topics merely to produce a larger visibility number. A brand can perform well for educational prompts and disappear from evaluation prompts; averaging them conceals the gap.
Cover the ways a person reaches a decision
Your fixed panel should contain distinct prompt families. Use the language your audience would naturally use, but assign every prompt a stable identifier and preserve its exact wording.
Problem discovery: prompts that describe a need without naming a solution category.
Category education: prompts asking how a type of product, service, or method works.
Evaluation: prompts asking which criteria, capabilities, or tradeoffs matter.
Comparison and fit: prompts asking which options suit a defined situation.
Risk and validation: prompts asking what could go wrong, what to verify, or what evidence to require.
Branded verification: prompts asking about your company, product, claims, policies, or compatibility.
Report branded prompts separately from unbranded prompts. If the company name appears in the question, the resulting mention does not demonstrate unprompted discovery. Branded prompts are still useful for checking accuracy, positioning, and cited sources, but they answer a different question.
Log the conditions surrounding every answer
The same wording can produce different answers across surfaces or repeated runs. Context from an earlier conversation can also change the response. Start a fresh conversation for a controlled observation, or store the full preceding conversation if multi-turn behavior is what you intend to test.
Each observation record should include:
Prompt ID and exact prompt text
Prompt family, topic, audience, language, and market
Platform, product or model label shown, and answer mode or surface
Whether the session was signed in and whether prior conversational context existed
Collection date and time
Complete response text and a durable capture, such as a saved transcript or screenshot
Whether the response completed successfully and was suitable for scoring
Reviewer name or identifier and the version of the scoring rules used
You may not be able to control every form of personalization. Logging known conditions lets you separate unlike observations instead of presenting them as a clean trend.
Treat repeated answers as observations, not ranking positions
An AI answer is not a fixed search result position. Repeating a prompt can produce a different set of brands, citations, or wording. One answer is therefore a captured observation, not proof that a brand always appears or never appears.
Repeat the fixed prompts on a consistent cadence and calculate rates across the resulting observations. Always show the numerator and denominator beside the percentage. A presence rate based on a small or partially failed run set should not look as authoritative as one based on a complete panel.
Version the panel whenever you add, remove, or rewrite prompts. Keep the previous version’s results intact and mark the break in the trend. Compare each platform and surface with itself before creating a cross-platform summary; otherwise, a product change or a shift in the platform mix can masquerade as improvement in your content.
Collect citations, accuracy, and outcomes with a codebook
Automated collection can save time, but the scoring rules still need human-readable definitions. Without a codebook, one reviewer may count a passing reference as a recommendation while another counts only a direct endorsement. The dashboard then measures reviewer interpretation as much as AI performance.
Use labels that another reviewer can reproduce
Write a short rule and at least one boundary case for every label. A workable starting codebook looks like this:
Brand mention: the response names the company, product, or an unambiguous tracked variant. A generic category reference does not count.
Owned citation: a visible citation or source link resolves to a domain you control. A mention of the brand without a source link does not count.
Recommendation: the response presents the brand as a candidate for the user’s stated need. Appearing in background context does not count.
Accurate: material factual claims about the brand agree with the current canonical information you maintain.
Incomplete: the answer omits information necessary to interpret a material claim correctly, without making a directly false statement.
Incorrect: the answer makes a material factual claim that conflicts with current canonical information.
Unverifiable: the reviewer cannot confirm the claim from an approved internal or public record. Do not silently score uncertainty as an error.
Competitor presence: a named tracked competitor appears under the same mention and recommendation rules applied to your brand.
For citation counts, decide how repetition is handled before collection. A defensible convention is to count the same URL once per answer, even if the interface repeats it. Store both the normalized URL and its domain so you can inspect individual page performance without treating URL variants as different publishers.
Review a sample of observations twice or have a second reviewer score them independently. When labels disagree, improve the rule before expanding collection. The aim is not to force agreement through discussion after every run; it is to make the definition clear enough that future scoring is consistent.
Keep direct attribution separate from directional evidence
AI influence is not always accompanied by a click, and a citation is not proof of a sale. Use an attribution ladder so stakeholders can see how strong each connection is:
Directly observed: an identifiable AI referral session completes a tracked action, or a known referral appears in a documented customer journey.
Declared: a prospect or customer identifies an AI assistant as the way they discovered or evaluated the brand. Store this separately from browser referrer data.
Directionally associated: branded demand, direct visits, leads, or sales move alongside answer presence without a person-level connection. Use this to form a hypothesis, not to claim causation.
Unknown: no reliable discovery or referral evidence exists. Leave it unattributed instead of assigning credit to complete the report.
Connect identifiable referrals to landing pages, engagement events, conversions, qualified-lead status, purchases, or another accepted business outcome. Deduplicate records when web analytics, forms, and a CRM describe the same person or transaction. Otherwise, one journey can become several outcomes in the report.
Compare AI referral quality with the action each landing page is designed to support. A documentation visit, product comparison visit, and purchase-page visit should not be judged by one universal conversion event. The useful question is whether the visitor completed the appropriate next step.
Do not convert missing click data into assumed business value. A no-click citation may still support awareness or trust, but the measured result remains a citation unless you also have declared or observed outcome evidence.
Turn the scorecard into diagnoses and controlled changes
A good dashboard should tell the team what to inspect next. Give every metric a baseline, current numerator and denominator, change from baseline, prompt segment, platform filter, and link to the underlying captures. Add an issue queue for incorrect answers and a change log for content, technical, schema, and platform events.
Read combinations of metrics as diagnostic signals:
Low presence and low citation presence: inspect whether your content covers the measured need clearly, whether the relevant page is accessible, and whether the brand or product is described consistently. Do not assume the problem is a missing schema type before checking the visible content.
Brand mentions without owned citations: inspect which external domains are being cited, what claims they substantiate, and whether your own page provides an equally clear primary explanation or evidence.
Owned citations without brand mentions: your material may support an answer while the entity receives no visible credit. Review the cited passage, page title, authorship, organization naming, and relationship between the claim and the brand.
Strong presence with representation errors: prioritize correction over expansion. Reconcile conflicting descriptions across current pages, structured data, documentation, profiles, and other canonical records.
Recommendations without referrals: verify whether the surface presents clickable citations and whether the cited page offers a sensible next step. Do not automatically label the recommendation ineffective; report the observed recommendation and the missing referral separately.
AI referrals with weak downstream action: inspect prompt intent, cited landing page, message match, and conversion path. More answer presence will not resolve a landing page that serves the wrong stage of consideration.
Improvement on only one platform: preserve it as a platform-specific result until comparable observations show broader movement.
These patterns narrow the investigation; they do not prove a cause. The next step is a controlled content or technical change.
Run an experiment that can survive scrutiny
State one hypothesis linking a specific change to one measurement layer. For example, clarifying the canonical product description is expected to reduce representation errors for the affected prompt group.
Select the page or page cluster being changed and, where practical, a comparable untouched cluster that can reveal wider platform movement.
Capture a baseline with the fixed prompt panel and current scoring codebook.
Make one material intervention and record exactly what changed. If several changes must ship together, treat them as one bundle and do not assign the result to an individual component.
Confirm that the updated page is live and available through the technical paths you can verify before judging the intervention.
Repeat the same prompts under comparable conditions and report movement at every relevant layer, not just the preferred KPI.
Retain the response captures, scoring decisions, content version, and known platform changes so another person can audit the conclusion.
JSON-LD belongs in the implementation and quality-assurance record, not in the outcome column. Track whether the required markup is valid, whether its entities and relationships match visible content, and what changed. A successful validation does not by itself demonstrate answer presence, citation, accurate representation, referral traffic, or business impact.
Avoid declaring a content win when the prompt panel, platform, model label, scoring rules, and page all changed together. If you cannot isolate the intervention, describe the movement accurately as an observed change and schedule a cleaner test.
Key takeaways
Measure answer presence, citations, representation, recommendations, traffic, and business outcomes as separate layers.
Use a fixed, versioned prompt panel for trends and a separate exploratory panel for discovering new questions.
Treat each captured response as an observation, not a permanent ranking position.
Publish the numerator, denominator, platform, prompt segment, and collection conditions behind every rate.
Use reproducible definitions for mentions, citations, recommendations, accuracy, and competitor appearances.
Separate directly observed attribution from declared discovery, directional evidence, and unknown influence.
Use metric combinations to choose the next investigation, then test one documented intervention against the same prompt panel.
Your practical starting point is one important topic, one defined audience, and a prompt panel small enough to rerun consistently. Capture the baseline, label every answer at each layer, and connect only the referrals and outcomes you can support with evidence. That gives you a measurement system you can improve without overstating what AI visibility has accomplished.
Your App Store search campaign can now qualify for ad positions you never selected. That creates another route to potential installs, but automatic eligibility also means delivery can change before your bids, product pages, and measurement plan do.
You don’t need to rebuild the account to participate. You do need a clean baseline, a tighter relevance audit, and a rule for deciding whether additional volume is actually profitable. Otherwise, higher spend can look like growth even when install economics are deteriorating.
Existing search results campaigns are automatically eligible. There is no separate placement switch to activate.
You cannot select a particular search-results position or bid specifically for one. Apple determines placement using relevance and bid.
Ad formats and billing remain the same: ads can use a standard or custom product page, optional deep links can lead to an in-app destination, and billing remains cost per tap or cost per install.
Apple’s reported conversion rate of more than 60% applies to top-of-search ads on average. Do not treat it as a promised benchmark for every keyword, market, or new lower-page position.
What changes, what stays fixed, and what you control
The most important distinction is between inventory and control. Apple is increasing the number of places where a search ad may appear, but it is not giving advertisers a position selector. Your campaign can enter more placement opportunities without gaining the ability to demand the top slot or exclude the lower ones.
Campaign element
What the expansion means
What you should do
Search-results inventory
More than one sponsored ad can appear for a query, at the top and farther down the page.
Measure whether added delivery produces incremental installs at an acceptable cost.
Establish a baseline before changing bids, keywords, or product pages.
Position
Apple chooses where an eligible ad appears.
Do not build a strategy that assumes a bid increase buys a specific slot.
Matching
Search ads continue to match through advertiser-selected or Apple-suggested keywords.
Audit the connection between each important keyword, its intent, and the destination page.
Creative and destination
The ad can use a standard product page or a custom product page, with an optional deep link.
Choose the page that most directly continues the promise implied by the keyword.
Billing
Cost-per-tap and cost-per-install billing remain available.
Keep the commercial decision anchored to install value rather than raw visibility.
Device support
The additional positions are supported on devices running iOS or iPadOS 26.2 and later.
Remember that a mixed device audience may not encounter the expanded layout uniformly.
Apple scheduled the first phase for the UK on March 3, with Japan following and all Apple Ads markets expected to be included by the end of March. That staggered schedule makes market-level annotations important. If you do not record when exposure could have changed, later analysis can confuse the rollout with seasonality, a product release, a pricing change, or another campaign edit.
Do not interpret extra inventory as a new targeting system. The campaign is still built around keyword relevance, the product-page experience, and the economics of a tap becoming an install. The expansion changes where an eligible ad may be delivered, not the basic job the ad must do.
Build a baseline before you react to the new inventory
Automatic eligibility turns measurement into the first task. If you raise bids, add keywords, replace product pages, and increase the budget at the same time, you will not know whether a performance shift came from the extra placements or from your own changes.
Mark the rollout in your account records. Record the relevant market date and note that the additional placements require iOS or iPadOS 26.2 or later. Use the most precise market and device information your reporting actually provides; do not assume a dimension exists if it is not visible in your account.
Save a comparable pre-expansion view. Capture impressions, taps, installs, conversion rate, spend, cost per tap, and cost per install for each important market, campaign, and keyword. Use a period that reflects the normal buying cycle of your app rather than an arbitrarily short snapshot.
Document other variables. Note product releases, store-listing changes, promotions, pricing changes, tracking updates, and budget edits. Each can move conversion independently of ad position.
Set an economic guardrail. Decide the highest cost per install the business can support before more volume arrives. Base that ceiling on the value and quality of an acquired user, not on a competitor’s bid or a platform-wide conversion claim.
Verify conversion measurement. Confirm that taps and installs are being attributed as expected. If you use deep links, test that each one opens the intended in-app destination for the relevant user journey.
Avoid unnecessary simultaneous changes. Keep the first observation window as stable as the business allows. When an urgent edit is unavoidable, annotate it so the resulting data is not mistaken for a placement effect.
A before-and-after comparison is useful, but it is not proof of incrementality. During a staggered rollout, a comparable market that has not yet changed can provide a directional check. It is only a useful comparison when demand patterns, promotions, and app availability are genuinely similar. Once all markets are included, rely on annotated within-market trends and be explicit about competing explanations.
Expect aggregate metrics to move in different directions. Total installs can rise while conversion rate falls because the campaign is reaching additional inventory with different user behavior. That is not automatically good or bad. The decision turns on whether the added installs remain valuable at the resulting cost per install.
Write down the intent behind the keyword. Is the person looking for your brand, a broad app category, a specific task, or a particular feature? If the intent is ambiguous, do not pretend one product page can answer every possible meaning.
Match the page to that intent. Use the standard product page when it accurately represents the query. Use a custom product page when a distinct use case needs different screenshots, copy, or emphasis.
Check the first visible promise. The opening product-page experience should make the connection immediately. If the query implies one task but the page leads with another, more traffic will magnify the mismatch.
Use deep links as a continuation, not a shortcut. A deep link is useful when the destination completes the journey implied by the ad. It is counterproductive when it drops the user into an unrelated or contextless part of the app.
Remove mismatches you cannot fix. If a keyword’s intent cannot be represented truthfully by the app or its page, a larger bid is not the remedy. Refine or pause the keyword.
This is also why paid acquisition and App Store optimization cannot be managed as isolated disciplines. Search ads use the product-page experience to turn intent into an install. A weak listing is therefore both an organic discoverability problem and a paid conversion problem. Extra ad slots increase the cost of leaving that handoff unresolved.
Be careful with Apple’s top-of-search benchmark. Apple reports an average conversion rate above 60% for ads in that position, but the figure is vendor-supplied and specific to top-of-search performance. It does not establish how the additional lower positions will perform in your market. Use it as context, not as a forecast or account target.
A global bid increase is a poor first response. Because you cannot purchase a named position, a higher bid does not guarantee that the added spend will secure the top placement. Hold bids steady long enough to observe the change where practical, then adjust one major lever at a time: keyword scope, bid, product page, or budget. That sequence keeps the diagnosis legible.
Decide whether the added delivery deserves more budget
More impressions are an inventory result. More taps show that users responded. More valuable installs are the business result. Keep those three questions separate when you evaluate the expansion.
Impressions and taps rise, while cost per install stays within your guardrail: the additional inventory may be adding efficient reach. Increase budget gradually and keep watching keyword-level conversion rather than assuming the first result will persist.
Spend and installs rise, but cost per install exceeds the guardrail: the campaign is buying volume that the business may not be able to support. Reduce exposure to weak keywords, improve the matching product page, or lower bids before approving more budget.
Taps rise while installs remain flat: investigate the handoff from query to page. Check tracking first, then review intent alignment, product-page clarity, and any deep-linked destination. Do not use a bid increase to solve a conversion failure.
Impressions rise but taps do not: eligibility is not the same as appeal. Revisit whether the keyword and visible product-page message give the searcher a clear reason to choose the app.
Little changes: automatic eligibility does not guarantee meaningful delivery. Leave the campaign alone unless another metric provides a reason to act.
Cost pressure is possible, but it should not be assumed. More ads on a results page can intensify competition for high-intent searches, while more available inventory can also alter the supply of opportunities. The net effect depends on the auction, query, market, and relevance of your ad. Let observed cost per install and conversion quality decide the response.
Review the keywords responsible for most of your spend first. Map each one to its intended product page, confirm conversion tracking, record the rollout date, and set the cost-per-install ceiling before changing the bid. When the expanded inventory produces installs inside that boundary, scale deliberately. When it only produces activity, fix the journey or decline the extra volume.
You may be looking at Demand Gen because paid social is getting harder to scale, or because YouTube creates attention that your conversion reports struggle to explain. Google’s commerce updates give you three new levers, but each solves a different problem.
The practical question isn’t whether to adopt every new feature. It is whether shoppable connected TV, dynamic travel offers, or branded-search attribution closes a specific gap in your customer journey. Start there, and you can test the updates without turning a product announcement into an open-ended budget request.
What changed, and what each update actually does
The three additions sit under the same Demand Gen umbrella, but they are not interchangeable:
Travel Feeds let advertisers connect Hotel Center feeds to dynamic video ads containing current pricing, ratings, and availability. They change how hotel offers are assembled and kept relevant.
The first two features change what a prospective customer can see or do. The third adds an attribution signal. That distinction matters: a new measurement report does not improve the buying experience, and a shoppable ad does not by itself prove that the resulting sales were incremental.
Match the feature to the constraint in your funnel
Use shoppable CTV when the missing link is product action
Shoppable CTV is most relevant when viewers understand your product from video but have no natural next step from the television screen. The testable idea is simple: can adding a product interaction to that viewing experience produce more conversions without weakening return on investment?
Do not begin by moving a large video budget. Begin with a product set that makes the test interpretable. Favor products that are easy to recognize visually, have a clear use case, and are supported by dependable price and availability data. The item presented in the ad should also be easy to find at the destination. A viewer who meets a different product, price, or offer after acting on the ad has not experienced a media failure; they have experienced a broken handoff.
Make the product and its main benefit understandable at television viewing distance. Do not rely on dense copy or small interface details to explain the offer.
Check the full path from the video impression to the product action and final destination. Look for changes in item identity, price, availability, or promotional language.
Judge the test primarily on conversions, conversion value, CPA, or ROI, according to your business model. Video engagement can diagnose creative response, but it should not replace the commercial outcome.
Document what adding CTV is expected to change. If the hypothesis is merely that the campaign will reach more people, the test is too vague to justify a performance conclusion.
Use Travel Feeds when changing offers make creative stale
Travel Feeds address a different source of friction. Hotel pricing and availability can change faster than a team can rebuild conventional video assets. Connecting Hotel Center allows those offer details, along with property ratings, to populate dynamic video ads.
The feed becomes part of the advertising experience, so feed quality is campaign quality. Before increasing spend, sample the properties and offers being promoted. Compare the price, rating, and availability presented in the ad journey with what a traveler encounters when moving toward a booking. Decide how your team will identify unavailable properties, inconsistent prices, and destinations that no longer match the promoted offer.
Audit Hotel Center data before evaluating the creative. Incorrect or incomplete offer data can make capable media look ineffective.
Review a representative mix of properties rather than checking only the most visible or highest-volume listing.
Assign ownership for feed corrections. A media buyer who can identify a mismatch but cannot route it to the person responsible for hotel data will repeatedly diagnose the same problem.
Keep the booking outcome as the primary metric. Dynamic assembly reduces creative and offer friction; it does not remove the need to evaluate booking quality and campaign economics.
Use Attributed Branded Searches when last-click reports hide influence
Demand Gen can affect what people search for after seeing an ad, even when the eventual search or conversion does not look like a direct response to the original impression. Attributed Branded Searches are designed to expose that brand-search activity across Google and YouTube.
That makes the metric useful, but not equivalent to revenue. A rise in attributed brand searches can indicate that the campaign created interest. It cannot, on its own, tell you whether those searches produced profitable, incremental customers. Read it beside conversions, conversion value, CPA, ROI, and any customer-quality measure your business already trusts.
Because a Google representative must activate the feature, treat access as a pre-launch dependency rather than an item to chase after the campaign ends. Ask the representative to confirm eligibility, the activation date, the metric definition, the reporting location, the applicable attribution window, and any limitations that could affect interpretation. Record those answers with the campaign brief so nobody later compares two reports built on different rules.
Build the measurement plan before you move budget
The updates make Demand Gen more measurable, but more metrics do not automatically create a clean test. You still need a decision framework that separates commercial outcomes from diagnostic signals.
Write one falsifiable hypothesis. For example: adding TV screens will increase conversions while maintaining ROI, or feed-driven hotel video will increase bookings without exceeding the campaign’s CPA constraint. Avoid a bundle such as improving awareness, engagement, sales, and efficiency at once.
Select one primary outcome and one guardrail. The outcome might be purchases, bookings, conversion value, or another completed business action. The guardrail might be CPA or ROI. Branded search and video engagement should remain supporting signals unless they are genuinely the business objective.
Lock the comparison rules. Use consistent conversion actions, value rules, attribution settings, and reporting periods when comparing Demand Gen with an existing campaign or channel. If those controls cannot be aligned, label the comparison as directional rather than causal.
Record operational diagnostics. For commerce, inspect product continuity and availability. For travel, inspect Hotel Center data and the offer-to-booking path. For brand measurement, confirm that Attributed Branded Searches were active during the period being evaluated.
Define the next decision before results arrive. State what would justify a limited scale-up, what would trigger a feed or landing-path repair, and what would cause the test to stop. You do not need to invent universal thresholds; use the economics your account must already meet.
Once the campaign is running, interpret combinations of signals instead of celebrating one favorable number:
Signal pattern
What it may mean
What to do next
Conversions rise while ROI holds or improves
The commerce path may be creating useful additional demand at acceptable efficiency.
Verify order or booking quality, repeat the result, and scale gradually.
Attributed brand searches rise but conversions remain flat
The campaign may be generating interest that the offer, destination, or conversion path is not capturing.
Do not declare a revenue win. Inspect search destinations, landing experiences, offer consistency, and conversion tracking.
Video engagement improves but commercial outcomes weaken
The creative may attract attention without qualifying the right buyer or making the next action clear.
Rework the product promise and handoff before adding budget.
Travel ads show inconsistent offers or weak delivery
Hotel Center data or campaign configuration may be obscuring the media result.
Resolve feed accuracy and eligibility questions before concluding that the channel failed.
Use Google’s performance figures as test inputs, not forecasts
Google reports that Demand Gen campaigns featuring TV screens generated 7% more conversions at the same ROI. LG Electronics also reported a 24% higher conversion rate than paid social while reaching high-value customers at a 91% lower CPA. Those figures make a reasonable case for testing the channel, but they are vendor-reported results rather than a guaranteed outcome for your account.
The LG comparison is especially easy to misuse. Without matching details for audience, geography, campaign period, conversion action, creative, and attribution model, a 91% CPA difference cannot become your forecast. Even the phrase “paid social” can conceal campaigns with different objectives and levels of maturity.
Use the 7% figure to support the question, “Is a controlled CTV test worth running?” Do not insert it automatically into a revenue plan.
Use the LG result as evidence that Demand Gen can compete with paid social under some conditions, not that it will always outperform it.
Put the comparator beside every benchmark in your internal presentation. A percentage without its baseline, campaign objective, and measurement rules is not an operating target.
Let your account’s conversion quality and unit economics decide whether to scale. A lower reported CPA is not valuable if it produces lower-value customers or bookings that do not hold.
Key takeaways
Shoppable CTV is a commerce-path update: use it when YouTube viewing creates product interest but the television experience lacks a clear response mechanism.
Travel Feeds are an offer-assembly update: audit Hotel Center data because price, rating, and availability accuracy directly affect what the traveler sees.
Attributed Branded Searches are a measurement update: activate the feature through a Google representative before launch and interpret it beside commercial outcomes.
Google’s 7% conversion figure and LG Electronics’ paid-social comparison can justify a test, but neither should be treated as an account forecast.
The strongest rollout ties one feature to one constraint, one primary outcome, one efficiency guardrail, and a written scale-or-stop decision.
Before your next campaign-planning meeting, write a one-sentence hypothesis and the two numbers that will decide whether you scale or stop. Then introduce only the Demand Gen feature capable of moving that hypothesis. That keeps the update focused on a business decision instead of letting it become a reason to spend first and explain the result later.
You have one experimental budget and three names in the room: Threads, ChatGPT, and Gemini. Calling all three emerging ad opportunities hides the decision that matters. What can you buy, what can you measure, and what job should each surface do?
Separate the opportunity into three different ad markets
Conversational AI and social feeds may compete for the same experimental budget, but they do not sell the same product. One sells feed distribution through a mature advertising system. Another is testing sponsored exposure beside a generated answer. The third is withholding ads while it develops the assistant.
Treat it as a paid-social placement test. Use familiar campaign objectives, but require placement-level reporting before claiming that Threads caused the result.
Treat it as controlled innovation inventory. It may support reach, learning, and brand objectives before it can support a conventional performance case.
Do not put Gemini impressions in a paid-media forecast. Keep it in your organic AI visibility program and on a product-monitoring list.
Availability is the first gate, not the final reason to spend. Threads has a reported user base of more than 400 million, but that figure describes platform scale rather than the reach available to your account. Meta also indicated that delivery would begin modestly. Your forecast should therefore come from the inventory and placement estimates available during campaign setup, not from the platform-wide audience number.
ChatGPT presents the opposite planning problem. A conversation can reveal strong intent, but impression-based billing does not prove that the user noticed the sponsored unit, asked about it, visited the advertiser, or converted. Pricing tells you what triggers the charge. It does not tell you whether the exposure worked.
Key takeaways
Classify each opportunity by buying model and reporting capability before comparing audience size.
Use Threads as an additional paid-social placement, not as a proxy for conversational intent.
Use early ChatGPT inventory for an impression-led learning objective unless the buying agreement supplies stronger outcome measurement.
Keep Gemini out of paid-media budgets until an actual ad product defines access, formats, billing, reporting, and controls.
Report paid conversational exposure separately from organic mentions and citations in AI answers.
Give each surface one job before you fund it
A new placement becomes expensive when it is asked to prove everything at once. If the same test is supposed to create awareness, generate leads, establish brand safety, and teach you how the format works, almost any result can be rationalized after the fact. Assign one decision question to each surface before approving spend.
Threads: test incremental paid-social distribution
Threads is the most operationally familiar option because Meta can streamline campaign expansion through Advantage+. That convenience can also obscure what happened. A blended Meta result cannot tell you whether Threads earned its share of the budget unless your reporting isolates delivery and outcomes for that placement.
Write one hypothesis. For example, test whether a specific audience and creative concept can produce acceptable traffic or conversion quality on Threads. Do not use a vague objective such as learning the platform.
Select one primary outcome. Choose reach, traffic, leads, sales, or another campaign objective supported by your setup. Keep secondary metrics diagnostic rather than treating every metric as a success condition.
Confirm placement visibility. Before launch, verify that your reporting can show Threads delivery, spend, and the outcome tied to your objective. If it cannot, treat the campaign as a broader Meta test rather than a Threads test.
Control the creative comparison. Carry one existing paid-social concept into the test and pair it with one Threads-specific variation. Hold the offer and audience as steady as your controls permit so that the creative difference remains interpretable.
Predefine the decision rule. Set the acceptable result from your own paid-social benchmark before seeing the data. Record what would justify scaling, revising creative, or stopping.
Modest early delivery may reflect limited inventory rather than a failed message. Do not judge creative after a handful of impressions, but do not wait indefinitely either. Evaluate once the placement has delivered enough exposure for the metric in your prewritten rule, and document underdelivery as a separate finding.
ChatGPT: buy access only when the learning is worth the ambiguity
Access is itself a qualification step. Initial testing involves selected advertisers, spending below $1 million per advertiser, without a self-service interface. The announced audience configuration places ads in free access and the $8-per-month ChatGPT Go tier, while Plus, Pro, and Enterprise remain ad-free for the time being. Your buying brief should identify the audience you can actually reach rather than referring to ChatGPT users as one undifferentiated group.
Get written answers to these questions before approving an insertion order or equivalent commitment:
What event counts as a billable impression, and which impression fields appear in reporting?
Which account tiers, geographies, devices, and conversation contexts are eligible?
Can the unit link to a destination, and how are clicks or other interactions defined?
Are reach, frequency, and repeat exposure available, or will you receive only aggregate impressions?
Can follow-up questions about the sponsored product be measured, and are they reported in aggregate without exposing private conversation content?
Which category exclusions, adjacency controls, and remediation procedures apply?
Can campaign data be exported for reconciliation with your analytics and customer systems?
If those answers do not support your normal acquisition model, label the spend correctly: a brand and product-learning test. Do not place a cost-per-acquisition target in the approval document and then excuse its absence because the format is new.
Do not reserve speculative Gemini media money merely to appear prepared. Put the surface on a watchlist with five activation triggers: buyer access, eligible audience, ad format, billing method, and reporting controls. Until all five are defined, the paid-media row should remain unavailable rather than carrying an invented forecast. Your organic work for Gemini belongs in a different plan and can continue without waiting for an ad product.
Build a measurement contract before the campaign
The measurement plan should be short enough to read in one meeting and strict enough to prevent a weak result from being renamed a success. For every test, record the business question, the primary metric, supporting diagnostics, disqualifying conditions, evaluation window, data owner, and decision owner.
Use a four-level measurement ladder:
Delivery: Record spend, billable impressions, placement share, and reach or frequency when provided. Reconcile the purchased amount with the platform report before interpreting response.
Observable response: Track clicks, destination sessions, or another defined interaction only when the format supports it. State exactly what the platform counts rather than assuming that similarly named metrics are equivalent.
Business outcome: Connect qualified leads, purchases, or other approved outcomes through your normal analytics process. Separate directly observed conversions from modeled or assisted attribution.
Incrementality: When the buying system and budget permit, use a holdout or controlled split to test whether the advertising changed behavior. Without a control, label changes in branded demand or direct traffic as directional rather than causal.
For Threads, the crucial diagnostic is placement-level delivery. A campaign that performed well across Meta does not establish that Threads worked if Facebook or Instagram delivered most of the impressions. Compare the Threads result with the benchmark chosen before launch, and keep differences in audience, creative, and optimization settings visible.
For ChatGPT, the minimum evidence is verified delivery under the contracted impression definition. OpenAI has indicated that follow-up questions about sponsored products could become an engagement signal, but that possibility is not a current performance guarantee. Do not make a future field the cornerstone of today’s business case. If follow-up reporting becomes available, document its definition, privacy treatment, and relationship to downstream action before using it as a KPI.
Do not compare raw click-through rates across a feed ad and a unit beneath an AI answer as if the interfaces were interchangeable. Position, user task, billing, and available actions all differ. Compare each surface with the goal and benchmark assigned to that surface. Then compare investment decisions using business value and confidence in the evidence.
Make trust and brand safety part of campaign acceptance
Turn that principle into acceptance criteria. Before launch:
Review the actual unit or a faithful preview and confirm that the sponsorship label is visible without extra interaction.
Reject creative that imitates the assistant’s voice or implies that the organic answer endorsed the advertiser.
Check that every factual claim in the ad is supported on the destination page and remains accurate when removed from the surrounding conversation.
Document prohibited adjacencies, sensitive categories, escalation contacts, and the remedy available after an unsuitable placement.
Capture a dated preview or screenshot with the approved copy, destination, disclosure, and platform version so later changes can be audited.
For regulated or high-consequence claims, route the complete placement context through the appropriate legal or compliance review rather than submitting isolated ad copy.
A trust failure also damages measurement. If users cannot tell whether a recommendation is paid, engagement may reflect mistaken endorsement rather than persuasive advertising. A high interaction count under that ambiguity is not a clean signal to scale.
Keep paid exposure separate from organic AI visibility
Your reporting should have three lanes: paid social distribution, paid conversational exposure, and organic AI visibility. Combining them in one AI channel bucket makes every number harder to interpret.
Paid social distribution: Put Threads spend, impressions, placement delivery, response, and conversions here.
Paid conversational exposure: Put ChatGPT sponsored impressions and any defined ad interactions here. Keep the sponsorship label and placement type in the campaign record.
Organic AI visibility: Track whether assistants mention or cite the brand for a maintained set of relevant questions. Record the model, access tier, prompt, answer date, cited destination, and repeated observations because generated answers can vary.
A sponsored unit beneath a ChatGPT response does not mean the brand appeared in the organic answer. An organic Gemini citation is not paid delivery. Threads reach does not establish visibility in an AI assistant. Preserve those distinctions in campaign names, analytics dimensions, dashboards, and executive reporting.
The same boundary applies to technical optimization. JSON-LD, schema, clear entity information, and answer-focused content can be evaluated as parts of organic discovery, but the available ad plans do not establish them as levers for ChatGPT ad eligibility, Threads delivery, or a future Gemini auction. Give structured-data work its own validation and visibility objectives instead of attributing paid-media effects to it.
At your next budget meeting, create one row for each surface and fill in four fields: whether it is buyable, the single question the spend will answer, the evidence the platform can return, and the event that would unlock more budget. Fund Threads when you have a paid-social question and placement-level measurement. Fund ChatGPT when impression-led learning is valuable enough to justify limited performance evidence. Leave Gemini out of the paid forecast until a real product changes the decision. The useful early move is not simply being first; it is knowing what the first test must prove before you buy the second.
If ChatGPT advertising has reached your planning meeting, the immediate question isn’t whether to move budget. It is whether you can run a test that teaches you something without weakening trust. ChatGPT ads have entered the marketing landscape, but an emerging ad surface should be treated as an experiment, not a finished channel.
You don’t need a confident prediction about every format, targeting option, or pricing model. You need a campaign brief that survives uncertainty: a defined user decision, a verifiable claim, a useful destination, independent measurement, and rules for stopping or scaling. Build those pieces now and you can evaluate actual inventory on its merits when it is available to you.
Do not treat ChatGPT advertising as another search campaign
A conventional search campaign often starts with a query, a keyword set, and a landing page. A conversational environment starts with a person trying to resolve something. They may be defining a problem, comparing options, checking a claim, or looking for the next step. Your planning should begin with that decision state, even if the advertising product does not offer conversation-level targeting.
That distinction matters. Copying an existing search ad into ChatGPT may preserve the slogan while losing the reason the person would care. The better question is not, “What can we promote here?” It is, “What unresolved decision can we help the right person make?”
Give each campaign one primary job:
Introduce an option the person may not know exists.
Clarify a point that commonly blocks evaluation.
Support a comparison with evidence the person can inspect.
Offer a practical next step after the person understands the issue.
An ad that tries to do all of these at once will be difficult to understand and even harder to evaluate. Use a decision brief before anyone writes copy:
User state: What is the person deciding, and what do they probably understand already?
Question: What would they need answered before taking another step?
Claim: What useful, narrow statement can your brand make?
Proof: Where can the person verify that statement?
Disqualifier: Who should not click, sign up, or buy?
Next step: What is the smallest useful action after the ad?
Success event: What behavior would show meaningful progress rather than curiosity?
A compact objective can follow this pattern: when a person is in a defined decision state, present a verifiable claim, send them to the page that resolves the next question, and judge the test by a qualified action. If you cannot fill in every part, the campaign is not ready for budget.
Keep paid placement separate from AI answer visibility
Paid placement, an AI-generated response, and your destination page can appear within the same journey, but they do different jobs. Treating them as one system leads to two costly assumptions: that buying an ad will change what the AI says, or that an organic brand mention means the advertising worked.
Surface
Primary job
What you can prepare
Common mistake
Paid placement
Earn attention and invite a relevant next step
A narrow claim, suitable creative, budget limits, and explicit targeting assumptions
Presenting the ad as if the assistant independently recommended the brand
AI-generated response
Help the person understand or resolve the question
Clear content, consistent entity facts, current evidence, and valid structured data
Assuming media spend controls or improves the generated answer
Destination page
Prove the claim and move the decision forward
A direct answer, supporting evidence, relevant limitations, a clear action, and measurement
Repeating the ad without resolving the person’s next question
This separation is especially important for SEO, AEO, and GEO teams. Advertising can purchase an opportunity to be seen where inventory is offered. Organic AI visibility depends on whether systems can find, interpret, and use information about your brand. Neither outcome guarantees the other.
Run a message-parity audit before launch. Compare the proposed ad with the landing page, product documentation, policies, sales materials, and structured data. The same factual claim should have the same scope everywhere. If the ad says a capability is available, the destination should state what it does, who can use it, what conditions apply, and when the information was last reviewed.
Create a claim register with these fields:
The exact claim in plain language.
The page or record that substantiates it.
The owner responsible for keeping it current.
The markets, products, plans, or users to which it applies.
The event that should trigger another review, such as a pricing, policy, or feature change.
Use JSON-LD to describe facts that are also supported by the visible page. Choose schema types and properties that match the page’s real subject. Do not create markup that broadens a claim, hides an important limitation, or describes an offer the visitor cannot verify. Structured data can improve clarity and consistency; it does not turn an unsupported statement into truth or guarantee inclusion in an AI response.
Build a launch-ready test before you buy media
Emerging advertising products can change while teams are still planning around them. Keep the stable parts of your strategy separate from platform-dependent details. Your audience problem, evidence, landing experience, economics, and business outcome belong in the stable layer. Inventory, placement, targeting controls, reporting fields, and billing belong in the platform layer and must be verified at activation.
Write a falsifiable test thesis. Use the form: if a defined user state receives a defined claim and next step, a named qualified outcome should improve relative to a documented baseline. Avoid objectives such as creating buzz or seeing what happens.
Record what is known and unknown about the ad product. Verify available placements, sponsorship labels, audience or contextual controls, geographic and language coverage, exclusions, billing, reporting, data use, and content restrictions in the actual buying materials. Do not turn a screenshot, announcement, or assumption into a media plan.
Build the destination around the next question. Its opening should confirm that the visitor is in the right place. Put evidence close to the claim, state relevant constraints, and offer an action proportionate to the person’s readiness. A comparison visitor may need specifications or documentation before a sales form.
Create variants that test one meaningful difference at a time. You might test the framing of the problem, the supporting proof, or the proposed next step. If the claim, audience, destination, and call to action all change together, the result will not tell you what caused the difference.
Instrument the full journey. Use a dedicated landing URL or consistent campaign parameters where supported. Confirm that analytics records the intended onsite action and that your CRM or commerce system retains the acquisition source. Test the path yourself from landing visit to recorded outcome before approving spend.
Set decision rules in advance. Name the metric that permits scaling, the spend ceiling, the conditions that require a pause, and the person authorized to make each decision. This prevents a novelty-driven campaign from continuing merely because it produced traffic.
Run an adversarial review. Ask someone outside the campaign team to read the ad and destination as a skeptical prospect. They should be able to identify who the offer is for, what is being claimed, where the evidence sits, what happens next, and what important limitation applies.
Keep this material in a reusable launch packet. If the available ChatGPT inventory does not fit your decision state, measurement needs, risk limits, or economics, you can decline the test without discarding the strategic work. The same brief can guide organic content, another paid channel, or a later campaign when the product is a better fit.
Set trust guardrails and measurement rules together
Protect the boundary between assistance and promotion
A conversational interface can feel advisory. When a paid message appears close to a generated response, a person may infer a relationship between them even when the placement is separate. Your creative should not intensify that ambiguity.
Do not imitate the assistant’s voice in a way that hides the commercial role of the message.
Do not imply that ChatGPT independently selected, verified, ranked, or endorsed the product unless that precise claim is demonstrably true and permitted.
Make the sponsor identity and destination clear within the controls available to the advertiser.
Use claim language that remains accurate outside an ideal context. Avoid an unqualified best, guaranteed, safe, or suitable claim when the destination cannot substantiate it.
Do not assume that private conversational details are available for targeting. Treat every claim about contextual signals, audience creation, retention, and advertiser access as unverified until the platform documents it.
Route campaigns involving regulated or sensitive decisions through qualified legal, privacy, and compliance review before targeting or creative goes live.
Add an adjacency plan as well. Decide what your team will do if the ad appears near an unsuitable response, if a user interprets the placement as an endorsement, or if a product change makes the claim stale. The plan should identify who can pause the campaign, who captures evidence, who contacts the platform, and who corrects the destination or structured data. Waiting for an incident to establish ownership turns a manageable problem into a prolonged one.
Measure qualified decisions, not the novelty of the click
Early curiosity can produce visits without producing durable demand. A click therefore tells you that the placement earned attention, not that it reached the right person or changed a business outcome. Build a measurement ladder that distinguishes those stages:
Delivery: Did the platform serve the campaign as configured?
Qualified visit: Did the visitor reach the intended page and meet your predefined relevance conditions?
Decision behavior: Did the visitor inspect documentation, compare an option, check compatibility, begin a suitable workflow, or complete another meaningful step?
Business outcome: Did the journey produce a qualified lead, purchase, activation, or other result that the organization already recognizes?
Outcome quality: Did those results remain useful after the initial conversion, or did they produce avoidable cancellations, disqualification, support burden, or low-value activity?
Use platform reporting to understand delivery, your first-party analytics to understand onsite behavior, and your CRM or commerce records to understand downstream outcomes. If those systems disagree, investigate the definition and handoff before changing the campaign. A dashboard that blends incompatible events can look precise while answering the wrong question.
Where a credible comparison is possible, evaluate exposed and unexposed groups or use another controlled design. If the platform does not support that design, run a bounded pilot, compare it with a relevant baseline, document competing explanations, and label the conclusion as directional. Do not present last-click attribution as proof that the ad caused the result.
Scale only when business outcome and outcome quality move in the same direction. If clicks rise while qualified actions stay flat, the answer is not automatically more spend. Revisit the user state, message, placement, and destination. If conversions rise but quality declines, tighten qualification before expanding reach.
Key takeaways
Treat ChatGPT advertising as a bounded experiment until its available formats, controls, economics, and reporting fit your use case.
Plan around the person’s unresolved decision, not around a recycled search ad or a broad desire for awareness.
Keep paid placement, organic AI visibility, and landing-page conversion separate in your strategy and measurement.
Maintain message parity across ad copy, visible content, product documentation, policies, and JSON-LD.
Verify platform capabilities in the real buying materials instead of assuming conversational context is targetable or visible to advertisers.
Predefine evidence, spend limits, stop conditions, trust guardrails, and qualified outcomes before launch.
Your next move is a readiness review, not a forecast. Put the decision brief, claim register, destination, tracking map, and risk rules into a shared launch packet. When suitable inventory is available to your team, you will be able to run a controlled test, learn from it, and scale only when the result survives both a trust check and a business check.
Your Google Ads dashboard can show exactly the kind of growth that tempts a premature budget increase: more impressions, more clicks, and little movement in average cost per click. The difficult question is not whether more traffic is available. It is whether your next dollar will capture incremental demand or simply buy more low-intent visits.
In Q4 2025, Google search-ad spending rose 13% year over year while click growth reached its fastest pace since early 2021, and average CPC declined slightly for a second consecutive quarter. Google text-ad clicks also increased 9% and reached a 19-quarter high. That is an inventory opportunity, not a blanket instruction to spend. You still need to separate auction growth from profitable growth.
Treat click growth as an inventory signal, not a profit signal
Market-wide click growth tells you that advertisers are finding more opportunities to enter auctions. It does not tell you whether those additional clicks convert at the same rate, produce the same order value, qualify at the same rate, or generate the same margin as the clicks you were already buying.
This distinction matters when CPC is flat or falling. A lower price per visit can hide a weaker mix of traffic. If click volume rises faster than qualified demand, average CPC may look healthy while conversion rate, value per click, or lead quality deteriorates. You need to read those measures together rather than treating cheaper traffic as an outcome.
What you observe
What you need to test
What to do next
Clicks rise, CPC is stable, and value per click holds
Whether the added volume remains profitable after conversion lag
Increase the budget in a controlled tranche and compare marginal results with the established baseline
Clicks rise and CPC falls, but conversion rate or lead quality falls
Whether expansion is reaching earlier-stage or less relevant demand
Separate queries, audiences, products, locations, and inventory before allocating more money
Spend and clicks rise while total conversions remain flat
Whether the account has reached diminishing marginal returns
Hold the budget, inspect traffic mix, and repair targeting or the conversion path before scaling
Brand impressions rise while brand CTR declines
Whether search-result changes or broader query coverage altered the denominator
Judge absolute conversions, incremental brand value, and query quality instead of trying to restore CTR in isolation
Performance Max reports stronger results while total paid-search and shopping revenue stays flat
Whether attribution or campaign overlap is redistributing credited conversions
Evaluate the combined portfolio and test for incremental lift before moving more budget into automation
The key calculation is marginal performance. Average CPA divides all spend by all conversions. Marginal CPA divides the additional spend by the additional conversions produced after the change. The same logic applies to ROAS: use the additional conversion value generated by the additional spend. A campaign can have an attractive historical average and still be a poor destination for the next dollar.
Use the outcome closest to business value. An ecommerce account should move beyond platform revenue when product margin, cancellations, or returns materially change the economics. A lead-generation account should connect traffic to qualified opportunities or another agreed downstream stage, not assume that every form submission has equal value. If the sales cycle is long, wait for the account’s normal conversion lag before declaring the expansion successful or unsuccessful.
Annotate every material change before you make it. Record the campaign scope, budget, bidding change, targeting change, landing page, conversion definition, decision date, and expected review date. Without that record, a rising market can make an ordinary account change look more effective than it was.
Give new clicks a job before you give them a budget
Some of the additional search activity may be coming from a broader funnel. AI-enhanced search experiences are one plausible contributor to greater query volume, including commercial queries, but they are not the only explanation. Retailer participation and inventory mix also changed during Q4 2025. Build your strategy around observable intent and business outcomes rather than assuming one cause for all of the growth.
Assign every campaign group a clear job. That gives you a fair way to evaluate clicks that arrive at different stages of the buying process:
Demand capture: High-intent queries expected to produce revenue, qualified pipeline, or another primary conversion within the normal decision cycle.
Consideration: Earlier-stage queries that need an appropriate landing page and a defined path toward a measurable commercial action. Do not grade these clicks as if they were purchase-ready.
Brand coverage: Branded queries evaluated for incremental protection, message control, and conversion value rather than raw platform ROAS alone.
Product acquisition: Shopping traffic evaluated by product-level contribution, availability, and customer value, not just feed-wide revenue.
Exploration: New queries, products, audiences, or inventory funded from an explicit learning budget with a time limit and a decision rule.
Brand campaigns deserve particular care. Brand-keyword CPC growth slowed to 2% year over year in Q4 2025, while lower CTR was counterbalanced by strong impression growth, possibly reflecting the influence of AI Overviews on search behavior and result layouts. A falling brand CTR is therefore not enough to justify a bid increase or a campaign rewrite. First determine whether absolute brand clicks, conversions, conversion value, and incrementality changed.
Shopping requires a different reading. Google Shopping spend rose 16% year over year while average CPC fell 1%. Amazon’s withdrawal from U.S. Google Shopping auctions created space that Target and Walmart helped fill. That change in auction participation can make additional inventory appear more efficient even when consumer demand has not changed by the same amount. Treat lower CPC as a reason to test, not proof that the conditions will persist.
A practical permission-to-spend process looks like this:
Build a clean baseline. Separate brand search, non-brand search, Shopping, Performance Max, and any experimental inventory. For each group, record spend, clicks, primary conversions, value, and the downstream quality measure that matters to the business.
Define the acceptable marginal outcome. Decide what additional CPA, contribution, qualified-pipeline return, or marginal ROAS the business will accept before increasing the budget.
Rank the available cohorts. Give priority to campaign groups that are budget-constrained, have stable value per click, and still have relevant demand available. Historical average ROAS alone is not enough.
Fund the change as a testable tranche. Specify what is changing and leave other major variables stable where practical. A simultaneous budget, bid, creative, feed, and landing-page change leaves you unable to explain the result.
Wait for the relevant lag. Judge the added spend after enough time has passed for conversions and downstream quality to mature.
Choose explicitly. Continue, expand again, hold, or roll back. Do not allow temporary test spend to become a permanent baseline through inattention.
Other platforms can help you determine whether you are seeing broader demand or a Google-specific auction shift. Microsoft paid-search spend grew 16% year over year in the same quarter, but clicks grew 10% and CPC rose 5%; Amazon also remained present in Microsoft Shopping listings. Those different spend, click, and retailer patterns mean you should rebuild the unit economics for Microsoft rather than copying a Google budget allocation. The comparison is diagnostic: if demand quality rises across channels, the commercial opportunity may be broader; if only one auction changes, investigate that auction’s mix first.
Make Performance Max prove reach, not merely absorb it
Performance Max represented 62% of Google Shopping spend and 61% of sales in Q4 2025. Those two shares are close, but they are not a target and do not prove that Performance Max caused incremental sales. They aggregate many advertisers, and a share of attributed sales cannot answer what would have happened without the campaign.
The inventory mix also complicates the interpretation. Non-shopping inventory, including video and display, accounted for 39% of Performance Max spending, while YouTube video generated 13% of impressions outside search. These cross-format allocations inside Performance Max mean an apparent shopping strategy may also be funding reach well beyond product and search placements.
Before increasing a Performance Max budget, write an automation contract. It should define:
The business outcome: The sale, margin, qualified lead, subscription, or other result the campaign is meant to create.
The permitted scope: Eligible products, markets, locations, customer groups, and inventory roles. Make explicit what the campaign is not supposed to absorb.
The inputs: Conversion definitions, product data, creative assets, audience information, and business values that automation will use. Weak inputs do not become sound strategy because bidding is automated.
The guardrails: Budget ceiling, exclusions, brand treatment, product constraints, and any business rule needed to prevent technically valid but commercially poor traffic.
The evidence standard: The platform metrics and independent business measures required before you call the campaign successful.
The intervention rule: The condition that triggers investigation, a budget hold, or rollback. Define it before performance becomes contentious.
Then examine Performance Max at three levels. First, did total Google paid activity produce incremental conversion value or qualified demand? Second, did the mix shift among brand, non-brand, Shopping, video, display, new customers, and returning customers? Third, did the resulting customers retain their expected quality after refunds, cancellations, duplicate leads, and sales qualification were considered?
This wider view is especially important when low-cost inventory expands. YouTube spending increased 13% year over year as impressions rose 38% and CPM fell 18%. That large increase in impressions at a lower average media cost can be useful, but abundant reach is not equivalent to additional customers. A blended campaign can report more activity simply because automation found cheaper places to serve ads.
Automation can also produce an answer that looks coherent without being accurate enough for a budget decision. Strong paid-search management still requires the foundational knowledge to challenge automated outputs and distinguish useful signals from noise. Use the machine to execute within a strategy; do not let its allocation become the strategy by default.
Run the account like a decision system, not a bid console
Rising click volume puts operational weaknesses under pressure. More available traffic creates urgency, larger budget requests, and more cross-functional decisions about offers, creative, landing pages, inventory, and measurement. A technically correct campaign choice can still fail if ownership is unclear or the people needed to implement it are treated as obstacles.
Basic controls matter even on low-touch accounts. One such account went inactive because an insertion order expired without being caught, showing how missing check-ins and unclear shared oversight can erase otherwise sound campaign work. Budget sophistication cannot compensate for a lapse in billing, authorization, tracking, policy status, or conversion collection.
Use an operating cadence that connects platform activity to business decisions:
How the next budget tranche should be allocated across campaigns and platforms
The exact review frequency should match your spend volatility and conversion lag, but ownership should never be implied. Name the person responsible for checking each control, the person authorized to change spend, the stakeholders who must be consulted, and the deadline for escalation. Shared accountability works only when each part of the work has a visible owner.
Every material budget or targeting change should leave a short decision record containing:
The commercial problem or opportunity being addressed.
The hypothesis explaining why the change should improve the business outcome.
The exact campaigns, products, audiences, locations, or inventory included.
The baseline, primary success measure, and stop condition.
The owner, approver, implementation time, and review date.
The known risks, dependencies, and rollback action.
Communication is part of this control system. A policy-compliant recommendation can still weaken future execution when it is delivered as a public rebuke to the creative or commercial team. Frame an escalation in four parts: the constraint, the evidence, the business consequence, and the available choices. That keeps the discussion objective while giving stakeholders a path forward.
For example, do not stop at “this creative cannot run.” State which requirement is blocking it, what account or delivery risk follows, which compliant alternatives preserve the intended message, and who must approve the replacement. The tactical decision remains firm, but the relationship needed to execute the next campaign remains intact. Paid-search leadership requires both.
Key takeaways
Rising Google ad clicks indicate more available inventory; they do not establish that incremental clicks will be profitable.
Use marginal CPA, marginal ROAS, contribution, or qualified-pipeline value to decide where the next dollar goes. Historical campaign averages can conceal diminishing returns.
Separate demand capture, consideration, brand, product acquisition, and exploration so that every click is judged against the job it was funded to do.
Treat Shopping CPC changes cautiously when major retailers enter or leave auctions. A cheaper auction does not necessarily represent stronger consumer demand.
Evaluate Performance Max at the portfolio level because its budget can reach search, shopping, video, and display inventory.
Predefine ownership, success measures, stop conditions, review timing, and rollback actions before increasing spend.
At your next budget review, bring one page that shows traffic growth by campaign role, marginal business value after the normal conversion lag, and the owner and rollback rule for each proposed increase. Approve the next tranche only where all three are clear. That turns a favorable click market into a measured opportunity instead of an open-ended commitment.
You publish a social post, engagement climbs, and referral traffic barely moves. Soon afterward, your brand begins appearing more often in Google Search Console. If you judge the social work only by link clicks, you will miss the demand it created.
This is social media’s branded search halo: exposure creates curiosity, curiosity produces a search, and the search may eventually produce a visit or conversion. You cannot attribute every branded query to social, but you can measure the relationship well enough to improve campaigns, search pages, and cross-channel reporting.
The halo starts before the website visit
The person behind a branded search may never click the link in your social content. They might see a product demonstration, remember part of the name, and search later. They might encounter a founder’s argument on LinkedIn and look for that person’s interviews or podcast appearances. An influencer might mention a company without linking to it, leaving search as the easiest route to learn more.
Look for the halo in distinct query families rather than one combined branded total:
Company queries: the organization or brand name.
Product queries: a named product, service, feature, or collection highlighted in social content.
Person queries: a founder, executive, creator, or spokesperson associated with the social moment.
Mixed queries: combinations of the brand, product, person, and the subject that created interest.
Keep those families separate. A lift in a founder’s name tells you something different from a lift in a product name. The first may signal interest in expertise or reputation; the second is closer to product consideration. Combining them hides the reason people searched and makes the next content decision harder.
Build a branded baseline before you look for lift
A spike is meaningful only in relation to normal demand. Start by documenting what branded search usually looks like when no unusual social activity is underway. The goal is not to manufacture a perfect counterfactual. It is to create a consistent reference point that makes unusual movement visible.
Create a branded query dictionary. Include your company, products, campaigns, and public-facing people. Review actual query data so you capture the forms searchers use. Keep ambiguous names in a separate segment; a common name can produce impressions unrelated to your organization.
Choose the search measures you will preserve. Record branded impressions, clicks, click-through rate, and the query family. Call the metric what it is: impressions recorded for your property, not total market search volume.
Establish the normal pattern. Use a representative period that captures routine variation and is not dominated by the campaign you intend to evaluate. Keep the date grain consistent so social and search activity can be aligned without mixing incompatible intervals.
Maintain a social event ledger. For each meaningful moment, record the platform, account or creator, publication timing, content theme, name or product emphasized, link presence, reach, and engagement. Add launches, influencer mentions, and unexpected surges as they happen.
Annotate other demand-generating activity. Email, paid media, public relations, product announcements, events, and offline exposure can move branded search at the same time. If you omit them, a coincidental overlap may look like social attribution.
You can express the basic measurement without a complicated attribution model:
Branded search lift = observed branded impressions minus expected branded impressions from the baseline.
When the baseline is stable and nonzero, you can also calculate lift relative to that baseline. When normal demand is tiny or absent, percentages become misleading, so report the absolute change and show the underlying counts. Apply the same method to each query family instead of letting a large company-name segment overwhelm smaller product or founder signals.
Save this baseline and event ledger as an ongoing measurement system. Reconstructing them after a viral moment forces you to rely on memory, and memory tends to preserve the exciting event while overlooking overlapping campaigns.
Separate a credible signal from an attribution claim
Timing is the starting point, not proof. When branded impressions rise after social engagement, the two events are correlated. Your confidence improves when several independent clues point in the same direction.
Evidence that strengthens the connection
The sequence makes sense. Social reach or engagement accelerates before the branded search movement, not after it.
The queries match the content. Searchers use the product, person, phrase, or subject emphasized in the social material.
The segments move selectively. A founder-led social moment is followed by founder-name searches, or a product demonstration is followed by searches for that product.
The pattern repeats. Similar social moments produce similar search responses over time.
Downstream behavior supports real interest. Branded search visitors continue into relevant pages, engage with the site, or convert.
Evidence that weakens the connection
The search increase began before the social activity.
A launch, paid campaign, media mention, or email push reached the market at the same time.
The apparent lift comes from an ambiguous query that could refer to another entity.
Social engagement rises, but the terms featured in that content do not move.
The relationship appears only as an isolated fluctuation and does not recur around comparable moments.
Use language that reflects the evidence. “Branded search lift associated with the campaign” is defensible when timing and query alignment are strong. “The campaign generated every additional search” is not. Exact causal credit generally requires an experiment or a credible control, not a line chart with two peaks.
More branded demand is not automatically better demand. Pair impressions and clicks with landing-page behavior and conversions. A high-reach social controversy, a confusing claim, and a compelling demonstration could all send people to a search bar for different reasons. Query mix and on-site behavior help you distinguish attention from useful interest.
The same caution matters in AEO and GEO reporting. A branded impression increase shows that people searched for the entity. It does not prove that an AI answer mentioned, cited, or recommended it. Track those outcomes separately, then use shared timing and language as evidence of a possible relationship rather than treating one metric as a substitute for another.
Prepare the search experience for social curiosity
Measurement is only useful if it changes what you do. When a social moment is planned, the SEO work should be ready before people become curious. Waiting for branded impressions to spike means the first wave of searchers may encounter incomplete, inconsistent, or poorly matched information.
Identify the searchable objects in the social concept. Mark every brand, product, campaign, and person the audience may remember. Use the exact public names that will appear in the content.
Map each object to a useful destination. A product demonstration needs a clear product page. Founder-led content needs an authoritative biography and an easy route to interviews, talks, or podcasts. A brand mention needs a result that quickly explains what the company does.
Check message continuity. The names, descriptions, claims, and positioning on the website should match what the audience encountered socially. A searcher should not have to decide whether the social profile and search result describe the same company or product.
Remove the next-question gap. Ask what a curious viewer will want immediately after searching. Put that answer on the destination page and make the next action visible, whether it is reading an explanation, comparing an offering, finding an interview, or starting a purchase path.
Watch query mix while interest is active. If an unexpected product, person, or subject begins driving branded impressions, update the supporting content and internal paths while the demand still exists.
This preparation also improves your ability to interpret the data. When every query family has a relevant destination, weak engagement is more informative. It may point to a mismatch between the social promise and the search experience rather than a missing page or unclear navigation.
Consistency matters beyond conventional search results. Social profiles, website pages, biographies, product descriptions, and other public brand representations should use stable naming and compatible explanations. That gives people a coherent experience as they move among social discovery, search, and AI-mediated answers without requiring you to claim that consistency guarantees inclusion in any particular system.
Report the halo in a way that changes decisions
A useful halo report connects activity, response, quality, and context. It should let a social lead see what happened after exposure and let an SEO lead see what created the demand arriving in search.
Social trigger: platform, creator, content theme, timing, reach, engagement, and whether a link was present.
Search response: movement in branded impressions, clicks, click-through rate, and query-family mix relative to the baseline.
Site quality: the destinations reached, engagement behavior, and conversions from branded search.
Competing explanations: other campaigns, announcements, publicity, or events that could have influenced demand.
Decision: what to repeat, what search content to prepare, and what measurement weakness to fix before the next campaign.
A concise reporting sentence can carry the analysis: “After [social moment], branded impressions for [query family] moved [direction] against the established baseline; clicks and [site outcome] moved [direction]; overlapping activity included [known events]. We classify the relationship as [strength of association], not exact attribution.” Fill the brackets with observed evidence rather than promotional language.
Then apply the result:
Impressions rise but clicks remain flat: inspect the queries, visible search results, and available destinations. Do not automatically call the campaign a failure; the behavior may reflect awareness without a visit, but the search experience may also be losing interest.
Clicks rise but useful engagement does not: examine whether the destination fulfills the expectation created socially. The handoff may be attracting curiosity and then breaking it.
A theme repeatedly lifts the same query family: coordinate future social and search content around that demonstrated pattern instead of treating each channel’s editorial plan separately.
A founder or spokesperson drives person-name searches: maintain a current biography and a clear path to the material people are trying to find.
Social engagement rises without branded search movement: consider whether the content was memorable but the brand was not. Check naming, prominence, audience relevance, and query segmentation before drawing a firm conclusion.
Key takeaways
Social media can create branded search demand that referral traffic never records.
A useful baseline separates company, product, and person queries instead of reporting one branded total.
Timing, query alignment, repetition, and downstream behavior make a social-to-search relationship more credible, but correlation is not exact attribution.
Branded impressions reveal attention; clicks, engagement, and conversions help reveal its quality.
The practical payoff is coordination: prepare search destinations before social exposure and use repeated patterns to choose future content.
For your next meaningful social moment, open the event ledger before publishing. Record the normal branded pattern, name the queries the content is likely to trigger, and verify where each searcher should land. When demand moves, you will have enough context to act on it instead of merely admiring the spike.
You have Consent Mode running, but the harder question starts when a visitor denies ad storage: should your Google tag send a limited signal with identifiers removed, or send nothing until consent is granted? Google Ads Data Transmission Control gives you that choice.
This means consent denied is no longer a complete measurement policy. You need a decision for each data stream, a configuration that reflects it, and test evidence showing what actually leaves the browser in denied and granted states.
Key takeaways
Data Transmission Control works only when Consent Mode is enabled, and it applies only to Google tags.
When ad_storage consent is denied, advertising data can be blocked completely or transmitted in a limited form with identifiers removed. The limited option still supports conversion modeling.
Behavioral analytics and diagnostic data can be controlled separately from advertising data. Restricting one stream does not force the same choice for the others.
Once consent is granted, normal data transmission resumes automatically.
The setting enforces a technical choice. It does not determine whether that choice satisfies your privacy notices, consent policy, contracts, or applicable law.
What the control changes when consent is denied
Consent Mode communicates a visitor’s consent state to Google tags. Data Transmission Control adds another layer: your organization decides how those tags should behave when advertising storage has not been permitted. It does not replace the consent signal or create the visitor-facing consent choice.
Identifiers are removed, while the remaining signal can support conversion modeling.
Advertising data while ad_storage is denied
Block transmission
Advertising data is not transmitted until consent is obtained.
Behavioral analytics
Set independently
Analytics can remain allowed when advertising data is restricted, or it can be blocked separately.
Diagnostic data
Set independently
Diagnostic transmission can follow its own policy instead of automatically inheriting the advertising choice.
Consent granted
Automatic resumption
Data transmission resumes without someone manually changing the control.
The independence of these streams is the important part. A single denied consent state can produce several valid configurations. For example, you might block advertising data, allow behavioral analytics under a separately approved policy, and retain only the diagnostic data required to operate the tag. Another organization may block all three. The interface can support either approach; it cannot decide which approach is appropriate for you.
What Data Transmission Control does not cover
It does not work without Consent Mode. If your tags do not receive the correct consent state, this control has no reliable state on which to act.
It governs Google tags only. Third-party pixels, custom scripts, server integrations, and other non-Google data flows need their own controls and tests.
It is configured at the tag level. Do not assume that changing one Google tag creates an account-wide rule for every tag in your implementation.
It does not change existing behavior merely by becoming available. If the feature is not enabled, the current transmission behavior remains in place.
It does not certify compliance. Identifier removal is a technical treatment, not a legal conclusion about whether data is anonymous, exempt from consent, or permitted in a particular jurisdiction.
Choose a denied-state policy before opening the interface
The costly mistake is treating this as a measurement-team preference. The setting affects privacy posture, reporting coverage, and conversion modeling at the same time. Settle the policy first, then implement it in the interface.
Define the advertising rule. If your approved policy requires zero advertising-data transmission until consent, choose complete blocking. If limited identifier-removed transmission is permitted, decide whether retaining modeling support is worth enabling that option.
Assess behavioral analytics separately. Do not allow analytics merely because advertising data is blocked, and do not block it automatically merely because the advertising rule is strict. Record the purpose, data involved, consent treatment, and internal approval for the analytics decision.
Define what counts as necessary diagnostic data. Separate information required to detect a broken implementation from information that is merely convenient to retain. Apply the transmission choice approved for that purpose.
Resolve geographic or policy differences outside the toggle. If your rules vary by market, property, or user state, make sure the surrounding consent implementation supplies the correct state and scope. Data Transmission Control responds to the state it receives; it does not design your consent architecture.
Decide who can approve a change. A measurement owner can document the reporting consequence, but privacy or legal owners should resolve unsettled questions about permitted transmission. Do not ask the interface to settle a policy dispute.
Record the decision in a three-stream matrix
A short decision record prevents the configuration from becoming an unexplained toggle that nobody wants to touch later. For each of advertising, behavioral analytics, and diagnostics, record:
The behavior required when consent is denied.
The business or operational purpose for any permitted transmission.
Whether the stream is limited, allowed, or blocked.
The Google tags and digital properties covered by the decision.
The policy, privacy, or legal owner who approved it.
The implementation owner and the date of the change.
The evidence that will prove the configuration works.
Do not interpret identifiers removed as equivalent to no data or automatically compliant. If your organization has not classified the limited signal, keep transmission blocked while the privacy question is reviewed. Reduced measurement can be addressed later; data transmitted under the wrong policy cannot be recalled.
Configure the control without losing track of scope
Confirm that Consent Mode is enabled. Verify that the relevant Google tag receives a denied state when your consent system represents ad storage as denied.
Select the Google tag in scope. Record its name, destination, and current transmission behavior before changing anything.
Apply the approved advertising-data choice for denied ad_storage consent: limited transmission with identifiers removed, or complete blocking until consent is granted.
Set behavioral analytics independently. Match the decision record instead of copying the advertising choice by habit.
Set diagnostic data according to its approved purpose and scope.
Save the configuration and add it to your implementation change log. Include the previous behavior, the new behavior, the affected tag, and the person who approved the policy.
Repeat the review for every relevant Google tag. Then inventory non-Google tags separately, because this control does not govern them.
The control can also be set through the user interface in Google Analytics or Campaign Manager 360. Whichever interface you use, the underlying prerequisites and scope remain important: Consent Mode must be enabled, and the control applies to Google tags.
A saved setting is not proof of correct behavior. Your consent platform still has to pass the intended state, the intended Google tag has to receive it, and the resulting request has to match the selected transmission rule. Move directly from configuration to state-based testing.
Test the denied, granted, and transition states
Test what leaves the browser, not only what the consent banner displays. A banner can show denied while a tag receives the wrong state, and a correctly configured tag cannot compensate for that mismatch. Use your tag debugger and browser network inspection where applicable, and retain evidence from each test.
Start with a clean browser session. Trigger the state your consent platform represents as denied, then confirm that the Google tag receives that state before evaluating its requests. Testing only a mid-session toggle cannot prove the initial page load behaved correctly.
Check advertising transmission. Under complete blocking, confirm that the governed advertising data is not transmitted before consent. Under limited transmission, confirm that a request can occur only in the intended limited form and that the identifiers your policy prohibits are absent.
Check behavioral analytics independently. Its observed behavior should match its own setting, even when advertising data follows a different rule.
Check diagnostic transmission independently. Make sure operational data is neither blocked accidentally nor retained simply because another stream is allowed.
Grant consent in the same session. Confirm that data transmission resumes automatically and that no manual configuration change is required.
Repeat the test after navigation and in a new session. This checks whether the surrounding consent implementation preserves and communicates the state consistently; Data Transmission Control does not manage consent persistence for you.
Repeat the matrix for each Google tag in scope. Audit non-Google requests separately so that a successful Google-tag test is not mistaken for proof that the whole site follows the same rule.
Interpret reporting changes as implementation changes first
Changing denied-state transmission can create a measurement discontinuity. Moving from limited transmission to blocking removes a class of signals that could support conversion modeling. Moving in the other direction introduces limited signals that were previously withheld. A before-and-after difference should not be attributed to campaign performance until you have separated the effect of the configuration change.
Analytics and advertising totals may also diverge by design when behavioral analytics remains allowed while advertising data is blocked. Check the three-stream decision matrix before treating that difference as a broken tag or an attribution defect.
Add an annotation to your measurement records with the change date, affected Google tags, previous choices, new choices, and test results. Anyone evaluating campaign or conversion trends later will then have the context needed to avoid a false performance conclusion.
Your next step is concrete: write the three-stream policy, configure every Google tag in scope, and attach denied-state and consent-transition evidence to the change record. That turns a buried interface setting into an auditable control your privacy and measurement teams can manage together.
Your 2026 Google Ads plan can fail while the dashboard looks healthy. If a bidding system is rewarded for generating cheap leads, it will find cheap leads. It will not infer which leads became profitable customers unless that outcome returns to the platform as a usable signal.
The practical job is to decide where automation has earned freedom, where manual control still protects your budget, and which business result settles each spending decision. Use the framework below to audit an existing account or build your next planning cycle.
Set the optimization contract before changing campaigns
Every campaign needs an optimization contract: the business result you want, the event the platform can observe, the delay between those two events, and the guardrails that limit spending while the system learns. If those fields are vague, changing bids, match types, audiences, or creative only changes how efficiently Google pursues an undefined goal.
Separate the metric used to diagnose delivery from the metric used to allocate money. Cost per lead can tell you how cheaply a campaign generates leads. Customer acquisition cost tells you whether those leads become customers at an acceptable cost. ROAS can guide revenue-oriented decisions, but it still needs to reflect the revenue that matters to the business rather than an intermediate action.
A €2 range in lead cost concealed a €1,666 difference between the lowest and highest acquisition costs. The platform was not malfunctioning. It was following the cheaper-lead objective it had been given. This does not prove that exact match is always superior. It proves that a low-cost proxy was not safe enough to control budget in that account.
Build your optimization contract in this order:
Name the economic outcome. Decide whether the account must acquire customers, produce revenue, protect margin, or support another business-level result.
Identify the observable conversion. Write down what Google receives: a lead, qualified lead, completed purchase, subscription, or another recorded event.
Map the gap. Note what can happen between the recorded event and the economic outcome, including lead rejection, cancellation, discounting, or delayed sales qualification.
Record the reporting delay. Automation cannot respond promptly to a result that reaches the platform late. The longer the delay, the more carefully you need to control short-term interpretation.
Assign each metric a job. Use delivery metrics to diagnose auctions, business metrics to allocate budget, and financial metrics to judge whether growth is worth buying.
Set a spending boundary. Decide how much exposure you can tolerate while testing a new structure, signal, audience, or channel.
Do not increase live budgets while the account is optimizing toward a proxy you already know is weak. That turns a reporting gap into a real cash loss. Keep the test capped, improve the downstream signal, or stay with a structure you can inspect until the business outcome is visible.
Relevance: Does the conversion represent the result you actually want, or merely a convenient action such as an unqualified form submission?
Signal quality: Are duplicate, accidental, low-value, or rejected outcomes being counted in the same way as valuable ones?
Signal sufficiency: Does the campaign produce enough meaningful outcomes for the system to distinguish a pattern? Low-volume lead generation often needs more manual intervention than purchase-heavy ecommerce.
Signal speed: Does the platform receive the outcome soon enough to connect it with the decisions that produced it?
If a campaign fails any gate, do not pretend the answer is simply more automation. Improve the conversion path, return a better business event, consolidate fragmented signal where appropriate, or use tighter keyword and audience controls. Traditional structures remain useful when they expose differences that an account-level average hides.
Run a controlled graduation test
A graduation test should answer one question: can the more automated setup improve the business KPI without exceeding the risk you approved?
Choose a baseline whose tracking and economics you understand.
Define the candidate change, such as broader targeting or greater bidding freedom.
Keep the conversion definition, offer, and business KPI consistent enough to make the result interpretable.
Protect a comparison group or another credible baseline where the account structure permits it.
Judge the result on CAC, ROAS, margin, or the chosen business outcome. Use CPL and other platform metrics to explain the result, not replace it.
Expand only after the candidate passes. If it fails, diagnose the signal or structure before increasing spend.
This framing prevents a common mistake: letting the automated campaign grade itself using the same proxy it was instructed to maximize. The platform can report that it produced more conversions, but your business records must decide whether those conversions were worth buying.
Build measurement that can settle a budget decision
Delivery layer: Use platform data to understand spend, auction participation, search impression share, and the actions recorded by the campaign.
Acquisition layer: Connect leads and purchases to qualified prospects, customers, revenue, and the CAC or ROAS used to manage the account.
Financial layer: Check whether the acquired business preserves enough margin to justify further investment.
Write down the system of record for each layer. Then document why the figures may differ. A platform may credit an ad interaction while your business system counts only a completed customer. Those numbers answer different questions; forcing them to match can be less useful than making the difference explicit.
Reporting delay deserves its own field in your dashboard. A campaign can appear efficient before rejected leads, cancellations, or downstream sales outcomes arrive. Mark results as preliminary until the business outcome has had time to mature, and compare like-for-like reporting windows when making allocation decisions.
Use MMM only when the business has earned the complexity
Do you have reliable business outcomes rather than only platform conversions?
Is there enough meaningful variation across channels and periods to support useful analysis?
Will the model change a real budget decision that simpler reporting cannot answer?
Have you already fixed known tracking, CRO, and conversion-path problems?
If the answer is no, spend the next measurement dollar on the data foundation. Clean conversion definitions, stronger downstream reporting, and a better path from click to customer create value whether or not you eventually adopt advanced modeling.
Spend the next dollar on the constraint, not the trend
Give every creative test a decision card before production starts:
Question: What uncertainty will this test resolve?
Audience and context: Who should see the message, and in what situation?
Variable: Are you testing the pain point, proof, offer, format, or another defined element?
Business metric: Which downstream result determines the winner?
Next action: What will you pause, revise, or scale after the result?
If you cannot fill in those fields, pause production. The bottleneck may be tracking, conversion rate, offer clarity, customer journey, or product margin rather than a shortage of ads. Fixing that constraint can also produce better signals for the automation already running.
Turn 2026 Shopping promotion rules into an offer test
Google’s January 2026 Shopping policy expansion created practical room for merchants to compete on offer structure, not just the displayed price. Subscription promotions can include a free trial or a discount on initial billing cycles. Merchants can select Subscribe and save in Merchant Center or use the subscribe_and_save redemption option in a promotion feed.
Common retail abbreviations including BOGO, B1G1, MRP, and MSRP also became eligible. In Brazil, promotions can be restricted to particular payment methods, including digital-wallet cashback, by choosing Forms of payment in Merchant Center or using the forms_of_payment redemption restriction. That payment-method option was limited to Brazil, with no wider rollout announced at the time.
Use the additional eligibility as a disciplined merchandising test:
Choose an offer that fits the buying model, such as a subscription incentive for a genuine recurring product.
Calculate the effect of the free period, discount, or cashback on acquisition cost and margin before launching.
Configure the matching redemption type in Merchant Center or the promotion feed.
Make the ad, promotion data, price, and landing experience agree so the customer receives the offer they were shown.
Compare the business result with the existing offer, including customer quality and margin rather than conversion rate alone.
Verify the current Merchant Center policy before launch because eligibility rules can change.
Policy eligibility is not evidence that an offer is profitable. A discount can improve conversion while weakening margin or attracting customers who do not continue after an introductory subscription period. Let the business outcome, not the promotion badge, decide whether the offer remains funded.
The available capabilities include Google audience activation, reach across connected TV and YouTube, household-level frequency management, curated sports packages, and platform-reported links between CTV impressions and purchases. These controls make a test more manageable; they do not make the inventory automatically incremental or profitable.
Before moving money into live sports or other premium CTV inventory, require clear answers:
Are you trying to reach households that the current mix does not reach, or merely buying a more prestigious placement?
Does the creative make sense on the large screen and connect coherently with the follow-up experience on YouTube or another Google surface?
Can your measurement distinguish platform-attributed purchases from a credible business lift?
Is the test budget ring-fenced so a disappointing result does not weaken proven demand-capture campaigns?
What result will cause you to expand, revise, or stop the buy?
Live sports is outside narrow search PPC, but it belongs in the same portfolio decision when one team manages Google investment across screens. Do not move money from a profitable search campaign simply because premium inventory has become easier to buy. Fund it when the account has a reach problem, suitable creative, usable measurement, and an approved loss limit.
Key takeaways for your 2026 PPC plan
Make a business KPI such as CAC, ROAS, or margin the authority for budget allocation; use platform metrics to diagnose how campaigns produced the result.
Grant automation more freedom only when conversion signals are relevant, clean, sufficiently frequent, and returned promptly.
Keep manual keyword, audience, and budget controls when low volume or weak downstream data prevents reliable automation.
Do not scale creative output without a defined hypothesis, business metric, and decision that the test will unlock.
Repair tracking, CRO, and conversion paths before adding MMM or another layer of measurement complexity.
Use expanded Shopping promotions and biddable CTV inventory as controlled business experiments, not automatic claims on incremental budget.
Before your next budget meeting, create a one-page contract for every major campaign: economic outcome, observable conversion, reporting delay, and spending boundary. Any proposed expansion should explain how it improves one of those fields or why the existing contract is strong enough to support more risk.