Category: Search Features

  • Google Search Favicon Bug: Diagnose It Without Guessing

    Google Search Favicon Bug: Diagnose It Without Guessing

    Your branded search result suddenly shows a generic globe instead of the favicon people associate with your site. The natural reaction is to change the icon, edit the site template, or start looking for a technical SEO failure. During a confirmed Google-side incident, those changes can create a second problem without fixing the first.

    Your immediate job is to determine whether the failure is on your site or inside Google Search. A short, evidence-based check will help you preserve a clean baseline, avoid unnecessary production changes, and measure any click impact without jumping to conclusions.

    A default globe can be Google’s failure, not yours

    Google has confirmed that improperly displayed favicons were caused by an issue on its end. Affected results showed Google’s default globe icon when Search could not display the site’s proper favicon.

    It’s an issue on our end. We identified the issue and we’re addressing it as quickly as we can.

    Rajan Patel, Google VP, Engineering for Search

    The recovery was uneven. Some favicons returned while other sites, including LinkedIn, still showed the generic icon. That matters when you diagnose your own result: one remaining broken favicon does not necessarily mean your implementation is faulty, and one recovered result does not prove the incident has ended everywhere.

    A globe icon is a search-presentation symptom. By itself, it does not establish that your rankings, content, structured data, or crawling have failed. The immediate concern is visual recognition. A distinctive favicon can help your result stand apart, while a generic icon could make the listing less recognizable and potentially reduce clicks. No quantified click loss has been established for this incident.

    Run a scope check before changing the site

    An isometric diagnostic scene shows a healthy website and favicon path on one side and a separate search indexing cloud producing a generic globe on the other.

    Do not begin with a fix. Begin by recording exactly where the symptom appears. That distinction protects you from replacing a working favicon merely because Google is temporarily displaying it incorrectly.

    1. Capture the affected search result. Save the query, result URL, visible icon, observation time, and a screenshot. This gives you evidence to compare against later instead of relying on memory.
    2. Open the site normally and confirm that its favicon still appears where you expect it, such as in the browser tab. This does not prove Google can retrieve or display it, but it tells you whether the icon has obviously disappeared from the site itself.
    3. Sample more than one result from your domain. Check the homepage and representative internal pages when they appear in Search. Record whether the globe affects every observed result or only a subset.
    4. Look at unrelated domains in the same search environment. Generic icons appearing across several sites make a platform-side display problem more plausible. A symptom confined to your domain deserves closer site-side investigation.
    5. Review recent deployments before assigning a cause. Note any changes to the favicon file, document head, theme, site framework, domain configuration, or asset delivery. A coinciding deployment does not prove responsibility, but it prevents you from overlooking your own change while a wider incident is underway.

    The browser check and the search-result check answer different questions. A favicon that works in a browser shows that an icon is available to ordinary visitors. It does not guarantee that Google’s search interface has processed and displayed it correctly. Treat it as one piece of evidence, not a complete validation.

    Choose your next move from the pattern you see

    The safest response depends on the combination of symptoms, not on the globe icon alone.

    What you observeWhat it indicatesWhat to do next
    The favicon is missing on the site and in SearchA site-side problem remains possibleInvestigate the favicon asset and the site changes that control it before treating the issue as Google’s bug
    The favicon works on the site, while your result and unrelated results show globesThe pattern is consistent with the acknowledged Google-side incidentDocument the evidence, keep the working implementation stable, and monitor representative results
    Only some URLs from your domain show the globeSearch may be displaying or recovering favicons unevenlyTrack the same URL sample and avoid a sitewide change based on one result
    The correct favicon returns without a deploymentThe recovery is consistent with a platform-side resolutionPreserve the before-and-after evidence and continue checking until the result is stable
    Your domain remains affected while broader results recoverThe general incident no longer explains the whole patternReopen the site-side investigation and compare the persistent failure with your recorded baseline

    Do not change JSON-LD because of a favicon-only symptom. A generic search icon is not evidence that your schema markup is broken. The same restraint applies to page titles, descriptions, content, and unrelated technical settings. Changing several search-facing elements at once destroys the baseline you need to tell whether Google’s recovery or your intervention produced the result.

    Google’s statement also did not provide a firm completion time. Treat “as quickly as we can” as an acknowledgement of active work, not as a recovery deadline. Recheck at a consistent interval that suits your reporting cycle, but do not promise stakeholders a date Google has not supplied.

    If you need to brief a client or internal team, use language tied to facts you have verified: “Google has confirmed a Search-side favicon issue. Our favicon remains available on the site, and the current symptom matches the acknowledged incident. We are keeping the implementation stable while monitoring representative results and search performance. We will investigate site-side causes if the evidence begins to diverge from the broader recovery.” Remove any sentence you have not personally verified for that property.

    Measure click risk without inventing a causal story

    Two streams of anonymous visitors pass unlabeled search results with different favicon symbols while an observation lens and surrounding device and position shapes suggest multiple influences on clicks.

    The practical business risk is a possible reduction in recognition and clicks. “Possible” is important. The incident does not come with a universal click-through loss, and your aggregate traffic can move for many reasons while the favicon is broken.

    Annotate when your team first observed the globe and when the proper icon returned. Then compare like with like in your search performance data: the same queries, the same pages, and broadly similar visibility. Review impressions, position, click-through rate, and clicks together. A click decline accompanied by lower rankings or a different query mix cannot be assigned cleanly to the favicon.

    Separate branded queries from non-branded queries where your reporting allows it. The favicon’s role in recognition makes branded results a sensible place to look, but even there, correlation is not proof. Record the observation as a possible presentation effect unless your own controlled evidence supports a stronger conclusion.

    Most importantly, do not rewrite titles, descriptions, or page content in response to a favicon-only change. Those edits can alter click behavior independently and make the incident impossible to evaluate. Preserve the current snippet components while Google resolves the display problem.

    Key takeaways for site owners and SEO teams

    • Google acknowledged that the broken-favicon incident originated on its side.
    • A default globe in Search does not, by itself, prove that your favicon file, rankings, schema, content, or crawling are broken.
    • Confirm that the favicon still works on the site, sample multiple search results, review unrelated domains, and record recent deployments before deciding what failed.
    • Keep a working implementation stable while the observed pattern matches the wider incident. Unnecessary changes remove your diagnostic baseline.
    • Track possible click effects with comparable query and page data. Do not claim a favicon-driven loss when rankings, impressions, or query mix also changed.
    • Google did not provide a firm recovery deadline, so communicate the confirmed status and your next monitoring step without promising a date.

    Capture your baseline now and monitor the same representative results. If the proper icon returns without a deployment, close the incident only after the recovery remains stable. If the favicon also fails on your site, or your domain stays broken as the broader issue clears, you then have a sound reason to investigate the implementation rather than guess.

    References


  • Google Sign-In Gates for More Search Results: An SEO Guide

    Google Sign-In Gates for More Search Results: An SEO Guide

    If you are checking a keyword and Google stops after several result pages with a request to sign in, do not record the blocked page as a lost ranking. A limited Google Search test has required an account sign-in to verify that the searcher is human and reveal more results. The prompt appeared after someone moved beyond the first few pages. That is an access event, not evidence that the underlying results disappeared.

    For SEO teams, that distinction matters. A sign-in gate can interrupt a manual audit, rank tracker, competitive-research workflow, or search-results API without changing the rankings those systems are trying to observe. Your immediate job is to identify the measurement failure, preserve the uncertainty, and avoid turning missing data into a false performance alert.

    What Google appears to be testing

    In the observed flow, Google asked the searcher to sign in to continue after navigating beyond the first few search-result pages. The message framed sign-in as a way to verify that the user was human and provide additional results. A CAPTCHA would normally serve that verification role, so requiring an authenticated account introduces a different kind of barrier.

    The scope is still uncertain. The behavior has been described as a limited test, and there is no confirmation that Google will apply it widely. There is also not enough evidence to define its precise trigger, affected environments, frequency, or duration. One screenshot or one blocked session cannot establish a global rollout.

    Keep the layers separate. Google can restrict access to another page of results without removing those results from its index or changing their order. The prompt also does not prove that the additional results would differ after sign-in, that authentication changes ranking, or that every signed-out user will encounter the same limit.

    Key takeaways

    • The sign-in gate has been observed as a limited test, not a confirmed universal Search feature.
    • It appeared after several result pages, so the immediate risk is reduced access to deep-result data rather than a demonstrated loss of search visibility.
    • A blocked or incomplete retrieval must not be translated automatically into “not ranking.”
    • Manual checks, rank trackers, and search-results APIs may encounter different access conditions, so record how each observation was collected.
    • Change your measurement and reporting workflow before changing content, schema, or SEO strategy.

    Separate a ranking change from a collection failure

    A split scene contrasts stable search-result cards with a data-collection pipeline interrupted by a locked checkpoint.

    A rank tracker typically has to request a results page, parse its contents, and continue far enough to find the tracked domain. A sign-in challenge can stop that sequence before the domain is reached. If the system treats every interrupted search as a completed search with no match, the dashboard may show a dramatic ranking loss that never occurred.

    The correct result is not always a position. Sometimes it is a status: the measurement was blocked before the requested depth. That status may be less satisfying than a number, but it is more accurate and far safer for decision-making.

    What you seeWhat it supportsWhat to do
    A visible sign-in prompt after several pagesAccess to deeper results was interruptedRecord the result as blocked and save the last successfully observed depth
    A tracker returns a blank value or “not found” without diagnostic detailA ranking loss is possible, but a collection failure has not been excludedInspect the collection status or ask the provider how authentication challenges are classified
    First-party search performance remains broadly consistent while deep-rank readings disappearThe case for an immediate visibility collapse is weakerAnnotate the measurement gap and wait for corroborating evidence before escalating
    The prompt appears in one browser or session but not anotherThe behavior is not consistently reproducible in the environments testedDocument both environments rather than selecting the result that fits your expectation

    None of these signals independently proves what the hidden ranking was. They help you decide whether you have evidence of a performance change or merely evidence that the measurement stopped early. That is the standard your reports should preserve.

    Use this diagnostic runbook when the gate appears

    An analyst compares generic search results, a browser checkpoint, network status, timing, and database indicators at a workstation.

    Handle the event as an observability incident. The aim is not to defeat the gate. It is to determine what was measured, what was not measured, and which decisions can still be supported.

    1. Capture the evidence. Save the query, time, market, language, device type, browser, signed-in state, network environment, visible prompt, and deepest result page reached. Take a screenshot if the check is manual. Without this context, a later reproduction attempt will tell you very little.
    2. Identify the last valid observation. Record the final page or result depth that loaded normally. Do not assign an artificial bottom position to domains that might have appeared beyond that point.
    3. Inspect the failure state. Determine whether the collector received a sign-in page, redirect, challenge, empty response, parsing error, or timeout. Those outcomes may look identical in a dashboard while requiring different treatment.
    4. Reproduce lightly. Try a normal signed-out session in a clean browser context. If your organization’s policies allow it, compare that with an ordinary signed-in manual session. Treat both as contextual observations, not as a canonical SERP. Repeated automated requests may trigger more controls and make the test less informative.
    5. Triangulate with first-party data. Review Google Search Console query and page performance, relevant landing-page traffic, and indexing signals. These datasets do not reproduce a manual results page, but they can show whether the supposed ranking collapse has corresponding visibility or traffic evidence.
    6. Preserve uncertainty in the report. Use distinct labels such as “observed,” “not observed within checked depth,” “blocked by challenge,” and “collection error.” A blocked check is not a zero, and a zero is not a verified rank.
    7. Require corroboration before acting. Investigate content, technical SEO, or ranking systems only when the apparent decline is supported by accessible SERPs, first-party performance data, or another reliable signal. Do not rewrite a page because one collector could not pass a gate.

    Questions to ask your rank-tracking provider

    • Can the platform distinguish a sign-in challenge from a completed search in which the domain was absent?
    • Does it expose collection coverage and error status alongside reported positions?
    • Will a failed retrieval overwrite the last valid position, or remain a clearly marked gap?
    • Can reports separate shallow observations from keywords that require deeper retrieval?
    • How are retries handled, and can repeated failures create misleading volatility?
    • Does the provider use authenticated accounts, and if so, what are the security, privacy, and policy implications?

    Do not place an employee’s personal Google credentials into an automated tracker simply to recover deep-result data. That creates security and account-governance risks while potentially changing the conditions under which the results are collected. If authenticated collection becomes part of a vendor’s method, it should be disclosed, controlled, and reviewed rather than improvised.

    Your dashboard also needs a coverage measure. A position chart without collection coverage can make missing observations look like genuine movement. Show how many scheduled checks completed successfully, how many stopped at a challenge, and how deep each successful check reached. When a retrieval fails, retain the prior observation with its original date if historical context is useful, but never present it as a fresh current ranking.

    What this changes for SEO, schema, and AI visibility

    For now, this should change your measurement practice, not your optimization strategy. The observed behavior concerns access to additional search results. It does not establish a change to crawling, indexing, ranking, structured-data processing, or selection by AI answer systems.

    Adding schema will not remove a Google sign-in gate. Rewriting a page will not make an interrupted tracker complete its request. Increasing publishing volume will not repair a collector that classifies an authentication challenge as “not found.” Those actions address different systems.

    Continue content, technical SEO, AEO, and GEO work when independent evidence supports it. If impressions, clicks, accessible rankings, indexation, and business outcomes point to a real decline, investigate the decline. If only deep-result collection fails, fix the reporting model and monitor the test.

    A wider rollout could make deep-result research less complete and force tracking providers to disclose more about coverage. It could also reduce the reliability of competitor lists assembled from a single automated collector. Prepare for that possibility by keeping raw status data, using more than one type of evidence, and distinguishing “unknown” from “absent.” Do not call it a rollout until the behavior is consistently documented beyond an isolated test.

    The next time the prompt appears, save the environment details, mark the observation as blocked, and check first-party performance before anyone changes a page. That small discipline prevents an access-control experiment from becoming a false SEO emergency.

    References


  • Google Brings Top Stories Into Mobile AI Overviews

    Google Brings Top Stories Into Mobile AI Overviews

    Google is placing news updates and Top Stories inside some AI Overviews, giving timely reporting a more prominent position within its AI-generated search experience. The change affects how mobile users may encounter coverage of developing topics and how publishers can earn visibility from those searches.

    Search Engine Land reports that a Google spokesperson confirmed the feature is fully rolled out in the United States on mobile. However, it appears only for some queries, so neither users nor publishers should expect it on every AI Overview.

    What Google has added to AI Overviews

    For eligible searches about developing subjects, an AI Overview can now include a prominent carousel featuring timely articles. This introduces a recognizable news-discovery element directly into a search feature that otherwise summarizes information and presents supporting links.

    The carousel can also highlight Preferred Sources, according to the announcement described by Search Engine Land. That connection matters because it gives users another way to encounter publishers they have chosen while exploring a topic through Google’s AI search interface.

    Key takeaways

    • Top Stories and news updates can appear within AI Overviews for some developing-topic searches.
    • Google confirmed that the rollout is fully live for mobile users in the United States.
    • The news carousel can feature Preferred Sources alongside other timely coverage.
    • The format may create additional opportunities for publishers to receive visits from Google’s AI search features.

    Why the placement matters to news publishers

    The practical significance is placement. A publisher link shown prominently inside an AI Overview may be easier to notice than one competing only in the conventional results below it. For news organizations, that creates a potential route from an AI-generated answer to the original reporting.

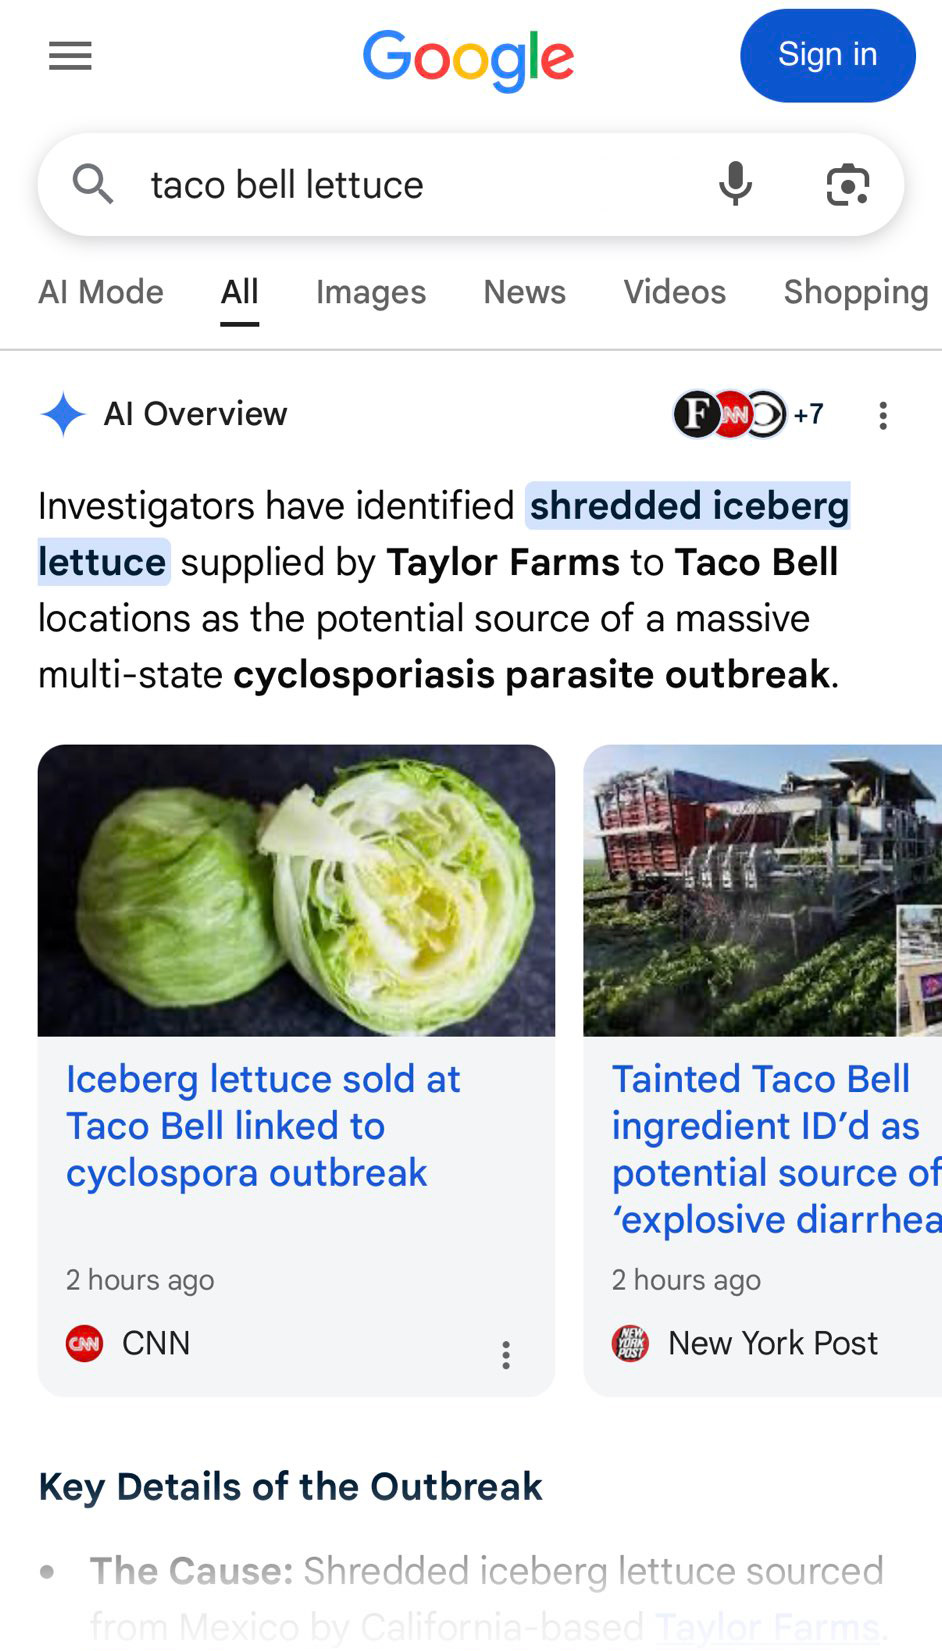
    Mobile Google results for "taco bell lettuce" showing an AI Overview and two news cards about a lettuce outbreak.
    A Google mobile search for "taco bell lettuce" displays an AI Overview naming shredded iceberg lettuce and news cards from CNN and the New York Post.

    That opportunity should not be mistaken for a guaranteed traffic increase. The source does not provide click-through data for this feature, and its availability is limited by query, device and geography. Actual results will depend on when Google displays the carousel, which sources it selects and whether users choose to open an article after reading the overview.

    Even with those caveats, the design addresses an important tension in AI search: summaries can satisfy part of a user’s information need before a website visit occurs, while prominent article links can give readers a clear path to fuller coverage. The new treatment could therefore be more consequential for publishers than a subtle citation or less visible source link.

    How editorial and SEO teams should respond

    The report does not identify a new optimization method or a special eligibility process. Publishers should therefore avoid treating the rollout as evidence of a new ranking formula. A more grounded response is to monitor whether timely stories begin appearing in these carousels and whether those appearances produce measurable referral traffic.

    Editorial, audience and SEO teams can evaluate the change through a few practical questions:

    Futuristic web browser and analytics dashboard overlap amid neon data streams, illustrating the convergence of SEO, PPC and AI-driven search marketing.
    Organic visibility, paid media and artificial intelligence merge into one connected search ecosystem, where vivid data streams link a creative website with a powerful analytics dashboard.
    • Do relevant mobile searches trigger an AI Overview with a news carousel?
    • Which publishers and article formats receive prominent placement?
    • Are Preferred Sources visibly represented when the feature appears?
    • Do analytics show changes in Google referrals to timely coverage?

    Observations should be separated from assumptions. Seeing a story in one result does not establish a repeatable tactic, while the absence of a carousel on a particular search does not mean the rollout is unavailable. Testing across suitable developing-topic queries can help teams understand the feature without overstating what limited examples prove.

    The broader direction for AI-powered search

    Search Engine Land connects this rollout to Google’s earlier announcement about adding fresh perspectives, updates and more prominent links to AI Overviews. Top Stories puts that direction into a concrete interface: timely source material is surfaced within the AI response rather than left entirely to the standard results.

    The next question is whether this visibility consistently translates into meaningful visits for publishers. Broader availability, clearer performance evidence and continued observation will be needed before the feature’s impact on news traffic can be judged.


    Inspired by this post on Search Engine Land.


    crushpress.ai community screenshot
  • Multimodal SEO for a Search Journey Built Around Images

    Multimodal SEO for a Search Journey Built Around Images

    Visual discovery is becoming a journey rather than a single search feature. People can encounter an idea in an image gallery, inspect it through a social video, refine it with a multimodal query and, in some cases, ask an AI search experience to generate a new visual without visiting a publisher.

    For search teams, the practical challenge is therefore larger than image optimization. Multimodal SEO must make pages, media, structured data and distributed brand profiles easy for machines to interpret and useful enough for people to continue exploring.

    Visual discovery is moving ahead of the conventional query

    Two reported Google changes illustrate how the opening stage of search may be changing. The Google Images redesign article describes a personalized, browseable homepage built around an immersive gallery rather than the service’s historically dominant search box. Search by text, voice or image reportedly remains available, but browsing, saving and returning to visual collections become more prominent parts of the experience.

    That distinction matters because a gallery can create demand before a person has formulated a precise query. Instead of asking for a known object, destination or style, a user can move among related images and gradually clarify an interest. Saved collections can also extend that process across sessions. In this environment, relevance is not limited to matching a typed phrase; an asset must also be suitable for recommendation, visual comparison and thematic grouping.

    The travel SEO source reports a parallel pattern in a commercially important category. It describes search results in which hotel tools, prices, maps, advertisements, directory modules and social videos can appear before a conventional organic listing. For discovery-oriented travel searches, it also reports short-form material from TikTok, Instagram and YouTube appearing within Google’s results. The Images report focuses on Google’s own gallery, while the travel analysis focuses on blended search surfaces, but together they point to the same strategic shift: discovery can happen through a sequence of visual modules without beginning or ending on a brand website.

    This does not make the website irrelevant. It changes its role. A site becomes one authoritative node in a larger system that may include image results, business listings, social profiles, video platforms, structured feeds and AI-generated answers.

    Multimodal visibility depends on interpretable page structure

    A layered webpage illustration connects images, video, page sections, and metadata-like nodes with luminous lines.

    Image quality alone cannot explain how a machine should understand a visually complex page. The visual-semantics source argues that document meaning is communicated through layout, hierarchy and function as well as text. Cards, calculators, comparison modules, tables, filters and buttons establish relationships that may not be expressed in an ordinary paragraph. A price beside one hotel image, for example, must not be confused with the price attached to an adjacent property.

    The source connects this problem to research and patents involving vision-based page segmentation, HTML-aware processing, structured information cards and layout-aware document understanding. These materials do not establish that every described method is a current ranking system. They do, however, illustrate the underlying retrieval problem: a search engine needs boundaries that reveal which labels, values, images and actions belong together.

    This makes multimodal SEO partly an information-architecture discipline. Semantic HTML, coherent component boundaries, descriptive headings and clear associations among captions, controls and media help define the meaning of a region. The objective is not decorative polish for its own sake. It is a page whose visible and structural hierarchies agree about the primary purpose.

    The same source discusses Google’s concept of a “centerpiece annotation” as a way of identifying primary content. It also reports a large programmatic case study in which a calculator was moved from the bottom of a page to the top and made visually prominent as part of 19 changes. Across more than 100,000 pages, the source reported clicks rising from 3.47 million to 4.53 million and impressions from 84.1 million to 167 million after the broader update. The author explicitly cautioned that the effect of the calculator could not be isolated perfectly, so the result should be treated as directional evidence rather than a controlled proof.

    The more transferable lesson is that a page’s principal utility should be easy to locate and extract. The travel analysis reaches a compatible conclusion from a different angle: concise entries, interactive maps and clearly separated itinerary, cost and timing information can serve fragmented user needs more directly than a long, undifferentiated guide. Both sources support designing content in meaningful modules, although neither justifies fragmenting a page merely to manufacture more components.

    Search assets now extend beyond images and webpages

    A multimodal strategy has to distinguish between assets a brand controls and experiences a platform assembles. On the controlled side are original images, page modules, video, structured data, inventory feeds and profile information. On the assembled side are galleries, carousels, maps, AI summaries and other interfaces that decide how those inputs are combined.

    The travel source makes this distinction concrete. It recommends treating real-time accommodation prices, availability, inventory, taxes and fees in Google Hotel Center as essential search infrastructure. It likewise emphasizes accurate Google Business Profile categories, amenities, location information and other attributes. Its argument is that visibility for a filtered request can depend on structured facts, review sentiment and geographic information, not persuasive destination copy alone.

    The same analysis treats social profiles as distributed landing pages because travelers may use public videos and posts for reassurance without reaching the primary domain. That approach implies consistent branding and factual context across each asset: the subject should be recognizable, the location should be unambiguous and the account should connect visibly to the business or entity it represents. The source also reports that Google Search Console introduced social and video content analytics, reinforcing the need to evaluate search exposure beyond conventional webpage clicks.

    Google’s reported addition of text-to-image generation inside AI Overviews introduces a different kind of competition. According to the source, the feature uses Google’s Nano Banana model to create a custom image from a prompt and was announced for English-language rollout in regions supporting image creation in AI Mode. Because the source describes an announced rollout rather than a mature outcome study, its traffic implications remain uncertain.

    Even so, the strategic tension is clear. A gallery can recommend an existing publisher image, while a generative interface can satisfy some visual needs by producing a new one. Publishers therefore cannot rely solely on being the nearest aesthetic match to a prompt. Assets gain defensibility when they carry information or evidence that generation cannot simply substitute: an original product view, a documented location, a useful comparison, a demonstration, a current inventory state or a recognizable brand perspective.

    A practical model for multimodal SEO

    Multiple cameras capture an object while connected image, video, three-dimensional, augmented-reality, and synthetic visual assets branch outward.

    A useful audit can examine four connected properties: findability, interpretability, usefulness and continuity. Findability asks whether important media and data are available to search systems through crawlable pages, supported feeds and public profiles. Interpretability asks whether the entity, subject, location and relationships among page elements are clear. Usefulness asks whether the asset helps someone compare, decide or act. Continuity asks whether the same facts and identity remain consistent as the journey moves between the website, image search, maps, social platforms and AI interfaces.

    At the page level, the audit should begin with the centerpiece. The principal image, tool or answer should align with the page title and visible heading, while unrelated navigation and promotional elements should not interrupt its meaning. Each repeated card or listing needs a stable internal structure so that its name, image, attributes, price and action remain associated. Mobile presentation deserves particular attention because a component that appears coherent on a wide screen can become ambiguous when its elements stack.

    At the asset level, optimization should preserve factual context rather than reducing every image to a keyword target. Descriptive surrounding copy, captions where they help readers, meaningful file handling and accessible alternatives all contribute to understanding. Originality should also have a purpose: a distinctive visual is more valuable when it demonstrates something, documents something or makes a decision easier.

    At the ecosystem level, the canonical business facts should agree across the site, feeds, profiles and public media. Measurement should then separate exposure from destination traffic. Search impressions and clicks remain useful, but they do not capture every discovery touchpoint described in the sources. Teams also need to watch the visibility of visual assets, engagement with off-site content, feed accuracy and the actions users take after arriving. Because the reported interfaces can satisfy needs within Google, a fall in click-through rate does not automatically reveal whether visibility, demand or commercial outcomes have weakened.

    Key takeaways

    • Visual discovery can begin with browsing and recommendation before a user enters a fully formed query.
    • Multimodal SEO includes layout, component boundaries and structured relationships, not just image files and alternative text.
    • Feeds, business profiles and social accounts can function as search assets alongside the primary website.
    • Generative images may reduce some visits for generic visual needs, increasing the value of original, factual and decision-supporting media.
    • Performance measurement should connect cross-surface exposure with user actions and business outcomes instead of relying on webpage clicks alone.

    The next advantage will come from connecting disciplines that are often managed separately: technical SEO, visual production, interface design, structured data, social distribution and analytics. As search becomes more capable of browsing, interpreting and generating visuals, the strongest assets will be those that retain clear meaning wherever the journey encounters them.

    References

  • How AI Discovery Is Moving Beyond the Search Results Page

    How AI Discovery Is Moving Beyond the Search Results Page

    AI discovery is expanding beyond the conventional search results page. Two emerging models illustrate the change: Google Discover is experimenting with natural-language feed controls, while Yahoo Scout combines AI-generated answers with content and services from across Yahoo’s properties.

    Together, the reported developments suggest that publishers may increasingly be discovered through declared interests, generated subqueries, citations and contextual recommendations. The opportunity is broader than ranking for one typed query, but each surface creates a different route from user intent to publisher visibility.

    Two AI discovery models with different user journeys

    Two people follow different AI discovery journeys, one through a personalized feed and the other through an answer connected to source cards.

    Google Discover’s experiment begins with a feed. According to the report on its natural-language tuning feature, users can ask to see more content about a topic, creator, publisher or content format. Google then interprets that request and adjusts the cards presented in Discover. The report described this as a shift from personalization based only on inferred behavior toward personalization that also accepts declared preferences.

    Yahoo Scout begins with a question or task. The Scout report described an AI answer engine available through its own website and integrated into Yahoo Search, News, Finance and Mail. Responses can include synthesized text, citations, source previews, tables, imagery and information drawn from Yahoo services.

    DimensionGoogle Discover tuningYahoo Scout
    Primary experienceA personalized content feedAn AI answer and assistant interface
    User signalA request to see more or less of a subject, source or content typeA question, follow-up or task expressed in conversational language
    Publisher exposureSemantically relevant cards selected through topic expansion or query-intent fan-outLinks, highlighted citations, featured sources and content cards within or around an answer
    Reported limitationEarly, cautious distribution with occasional loose matchesUnknown publisher click-through performance and room for more source links

    The distinction matters. Discover tuning influences what a person may encounter while browsing, whereas Scout responds to an immediate information need. One is an AI-directed recommendation layer; the other is an answer layer that can also become a gateway to the web.

    Declared intent creates new routes to publisher visibility

    The Discover report identified two apparent retrieval patterns. In entity or interest expansion, a prompt can lead to related topics, people, publishers or concepts. In query-intent fan-out, a broad request is translated into several narrower retrieval intents. A general interest in SEO, for example, was reported to produce more specific intents concerning strategies, ranking updates and Discover guidance.

    This fan-out process can widen the candidate pool. The report documented results from specialist publishers, individual creators and narrowly focused sites, including cases in which an article had no detectable previous circulation in the tracking dataset used for the analysis. That observation does not establish audience size or Search Console traffic, and the source cautioned that prompt-influenced cards did not appear to receive the broad amplification sometimes associated with conventional Discover distribution.

    The same report observed structured actions such as SEE_MORE and SEE_LESS, along with current and historical natural-language tuning pipelines. It interpreted the historical pipeline as evidence that a prompt may influence later feed sessions rather than only the next refresh. These findings came from feature tracking, however, so they should be treated as reported observations about an experimental system rather than a complete account of Google’s internal ranking process.

    Yahoo Scout offers another visibility mechanism: attribution inside a generated response. The Scout report described linked highlights, a featured-source area, citation previews and related article cards intended to make underlying publishers visible. Yahoo told the reporter that it wanted Scout to direct traffic to the open web, but it had not yet established an expected click-through rate. The company also said it planned to develop publisher impression and click reporting.

    These models change the discovery question for publishers. Visibility may depend not only on whether a page ranks for the user’s original words, but also on whether it matches a derived interest, answers one of several generated subqueries or provides material an answer engine can attribute clearly.

    A publishing strategy for feeds and answer engines

    An editor organizes multimedia content that flows toward a feed, an AI answer, and contextual recommendation cards.

    Make the site’s subject identity unmistakable

    Entity expansion favors a publication whose subject can be recognized consistently. Descriptive titles, focused sections, coherent internal linking and clear authorship can help a retrieval system understand what the site and its contributors cover. The aim is not to repeat a keyword everywhere, but to remove ambiguity about the publication’s domain and the purpose of each page.

    Cover the questions inside a broad prompt

    Query fan-out means one prompt may represent several related information needs. A useful page should state its scope early, use headings that reflect genuine reader questions and answer the important subtopics directly. This makes the content easier to retrieve for an intent that the user did not phrase exactly as the publisher did.

    Give answer systems attributable material

    Scout’s emphasis on citations makes source quality part of presentation. Publishers can support attribution by distinguishing facts from analysis, naming original sources, explaining methodology and keeping important claims close to their evidence. Concise summaries can help an answer system identify relevance, but the surrounding article still needs enough context for a reader who follows the citation.

    Measure each surface on its own terms

    A card shown because one person tuned a feed is not equivalent to a widely distributed recommendation, and a citation impression is not equivalent to a visit. Publishers should avoid treating all AI visibility as one metric. Useful distinctions include being retrieved, being visibly attributed, receiving a click and producing a meaningful on-site action. The source reports indicate that measurement remains incomplete: the Discover analysis relied on observed tracking data, while Yahoo said publisher reporting was still planned.

    Key takeaways

    • Google Discover’s reported experiment lets users declare feed interests in natural language, potentially opening a limited discovery path for specialist content.
    • Yahoo Scout uses an answer-engine model in which highlighted citations, featured sources and content cards can connect responses to publishers.
    • Clear topical identity supports entity-based discovery, while direct coverage of related questions supports retrieval through generated subqueries.
    • AI visibility should be separated into retrieval, attribution, referral traffic and on-site outcomes because the surfaces do not distribute content in the same way.

    What will determine whether these surfaces matter

    Neither report establishes a mature replacement for search traffic. The Discover feature was described as an early Search Labs experience with limited adoption and cautious distribution. Yahoo Scout was presented as a beta whose downstream click performance remained unknown, despite Yahoo’s stated intention to support publisher referrals.

    The next meaningful signals will be broader user adoption, dependable publisher reporting and evidence that citations or tuned recommendations produce sustained visits. Until then, publishers can prepare by making content semantically clear and easy to attribute while treating traffic claims about these new surfaces with appropriate restraint.

    References

  • Discover Google’s New Search Profiles for Publishers

    Discover Google’s New Search Profiles for Publishers

    Hey there, have you heard about Google’s latest feature within Google Discover? They’ve just launched Search profiles in the U.S., and it’s a game-changer for publishers like me. These profiles act as enhanced landing pages where my audience can not only follow me but also see a collection of my latest articles, videos, and social media posts all in one convenient spot.

    Google has been working on this for quite some time, refining and testing it over several months. They’ve even made some tweaks, such as adding shortnames, which make it even easier to share these profiles.

    What are Search Profiles? According to Google’s description:

    “Search profiles give publishers and creators a central place to showcase their latest articles, videos, and social posts. People can easily follow sources from their profile, so they’re more likely to see that content on Discover, found on the home screen of the Google app.”

    It’s described as a “new way for publishers and creators to shape their presence on Search. Search profiles are a dedicated, shareable space to highlight content across platforms and help audiences find accurate, up-to-date information about sources on Search.”

    What it looks like: Curious to see it in action? Here’s a video demonstration:

    Managing Your Search Profile: If you’re a publisher or creator with a significant following on a major social or video platform, you’re in luck! You’ll be able to claim your Search profile, personalize it with an avatar, bio, and links to your website and social media platforms.

    Once you claim your profile, it might even create a Knowledge Panel for you, or enhance your existing one with updated details and a direct link to your profile.

    If you’re interested in setting up your own Search profile, check out this guide for creating a profile, claiming an existing one, and managing it.

    Availability: Currently, this feature is available in the U.S. for users and publishers who meet a certain follower threshold. Here’s what you need:

    • TikTok: 300,000 followers
    • YouTube: 100,000 subscribers
    • Instagram: 100,000 followers
    • X: 100,000 followers

    Why This Matters: As a publisher, I’m always looking for ways to get more visibility. Google’s new feature allows us to increase our reach not just on Google platforms but across our entire digital presence. It’s an exciting time, though one has to ponder whether this will be enough in the fast-paced world where AI continues to evolve.


    Inspired by this post on Search Engine Land.


    crushpress.ai community screenshot
  • Unveiling Google Search Console’s AI Controls and Reports

    Unveiling Google Search Console’s AI Controls and Reports

    As someone who eagerly follows Google’s updates, I was thrilled to learn about the latest developments in Google Search Console. Recently, Google has started to roll out new Search Generative AI performance reports. These reports, along with a feature to block your content in AI responses, are designed to give website owners more control.

    Currently, these features are being introduced to a select group of website owners in the UK, but there are plans to expand access in the near future. This gradual rollout allows us to get accustomed to these changes before they become widely available.

    Exploring the Search Generative AI Performance Report

    The new AI performance report in Google Search Console is something I’ve been anticipating. Although it doesn’t cover everything, it does provide some important insights into how our content is performing within AI responses, AI Mode, and AI Overviews on Google Search. The report includes data on impressions, pages, countries, devices, and dates. However, a notable omission is click data, so we’re left guessing about the exact number of searchers clicking through to our sites from AI responses.

    Google stated:

    – We’re rolling out new insights for website owners regarding their pages’ appearances in generative AI Search features. These insights include impressions metrics and information on which pages appear in AI responses and in which countries. We’re working closely with website owners to determine what insights would be most helpful and will expand the metrics available over time. 

    Additionally, Google shared more details about the metrics we can expect:

    Impressions: Frequency of your site’s URLs appearing in generative AI features in Search and Discover.

    Pages: Identifying URLs that appeared within AI features.

    Countries: Understanding visibility on a country basis.

    Devices: Identifying the devices used to view your website. Available for Search results.

    Dates: Monitoring performance with hourly, daily, weekly, and monthly granularity.

    I inquired about click data from a Google representative, who mentioned that they are exploring additional metrics that will help inform our strategies in the future.

    Initially, this report is available to a subset of users in the UK, with plans to expand globally in the future.

    If you want to explore more about this report, I recommend checking out the Google help center document.

    Introducing AI Blocking Controls

    Another exciting feature Google introduced is the ability to block your content from appearing in AI search features like AI Overviews, AI Mode, or AI Discover. Google described this as a “new toggle” within Google Search Console, allowing us to decide whether or not our site should be part of these AI search features.

    Google notes that opting out will prevent your site from receiving traffic or impressions from these features. Importantly, this control won’t affect your ranking in standard search results outside of generative AI Search features, so there’s no risk of negatively impacting core web search visibility.

    Again, like the performance report, this toggle is currently available to a subset of UK website owners, with plans to widen access as they complete further testing. Google had promised these controls after facing some backlash from the EU, and it’s promising to see them starting to roll out now.

    One study even showed that 1/3rd of SEOs are willing to block Google from showcasing their content in AI search features.

    Why It Matters

    As site owners and publishers, many of us have been asking for control over how and if our content appears in Google’s AI features. Now, we have just that. Although it’s initially limited, I’m hopeful these features will eventually be available to all.

    Moreover, we’ve been requesting AI Search reporting from Google from day one. With Google’s announcement following Bing’s release of its own AI performance report, we’re taking a significant step forward. While Google’s report currently targets UK site owners and lacks click data, it holds promise for a global rollout soon.


    Inspired by this post on Search Engine Land.


    crushpress.ai community screenshot
  • Google Discover Controls and Reporting: A Publisher Playbook

    Google Discover Controls and Reporting: A Publisher Playbook

    Your Google Discover chart drops sharply, a stakeholder wants an explanation, and someone points to a recent publisher-profile change. Before you change the editorial calendar or undo the profile work, separate what Google displayed from what Search Console recorded.

    Discover profile controls, feed distribution, and performance reporting are connected surfaces, but they are not the same system. You need a different measurement plan for each one. This playbook shows you how to audit the controls you have, make profile links measurable, and keep unreliable reporting days out of consequential decisions.

    Key takeaways

    • Treat a Discover publisher profile as a brand and navigation surface, not as a proven ranking control.
    • Most profiles are still generated automatically. A monitored set of 46,926 profiles contained only 54 U.S.-based, English-language publishers with enhanced controls.
    • If you can add profile links, give every destination a stable UTM convention before publishing it. Otherwise, you won’t be able to separate profile visits from other Google traffic.
    • Search Console Discover clicks and impressions for May 7–8, 2026 are unreliable because of a confirmed logging error. Mark those dates as invalid data rather than treating the reported decline as lost visibility.
    • Preserve raw Search Console data, add a validity flag, and use first-party site analytics only as corroborating evidence. Different tools do not measure the same thing.

    Separate profile presentation, distribution, and reporting

    A publisher profile can influence how someone understands and navigates your brand after encountering it. Search Console reports what its logging system captured. Discover distribution determines whether and where content appears in the feed. A change in one layer does not automatically prove a change in either of the others.

    LayerQuestion it answersEvidence to useWhat it does not prove
    Publisher profileWhat can a user see or select after interacting with your publisher identity?Profile screenshots, available controls, tagged profile-link visits, and landing-page actionsThat a banner, link, or pinned post improved Discover ranking
    Discover distributionWas your content shown and selected in the feed?Valid Discover impressions, clicks, click-through rate, content-level patterns, and corroborating site outcomesThat every reported movement reflects an editorial or algorithmic change
    Search Console reportingWhat Discover activity did Google’s reporting pipeline log?Search Console data with incident annotations and validity flagsThat a logging gap represents a real loss of placement or audience

    This distinction changes how you investigate. If a profile link receives fewer tagged visits, inspect the link, label, destination, and profile exposure. If Search Console falls on dates affected by a known reporting incident, quarantine those dates first. If valid Discover data and independent site outcomes decline beyond the incident window, then you have grounds for a broader distribution, content, or technical investigation.

    Do not use correlation as a shortcut. Pinning a post shortly before a Discover increase does not demonstrate that the pin raised feed visibility. The pin may have changed profile engagement, while a separate distribution change affected the feed. Measure the outcome each control can plausibly produce.

    Audit the Discover profile you actually have

    A publishing specialist reviews a generic profile interface alongside image, link, mobile preview, and verification symbols.

    Google’s publisher profiles live at profile.google.com/cp/ and can appear when a user interacts with the publisher name on a Discover card. The profiles have existed since August 2025, but enhanced editing has not been made broadly available.

    Run the audit from the profile itself rather than from an internal assumption about what your organization should have. Save the date of the audit because access and profile presentation can change.

    1. Open your publisher profile and record its exact URL.
    2. Capture a full-page screenshot so you have a dated record of the banner, identity, links, social accounts, and visible posts.
    3. Look for the label “Profile generated by Google.” Its presence indicates the standard, automatically generated profile rather than the enhanced publisher-controlled version.
    4. Check separately for a customizable banner, a link shelf, pinned-post controls, and editable social links. Do not mark the profile as enhanced based on appearance alone.
    5. Record who in your organization can access the controls. Profile availability is not operational control if nobody owns the account or publishing process.
    6. Add the audit result to a simple register with four fields: profile URL, profile type, last checked date, and internal owner.

    The enhanced program remains highly selective. Monitoring across 46,926 publisher profiles found 54 U.S.-based, English-language publishers with advanced controls. Nearly half of that group consisted of regional newspapers and local television stations.

    That pattern describes Google’s selected cohort; it is not a public eligibility rule. There is no documented public application process for the enhanced capabilities. If your profile has no claim or editing option, do not treat the absence as a technical failure, and do not build a business case around an assumed rollout date.

    If you have a standard profile, verify what users see and retain evidence of any identity problem. Keep your publication name, visual identity, social destinations, and public site information internally consistent so the team can identify discrepancies without improvising a new brand treatment for Google alone.

    If you have enhanced controls, assign a job to each element:

    • Banner: communicate recognizable brand identity. Use a production-ready asset and review it on the live profile rather than approving it only from the design file.
    • Link shelf: route users to a small set of intentional destinations. Choose pages that answer a clear next-step need, such as current coverage, a section hub, a newsletter, or a subscription page.
    • Pinned posts: prioritize content for profile visitors. Log the start date, end date, and reason for every pin so later analysis has a usable timeline.
    • Social links: verify account ownership and destination accuracy. A visible link to an abandoned or incorrect account creates a brand problem even if it has no effect on Discover distribution.

    Professional banner treatments were common among the enhanced profiles, but link-shelf behavior differed by publisher type. Local television publishers frequently used links for site navigation, while national publishers used the feature less actively. Copying either pattern without considering your visitor’s next action misses the point. Your shelf should reflect the paths your audience actually needs.

    Make profile traffic identifiable before you optimize it

    A profile link without campaign tagging leaves you with an attribution problem. You may see traffic to the destination, but you cannot reliably distinguish a click from the profile shelf from another Google visit. Many publishers in the initial enhanced cohort did not add UTM parameters to their profile links.

    Set one naming convention before the first link goes live. A practical pattern is:

    • utm_source: google
    • utm_medium: discover_profile
    • utm_campaign: publisher_profile
    • utm_content: a stable identifier for the shelf position or destination, such as latest, local, newsletter, or subscribe

    A newsletter destination could therefore use: https://example.com/newsletter?utm_source=google&utm_medium=discover_profile&utm_campaign=publisher_profile&utm_content=newsletter.

    This is a recommended internal convention, not a Google requirement. Its value comes from consistency. Keep the medium specific to the profile so you do not merge link-shelf traffic with referrals that may come from the Discover feed itself.

    1. Create the final URL in your campaign register before entering it in the profile.
    2. Use lowercase values and fixed separators. Newsletter, NewsLetter, and news_letter become separate values in many analytics workflows.
    3. Open the live profile on a user-facing device and click the link. Confirm that it reaches the intended canonical destination without losing the UTM parameters during a redirect.
    4. Verify the visit in your analytics debugging or near-real-time view. Do not assume that a correctly formed URL is being collected correctly.
    5. Record the visible link label, destination, UTM values, publication date, retirement date, and owner.
    6. When replacing a destination, create a new utm_content value if the user promise changes. Reusing one identifier for unrelated links corrupts the history.

    Measure link-shelf work with profile-attributed sessions and the actions those visitors take on the landing page. Measure a pinned post with the same profile-specific evidence and its active dates. Do not use a change in overall Discover impressions as the success metric for either control unless Google establishes a ranking relationship that is not currently supported here.

    The banner needs a different standard. It is primarily a brand asset, so review visual clarity, publication identity, and suitability within the live crop. Do not manufacture a performance claim merely because the asset cannot be tied neatly to a conversion.

    Keep unreliable Discover data out of editorial decisions

    Editors separate a fragmented analytics tile from stable data tiles before using the reliable set for newsroom planning.

    Google confirmed that a data-logging error reduced reported Discover clicks and impressions for May 7–8, 2026. The problem affected reporting only; Google said it did not affect actual positioning in Discover.

    Those two dates should be treated as invalid observations, not as zero-performance days and not as evidence of an editorial failure. The distinction matters because a monthly total that includes understated days is incomplete even when the rest of the month is accurate.

    1. Preserve the raw values. Do not overwrite the export or dashboard table with an estimate. You may need the original record for auditability.
    2. Add a data-status field. Mark May 7 and May 8, 2026 as invalid because of the Discover logging error. A blank status should mean no known incident, not that someone forgot to review the date.
    3. Render the dates as a gap. On a trend chart, a gap communicates missing or unreliable information more accurately than a plotted zero.
    4. Label every affected total. If a weekly or monthly number includes the two dates, describe it as incomplete. Do not publish a clean percentage change as though both periods had full data.
    5. Avoid backfilling a guessed value. An interpolation may make the chart look continuous, but it converts an unknown measurement into invented performance.
    6. Check corroborating signals. Review site sessions, relevant landing-page activity, and business outcomes for the same dates. Use them to judge whether a separate traffic change may also have occurred, not to recreate exact Search Console clicks or impressions.
    7. Reopen the investigation when the pattern extends beyond the incident. A decline continuing on valid reporting days, especially when site outcomes also weaken, deserves content, distribution, and technical analysis.

    Your stakeholder annotation can be direct: “Google Search Console Discover clicks and impressions for May 7–8, 2026 are understated because of a logging error. Google said the incident did not affect Discover positioning. Totals containing these dates are incomplete.”

    Keep this note beside the chart, not in a separate document that viewers may never open. An anomaly ledger should also record the affected product, dates, metrics, stated impact, supporting link, dashboard owner, and decisions that must not rely on the compromised data.

    For recurring reporting, maintain two views. The raw view preserves exactly what Search Console returned. The decision view carries the same values plus incident flags and excludes invalid dates from calculations that require complete observations. This gives analysts an audit trail while keeping executives from acting on a known measurement failure.

    Do not let the reporting incident become a blanket explanation for every decline. If tagged profile visits fell because a shelf link broke, that is a profile implementation problem. If Discover performance weakens after May 8 on valid days, the logging incident does not explain the later movement. If only the two affected dates look abnormal, the responsible action is to annotate them and leave the editorial plan alone.

    Start with three concrete changes: capture your current profile state, establish a profile-specific UTM convention, and flag May 7–8, 2026 in every Discover report that includes them. The next time a chart moves, you will know whether to inspect the profile, the feed, or the measurement layer before anyone turns an unreliable signal into a strategy change.

    References

  • Google FAQ Rich Results Retirement: A Practical Action Plan

    Google FAQ Rich Results Retirement: A Practical Action Plan

    You may still have FAQ sections, FAQPage JSON-LD, reporting filters, and client promises built around Google’s expandable FAQ listings. The listing has gone away, but that does not mean every FAQ or every line of FAQ markup should disappear with it.

    Your job now is to separate the retired Google Search feature from the content and data that may still serve a purpose. That distinction will tell you what to remove, what to retain, and what to measure.

    What Google retired, and when each dependency changes

    Google ended support for FAQ rich results on May 7, 2026. The visible consequence is straightforward: adding valid FAQPage structured data no longer makes a page eligible for an FAQ rich result in Google Search.

    The retirement also affects the tools around the feature. Google’s announced schedule separates the wind-down into three operational milestones:

    MilestoneWhat changesWhat you should do
    May 7, 2026FAQ rich results stop appearing in Google Search.Stop treating FAQ markup as a Google rich-result opportunity.
    By June 2026Google planned to remove the FAQ search appearance, the dedicated rich-result report, and FAQ support in the Rich Results Test.Replace reports, tests, and documentation that depend on those surfaces.
    By August 2026Google plans to remove FAQ rich-result support from the Search Console API.Update API jobs before missing FAQ-specific data or filters can break them.

    These milestones affect eligibility, reporting, testing, and API access. They do not delete the visible questions and answers on your pages. They also do not establish that FAQPage markup is harmful. The retirement notice alone is not evidence of a penalty.

    Key takeaways

    • Stop approving FAQ schema work on the promise of a Google FAQ rich result.
    • Do not remove useful visible answers merely because the associated search enhancement has retired.
    • Keep the markup only when you can identify a remaining consumer or justify its maintenance cost.
    • Remove FAQ-specific dependencies from Search Console reports, alerts, dashboards, and API jobs.
    • Measure the change with page cohorts and query data, not a single sitewide before-and-after chart.

    Decide whether to keep or remove FAQPage markup

    There is no universal requirement to purge FAQPage from every site. The right decision depends on what consumes the markup, how it is maintained, and whether it remains accurate.

    DecisionUse it whenMain risk to control
    Keep itA verified non-Google search engine, application, internal knowledge system, or publishing workflow consumes it, and the data stays synchronized with the visible page.Do not assume another system uses the markup merely because it can parse JSON-LD.
    Remove itThe only documented purpose was Google FAQ rich-result eligibility, or the implementation produces stale, duplicated, or misleading data.Target FAQPage specifically so you do not erase unrelated structured data.
    Keep it temporarilyYou cannot yet identify every downstream dependency.Give the uncertainty an owner and review date so temporary markup does not become permanent by neglect.

    The phrase “other systems may use it” is not a business case by itself. Ask for evidence: a documented integration, a consuming application, a test that shows the data being ingested, or a named team that depends on the output. Without one of those, you are maintaining code for a hypothetical benefit.

    Retention also has a cost. Automatically generated markup can drift away from the visible answer, survive after an FAQ is deleted, or duplicate data emitted by a theme and a plugin. That creates audit noise and makes future structured-data incidents harder to diagnose. If no verified consumer remains, removing that unused layer is a reasonable cleanup.

    Audit the implementation before touching production

    1. Find every emitter. Search templates, plugins, block settings, custom fields, tag-management rules, and rendered HTML for FAQPage. Check both server-generated source and JavaScript-rendered output.
    2. Map pages to templates. Record the canonical URL, template or content type, markup generator, owner, and any known consumer. This distinguishes a centralized fix from hundreds of apparent page-level fixes.
    3. Check for duplicate output. A page may receive one graph from an SEO plugin and another from its theme or page builder. Removing one does not necessarily remove the other.
    4. Separate schema types. Confirm that the proposed change removes only the FAQ node and its intended relationships. Preserve unrelated Article, BreadcrumbList, Product, organization, or other data unless your audit finds a separate reason to change it.
    5. Verify visible parity. If you retain FAQ markup, each marked-up question and answer should still correspond to content a visitor can access on that page.
    6. Test a representative sample. Include different templates, locales, device-rendering paths, and pages with nested structured-data graphs. A successful test on one hand-built page does not prove that a shared template is safe.

    If you remove the markup, use a staged release or a small controlled page group where your publishing system allows it. Capture the prior output first, verify that the visible FAQ still works, and compare the full structured-data graph before and after deployment. A broad search-and-delete operation can remove braces, graph relationships, or neighboring schema that were never part of the retirement.

    Repair Search Console reports and API jobs before they fail silently

    An obsolete accordion-shaped module is disconnected from a linked browser, structured-data, reporting, and API workflow on a worktable.

    The reporting change deserves as much attention as the markup. A dashboard can keep loading while an FAQ filter returns no rows, a chart becomes permanently flat, or an alert stops firing. That is more dangerous than an obvious error because the report still looks operational.

    Inventory every place where FAQ search appearance is used: saved Search Console views, exported workbooks, business-intelligence models, scheduled reports, client templates, annotations, anomaly alerts, and API queries. For each dependency, decide whether to remove the component, replace it with page-level reporting, or preserve the historical series as a closed metric.

    1. Preserve available history. Keep any existing FAQ-specific exports with their original date range and definitions. Historical data remains useful for explaining why an old report or traffic pattern differs from a new one.
    2. Retire the metric explicitly. Label the series as discontinued rather than allowing it to fall to zero without explanation. A zero can be misread as an implementation failure.
    3. Remove brittle filters. Update queries and transformation steps that expect an FAQ appearance value. Jobs should handle its absence without discarding otherwise valid Search Console rows.
    4. Test empty and missing states. Confirm that dashboards, alerts, and API pipelines behave correctly when FAQ-specific data is unavailable, not merely when its value is zero.
    5. Update stakeholder language. Replace promises to “earn FAQ rich results” with goals you can still observe, such as answering a query clearly, improving organic engagement, or reducing duplicated support content.

    Do not merge the date of Google’s presentation change with the date you remove code. Record both. Otherwise, a later analyst may blame a traffic movement on your deployment when the search feature had already disappeared, or attribute a template change to Google when it happened weeks later.

    Measure the traffic effect without inventing causation

    An analyst compares two separate streams of abstract signals using transparent dividers and balanced measuring instruments.

    FAQ rich results could occupy extra search-result space and influence click behavior, so affected pages deserve closer monitoring. A sitewide organic trend will not isolate that effect. Most pages never had the same FAQ visibility, query mix, ranking stability, or search-result competition.

    Build a page cohort from URLs that carried FAQ structured data and, where your historical records allow it, distinguish pages that actually received FAQ search appearances from pages that were merely eligible. Eligibility is not the same as an impression.

    1. Choose a comparison group. Use pages with a similar purpose and query profile that did not depend on FAQ presentation. The comparison will not create a perfect experiment, but it is more informative than comparing the whole site with itself.
    2. Track impressions, clicks, click-through rate, and average position together. A click-through-rate decline while impressions and position remain broadly stable is more consistent with a presentation change than a simultaneous loss of rankings and visibility.
    3. Inspect page-query pairs. Brand queries, broad informational searches, and long-tail questions can behave differently. Page totals can hide one group falling while another grows.
    4. Annotate both the Google milestones and your deployments. Include the retirement, reporting changes, content edits, template releases, migrations, and other material SEO work in the same analysis window.
    5. Follow the business outcome. Check whether affected pages still generate the actions that matter, such as product discovery, qualified visits, support deflection, leads, or sales. A presentation loss matters differently when click volume changes but useful outcomes do not.

    A before-and-after chart cannot prove that FAQ retirement caused a change. Rankings, seasonality, query demand, competing search features, and your own releases can move at the same time. Use the cohort analysis to identify where investigation is warranted, not to manufacture certainty the data cannot support.

    Keep the answers, but remove the obsolete SEO promise

    A useful FAQ section can still solve a reader’s next problem. It can clarify eligibility, compatibility, pricing logic, implementation constraints, returns, terminology, or a decision that would otherwise send the visitor back to search. None of that value depends on an expandable Google result.

    Review FAQ content as content, not as a schema container. Keep a question when it represents a real decision or recurring point of confusion. Rewrite it when the answer is vague, promotional, outdated, or dependent on information that appears elsewhere. Remove it when it exists only to repeat a keyword or restate the main body.

    • Use the wording a reader would recognize, but do not create several near-identical questions for minor keyword variations.
    • Answer the question in the opening sentence, then add conditions, exceptions, evidence, or a next step.
    • Name the product version, location, customer type, plan, or other qualifier whenever the answer changes across those boundaries.
    • Link to a deeper page when the reader needs a procedure or full explanation; do not compress a complex guide into an evasive two-line answer.
    • Assign an owner to answers that depend on policies, features, prices, or other changeable facts.
    • Keep marked-up data synchronized with visible content if you decide to retain the JSON-LD.

    The same discipline helps answer-engine and generative-search work, but do not replace one unsupported promise with another. FAQPage markup is not a guaranteed route into an AI answer, citation, or model response. Clear visible content, precise scope, consistent entity information, and accessible supporting detail are useful publishing practices; none guarantees selection by a search engine or model.

    Be especially careful with thin FAQ pages created solely to win the retired enhancement. If a page contains unique information or attracts useful demand, improve it. If it duplicates a stronger resource, consider consolidation only after checking its traffic, links, internal references, and destination. Do not delete or redirect a URL merely because its structured-data feature disappeared.

    Turn the retirement into a controlled cleanup

    Start with a single inventory that joins code, content, reporting, and ownership. Give every FAQ implementation one status: retain for a verified consumer, remove as Google-only legacy code, or investigate because the dependency is unknown.

    Resolve the unknown group first. It carries the greatest operational risk: deleting it may break an unrecorded integration, while leaving it indefinitely creates unmanaged data. Once every row has an owner and reason, update the template, reporting pipeline, documentation, and stakeholder expectations as one change set.

    Your next concrete action is simple: search a rendered sample of each major page template for FAQPage, record what generates it, and write down who still consumes it. If no one can answer the last question, you have found the first dependency to investigate.

    References

  • Google’s Preferred Sources Now Available in Every Language

    Google’s Preferred Sources Now Available in Every Language

    When I learned that Google’s Preferred Sources feature now supports all languages, not just English, I was thrilled. This exciting update means more people can tailor their news experience, regardless of the language they speak.

    According to a recent post on Google’s blog, ‘Preferred Sources is now rolling out globally in all supported languages.’ This gives me, and everyone else, more control over the news we see on Search, allowing us to choose our preferred outlets to appear more frequently in Top Stories.

    It’s fascinating to reflect on how this feature initially rolled out in December, but was limited to English. Now, it’s a comprehensive tool available globally, no matter the language.

    Interesting Stats: Google shared some compelling data with this launch. For instance, readers are reportedly twice as likely to click on a site after marking it as a Preferred Source. Also, over 200,000 unique sites have already been selected by users—from local niche blogs to major global news platforms.

    Preferred Sources: This feature lets me star my favorite publications in the Top Stories section of Google Search. By doing so, Google uses that interest to show more stories from those sources. I learned it started in beta back in June and was initially available in the U.S. and India by August, but now it’s part of a worldwide expansion.

    How it Works: It’s simple! I just click the star icon next to the Top Stories header in my search results. This allows me to pick preferred sources, provided these sites are constantly updating their content.

    Once selected, Google promises to showcase more updates from my favorite sites in Top Stories, provided they have fresh content relevant to my search.

    For more detailed information, I can visit this page.

    Why it Matters: In the competitive area of Google Search traffic, marking my site as a preferred source can make a significant impact. Google indicated these users are twice as likely to engage, which could help in driving more traffic to my site.

    So, I’m adding the preferred source icon to encourage my audience to sign up. If you’re interested, you can make Search Engine Land a preferred source by clicking here.


    Inspired by this post on Search Engine Land.


    crushpress.ai community screenshot