I’ve often wondered how AI crawlers work differently compared to traditional bots, until I dove deeper into their world. My aim is to ensure my brand’s content is not only crawlable but also highly visible to Large Language Models (LLMs) and AI-driven search engines. Let me take you through this transformative journey.
The evolution from traditional bots to AI crawlers marks a significant shift in digital presence strategies. Knowing how to optimize for these sophisticated visitors is crucial for maintaining and enhancing brand visibility. Let’s explore what makes AI crawlers unique and how I can prepare my website to meet their demands.
I recently delved into the intricate world of Google Discover, uncovering how its 20 pipelines and 42 million cards shape the landscape for publishers. This exploration reveals how trends, news, videos, and advertisements flow through the digital pipelines, achieving broadcast-level reach for some content.
Metehan Yesilyurt’s SDK analysis brought the pipeline names to my attention, and I meticulously collected data over three months to decipher each pipeline’s function—including volume, reach, timing, and dominance. Let’s dive into what the examination of 42 million cards reveals about Discover’s inner framework.
Our journey took three months (December 2025 – February 2026), where I analyzed real Discover feeds from hundreds of devices. The result was the analysis of 42 million feed cards intricately linked to their selecting pipelines.
This analysis built on existing knowledge from the SDK, as you might have encountered in Metehan’s SDK Analysis. My objective was to illuminate what each pipeline actively accomplishes—how much content it picks, how many devices view it, the pace at which it operates, and which publishers it highlights. That’s the story my data tells.
Four metrics were computed for every pipeline:
Reach — the percentage of devices showing each URL daily
Speed — the median age of articles when they appear
Exclusivity — the percentage of URLs exclusive to the pipeline
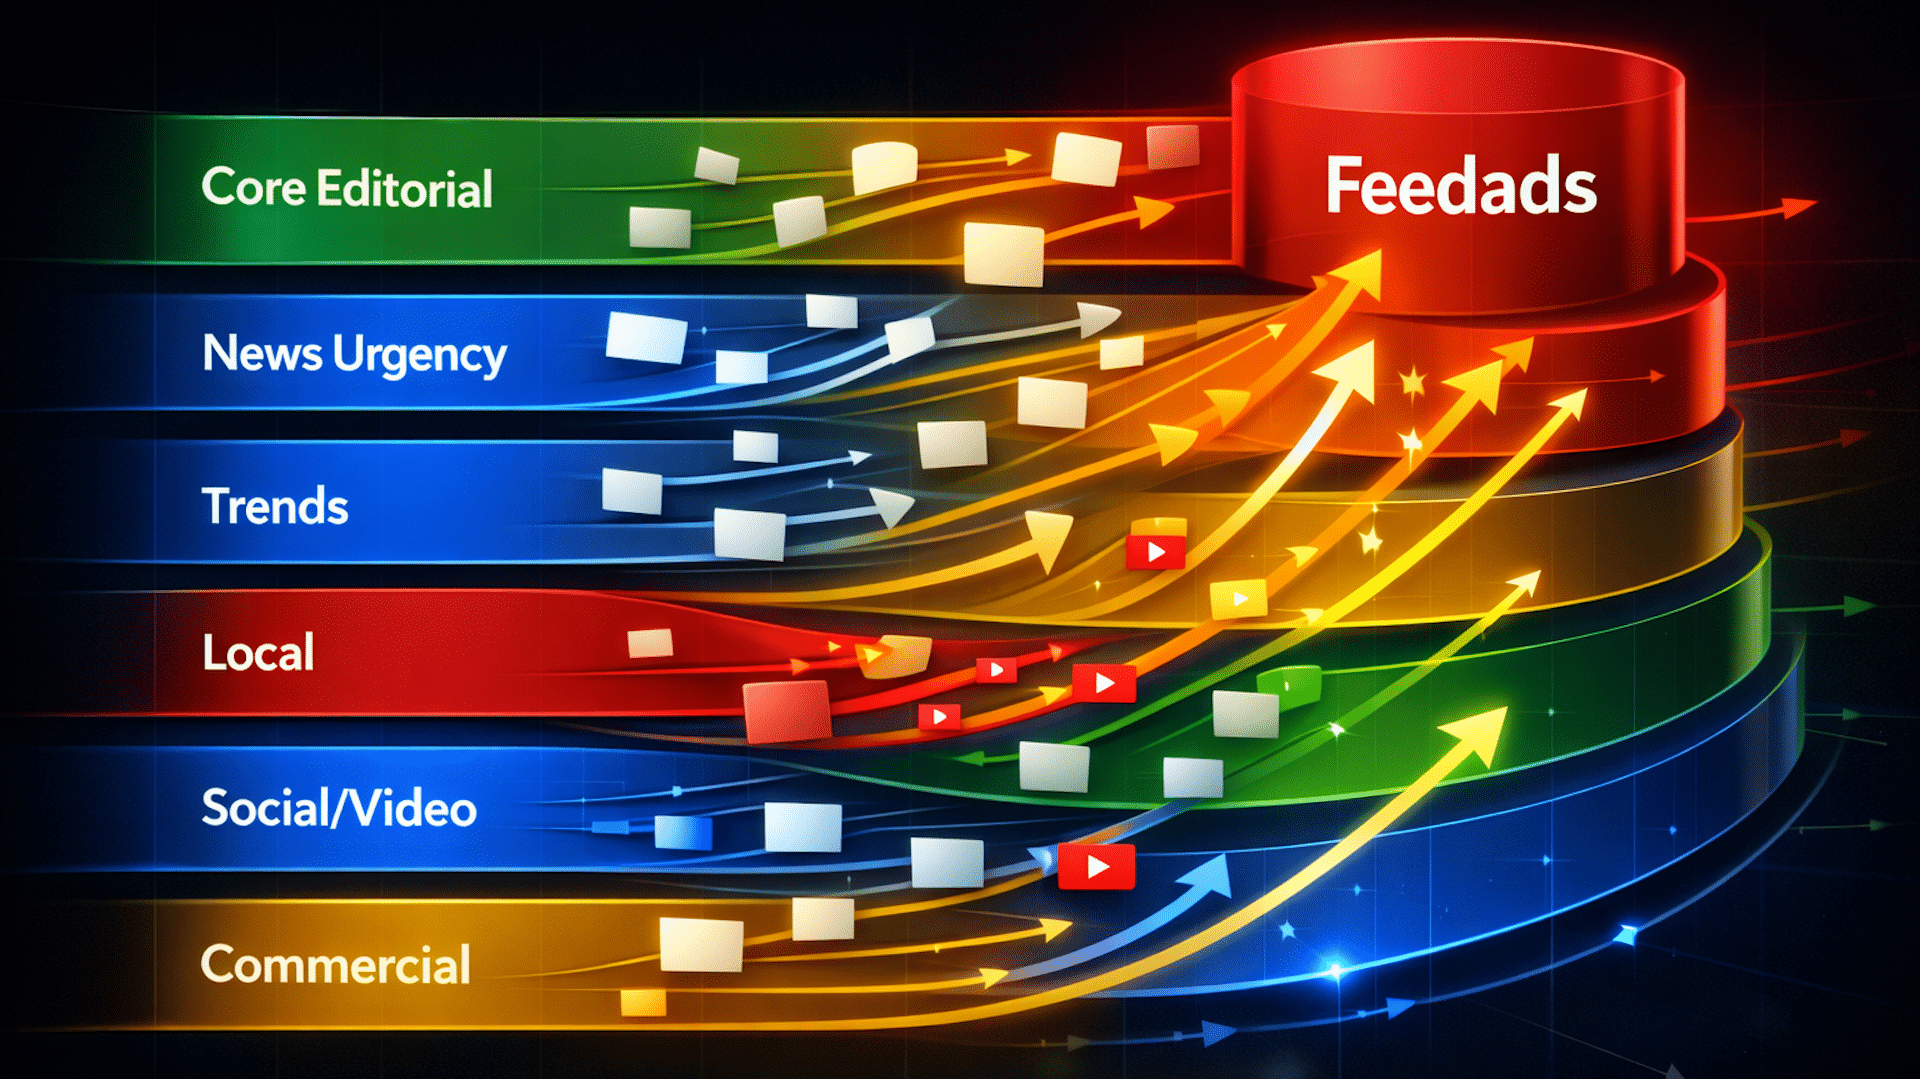
Diving deeper, many believe Discover operates on just one recommendation algorithm. However, our results tell a different tale—a sophisticated system with six layers, each with its unique logic, pace, and audience.
The six layers include:
Core editorial — various content types leading with editorial consistency.
News urgency — swift distribution of must-see news content.
Trends — pipelines dedicated to detecting and maintaining trends.
Local/geo — focusing on geotargeted stories and content.
Social/video — elevating YouTube video content into prominence.
Commercial — enhancing advertisements’ reach through platforms like YouTube.
In my exploration, I found peculiarities unique to the English Discover feed, including a YouTube content journey expanding through three successive pipelines. This system brings significant amplification to the reach of content that passes through it.
English Discover has also incorporated AI Overviews, an AI-generated summary, although this has been limited to English feeds only. Furthermore, a surprising revelation was the systemic under-representation of Premier League content across numerous pipelines, unlike other sports.
In conclusion, the Discover ecosystem continually evolves. Observing these changes provides valuable insights into the system’s architecture and potential influential power for publishers.
Data Source: 42 million Discover cards from December 2025 to February 2026. Analysis by 1492.vision with recognition to Metehan Yesilyurt for his work on Google SDK analysis.
As someone deeply invested in the world of digital advertising, I’ve noticed that Google is making a significant change. They’re moving away from impression-based planning and encouraging us to adopt more conversion-focused strategies.
Recently, I learned that Google’s Performance Planner tool has refined its scope. They’re now emphasizing conversion-focused campaign types, leaving behind the traditional impression-based planning style.
What’s happening? Last month, Performance Planner stopped supporting planning for Display and Video campaigns. This adjustment also means that metrics like impression share, top impression share, or absolute top impression share are no longer viable on their platform.
Why this matters to us. This shift away from impression-focused planning affects how we forecast and optimize campaigns concentrated on brand awareness. Google’s push towards conversion-focused and automated strategies challenges us to rethink our approach to upper-funnel tactics.
The bigger picture. It’s evident that Google Ads is prioritizing automation and performance-driven results. They are aligning their tools more with campaign types like Search, Shopping, App, Demand Gen, Local, and Performance Max.
How it’s working now. We can continue using the Performance Planner for supported campaign types, but any plans that included Display or Video campaigns, based on impression share metrics, are no longer editable or viewable.
What I’m watching. I’m curious about how we’ll adapt our planning and forecasting strategies for upper-funnel channels like Display and Video now that they lack native support in Google’s tools.
Bottom line. Ultimately, Google’s focus on performance-driven planning means that impression-based strategies might soon be a thing of the past. It’s time to embrace the shift towards conversions.
Have you ever felt like there’s a disconnect between what your webpage is saying and what your audience is actually searching for? You’re not alone. This mismatch has always existed, but the stakes have become much higher now.
When your page doesn’t align with user intent, it risks not appearing on AI-powered search platforms. Instead, search engines will prioritize pages that fulfill user needs more precisely. Although the gap is apparent, quantifying it can be challenging. Luckily, Google’s Search Console holds the key to unlocking this data.
Analyzing your pages can reveal how well your content aligns with the searches your audience is conducting. Here, I’ll guide you through the process of measuring these intent gaps using a free tool.
The tool uses your Google Search Console data to compare the positioning of your page with real search demand. It gives you insight into where your content aligns or falls short, helping you identify areas for improvement.
Now, let’s dive into how we can measure the gap between your page’s positioning and audience demand.
Measuring the Gap Between Positioning and Demand
I’ve noticed that most web content today is designed to cater to multiple target audiences, sometimes aiming for tens or hundreds of keywords alongside brand positioning. This can cause the content to drift away from addressing the problems people are trying to solve.
Numbers can create urgency and inspire action in a way that observations alone cannot. The data you need is right there in your Google Search Console. The intent gap analysis tool will harness that data, providing you with numbers and insights.
This tool captures what your audience searches for when they find each page, comparing it with the page’s meta description. It scores the distance between these elements, giving you a clear picture of how well your content aligns with audience queries.
Connecting Positioning to Demand
Meta descriptions should indeed serve as a compelling pitch, convincing users that your page holds what they’re seeking, as outlined in Google’s Search Central documentation.
For AI ecosystems, achieving durable visibility requires consistent use of metadata, provenance, and trust signals interpretable by search crawlers and generative engines. An anchor in audience behavior, like those found in Google Search Console, is crucial for evaluating meta descriptions accurately.
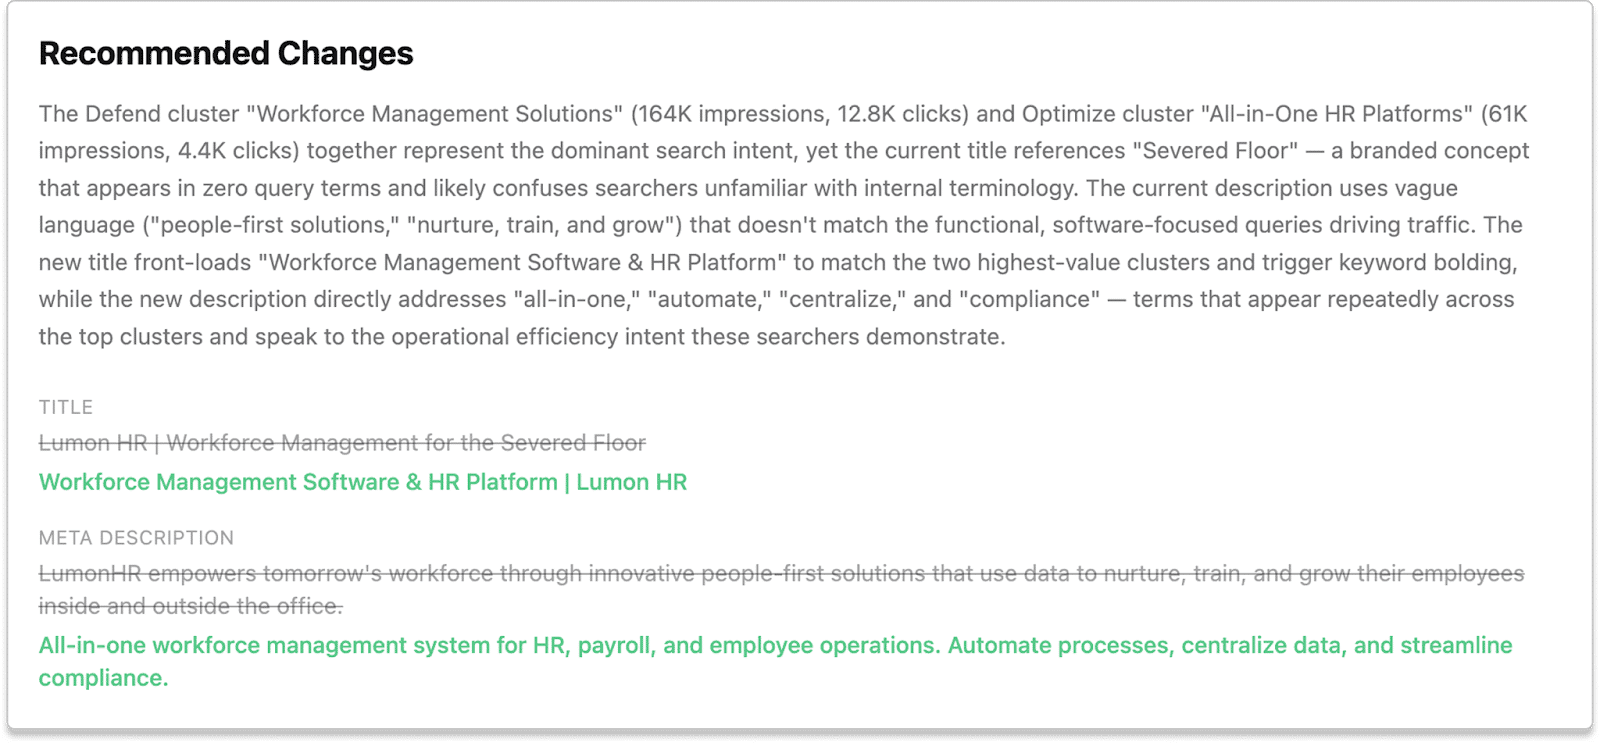
The intent gap analysis tool expresses this gap with a score, helping you to see exactly where your page aligns with demand—and where it doesn’t. An example from a fictional SaaS platform showed that vague language in the meta description failed to attract the intended software-focused audience.
Why Intent Is Measurable Now
Search engines now rely heavily on vector embeddings to match content with queries, focusing on meaning rather than just keywords.
These embeddings provide a glimpse into how search engines perceive content, using semantic similarity as a key factor to determine which pages should be shown to users.
Where Existing Tools Stop
Traditional tools like N-gram analysis and TF-IDF have their limitations, as they focus on matching words rather than understanding intent.
While these methods can highlight repeated phrases or important terms, search engines are more concerned with meaning. This means that relying solely on word-matching puts you at a disadvantage.
Measuring Meaning, Not Words
Vector embeddings allow us to plot meta descriptions and audience queries on the same map. This helps us measure the distance between them, revealing gaps where the demand isn’t being met.
By understanding this distance, we can ensure our content addresses what the audience is actually searching for.
Your Data, Your Score: Running the Intent Gap Analysis
To run the analysis on your own pages, you’ll need to follow a few steps with the provided tool.
The process involves exporting your page data from Google Search Console and uploading it to the tool for scoring. You can then explore a detailed map of alignment and demand, review the breakdown by cluster, and receive rewrite recommendations to better capture your audience’s attention.
Understanding this data allows you to make informed decisions about your content strategy, ensuring you’re meeting audience demand more effectively.
Turning the Score into a Decision
The intent gap score translates the gap into actionable insights. It helps guide conversations around either modifying or defending specific page elements.
By closely monitoring these signals, you can adapt and ensure that your content continues to meet evolving audience needs. The tool created by Robin Tully, co-founder at Forecast.ing, empowers us to bridge these gaps effectively.
I’ve recently noticed YouTube inching closer to traditional TV-style ads, marking a significant transition that might just alter how we enjoy videos — and draw in bigger brand investments.
What’s happening. For some TV viewers, ads are being stretched up to 90 seconds before they can skip, a major change from the recently introduced 30-second unskippable formats.
How it works. These extended ad blocks are mostly appearing on TV devices, sometimes lasting over 90 seconds, with the option to skip only available after this initial period.
Why we care. YouTube is tapping into more premium, TV-like ad inventory that facilitates longer, more engaging storytelling on our screens. This transformation creates opportunities for brands to run campaigns akin to those on traditional TV, but with the advantage of digital targeting and measurement. As Google dives deeper into connected TV, I foresee a potential shift in budgets towards YouTube as an essential channel for reach and brand prominence.
Zoom in. Initial reports indicate that this format is not tethered to the length of the video, appearing on both shorter and longer content, and currently, it’s only affecting TV audiences, not mobile or desktop users.
User reaction. The feedback I’ve come across has been mostly negative, with viewers lamenting these lengthy interruptions and considering alternatives such as ad blockers or third-party apps.
Context. This test stems from YouTube’s recent aggressive monetization efforts, including the introduction of new ad formats and the launch of a lighter subscription tier that reduces ads.
What to watch. I’m curious to see if YouTube will expand this format beyond TV and how they’ll manage the delicate balance between ad load and user retention.
I’ve discovered the power of turning AI into a strategic ad partner using prompts that dive deep into buyer emotions, target high-intent audiences, and tackle objections.
Many of us are already tapping into various generative AI tools to breathe life into our marketing ideas and boost the effectiveness of ad campaigns.
Using prompts isn’t just a solo brainstorming alternative; it’s a productivity booster that opens up a world of possibilities.
In this guide, I’ll share some of my favorite marketing prompts for ad campaigns, designed to spark creativity in crafting your own prompts.
Why Use Prompts for Online Ads?
Prompts are your fast track to brainstorming ad elements like triggers, emotions, actions, and your target audience.
The beauty of prompts is they’re versatile. You can tweak outputs across different channels and initiatives like ads, emails, and social media.
Getting closer to optimal campaigns from the outset means saving time, a real boon for low-budget efforts that are hungry for feedback.
The prompts themselves make all the difference. Craft strong questions to extract valuable insights from large language models (LLMs).
Feeling stuck? Ask AI tools for prompt recommendations or use mine. Here’s a selection I often use for online ads.
Emotional Trigger Prompt
Purchases are fueled by emotions, so it’s essential to tap into what makes your audience feel.
Try this prompt: “What are the top emotional triggers that would make X audience buy Y product?”
As an example, I explored what emotional triggers would prompt parents to purchase math learning software for their kids. The LLM highlighted key triggers alongside scarcity and urgency hooks:
Fear of falling behind: Anxiety and a protective instinct. Example: “Ensure your child never falls behind in math.”
Desire to give kids a competitive advantage: Ambition and pride. Example: “Equip your child with math skills that top students develop years ahead.”
Relief from homework stress at home: Relief and peace of mind. Example: “Say goodbye to math homework battles at home.”
Purchase Intent Prompt
Explore these questions to identify who’s ready to buy your product or service now:
Who is most likely to buy immediately?
Who needs convincing?
Who will never buy?
To prevent wasting ad spend, focus on audiences poised for purchase and steer clear of those unlikely to buy.
Keep probing which audiences are most likely to convert. Use the LLM’s feedback to get more specific with your ads.
In the math software scenario, the LLM advised that parents of struggling kids in math were the best converters due to high urgency and low friction.
The second-best group? Homeschooling parents, motivated by the need to manage the entire curriculum. This insight allowed us to craft ads and test conversions.
Overcoming Objections Prompt
Addressing objections is crucial for sealing the deal. Ask for three to five potential objections buyers might have about your product.
In our math software example, the LLM identified these objections:
My child already has too much screen time.
Will this actually improve my child’s math skills?
It’s too expensive.
Next, craft a persuasive counter-argument for each using logic, emotion, and evidence. For “it’s too expensive,” consider:
Logic: “Less than the cost of a tutor.” Establishes a higher anchor, making the price seem reasonable without calling it cheap.
Emotion: “Don’t let your kids fall behind in math.”
Proof: “80% of students improve by one letter grade in two months.”
Psychological Profile Prompt
Request a comprehensive psychological profile of your ideal customer from an LLM. Use questions like:
What are your ideal customer’s fears?
What are their frustrations?
What do they envy?
What do they pretend doesn’t bother them?
What keeps them up at night?
In the math software scenario, I asked, “What or who do my ideal customers envy?”
The response indicated parents envy children in enrichment or advanced classes, seeking future educational opportunities.
Here’s a message for them: “Help your child stay ahead instead of playing catchup.”
The Lifetime Value Prompt
Sustain long-term success by focusing on customer lifetime value (LTV) instead of one-time sales.
Consider these questions:
Why might your customers stick around?
Why might they buy more?
What retention strategies are effective?
For a luxury furniture brand, we turned these into a brief playbook to boost LTV. The LLM suggested shifting from a transactional relationship to a long-term design partnership.
For instance, segment your customer base and use direct mail for your highest-value group by sending a lookbook. Though it seems old-school, it can result in a higher LTV than general mailings.
Your clients deserve strategic thinking and clear priorities. AI tools help us achieve that, supporting both strategy and execution.
Fix Lagging Average Order Value Prompt
When performance dwindles, it’s tempting to ask sweeping questions about metrics like return on ad spend (ROAS).
But that’s a path well-trodden, often leading to generic, uninspired checklists.
We grapple with B2C and B2B search query overlaps. Focusing on B2B users is challenging but crucial for securing high-value, long-term customers.
We noticed a likely cause of a B2B client’s lagging ROAS: average order value (AOV) as reflected in Google Ads’ Value/Conv. Smart Bidding had shifted to high-converting but lower-quality sessions, impacting performance.
We enlisted an LLM to ascertain and address the issue.
With Ads Advisor (Gemini) in Google Ads, the initial response focused on trivial consumer scenarios, like holiday themes.
Upon refining the prompt, we received more targeted, actionable suggestions, saving valuable time.
We doubled down on audience targeting, emphasizing specific Google audience segments and first-party audiences with value rules.
AOV increased. While it didn’t promise higher order values, it honed focus on B2B intent and reduced low-priority consumer purchases.
Key performance metrics improved, guiding the path to growth and profitability.
Better Prompts Lead to Better Campaigns
Begin simply — incorporate one or two of these prompts into your next campaign, tweak the outcomes, and expand from there. Over time, you’ll establish a repeatable system where AI becomes integral to your marketing workflow.
I’ve spent a decade delving into PPC strategies and what I’ve learned is that chasing ‘best practices’ often limits true performance potential. Real growth stems from daring to deviate and experiment with new methods.
PPC conversations frequently revolve around sticking to best practices. These mandates include maintaining clean account structures, controlling match types, scaling budgets incrementally, ensuring campaigns don’t overlap, and keeping everything logical and easy to explain.
While these fundamentals do promote consistency and prevent inefficiencies, they are not the secret to achieving significant gains.
Looking back, many of the most impactful improvements came from testing unorthodox ideas that didn’t neatly fit into the established frameworks, but instead aligned with how platforms like Google Ads and Meta actually operate. These platforms don’t optimize for best practices, but rather for signals, prompting a rethink in approach to performance.
Control Still Matters: Revisiting SKAGs
In several accounts, reintroducing Single Keyword Ad Groups (SKAGs) for high-intent, high-revenue keywords led to improved performance. Ad relevance shot up, conversions grew, and query matching became more precise. It’s not about reverting to old structures, but recognizing where control adds value.
The narrative that machine learning abolishes the need for such control is overly simplistic. My experience shows that precision matters, but only in contexts where the intent justifies it.
Harnessing Broad Match with Control
Historically, broad match has been met with skepticism due to its expansive nature. However, combining broad match with aggressive negative keyword management allows Google to explore broadly while you shape the output through strategic query mining.
By continuously refining query inputs, broad match can expand reach without compromising relevance, redefining how control is applied.
When Visibility Trumps Efficiency: Target Impression Share
Target Impression Share often supports defensive strategies, but applying it to high-value, non-branded terms can boost SERP dominance even at the cost of efficiency. In such cases, ensuring visibility can outweigh concerns over cost efficiency, especially when aiming for market dominance rather than mere competition.
Focusing on Conversion Quality: Weighting Over Tracking
Most lead generation accounts capture multiple conversion actions, but treating them equally can lead to suboptimal interpretations. In one instance, assigning different values based on conversion likelihood—like prioritizing phone calls—shifted optimization to improve conversion quality rather than volume.
This approach emphasizes what’s truly valuable, ensuring platforms optimize effectively based on input.
Competitor Bidding: Leveraging Existing Intent
Despite their reputation for inefficiency, competitor campaigns succeed by capturing existing intent. Users searching for competitor brands often convert thanks to their advanced position in the decision process, proving crucial when strategically managed with clear positioning and relevant landing pages.
Rethinking Top-of-Funnel Keywords
Although often removed for low conversion rates, top-of-funnel keywords can indirectly enhance account performance by strengthening remarketing pools and audience signals, thus supporting high-intent campaign efficiency.
These queries play an unseen but vital role in driving conversions across the account.
Trusting the Data Over Assumptions
Initial audience hypotheses frequently miss the mark, whereas data often pinpoints the most efficient converters. By trusting data and adjusting strategies accordingly, accounts can improve performance by aligning with audience realities.
Revisiting Account Structure’s Role
While clean setups simplify management, they’re not always the most effective. Controlled overlaps between campaigns can leverage shared signals for better auction outcomes, challenging the notion that rigid structures lead to optimal performance.
Treating Product Feeds as Dynamic
In Shopping campaigns, product feeds are often overlooked. Yet, revisiting and adjusting feed details—like product titles and attributes—can significantly enhance product visibility and click-through rates, underscoring their strategic importance.
Retargeting: A Hub for Testing Strategy
Retargeting is not just about conversions; it’s ideal for testing variations in messaging and creative content due to its high-intent audience. Successful test results can then be confidently scaled, reframing retargeting as a strategic testing ground.
The Real Secret Behind Top Account Success
Over the years, I’ve realized that outperformance doesn’t stem from strictly adhering to playbooks, but from understanding and influencing platform signals and stepping beyond conventional boundaries to outperform beyond expectations.
I’ve been noticing the rapid transformation in how brands are tracking user behavior online. With privacy laws tightening and browser extensions increasingly blocking data, the demand for cleaner data from ad platforms is higher than ever. This change urged me to explore server-side tagging as a solution.
By implementing server-side tagging, I’ve managed to reduce data loss while collecting cleaner, privacy-compliant data. This approach is invaluable, especially considering the experiences I’ve had with providers like Elevar and Littledata.
So, what exactly is server-side tagging, and in which situations does it really shine? Let’s dive into the details!
What is server-side tagging?
Traditionally, tracking scripts ran directly in the browser. However, with server-side tagging, these scripts operate on a server I control, giving me more control over data processing.
Here’s how it works: instead of sending data straight to multiple third parties from the browser, events are sent to a first-party server endpoint, often using a Google Tag Manager server-side container. The server then processes, enriches, and forwards this data to tools like Meta and Google Analytics.
This setup provides benefits such as more data control, a cleaner page performance, and better compliance with privacy laws.
Moreover, server-side tagging grants me the flexibility to enrich and transform data before it reaches ad platforms, standardizing event names, filtering out low-quality events, and adding custom parameters for better audience segmentation.
Is server-side tagging right for you?
While server-side tagging isn’t a one-size-fits-all solution, many brands find it essential, particularly if you:
You need to meet strict privacy or compliance requirements
Server-side setups allow for greater control over how data is processed and shared, supporting compliance with regulations like GDPR and CCPA.
You want faster website performance
In my experience, client-side tracking can slow your page down, but server-side tagging shifts data processing to the server, resulting in faster websites.
You want more accurate tracking (despite ad blockers)
Ad blockers can hinder client-side scripts, but server-side tagging circumvents many of these restrictions, making your data collection more reliable.
You’re investing heavily in paid media
For those heavily invested in platforms like Meta and Google Ads, achieving better data accuracy can significantly impact return on ad spend.
How to implement server-side tagging
When it comes to implementing server-side tagging, you have two main options: building it internally or using a service provider.
Option 1: Internal setup
Choosing an internal setup gives me complete control but requires technical expertise and ongoing maintenance. This involves setting up a GTM server-side container and adding logic for data processing.
Option 2: Use a server-side tagging service
Platforms like Elevar and Littledata offer turnkey solutions that integrate seamlessly with existing tools, allowing me to focus on strategy rather than technicalities.
Our direct experience: Littledata vs. Elevar
In my experience with Littledata and Elevar, each caters to different needs. Littledata is ideal for emerging brands with simpler tech stacks, while Elevar is suitable for those outgrowing entry-level solutions.
Investing in server-side tagging has transformed how I handle data, ensuring that I remain compliant with privacy laws while boosting site performance and data reliability across all my platforms.
I recently discovered that HubSpot has decided to shake things up by rebranding their annual conference, taking it from ‘Inbound’ to the innovative ‘Unbound’. This change is certainly a nod to the evolving landscape of marketing and strategy.
If you’ve tucked away your inbound strategy tools over the past year, maybe it’s time to do the same with those ‘Inbound’ conference mugs and swag as well. It’s a fresh start.
This coming September, HubSpot’s annual gathering in Boston will reflect this transition. As noted on their event site, the reasoning behind this shift is clear:
“This evolution is our response to that reality. INBOUND is becoming UNBOUND because growth no longer fits within a single framework or function. Today, it covers marketing, sales, service, and operations across the full customer journey in an AI-driven environment. UNBOUND reflects that expanded reality and the mindset required to lead through it.”
It’s fascinating to consider how HubSpot, the pioneers of inbound marketing, are now expanding beyond what they once set in motion—using content and search rankings for attracting and converting visitors.
I’ve also noted that recent changes in Google’s algorithm seem to have affected the HubSpot blog, possibly as a result of content drifting away from core topics like CRM, sales, and marketing.
It’s clear that the traditional inbound strategy has lessened in impact as platforms like Google shift towards AI models such as ChatGPT, affecting website traffic and clicks.
Back in 2025, HubSpot introduced their Loop marketing strategy, aiming to educate consumers in this rapidly advancing AI world.
The move to ‘Unbound’ acknowledges that no singular approach is sufficient in today’s dynamic marketing environment. It’s a brave new shift, one that reflects a deeper understanding of the expansive realities we’re working within.