Your Next Website Visitor Might Not Be Human: Are You Ready?

```json
{
  "alt": "Line graph showing bot traffic surpassing human traffic in 2025, with trends from 2019 to 2025.",
  "caption": "In a surprising twist, bot traffic outpaces human web traffic by 2025, reaching 51%. This trend highlights the growing presence of automated activity online.",
  "description": "This line graph illustrates the trend of bot and human web traffic from 2019 to 2025. By 2025, bot traffic surpasses human traffic at 51%, indicating a significant increase in automated online activities. The graph is color-coded with bot traffic in orange and human traffic in blue, showing a clear crossover point in the data. Source: Imperva/Thales Bad Bot Reports, 2019-2025."
}
```
n

The evolution of technology means that the next wave of visitors to my website won

```json
{
  "alt": "The CapmatchOne logo with a gradient circle and bold text.",
  "caption": "Discover innovation with the CapmatchOne logo, featuring sleek typography and a modern gradient circle.",
  "description": "The CapmatchOne logo features bold, modern typography coupled with a gradient circle, symbolizing connection and innovation. The sleek design conveys a sense of progress and creativity. This image can be used for branding or promotional purposes, appealing to audiences interested in innovative solutions and forward-thinking designs."
}
```
```json
{
  "alt": "Bar chart showing pages crawled per visitor sent back by different bots and AI modes.",
  "caption": "The Crawl-to-Click Gap: How Different Bots and AI Modes Handle Page Crawling vs. Sending Traffic.",
  "description": "This bar chart illustrates the ratio of pages crawled to visitors sent back by different bots and AI modes. Googlebot (traditional) has a ratio of about 1:1, Google AI Mode (estimated) is about 14:1, GPTBot at 1,276:1, and ClaudeBot at 23,951:1. Data source: Cloudflare's 'The Crawl-to-Click Gap,' 2025, with Google AI Mode estimates based on Semrush zero-click data. Keywords: web crawling, bot activity, AI search behavior, click-through rates."
}
```
```json
{
  "alt": "Bar chart titled 'The Agentic Commerce Trajectory' showing projected AI-related spending from 2025 to 2028 in USD, with figures ranging from $5B to $15T.",
  "caption": "A glimpse into the future: Explore the agentic commerce trajectory with projected AI-related spending soaring to $15 trillion by 2028.",
  "description": "This bar chart illustrates the projected growth in AI-related commerce spending from 2025 to 2028. It features four bars representing different sectors: AI Platform Retail Spend 2025 at $5B, Cyber Week AI-Influenced Orders 2025 at $67B, AI Platform Retail Spend 2026 projected at $21B, and B2B AI-Agent Spend 2028 projected at $15T. The chart uses a log scale for USD amounts, highlighting the exponential growth in AI-driven commerce. Data sources include eMarketer, Salesforce, and Gartner."
}
```

Inspired by this post on Search Engine Land.


crushpress.ai community screenshot

FAQs

What is changing about website visitors according to the post?

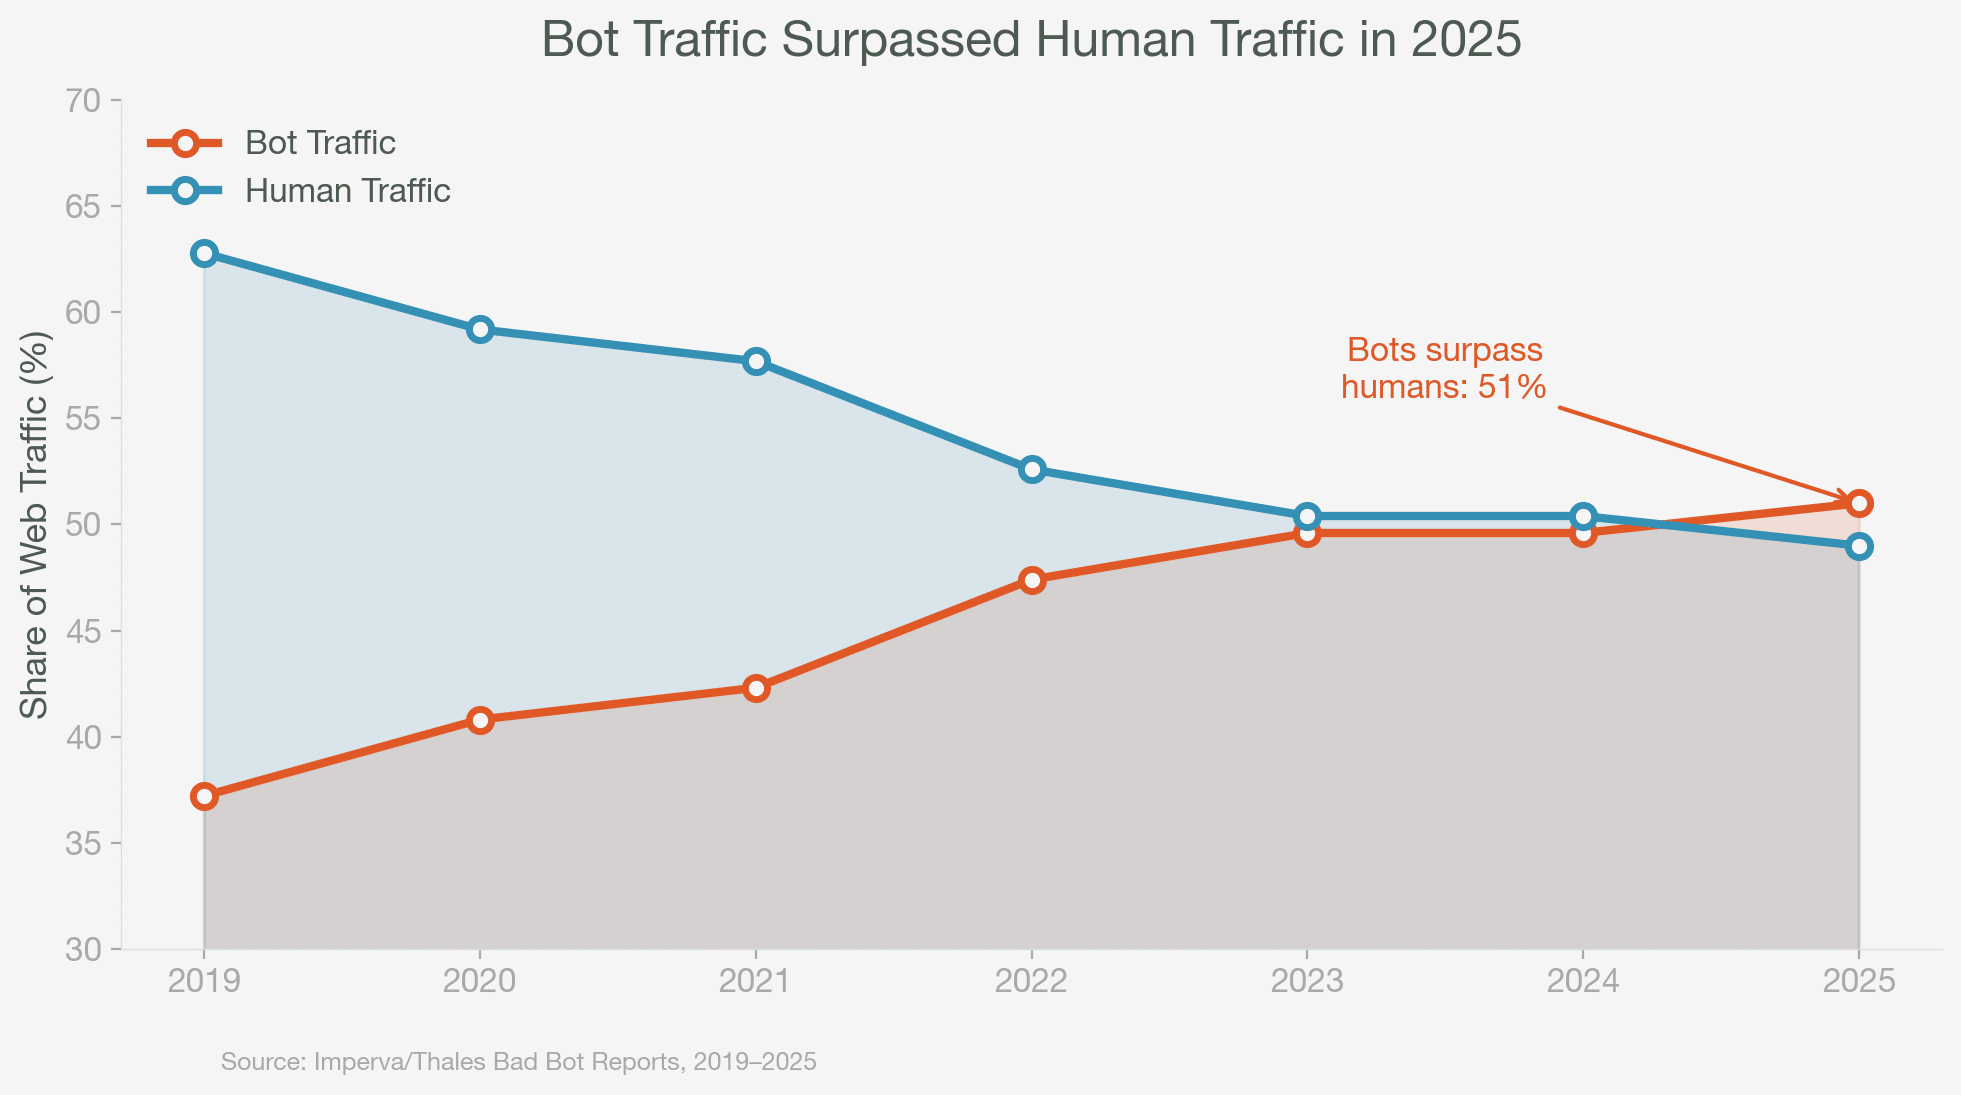
AI agents are revolutionizing online traffic, and the post asks if your site is ready for non-human visitors. It highlights the impact of automated visitors on site dynamics.

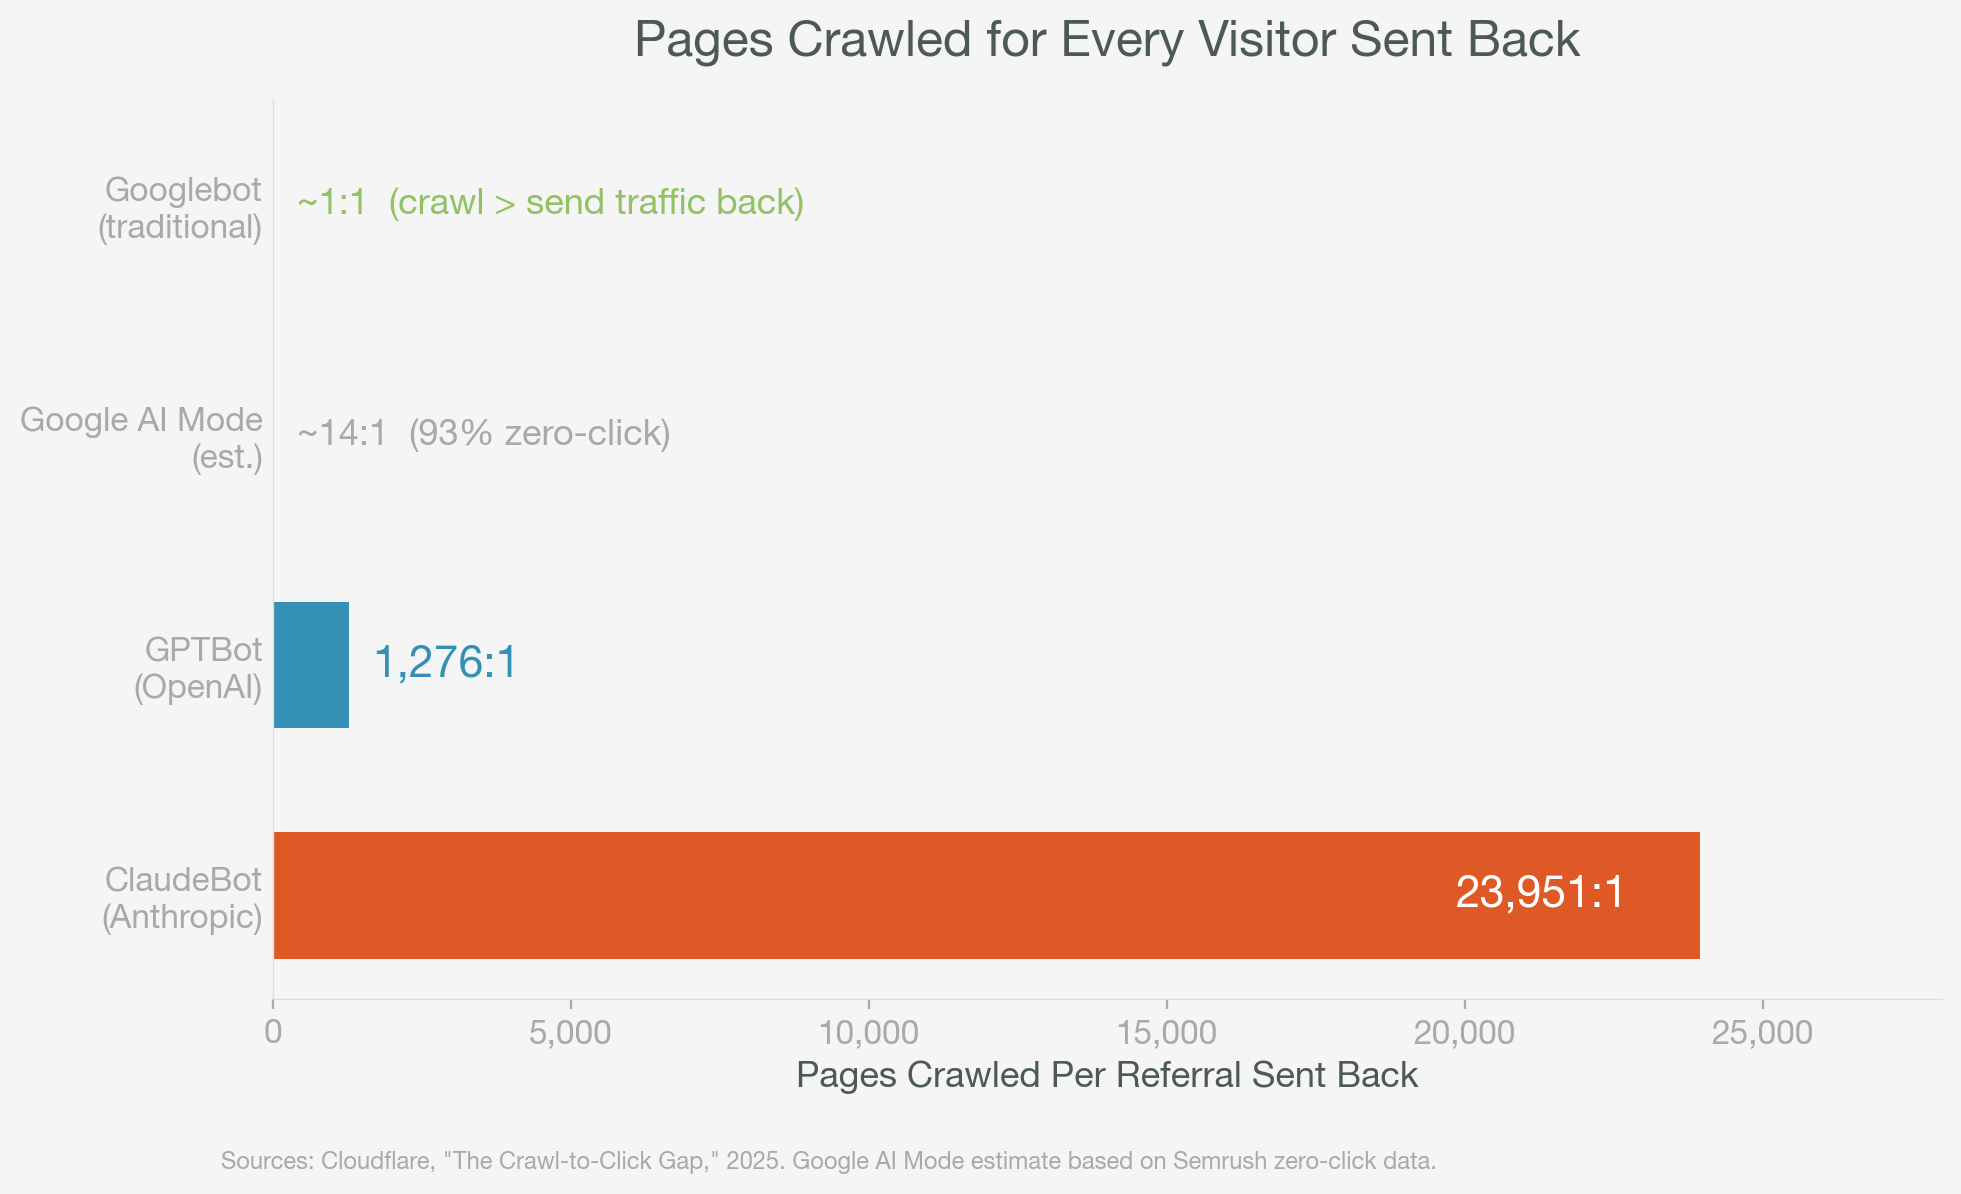
What does the 'Crawl-to-Click Gap' chart illustrate?

It shows the ratio of pages crawled to visitors sent back by different bots and AI modes, including Googlebot (traditional) ~1:1, Google AI Mode ~14:1, GPTBot ~1,276:1, and ClaudeBot ~23,951:1.

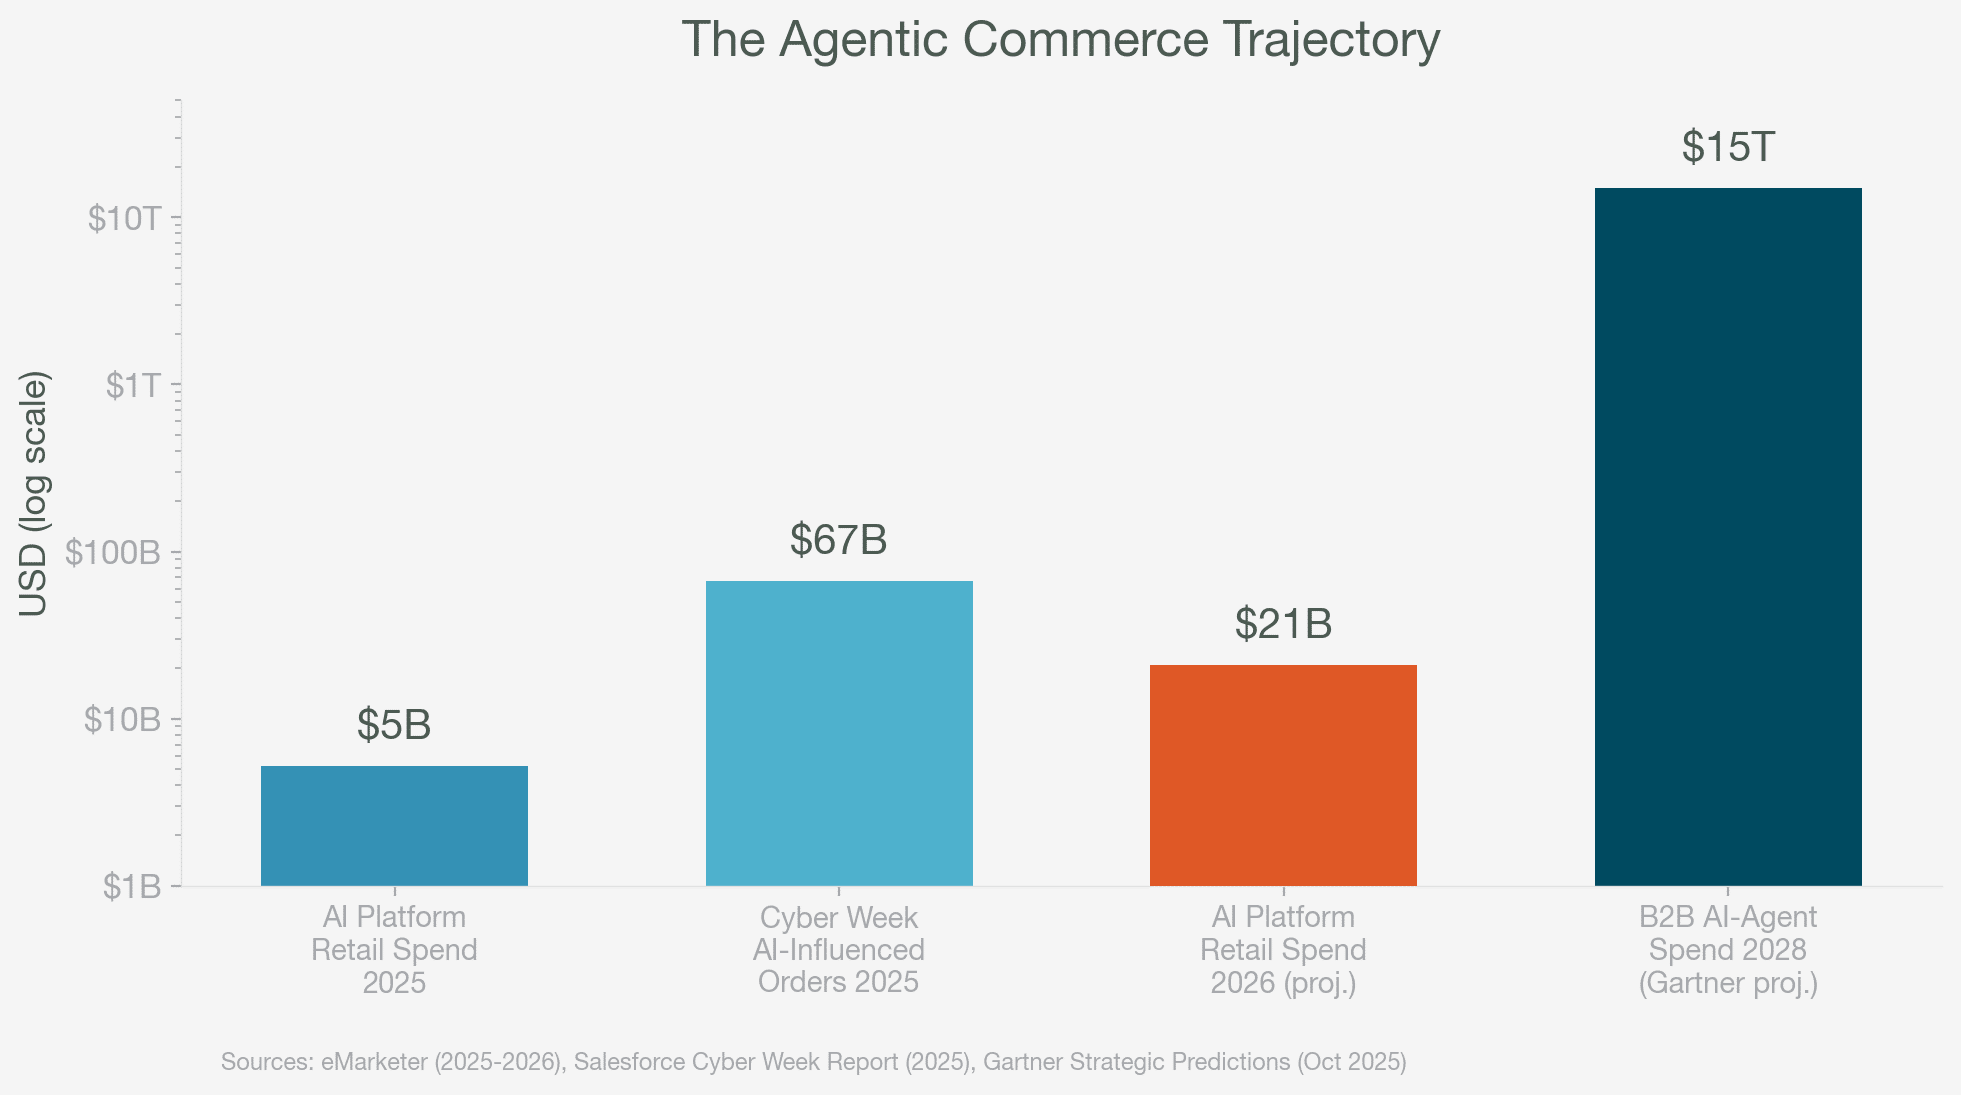
What does the 'Agentic Commerce Trajectory' chart project?

It projects AI-related spending from 2025 to 2028 in USD, ranging from $5B to $15T.

Where did the post draw inspiration from?

It states it was inspired by a post on Search Engine Land.

Comments

Leave a Reply

Your email address will not be published. Required fields are marked *