Tag: SEO

  • Why Seasonality Adjustments Mislead Advertisers on Black Friday

    Why Seasonality Adjustments Mislead Advertisers on Black Friday

    I recently came across a fascinating study highlighting how seasonality adjustments can actually backfire for advertisers during Black Friday, driving up costs and reducing efficiency.

    A thorough analysis over three years, involving up to 6,000 advertisers, indicates that using Google’s seasonality bid adjustments during Black Friday and Cyber Monday (BFCM) often undermines efficiency, despite the platforms recommending them.

    The big picture. Smart Bidding models are crafted to foresee predictable retail surges. Optmyzr analyzed tens of billions of impressions between 2022 and 2024, finding that advertisers who avoided seasonality adjustments usually had better efficiency metrics.

    Without adjustments, Smart Bidding:

    • Recognized the BFCM conversion lift independently
    • Increased bids rationally
    • Maintained stable or improved ROAS, particularly in 2024

    With adjustments: CPCs surged faster than the actual conversion rates, eroding efficiency.

    Reality check: Google doesn’t need your “heads up.” Seasonality adjustments prompt Google to expect a conversion rate rise and to bid accordingly. If your prediction is off—and it usually is—Smart Bidding overshoots.

    For example:

    • You predict a +50% CVR lift
    • The actual lift is +40%
    • This results in an overbid of about 7.1%

    During BFCM’s high sales volumes, even minor mistakes become costly quickly.

    The data: 3 years of the same story

    ```json
{
  "alt": "Table showing CPC inflation from 2022 to 2024 with and without seasonal bid adjustment.",
  "caption": "A comparison of CPC inflation rates over three years reveals significant seasonal adjustments.",
  "description": "This table illustrates the CPC inflation rates from 2022 to 2024, comparing figures with and without seasonal bid adjustments. In 2022, CPC inflation without adjustment is 17%, increasing to 36.7% with adjustment. For 2023, the rates are 16% without adjustment and 32% with adjustment. In 2024, both rates without and with adjustment are 17% and 34%, respectively. This data highlights the impact of seasonal adjustments on advertising costs, a crucial insight for marketers and advertisers."
}
```

    1. Smart Bidding already adjusts for the CVR spike

    • 2022: +17.5%
    • 2023: +11.9%
    • 2024: +7.5%

    No additional guidance needed.

    2. CPC inflation doubles with adjustments

    Across all observed years, CPCs increased approximately twice as much when a seasonal adjustment was used.

    3. ROAS drops significantly

    Advertisers relying on Smart Bidding saw stable or improved ROAS, whereas those who intervened suffered double-digit losses.

    The one exception: “Volume at all costs.” If the aim is pure revenue growth, disregarding margins, seasonality adjustments can be beneficial.

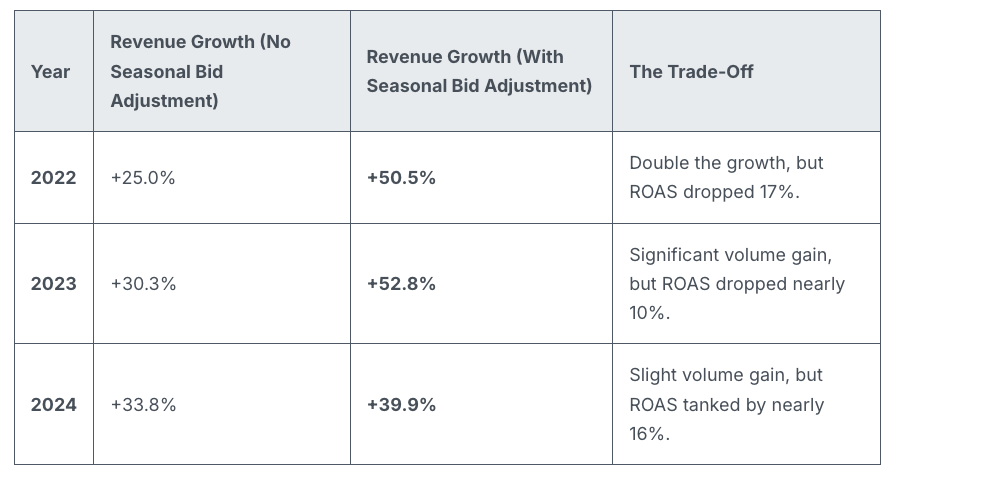
    Revenue lifts were notably higher with adjustments:

    • 2022: +50.5% vs. +25.0%
    • 2023: +52.8% vs. +30.3%
    • 2024: +39.9% vs. +33.8%
    ```json
{
  "alt": "Table showing revenue growth from 2022 to 2024 with and without seasonal bid adjustment with related trade-offs.",
  "caption": "Seasonal bid adjustments impact revenue growth significantly, but come with trade-offs in ROAS, as shown from 2022 to 2024.",
  "description": "This table presents a comparison of revenue growth from 2022 to 2024, analyzing scenarios with and without seasonal bid adjustments. In 2022, a 25% growth without adjustment jumps to 50.5% with it, though ROAS drops by 17%. In 2023, adjustments raise growth from 30.3% to 52.8%, with a 10% ROAS decline. By 2024, growth is 33.8% without and 39.9% with adjustment, noting a 16% ROAS reduction. Keywords: seasonal bid adjustment, revenue growth, ROAS, trade-off."
}
```

    Efficiency may decline, but volume certainly increases.

    When seasonality adjustments make sense. They’re useful when Google doesn’t have prior signals, like one-off or niche events.

    Good for:

    • One-time flash sales
    • Email-only offers
    • Surprise clearance sales
    • Niche seasonal spikes

    Not recommended for:

    • Black Friday
    • Cyber Monday
    • Christmas
    • Valentine’s Day
    • Any event with a predictable historic pattern

    Why we care. Google already recognizes the significance of Black Friday. Smart Bidding is trained with years of BFCM data and can detect conversion rate spikes independently. Overriding this can lead to excessive bidding, increased CPCs, and reduced ROAS, so many marketers might be wasting their budget during this crucial week.

    By recognizing when Smart Bidding has an adequate signal, advertisers can avoid expensive errors, maintain efficiency, and reserve seasonality adjustments for when they add true value.

    Bottom line. Smart Bidding effectively manages major retail holidays. Seasonality adjustments often bring more chaos than benefits during predictable retail peaks. Keep them for unique, brand-specific events that Google can’t predict.

    Smart move: Trust the algorithm — use tools like anomaly alerts, pacing monitors, and bid caps for control without conflicting with Smart Bidding’s core models.

    Dig Deeper. Do Seasonality Adjustments Actually Help During BFCM? A 3-Year Study Says No.


    Inspired by this post on Search Engine Land.


    crushpress.ai community screenshot
  • Mastering LLM Visibility: Metrics and Insights for Real Impact

    Mastering LLM Visibility: Metrics and Insights for Real Impact

    I’ve been deeply involved in the compelling discussions around AI, especially the intriguing intersection of ‘AI hype meets AI reality.’ Tools like Semrush One and its Enterprise AIO tool have taken center stage, offering invaluable insights into what’s happening inside LLMs. The big questions I often ponder are: How many citations are we capturing and just how many mentions are our brands accumulating?

    When this data first emerged, it felt revolutionary. However, it quickly prompted other questions, like ‘What’s the ROI here?’ and ‘How can I integrate this data into my team’s marketing strategy?’ Ensuring that this valuable and fascinating data translates into actionable insights is a challenge I enjoy tackling.

    ```json
{
  "alt": "The CapmatchOne logo with a gradient circle and bold text.",
  "caption": "Discover innovation with the CapmatchOne logo, featuring sleek typography and a modern gradient circle.",
  "description": "The CapmatchOne logo features bold, modern typography coupled with a gradient circle, symbolizing connection and innovation. The sleek design conveys a sense of progress and creativity. This image can be used for branding or promotional purposes, appealing to audiences interested in innovative solutions and forward-thinking designs."
}
```

    It’s no secret that the data these tools provide is incredibly valuable. But, what steps do I take next? Let’s uncover this journey together.

    ```json
{
  "alt": "Trending products list showing ranking of TV brands and models by share of voice.",
  "caption": "Discover what's trending in TV technology as LG and TCL lead the rankings by share of voice.",
  "description": "This image displays a list of trending TV products ranked by share of voice. LG's G3 model takes the top spot with 11%, followed by LG's C3 and TCL's 6-Series both with an 8% share. Samsung's QN90C and S95C, along with TCL's QM8K, also feature among the top-ranked models. The list highlights popular brands and models in the current TV market, useful for consumers looking to stay informed about top choices."
}
```

    The Fundamental Challenges of Tracking LLMs

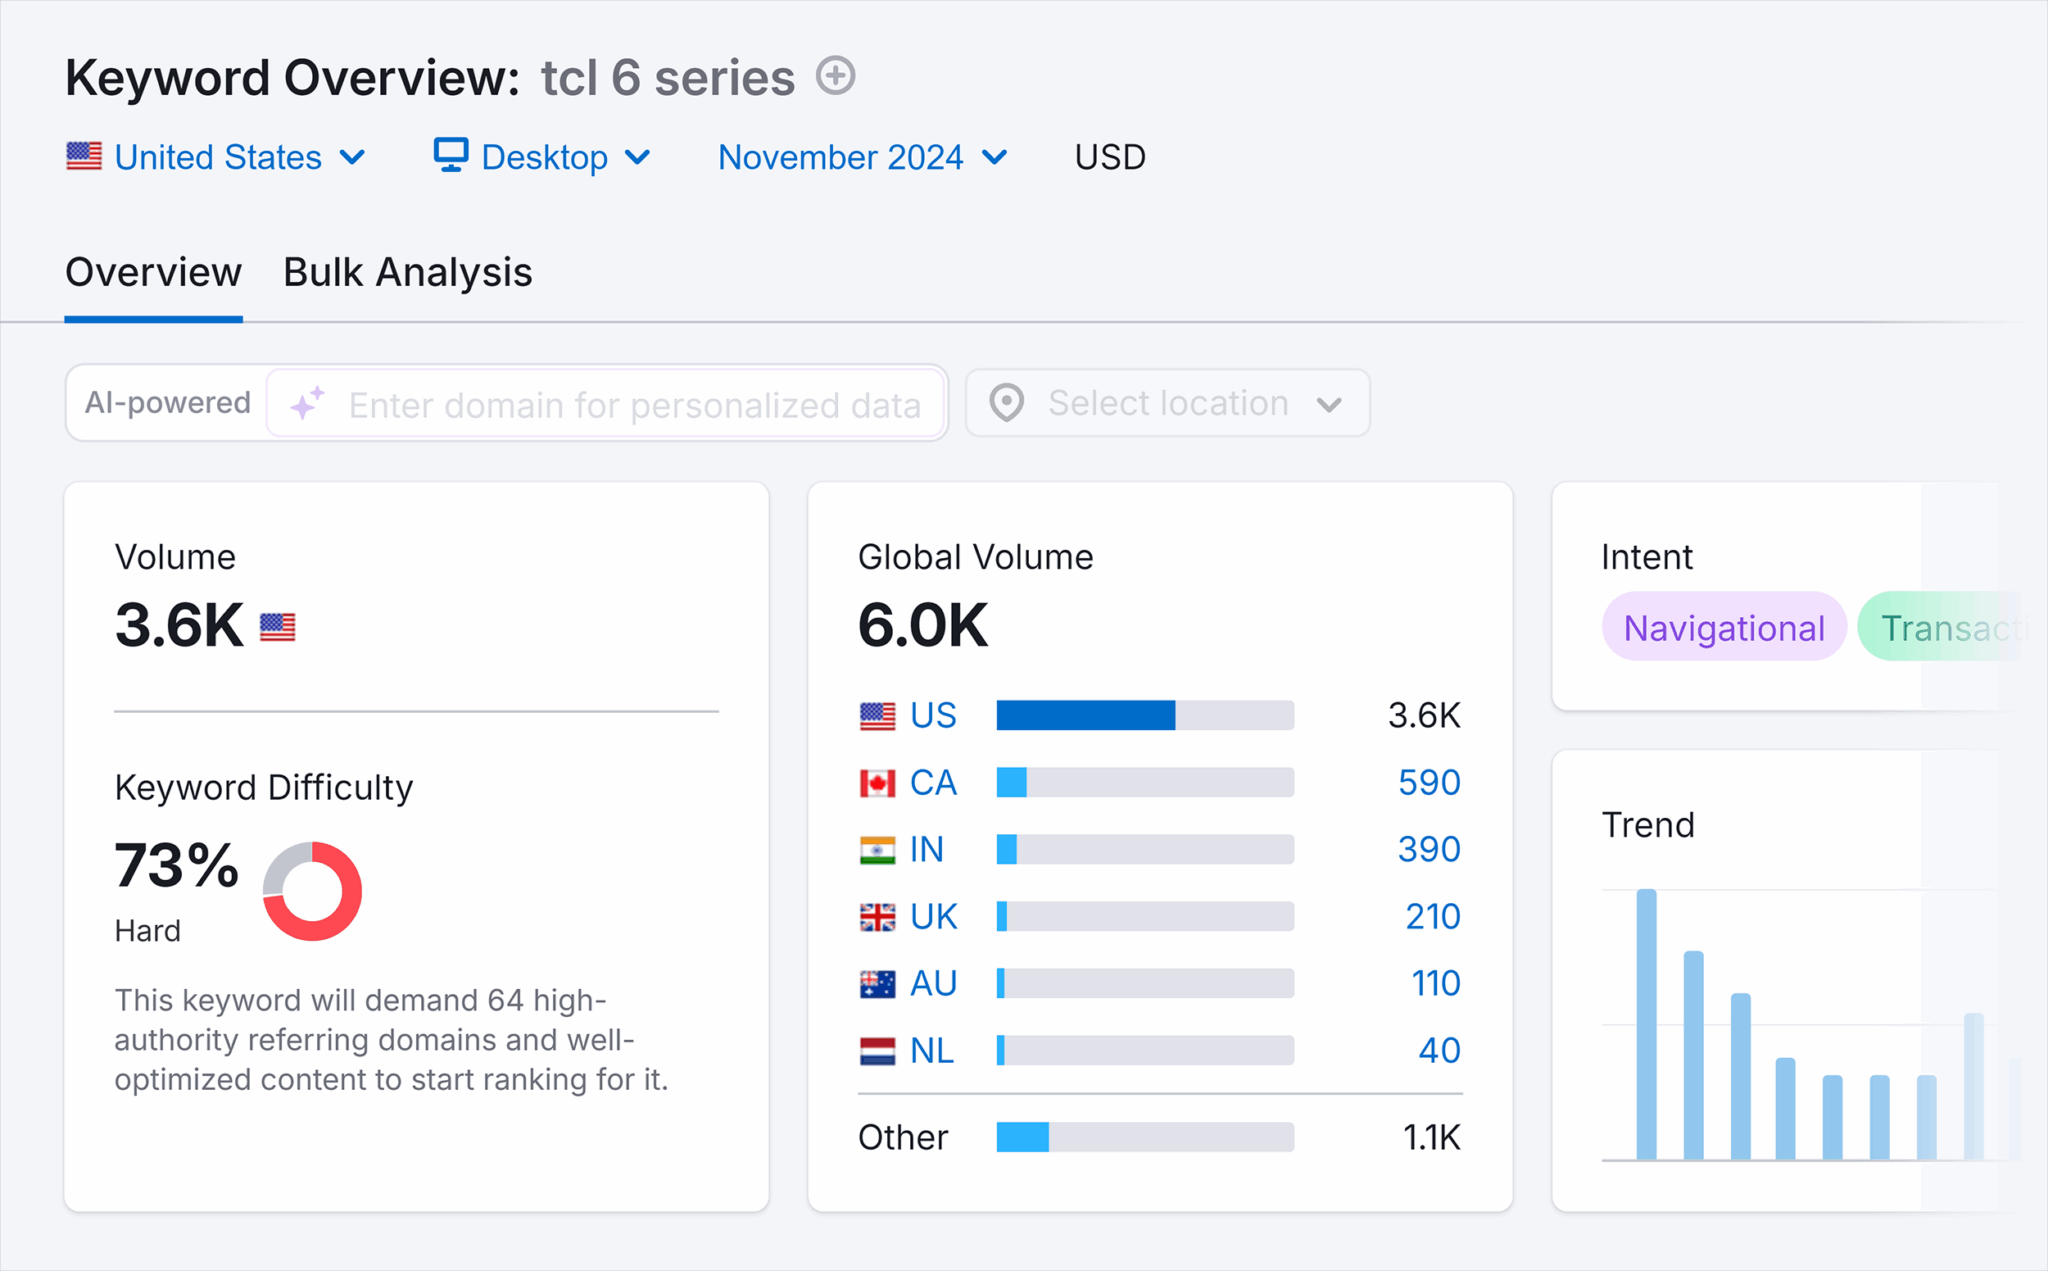
    Tracking LLMs can be more challenging than traditional metrics like Google rankings. Google rankings may show where I stand, but ranking doesn’t always correlate with traffic or revenue. Even if I rank highly, an AI Overview could dominate the search, reducing my traffic for a given keyword. I need to ask myself, is this the right traffic for my business goals?

    ```json
{
  "alt": "Keyword overview of TCL 6 series showing search volume, keyword difficulty, and trend data.",
  "caption": "Explore the keyword analysis for 'TCL 6 series' with detailed volume, global reach, and trend insights for November 2024.",
  "description": "This image displays a keyword analysis dashboard for the 'TCL 6 series.' In November 2024, the keyword has a search volume of 3.6K in the US and 6K globally, with a difficulty score of 73%, indicating high competition. The data is segmented by country, revealing insights into search intent and trend progression, helpful for content strategists and SEO professionals optimizing for this keyword."
}
```

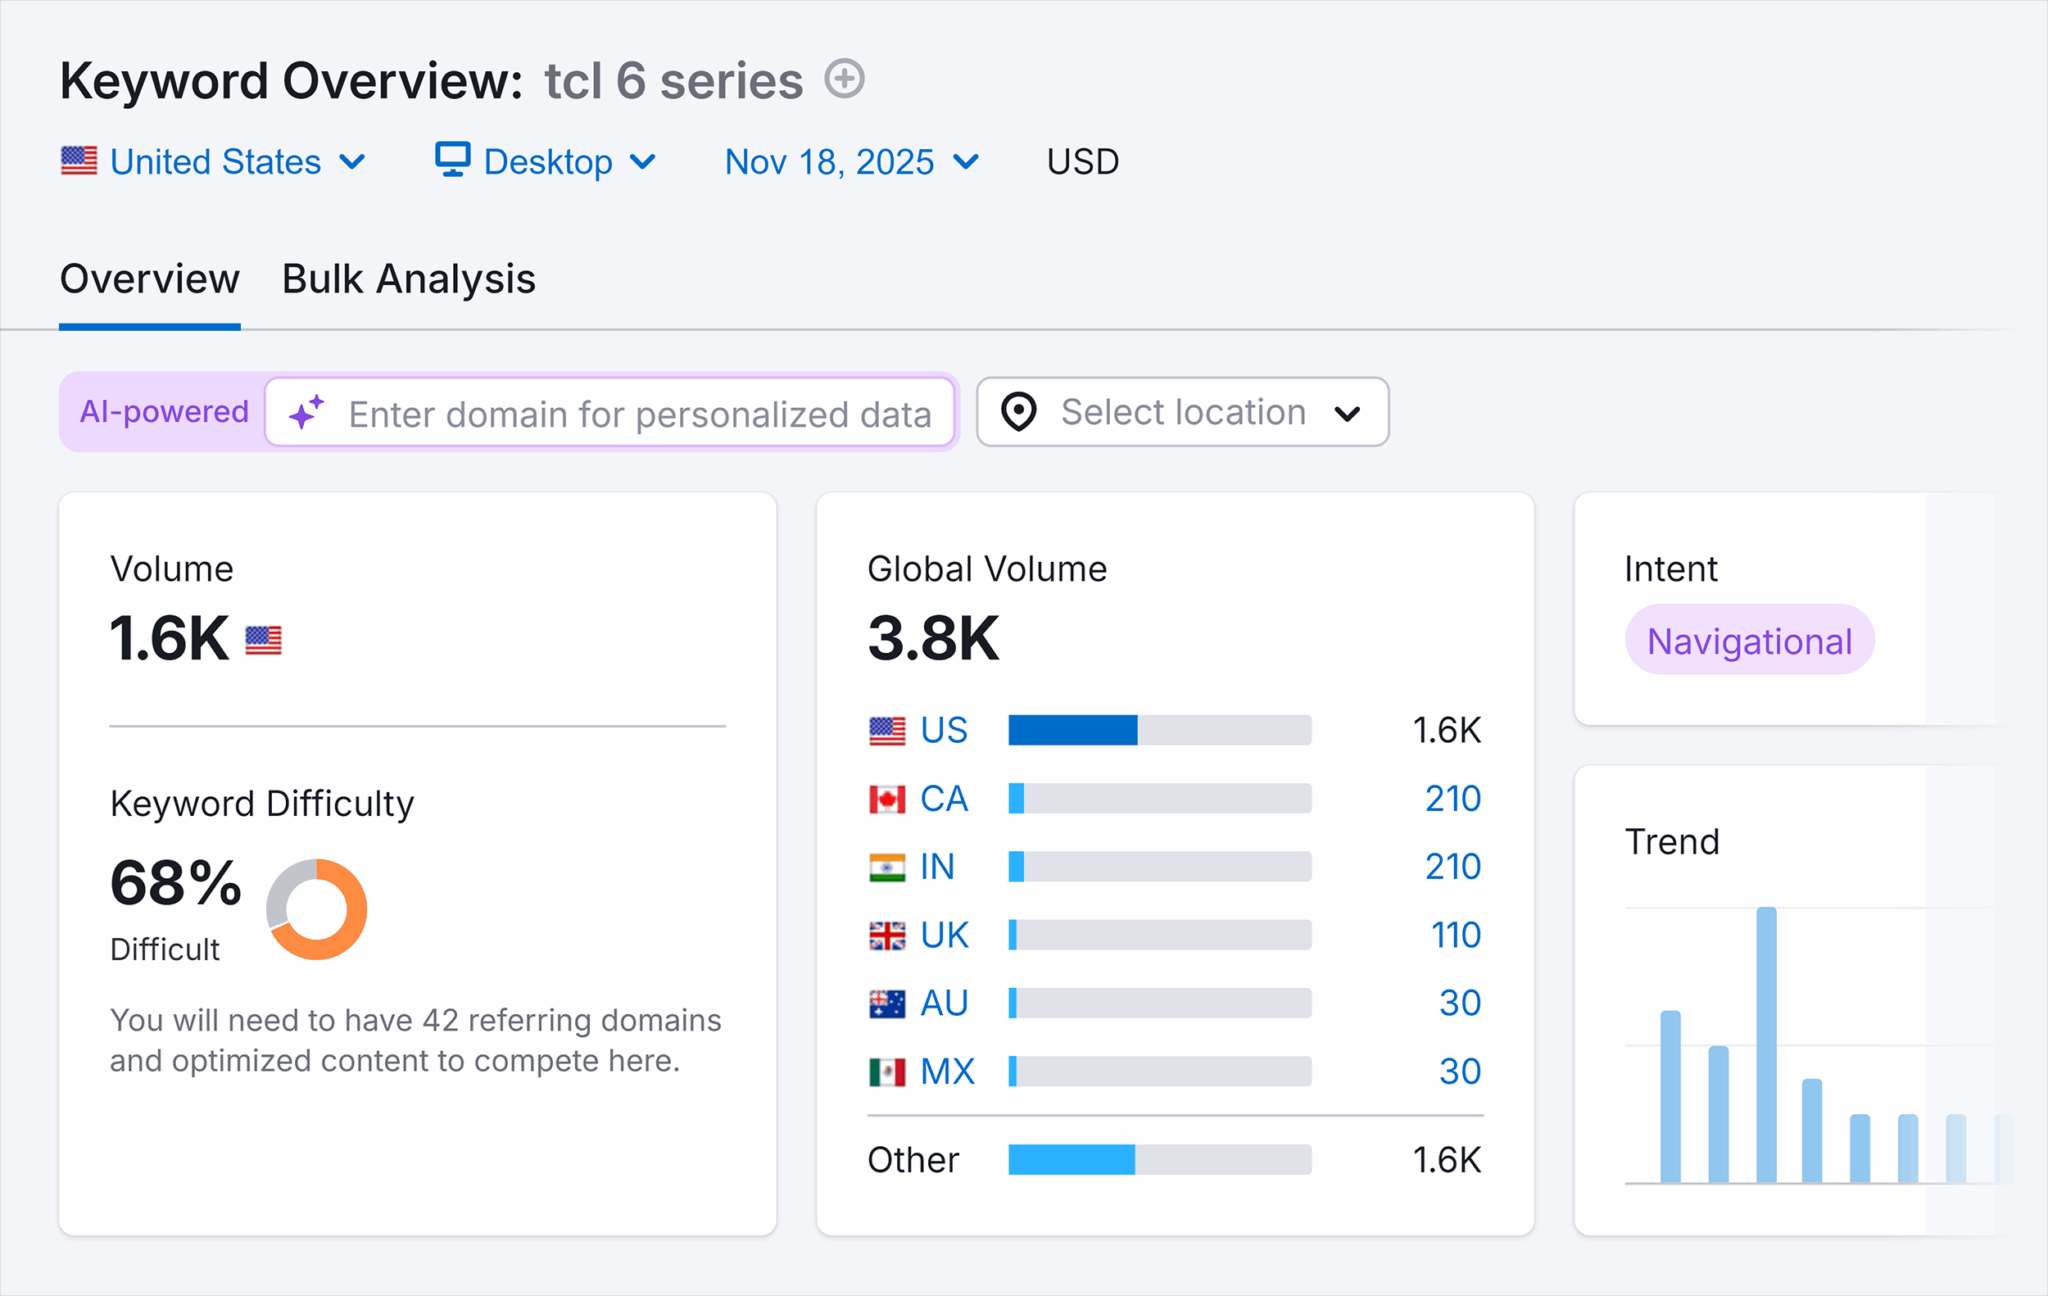
    The big difference between traditional SEO rankings and LLM visibility is the straightforward correlation between strong rankings and increased revenue, which is more complex with LLMs. I can easily track user behavior after they land on my site from organic search, but it’s not so clear-cut with LLMs.

    ```json
{
  "alt": "Keyword overview for TCL 6 series, showing search volumes, keyword difficulty, and intent.",
  "caption": "Explore detailed keyword insights for the TCL 6 Series, highlighting search volume, difficulty, and intent to refine your SEO strategy.",
  "description": "The image presents a keyword overview for the TCL 6 Series, detailing a search volume of 1.6K in the US and a global volume of 3.8K. It notes a keyword difficulty of 68%, indicating a challenging competition level. The intent is labeled as navigational, with trends visualized in a bar graph. This data is segmented by countries, including CA, IN, UK, AU, and MX, offering a comprehensive analysis suitable for refining SEO efforts. Keywords: TCL 6 Series, Keyword Overview, Search Volume, SEO, Navigational Intent."
}
```

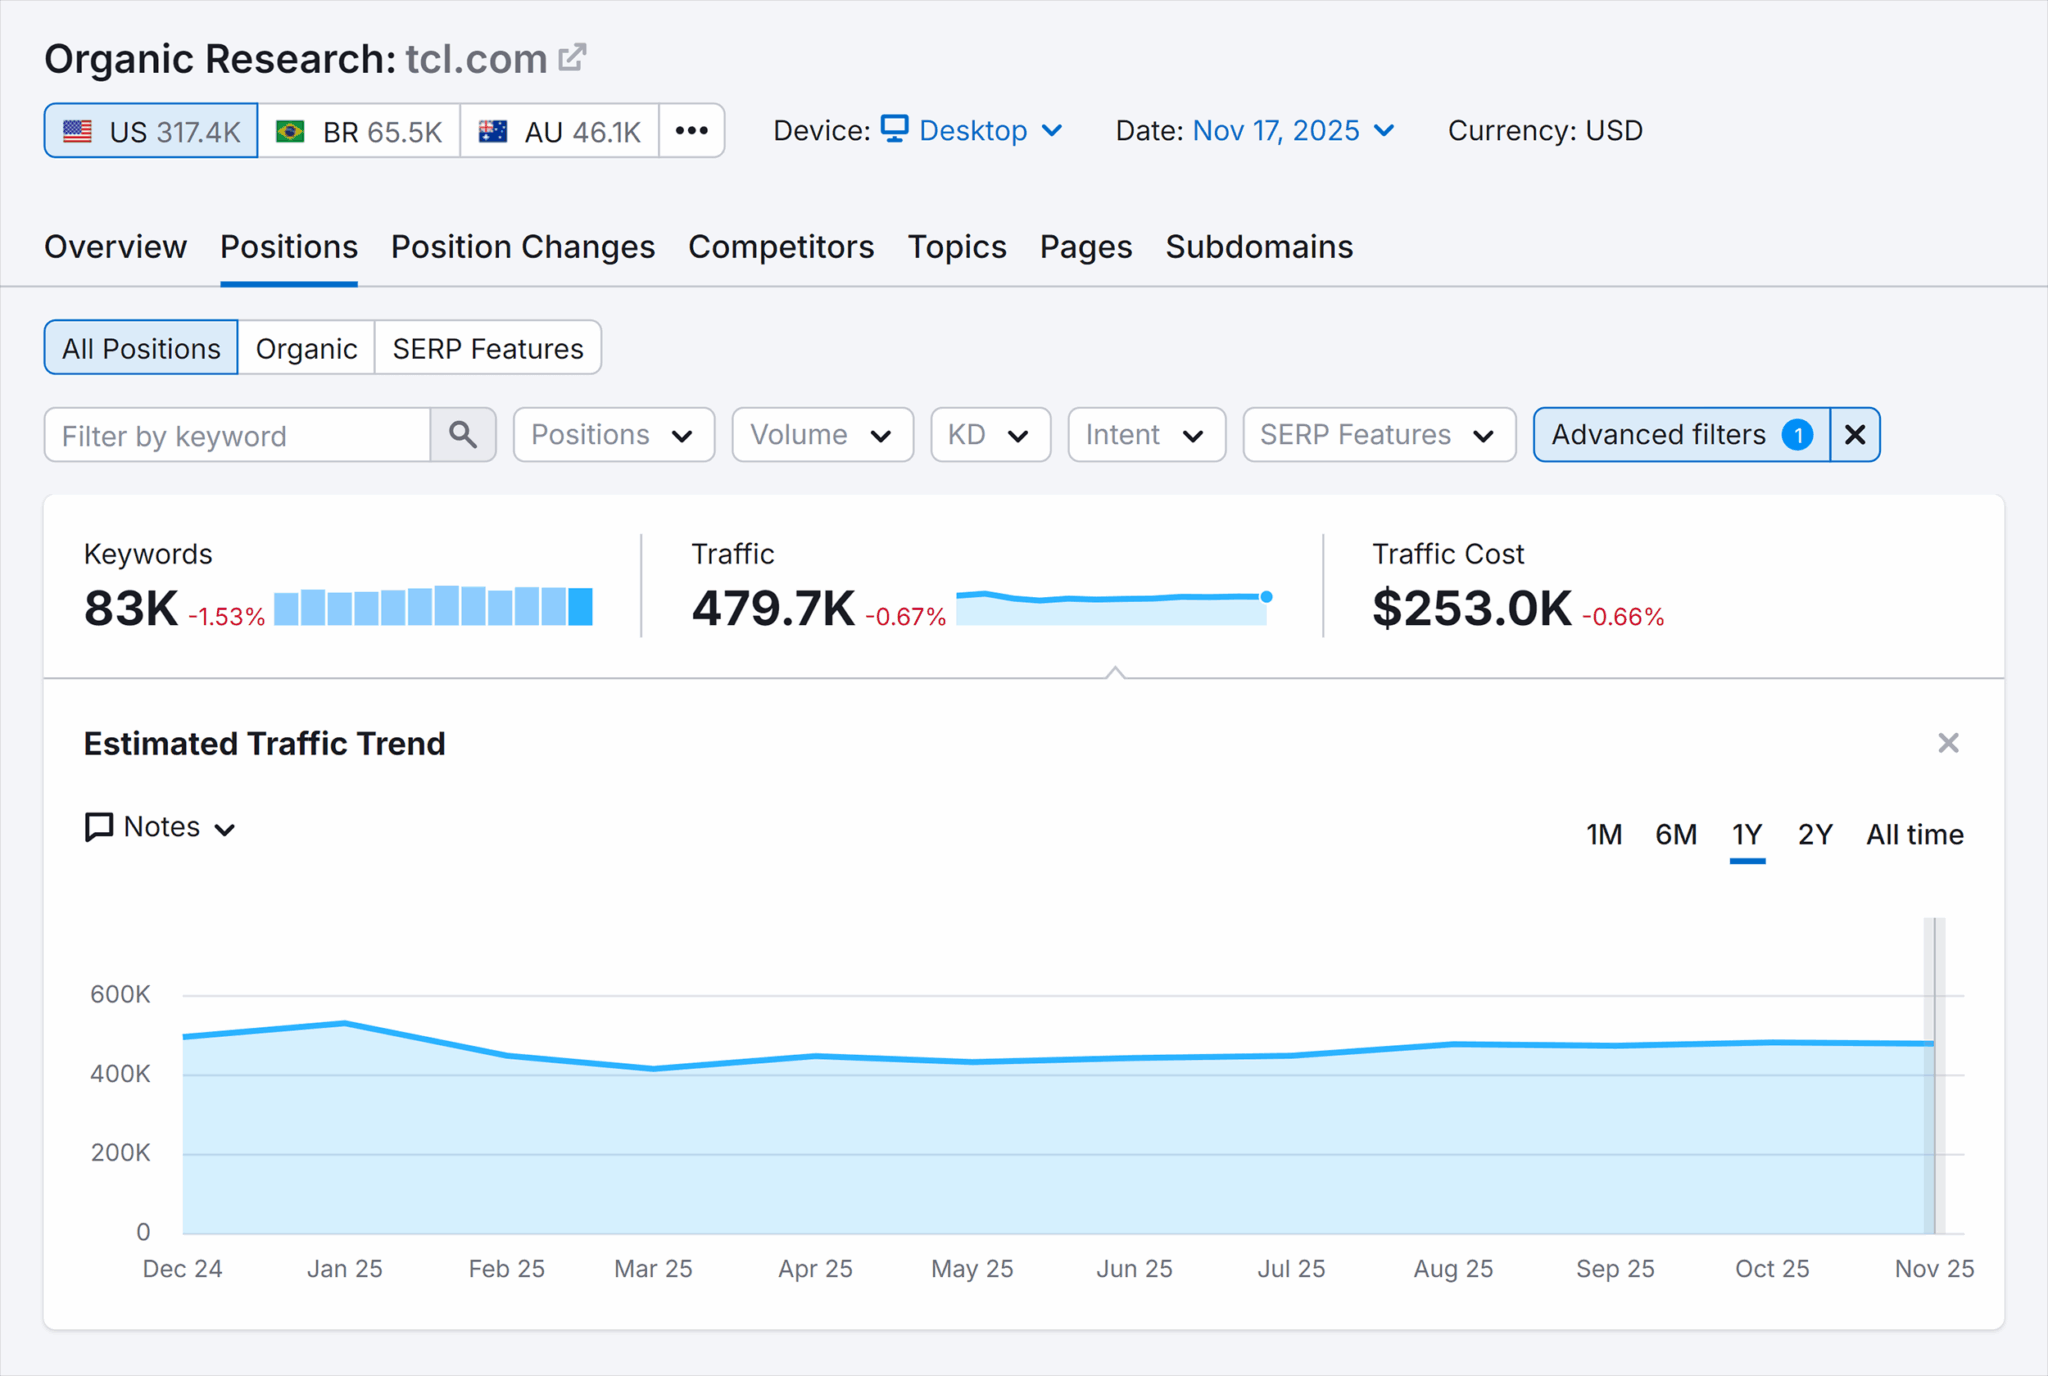
    SEO effectively drives traffic to my site, allowing me to evaluate the success of my conversion rate optimization (CRO) strategies. However, LLMs operate differently, leaving me with the task of creatively connecting the dots.

    ```json
{
  "alt": "SEO report for tcl.com showing keyword, traffic, and cost data with a traffic trend graph.",
  "caption": "Dive into the SEO stats for tcl.com, showcasing keyword performance, traffic data, and cost analysis, all accompanied by a visual traffic trend over the past year.",
  "description": "This image presents an SEO report for tcl.com as of November 17, 2025. It highlights key statistics such as 83K keywords, 479.7K monthly traffic, and a traffic cost of $253K, each experiencing slight decreases. The report includes a traffic trend graph showing fluctuations over the past year. This report is useful for analyzing search performance and strategizing for better visibility. Keywords: SEO, traffic, keywords, tcl.com, report, analysis, performance, trend."
}
```

    The Problem with Methodology

    As I dive deeper into using LLM-related data, I realize this approach requires me to step out of my comfort zone as a performance marketer. My usual reliance on direct attribution and data points is shifted toward constructing a narrative that ties LLM visibility to larger brand storytelling.

    ```json
{
  "alt": "SEO report showing organic research data for tcl.com including keywords, traffic, and estimated traffic trend over two years.",
  "caption": "An in-depth look into tcl.com's SEO performance: Explore key metrics like declining keywords and traffic, alongside an estimated trend over the past two years.",
  "description": "This image displays a detailed SEO report on tcl.com, featuring data such as a 5.37% drop in keywords to 317, a 1.72% decrease in traffic to 2.2K, and an 8.13% rise in traffic cost to $1.1K. The chart illustrates the estimated traffic trend for desktop devices over a two-year span from January 2024 to October 2025, with significant fluctuations and an overall downward trajectory. This visual is essential for analyzing SEO metrics and understanding website performance in different markets, including the US, Brazil, and Australia."
}
```

    This method isn’t novel, however. Brand marketers have dealt with indirect metrics since the days of billboard advertising. Still, the shift requires me to create insights from what might seem like fragmented LLM data.

    ```json
{
  "alt": "Search results for 'is tcl 6 series a good tv' showing review snippets from RTINGS, PC Verge, and Reddit.",
  "caption": "Curious about the TCL 6 Series TV? Explore a compilation of expert reviews and user opinions from RTINGS, PC Verge, and Reddit.",
  "description": "This image displays Google search results for the query 'is tcl 6 series a good TV.' The results include snippets from RTINGS, PC Verge, and Reddit discussing the TCL 6 Series TV. The RTINGS review describes it as a great overall product, highlighting its versatility. PC Verge emphasizes the TV's excellent picture quality and Roku features, with a 4.2-star rating. Meanwhile, a Reddit thread discusses the TCL 6 Series model R646, with users praising its color and gaming features. This image provides a quick overview of expert and user assessments of the TCL 6 Series TV."
}
```

    Metrics and Approach to LLM Impact Measurement

    Uncovering the true value brought by LLM visibility metrics is a layered and comprehensive process. To do this accurately, I need to understand the wider ecosystem of my organization’s promotional efforts. This understanding allows me to determine the root cause of site traffic or branded searches effectively.

    ```json
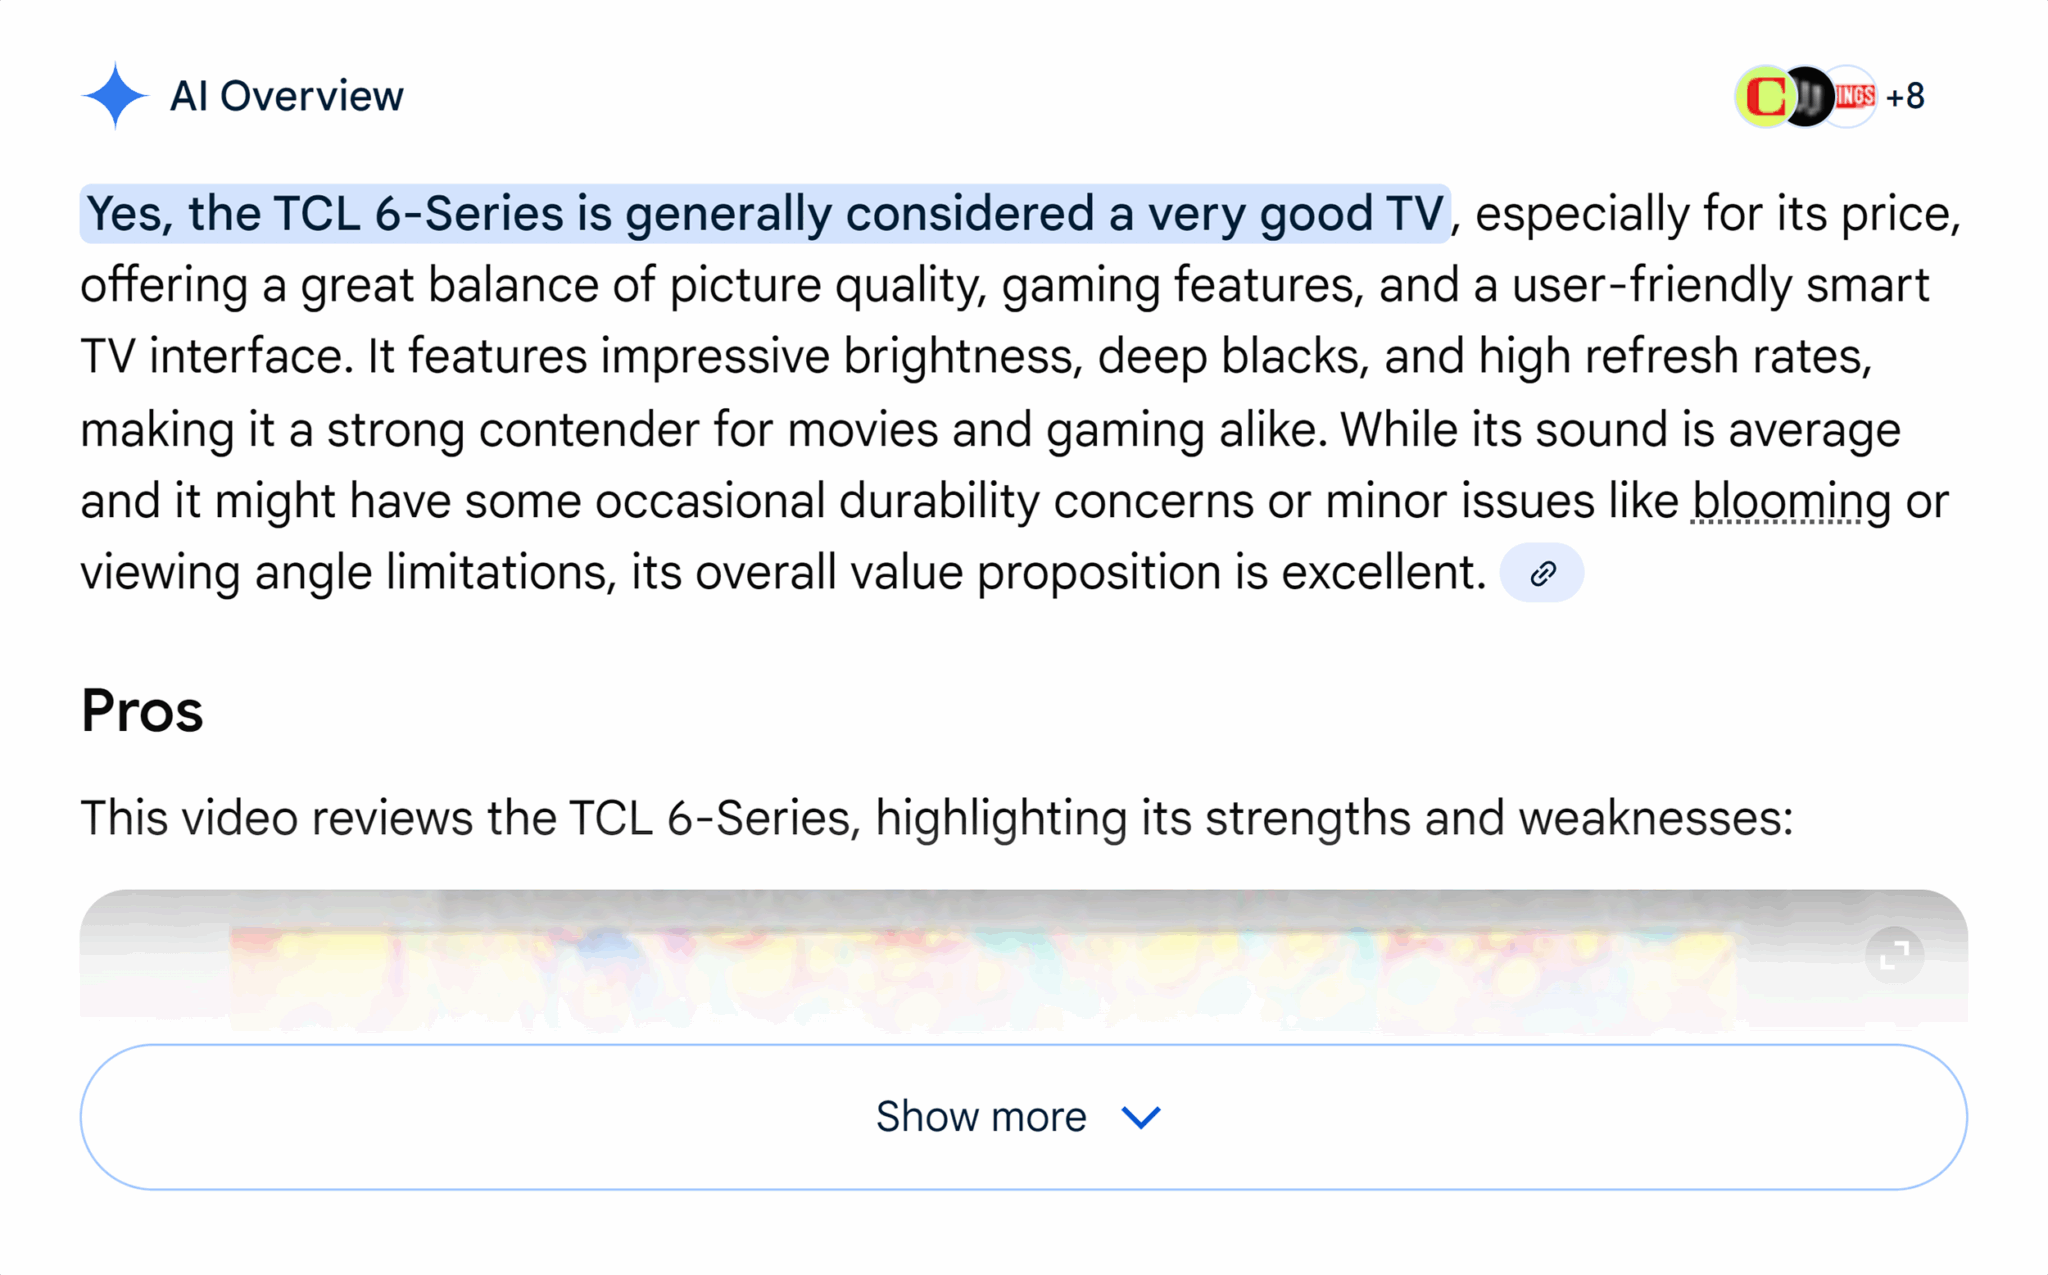
{
  "alt": "Text review of the TCL 6-Series TV highlighting its strengths and weaknesses.",
  "caption": "Discover why the TCL 6-Series TV is celebrated for its picture quality and gaming features, balancing affordability with performance.",
  "description": "This image features a text review of the TCL 6-Series TV, emphasizing its value for money with excellent picture quality, gaming features, and a smart TV interface. The text acknowledges minor issues like blooming and sound quality but highlights the TV’s competitive edge for movies and gaming. Keywords: TCL 6-Series, TV review, picture quality, gaming features, smart TV."
}
```

    For instance, if a TV ad campaign runs concurrently with optimizing for LLM mentions, analyzing their impact becomes essential. Only with complete awareness of such activities can I identify true causality or correlation.

    ```json
{
  "alt": "Line graph showing share of voice trends for Samsung, LG, and TCL over a span of one month.",
  "caption": "Explore the fluctuating share of voice for Samsung, LG, and TCL across a bustling month, revealing dynamic brand interactions.",
  "description": "This line graph displays the share of voice trends for three major brands: Samsung (blue), LG (yellow), and TCL (green), over a monthly period starting October 3rd to November 2nd. The graph showcases the daily variations in visibility and mentions for each brand, highlighting peaks and troughs in their market presence. Useful for tracking brand performance and consumer engagement over time."
}
```

    From here, I find that LLM visibility data is usually just the starting point. It’s unlike traditional SEO insights, which might be more apparent and direct. My task is to delve deeper, probing these data points to uncover richer insights.

    ```json
{
  "alt": "Visibility overview dashboard for buffalowildwings.com showing AI visibility score and audience data across multiple platforms.",
  "caption": "Explore the visibility insights of buffalowildwings.com with this detailed dashboard, highlighting AI visibility scores and audience metrics over time.",
  "description": "The image displays a visibility overview dashboard for buffalowildwings.com. It includes AI visibility scores, with a total score of 74 out of 100, labeled as medium. There are graphs indicating trends in total AI visibility, Chat GPT, AI Overview, and AI Mode from September to October 2025. The audience metrics show a monthly audience of 98.7 million, with an increase of 3.9 million, and mentions at 18.4K, which decreased by 390. The mention sources include Chat GPT, AI Overview, and AI Mode, with future integration of Gemini."
}
```

    The Branded Search of It All

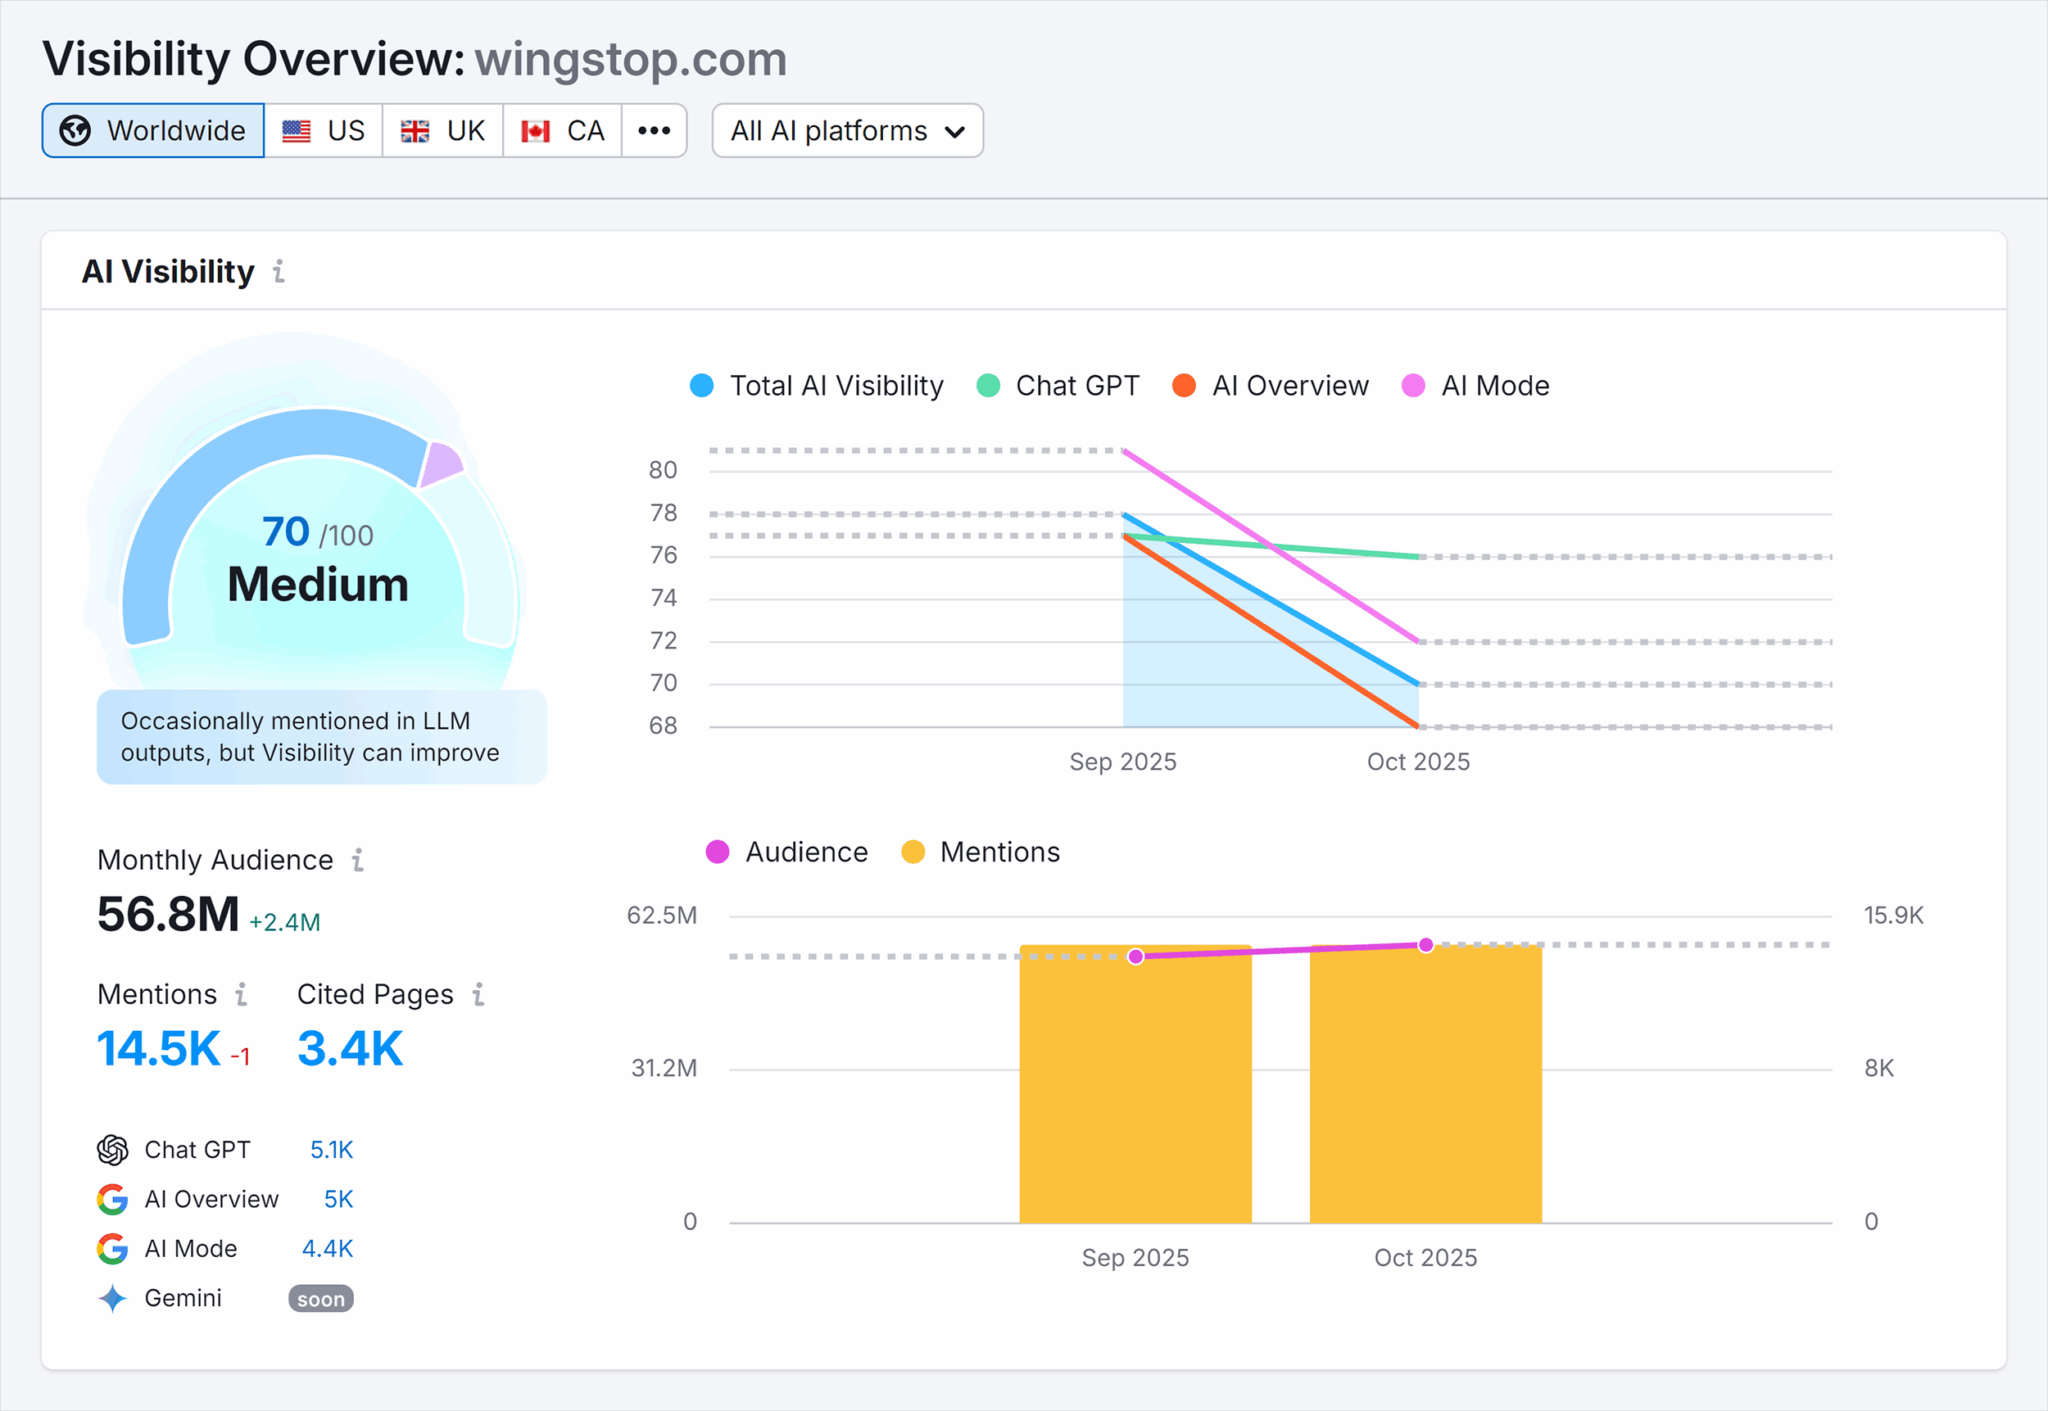
    I’ve noticed that brand search provides exceptional insights into LLM performance, offering a rich vein of marketing intelligence. The comparison between two competing chicken wing chains, Buffalo Wild Wings and Wingstop, brightened this understanding for me. While their LLM citations differ, their brand awareness through social media presence offers a clearer picture of market positioning.

    ```json
{
  "alt": "AI visibility overview for wingstop.com showing medium AI visibility and audience metrics for Sep to Oct 2025.",
  "caption": "Wingstop.com is currently rated as having medium AI visibility with audiences engaging steadily through to October 2025.",
  "description": "This image displays an AI visibility overview for wingstop.com. It highlights a medium visibility score of 70/100, with key metrics such as monthly audience at 56.8M and mentions at 14.5K. The accompanying chart visualizes trends in audience and mentions from September to October 2025 across platforms like Chat GPT and AI Overview."
}
```

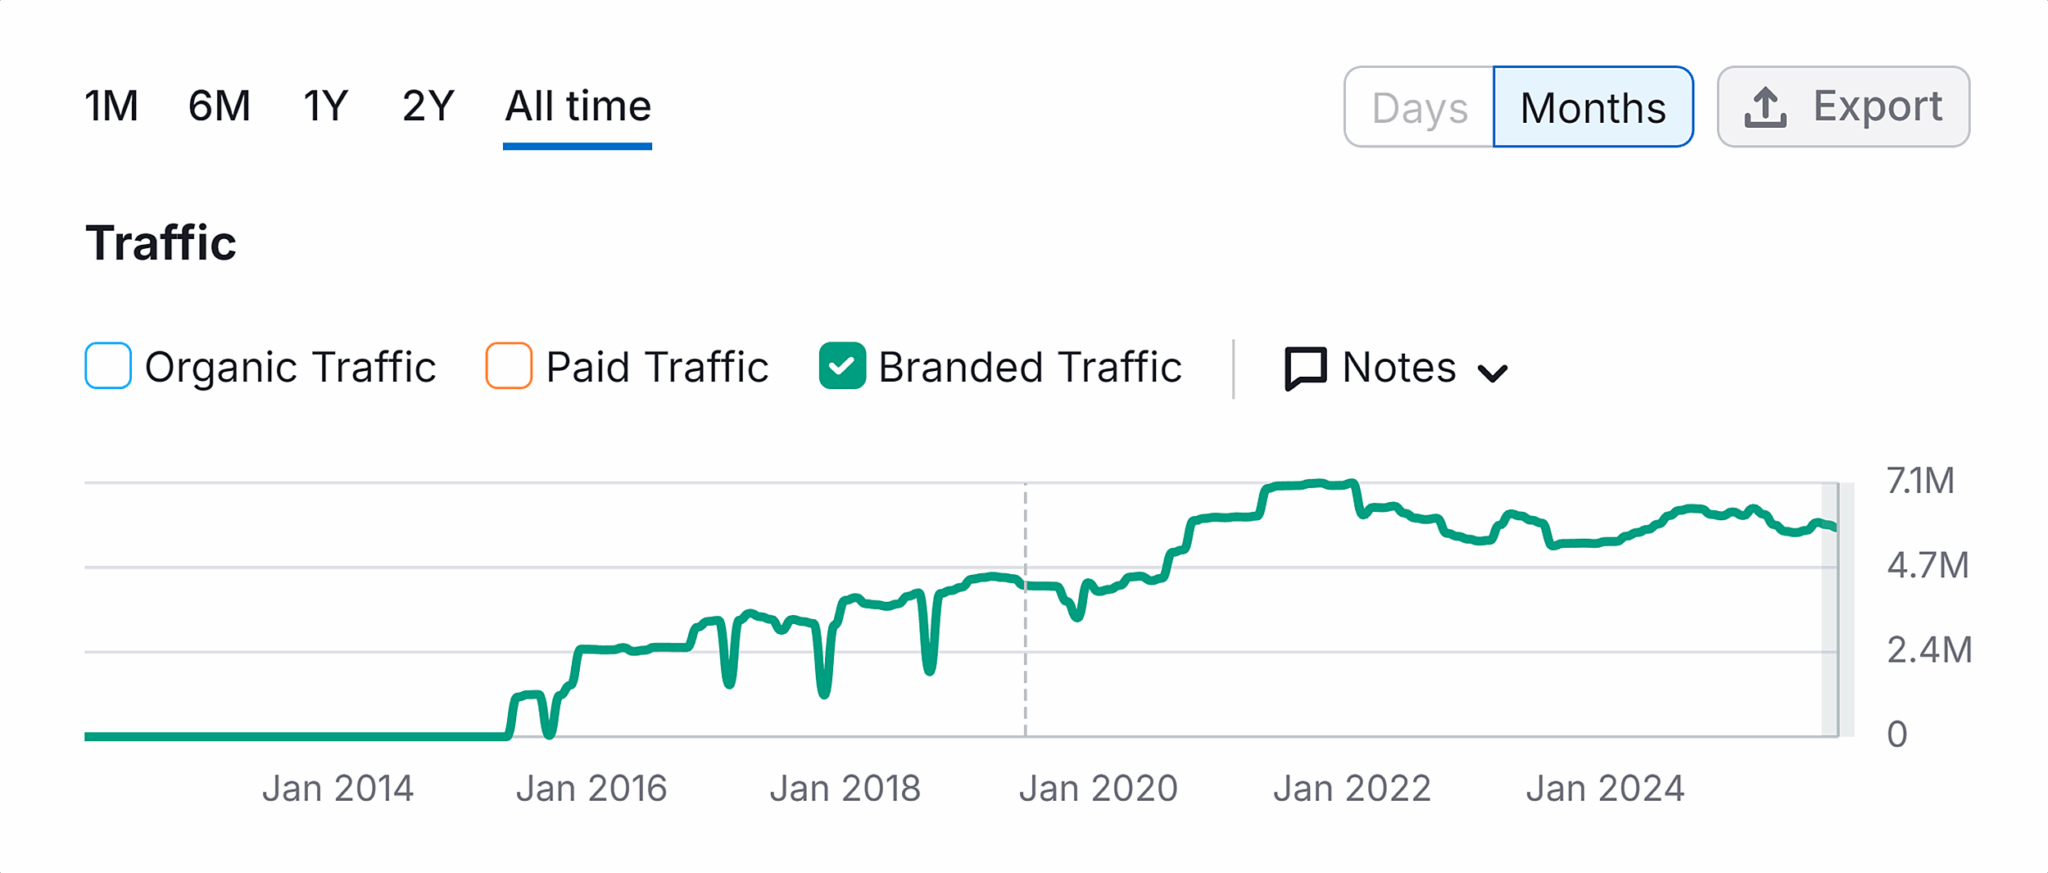
    Simply examining the branded search traffic showed me how both brands performed similarly on Google, despite their different social media followings. Here lies the heart of utilizing search data creatively to find LLM visibility data strategies.

    ```json
{
  "alt": "Instagram profiles of Wingstop and Buffalo Wild Wings with logos and follower counts.",
  "caption": "Wingstop and Buffalo Wild Wings go head-to-head on Instagram, showcasing their vibrant profiles and follower stats. Which wing will you pick?",
  "description": "This image displays the Instagram profiles of two popular restaurants, Wingstop and Buffalo Wild Wings. Wingstop's profile features a green logo, 772K followers, and promotes their 'Fiery Lime' flavor. Buffalo Wild Wings showcases a yellow logo with a bison, boasting 540K followers, and advertises their 'Pick 6 Meal For 2'. Both profiles include website links and number of posts and followings, emphasizing their presence on social media."
}
```

    Rather than merely counting traffic, I am now compelled to consider the number of branded keywords involved, providing a sometimes surprising view on brand awareness and diversity. This approach provides a richer understanding of LLM visibility’s impact.

    ```json
{
  "alt": "Graph showing branded traffic growth from 2014 to 2024.",
  "caption": "Branded traffic trends over a decade reveal growth patterns and fluctuations from 2014 to 2024.",
  "description": "This line graph illustrates the growth of branded traffic from 2014 to 2024. Displayed over a timeline, the data reveals significant upward trends with moments of fluctuation, particularly notable around 2018 and 2022. The graph uses a green line to represent branded traffic, with metrics ranging from 0 to 7.1 million. The interface includes options to view data in various time frames, including days and months, and features a menu for exporting the data."
}
```

    Direct Traffic: My Trusted LLM Data Companion

    I’ve come to see direct traffic as an essential part of my LLM data narrative. Far from being a black hole, direct traffic can often indicate brand awareness and affinity, especially when correlated with LLM visibility metrics. Understanding these correlations allows me to paint a clearer picture of AI’s practical impact on consumer behavior.

    ```json
{
  "alt": "Traffic chart showing branded traffic from January 2014 to January 2024 with steady growth and fluctuations.",
  "caption": "Charting Success: This graph illustrates the rise and fluctuations in branded traffic over a decade, painting a picture of strategic growth!",
  "description": "This image features a traffic chart depicting the growth of branded traffic from January 2014 to January 2024. The graph shows a green line that represents the number of visitors in millions, starting near zero in 2014 and rising to over 4.7 million by 2024. The data reflects a general upward trend with noticeable fluctuations, representing periodic changes in traffic levels. The chart includes options for viewing organic and paid traffic, and it is set to display monthly data over the entire period. Keywords: traffic chart, branded traffic, growth, analytics."
}
```

    For instance, if I compare LG and TCL, LG’s superior direct traffic and increasing momentum in LLM visibility suggest a tangible AI-driven influence, a possibility I must explore through multi-metric analysis.

    ```json
{
  "alt": "SEO dashboard for buffalowildwings.com showing keyword metrics and traffic data.",
  "caption": "Explore the SEO metrics of buffalowildwings.com, showcasing keyword rankings and traffic trends as of November 17, 2025.",
  "description": "The image displays an SEO research interface for buffalowildwings.com, focusing on positions and metrics. It highlights keyword usage of 360.2K with a 3.28% change, alongside traffic data of 5.7M visitors and a traffic cost of $886.4K. The dashboard offers a detailed view of SEO performance across different regions, including the US, Canada, and the UK, with device-specific metrics for desktop usage."
}
```

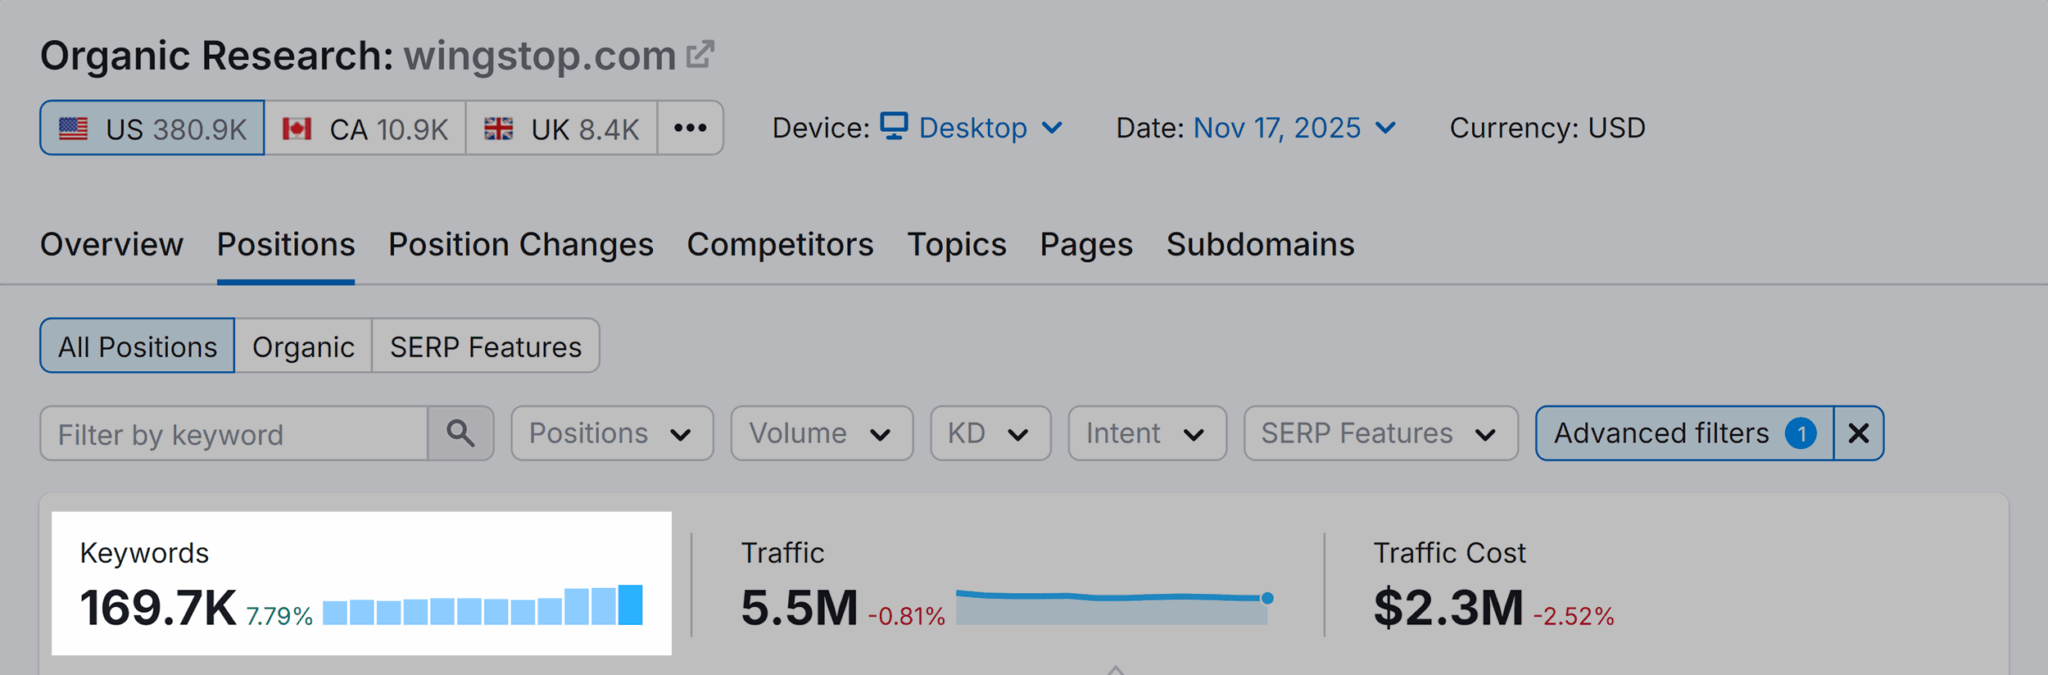
    Considering various metrics together and identifying shared trends offer insight into how LLM visibility might be affecting my brand’s overall recognition and engagement.

    ```json
{
  "alt": "Screenshot of organic research data for wingstop.com showing keyword statistics, traffic, and traffic cost.",
  "caption": "Explore Wingstop.com's robust organic search performance, showcasing a substantial keyword volume and valuable traffic data insights.",
  "description": "This image displays a screenshot from an SEO tool showing organic research data for wingstop.com. It highlights key metrics, including 169.7K keywords with a growth of 7.79%, 5.5M in traffic with a slight decrease of 0.81%, and a traffic cost of $2.3M, down 2.52%. The interface presents data for the US, Canada, and the UK, with options to filter results by keywords and positions. This detailed view assists in analyzing website performance and search engine visibility."
}
```

    Not Just One Metric: Stitching Together LLM Data Stories

    Ultimately, it’s about developing a comprehensive data story from LLM visibility insights. This story goes beyond direct KPIs, utilizing various data sources, such as bounce rates and organic traffic, to add depth and relevance to the narrative. Every piece of performance-focused data stands as testimony to the expertise we can bring to LLM visibility.

    ```json
{
  "alt": "Dashboard showing keyword, traffic, and cost metrics for 'sauce' with a traffic trend graph.",
  "caption": "Explore the SEO journey of 'sauce' with detailed keyword performance, traffic data, and cost analysis over the past year.",
  "description": "This image depicts an SEO dashboard for the keyword 'sauce,' showing 406 keywords with a 3.79% decrease, traffic at 10.4K with a slight 0.04% drop, and a traffic cost of $585 reflecting a 5.49% decrease. A traffic trend graph illustrates data over a year, highlighting fluctuations. Useful for SEO analysis and tracking keyword performance metrics."
}
```

    Total LLM visibility data, when creatively amalgamated with performance data, can transform insights into actionable strategies that align with pragmatic business objectives, showcasing our value in the AI-driven landscape.

    ```json
{
  "alt": "Traffic analytics chart showing keyword and traffic data for 'sauce'.",
  "caption": "Dive into the analytics! This chart reveals keyword dynamics and traffic trends for the term 'sauce' over the past year.",
  "description": "This image displays a traffic analytics dashboard for the keyword 'sauce', revealing data on keyword volume, traffic, and traffic costs. The chart shows an estimated traffic trend spanning a year from December to November, with metrics indicating a slight decline in keyword count and traffic cost, but an increase in total traffic. The interface includes advanced filter options and time range adjustments for detailed insights."
}
```

    Inspired by this post on Search Engine Land.

    crushpress.ai community screenshot
  • Unlocking B2B Success: Understanding Your Industry’s CAC

    Unlocking B2B Success: Understanding Your Industry’s CAC

    Last updated: November 21, 2025

    When people ask me how to assess the ROI of their marketing campaigns, I always suggest starting with the customer acquisition cost (CAC). CAC, alongside Customer Lifetime Value (LTV or CLV), is vital in navigating the realm of B2B marketing.

    By examining your CAC, you can identify which marketing channels deserve more attention and which aspects of your marketing strategy could use improvement. Benchmarking your CAC against industry standards is key.

    The aim of this article is to guide you in recognizing what qualifies as a good CAC in your industry and to encourage you to even explore how your CAC fares compared to related industries.

    Calculating Your Customer Acquisition Cost

    To calculate your CAC, simply divide your total marketing and sales expenditures by the number of new customers acquired, using the formula below:

    Cac Equation 2 1 1024x152 (1)

    Make sure to perform this calculation annually or on a rolling basis to accommodate seasonal customer behavior changes. If your B2B business enjoys consistent year-round sales, consider quarterly CAC analysis to gauge the impact of new initiatives.

    Additionally, calculating CAC per channel allows you to compare different marketing strategies effectively.

    This report emphasizes B2B CACs. For B2C data, see our B2C Edition.

    After determining your CACs, you can measure them against the industry averages shared below.

    Average Customer Acquisition Cost (CAC) By Industry

    The table below presents average CACs across 29 B2B industries, gathered from client data spanning January 2022 to August 2025. Consider these dataset limitations:

    • Within each industry, we categorize CAC as Organic or Inorganic. Organic CAC includes mainly SEO and Organic Social, while Inorganic CAC covers PPC / SEM and Paid Social.
    • Email marketing, events, and other channels are excluded due to insufficient data.
    • Data from client analytics is anonymous. Organic data leans towards SEO and Inorganic towards PPC / SEM, given our B2B clientele and service focus.

    Below are the analysis results:

    [Insert table block here]

    Average Customer Acquisition Cost (CAC) for SaaS Companies

    Our team also reviewed average customer acquisition costs across 22 SaaS industries to determine each industry’s B2B CAC.

    [Insert table rows here]
    SaaS IndustryCAC

    How Your CAC Relates to Customer Lifetime Value

    While CAC reflects acquisition costs, Customer Lifetime Value (LTV) reveals the average profit per customer. Calculate LTV by dividing your profit over a chosen period by the number of unique customers, and multiply by their average purchase frequency. Aim for an LTV to CAC ratio of at least 3:1 for optimal financial health.

    Keep in mind historical trends and competitor data. A 2:1 LTV to CAC ratio isn’t necessarily negative if you’re seeing improvement over time.

    Particularly during new campaigns or long-term strategies, your ratios may fluctuate. For example, if you’ve launched an SEO campaign, results typically appear after 4-6 months.

    How to Lower Your CACs

    Organic CAC often triumphs over inorganic due to its longevity and skill-based approach. Investing in organic channels yields sustainable results without ongoing cash infusion.

    If you’re curious about organic marketing to reduce your CAC, feel free to contact us. Our firm, with multiple U.S. locations, has helped various B2B sectors achieve superior ROI with SEO strategies.

    Further Reading

    For deeper insights into CAC and its relation to LTV, browse the following resources:

    Source


    Inspired by this post on First Page Sage Blog.


    crushpress.ai community screenshot
  • Dale Olorenshaw’s £15K PPC Blunder: Lessons in Honesty & Recovery

    Dale Olorenshaw’s £15K PPC Blunder: Lessons in Honesty & Recovery

    On episode 331 of PPC Live The Podcast, I had an enlightening conversation with Dale Olorenshaw, the Head of Paid Media and Search at StrategiQ. Dale shared a painful yet invaluable experience involving a high-budget test campaign and a critical oversight that taught him powerful lessons.

    The costly tale centered around a test campaign with a £15,000 budget. While the campaign saw impressive clicks and engagement, it surprisingly yielded almost no conversions. A month later, the client pointed out that all traffic was directed to the wrong landing page, never reaching the newly built dedicated test page.

    Several internal missteps led to this error. Dale bypassed the internal QA process by managing the campaign solo. He shrugged off instincts that flagged something was amiss and, due to seemingly normal top-line metrics, he overlooked a deeper dive into conversion discrepancies. The most humbling moment was realizing the client discovered the oversight first.

    Although initial panic ensued, Dale refrained from sending a hasty, emotional response. Instead, he acknowledged the issue, paused to clear his mind, and waited to gather all the facts. The following morning, he approached his account director with full transparency and honesty, declaring, “I’ve messed up.”

    StrategiQ stood firmly behind Dale, focusing on solutions rather than blame. They managed to recover part of the wasted budget, provided extra work at no additional cost, and offered discounted fees for the next project phase. Once relaunched correctly, the client relationship remained intact.

    This experience profoundly impacted Dale’s professional approach. He now adheres strictly to QA processes, trusts his instincts when numbers seem off, and promotes team accountability with second opinions and checks, acknowledging that seniority doesn’t shield from human errors.

    Dale also highlighted a common PPC issue he continues to observe: the overcrowding of Responsive Search Ads. Google’s push for numerous headlines and descriptions can saturate ads with small budgets, leading to insufficient data for meaningful insights. His advice is to streamline assets for clarity and quality.

    For Dale, discussing mistakes openly is crucial. He argues that the PPC community needs to normalize these conversations since newcomers may only witness success stories online and equate mistakes with incompetence. Sharing real experiences shows that growth often springs from problem-solving.

    In closing, Dale offers leadership advice on fostering a supportive culture. Encouraging honesty, removing blame, and focusing on collective problem-solving ensures that mistakes are seen as learning opportunities rather than failures.

    If there’s one takeaway, let it be this: Don’t react impulsively, stay honest, and treat client funds with the utmost care as if they were your own.


    Inspired by this post on Search Engine Land.


    crushpress.ai community screenshot
  • Combatting Affiliate Fraud: Secure Your 2026 Growth

    Combatting Affiliate Fraud: Secure Your 2026 Growth

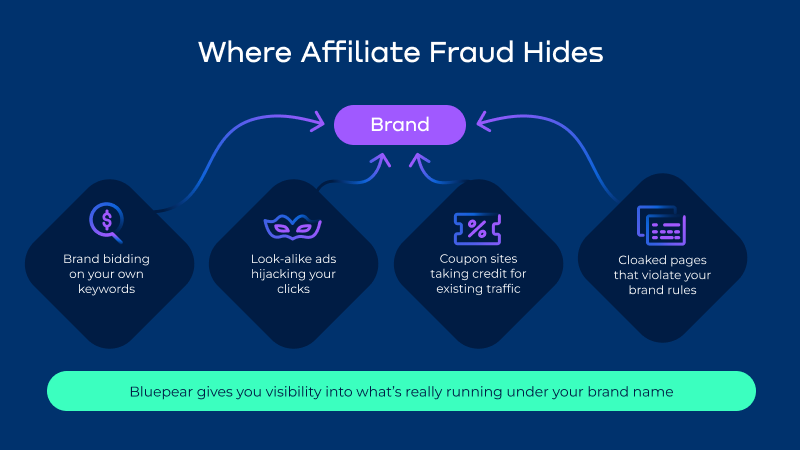
    Affiliate marketing is a major driver of revenue, but it also hides significant losses. I’ve seen firsthand how brand bidding, ad hijacking, coupon abuse, and subtler forms of affiliate fraud can erode ROI and distort attribution figures.

    The critical issue isn’t whether these challenges exist, but rather understanding how much they’re impacting our business. In this article, I delve into the most prevalent types of affiliate marketing fraud. I’ll also share insights on how modern tools like Bluepear offer advanced affiliate fraud detection strategies that protect our growth, reputation, and budget.

    Not all affiliate programs offer the same benefits, nor do they come with the same risks. Particularly in SaaS, where affiliate commissions can be between 20% to 70%, these programs become highly enticing targets for fraudsters.

    ```json
{
  "alt": "Diagram illustrating different methods where affiliate fraud hides, such as brand bidding and look-alike ads, targeting a central brand element.",
  "caption": "Uncover the hidden tactics of affiliate fraud targeting your brand, from look-alike ads to misleading coupon sites.",
  "description": "This diagram highlights the various ways affiliate fraud can undermine a brand. It features a central 'Brand' element with arrows pointing to different fraudulent methods: brand bidding, look-alike ads, coupon sites, and cloaked pages. The image emphasizes the importance of understanding how these tactics operate to better protect brand integrity. The text at the bottom promotes Bluepear as a solution for gaining visibility into these fraudulent activities."
}
```

    Fraudsters exploit trust gaps, often bidding on brand terms or using shady tactics like ad hijacking and coupon code misuse to siphon off profits. A staggering 63% of affiliate marketers identify these threats as their primary concern.

    Unfortunately, much of this fraud operates under the radar. Affiliates execute campaigns and manage landing pages without real-time monitoring, which means you may end up paying commissions on existing traffic or, worse, funding brand impostors.

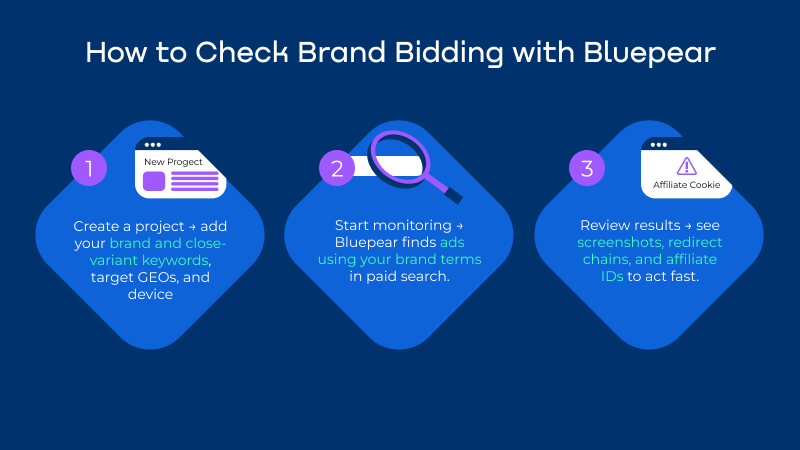
    ```json
{
  "alt": "Three-step guide on checking brand bidding with Bluepear featuring project creation, monitoring, and review stages.",
  "caption": "Master brand bidding with Bluepear by creating a project, monitoring brand-related ads, and reviewing strategic results. Empower your marketing tactics!",
  "description": "This image illustrates a three-step process for checking brand bidding using Bluepear. Step 1 involves creating a project by adding your brand and keywords, targeting GEOs, and selecting devices. Step 2 focuses on monitoring, with Bluepear identifying ads using your brand terms in paid search. Step 3 is about reviewing results such as screenshots, redirect chains, and affiliate IDs. Ideal for marketers aiming to enhance their brand's online presence."
}
```

    Let’s dig deeper into common fraud tactics and how to recognize and counteract them early on. Equipped with strategies, you can shield your program from such threats.

    I focus on four primary fraud tactics: brand bidding, ad hijacking, coupon abuse, and non-compliant content. Each poses unique challenges but can be counteracted with the right preventative measures.

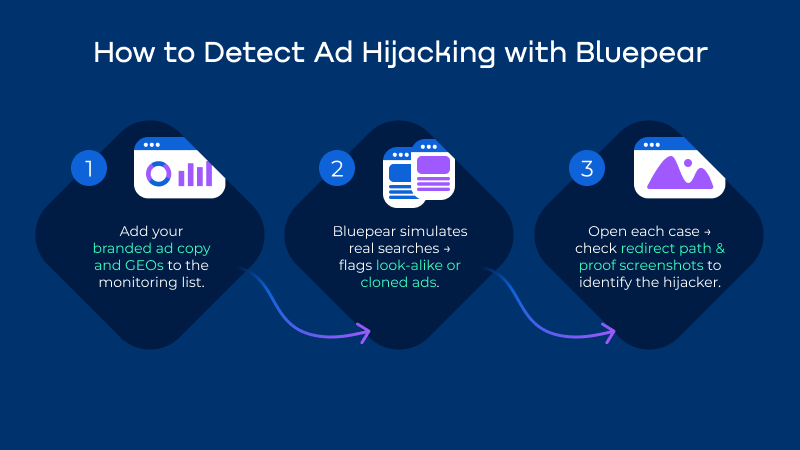
    ```json
{
  "alt": "Infographic on detecting ad hijacking with Bluepear, outlining three steps using icons and arrows.",
  "caption": "Discover how Bluepear helps protect your brand by detecting ad hijacking through a simple three-step process.",
  "description": "This infographic titled 'How to Detect Ad Hijacking with Bluepear' outlines three key steps using visuals. Step one involves adding branded ad copy to a monitoring list. Step two uses Bluepear to simulate real searches, identifying look-alike ads. Finally, step three involves checking redirect paths to identify hijackers. The design uses icons, arrows, and a structured flow to convey the process effectively."
}
```

    Brand bidding occurs when someone purchases ads using your brand name. This diverts potential customers who are actively searching for your product, resulting in needless commission payments. It’s crucial to maintain a detailed list of brand-related keywords in your affiliate terms and monitor for sudden spikes in performance metrics.

    Ad hijacking mimics your paid search ads, lowering your campaign visibility. Regular checks and test searches can expose these fraudulent activities.

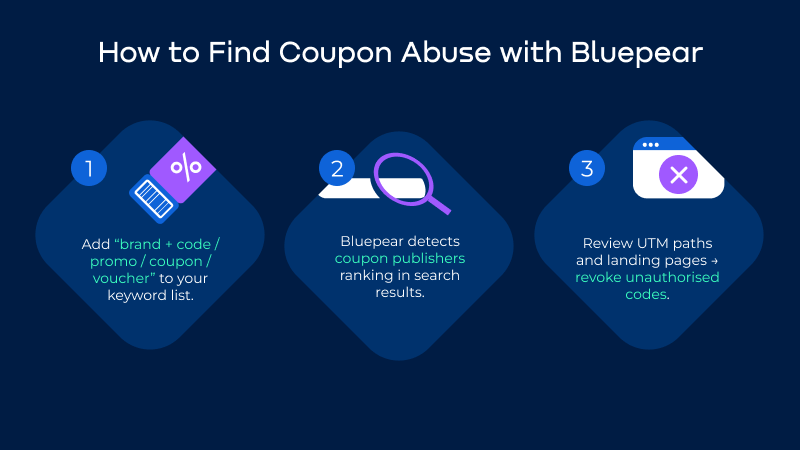
    ```json
{
  "alt": "Infographic on finding coupon abuse with Bluepear, featuring three steps with icons and text.",
  "caption": "Discover how Bluepear helps you tackle coupon abuse with three key steps: keyword addition, coupon detection, and code revocation.",
  "description": "This infographic titled 'How to Find Coupon Abuse with Bluepear' outlines three steps. Step 1: Add 'brand + code / promo / coupon / voucher' to your keyword list with an icon of a pencil and discount symbol. Step 2: Bluepear detects coupon publishers in search results, depicted by a magnifying glass icon. Step 3: Review UTM paths and landing pages to revoke unauthorized codes, illustrated with a web page icon. This guide enhances digital marketing strategies by tackling unauthorized coupon use."
}
```

    Coupon abuse is trickier; it manipulates traffic from affiliates who rank high for brand-related coupon searches. Ensuring coupon activity is pre-approved and regularly monitoring search results helps mitigate this fraud.

    Non-compliant content can easily escape detection. Cloaking tactics mean users see different content than compliance teams. Establish strong creative guidelines and treat content audits as an ongoing activity.

    ```json
{
  "alt": "Bluepear infographic on spotting non-compliant content with three steps and icons.",
  "caption": "Discover how Bluepear helps you identify non-compliant content with a simple three-step process, enhancing your digital content's credibility and compliance.",
  "description": "This infographic titled 'How to Spot Non-Compliant Content with Bluepear' illustrates a three-step process with icons. Step 1: Add affiliate domains and trigger words like 'official' and 'discount.' Step 2: Bluepear decloaks hidden landing pages and captures real user views. Step 3: Review evidence to tag violations or send notices automatically. The design uses a blue background with a modern, clean layout, aimed at improving content compliance monitoring."
}
```

    Defending against affiliate fraud requires continuous vigilance, clear program rules, and leveraging technology. Platforms like Bluepear use automated systems to highlight and eliminate fraud, giving you back control.

    For 2026, my focus is on building stronger relationships with affiliates, ensuring transparency, and promoting a culture that prioritizes honesty and clear communications.

    Ultimately, affiliate fraud is a continually evolving threat. By understanding these tactics, setting clear expectations, and utilizing advanced tools, we can protect our interests and secure sustainable growth.


    Inspired by this post on Search Engine Land.


    crushpress.ai community screenshot
  • Master Voice Search with AEO: Your Ultimate Guide

    Master Voice Search with AEO: Your Ultimate Guide

    I’m excited to guide you through optimizing for voice search and Answer Engine Optimization (AEO) using conversational content, structured data, and strategies to achieve precise and answer-focused results.


    Inspired by this post on HiGoodie Blog.


    crushpress.ai community screenshot
  • Revolutionize Your Google Ads with Journey Aware Bidding

    Revolutionize Your Google Ads with Journey Aware Bidding

    I’ve recently come across an exciting development from Google that could change the way we approach Google Ads. It’s called Journey Aware Bidding, and it’s designed to optimize Search campaigns by utilizing signals from every step of the customer journey. This aims to provide a smarter and more efficient way of managing campaigns.

    Google has rolled out this new Search bidding model to enhance prediction accuracy and improve campaign performance. The idea is to consider the entire customer journey, not just the final conversion point.

    How it works: Journey Aware Bidding learns not only from your primary conversion goal but also from non-biddable journey stages. If you’re someone who tracks and defines each step of your purchase funnel meticulously, this model could be particularly beneficial.

    Google advises mapping out the entire process—from lead submission to final purchase—and labeling all critical touchpoints as conversions within standard goals. This method promises to integrate more of the conversion funnel into Google’s prediction models, potentially streamlining lengthy, complex journeys such as lead generation.

    Why it matters: As someone who’s worked extensively with fragmented signals in conversion funnels, I’m intrigued by how Journey Aware Bidding could bring greater efficiency to our campaigns. It emphasizes learning from all key touchpoints, leading to smarter bidding strategies.

    What you should know: To get the most out of this feature, align your optimizations to a single KPI-driven stage, such as purchases or qualified leads. While other journey stages should be marked as primary conversions, they should be excluded from campaign-level or account-default bidding optimization.

    ```json
{
  "alt": "Infographic on Journey Aware Bidding for advertisers with key benefits and pilot information.",
  "caption": "Discover Journey Aware Bidding: A strategy that embraces the whole customer journey, promising improved ad performance for informed advertisers.",
  "description": "This infographic presents 'Journey Aware Bidding', a strategic initiative aimed at enhancing ad performance by monitoring the full customer journey. Key benefits include improved prediction accuracy and performance by leveraging conversion goals. The pilot program allows select advertisers to implement these strategies ahead of a wider rollout. Elements include icons of a magnifying glass and shopping bag, signifying search and commerce. Keywords: Journey Aware Bidding, advertisement strategy, customer journey, pilot program."
}
```

    Ensure that all tracking and categorization are accurate to achieve the best results.

    Pilot phase: Google is launching a closed pilot this year for select advertisers, with plans to expand after refining the model. This could be a game-changer in how we approach Search optimization.

    The bottom line: If you’re ready to rethink how you optimize your campaigns, Journey Aware Bidding might be the innovative approach you’ve been waiting for. By understanding not just what converts, but how users get there, we could see significant improvements.

    First seen: Senior Consultant Georgi Zayakov shared insights about this new bidding model on LinkedIn during Think Week 2025, alongside other intriguing products.


    Inspired by this post on Search Engine Land.

    crushpress.ai community screenshot
  • Discover How AI Elevates Your Shopping Experience

    Discover How AI Elevates Your Shopping Experience

    AI assistants have truly become the front door to retail, shaping the way we interact with products. In my experience, Shopping Analysis provides incredible insights into how products are discovered and recommended during AI-driven conversations. This tool offers retailers much-needed visibility into the dynamics of chat shopping, transforming the way they connect with customers.


    Inspired by this post on Try Profound Blog.

  • Unlock Holiday Shopping with Google’s New AI Features

    Unlock Holiday Shopping with Google’s New AI Features

    As the holiday season approaches, I’m thrilled to share that Google has rolled out a range of exciting AI-powered shopping features. Just recently, Google announced this major update, perfectly timed for our holiday shopping adventures.

    What’s new with AI Mode? Picture this: you can now describe what you need as if you’re chatting with a friend! Google’s AI Mode organizes all the essentials—images, prices, reviews, and inventory—helping you decide confidently and quickly on your next purchase.

    In my Gemini App experience, it has become my go-to for brainstorming gift ideas. It effortlessly compares products and supplies answers with handy shoppable links, all within a chat.

    Are you too busy to check store stock levels? I now let Google’s agentic calling feature make those calls for me, ensuring I know about any promos or stock availability without lifting a finger.

    And here’s something I absolutely love: tracking prices with agentic AI. Whenever an item I’ve been eyeing drops in price at eligible U.S. merchants, I receive a notification. I can let Google purchase it securely using Google Pay, all within my budget!

    Why does this matter? The bustling holiday season is critical for many businesses. With these innovative AI features, I hope to see more traffic and revenue driving local stores rather than distracting buyers from making purchases.

    I’m curious to see how these tools impact our shopping experiences, and I encourage everyone to explore these features to see where your website ranks.


    Inspired by this post on Search Engine Land.