Tag: SEO

  • Ensure AI Sees Your Products: A 6-Point Optimization Guide

    Ensure AI Sees Your Products: A 6-Point Optimization Guide

    I’ve recently delved into the world of AI search engines like ChatGPT, Google AI Mode, and Perplexity, and how they’re transforming the way consumers find and buy products online. It’s clear to me that if my product pages aren’t optimized for these AI assistants, I’m likely missing out on significant traffic and revenue.

    What I’ve discovered is that AI assistants evaluate product pages differently than traditional search engines. They require a deep understanding of products to recommend them confidently to users with varied needs.

    To ensure my product pages are AI-ready, I’ve crafted a simple scorecard focusing on six key factors:

    1. Product specifications
    ```json
{
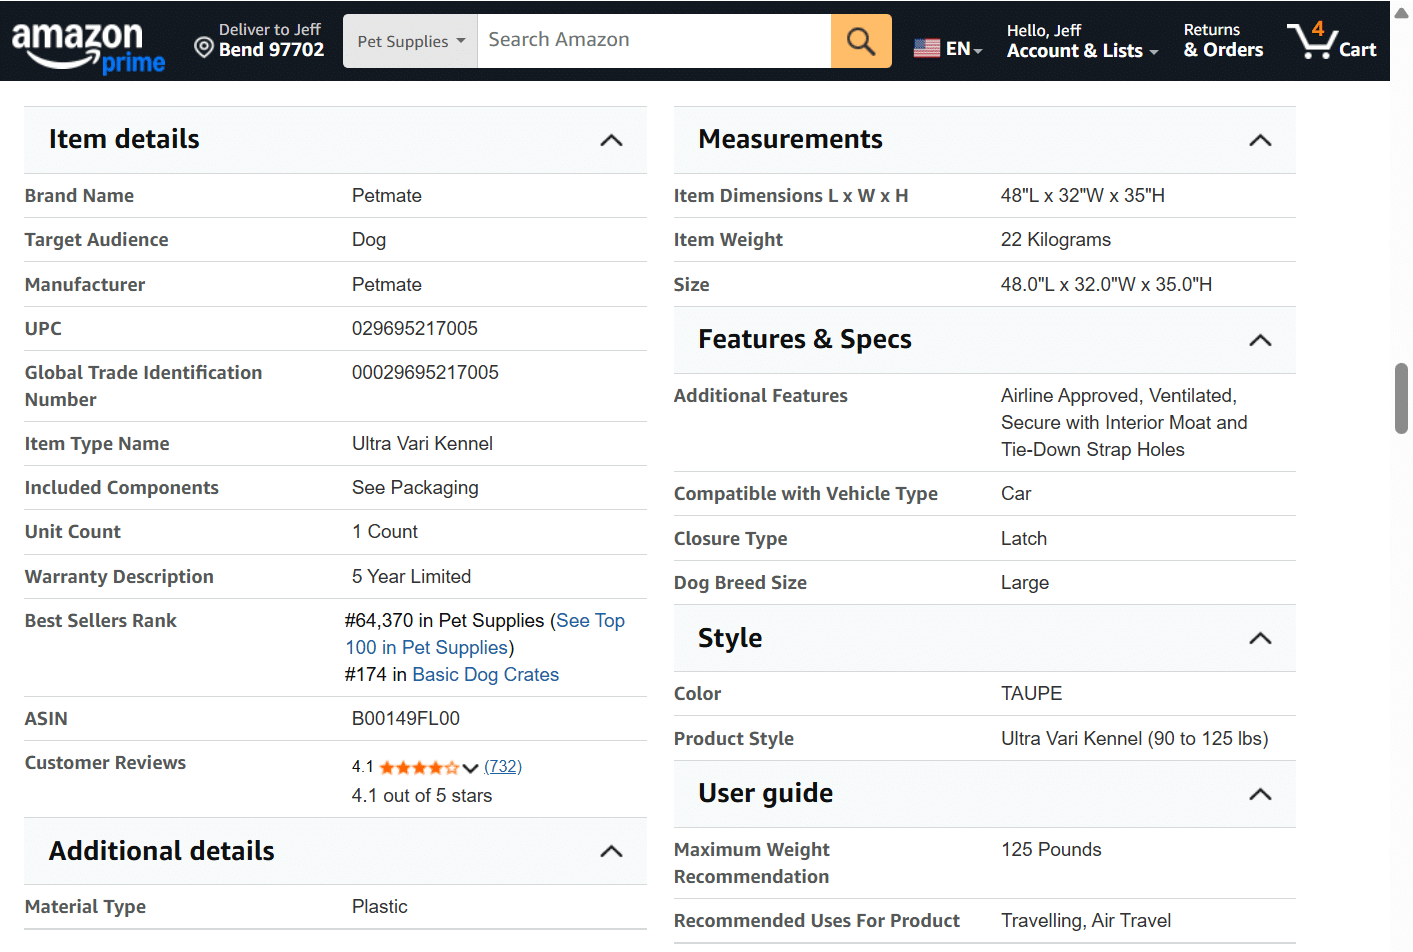
  "alt": "Amazon product details for Petmate Ultra Vari Kennel, large size, dog supplies.",
  "caption": "Explore the features of the Petmate Ultra Vari Kennel, ideal for large dogs. This dog crate is airline-approved and designed for secure travel.",
  "description": "This image shows an Amazon product details page for the Petmate Ultra Vari Kennel, designed for large dogs. The kennel is airline-approved with interior features like ventilation and a moat. It weighs 22 kilograms and measures 48"L x 32"W x 35"H. Made of plastic, it supports dogs weighing 90 to 125 lbs, perfect for air travel. This bestseller ranks #64,370 in pet supplies, with an average rating of 4.1 stars from over 700 reviews."
}
```

    Does the product page clearly display the product’s attributes and specifications?

    AI assistants need explicit specifications to understand my products and match them with customer needs. For example, if someone asks for “an airline-friendly crate for a 115-pound dog,” the AI must see the weight limit clearly to recommend it.

    Amazon excels at this, as their product pages display detailed specifications that likely boost their AI search performance.

    ```json
{
  "alt": "The CapmatchOne logo with a gradient circle and bold text.",
  "caption": "Discover innovation with the CapmatchOne logo, featuring sleek typography and a modern gradient circle.",
  "description": "The CapmatchOne logo features bold, modern typography coupled with a gradient circle, symbolizing connection and innovation. The sleek design conveys a sense of progress and creativity. This image can be used for branding or promotional purposes, appealing to audiences interested in innovative solutions and forward-thinking designs."
}
```

    Action item: I ensure all specifications are clearly presented on my product pages, ideally in a structured table or a list, rather than burying them in the description or marketing copy.

    2. Unique selling points

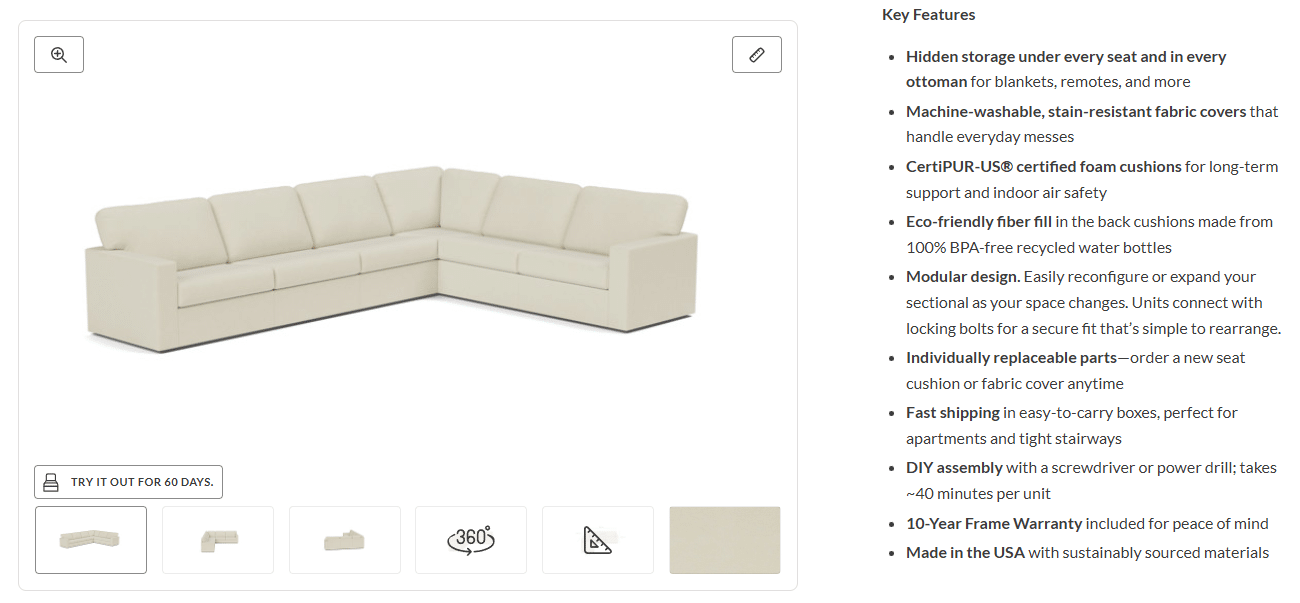
    Are the product’s unique benefits clearly described?
    ```json
{
  "alt": "Beige L-shaped sectional sofa with hidden storage, modular design, and eco-friendly materials.",
  "caption": "Discover comfort and versatility with this beige L-shaped sectional sofa, featuring hidden storage and eco-friendly materials, perfect for any modern living space.",
  "description": "This image shows a beige L-shaped sectional sofa with clean lines and contemporary style. It features hidden storage under every seat, machine-washable and stain-resistant covers, and CertiPUR-US certified foam cushions. The modular design allows for easy reconfiguration. This eco-friendly piece uses materials such as BPA-free recycled water bottles for cushion filling and offers fast shipping and easy DIY assembly. Perfect for urban apartments and it comes with a 10-year frame warranty."
}
```

    Highlighting what makes my products special gives AI a reason to recommend them over competitors. It’s crucial for AI to grasp these unique features to decide on recommendations.

    Action item: I emphasize key features that set my products apart, avoiding vague claims like “high-quality craftsmanship” and instead focusing on specific differentiators.

    3. Use cases and target audience
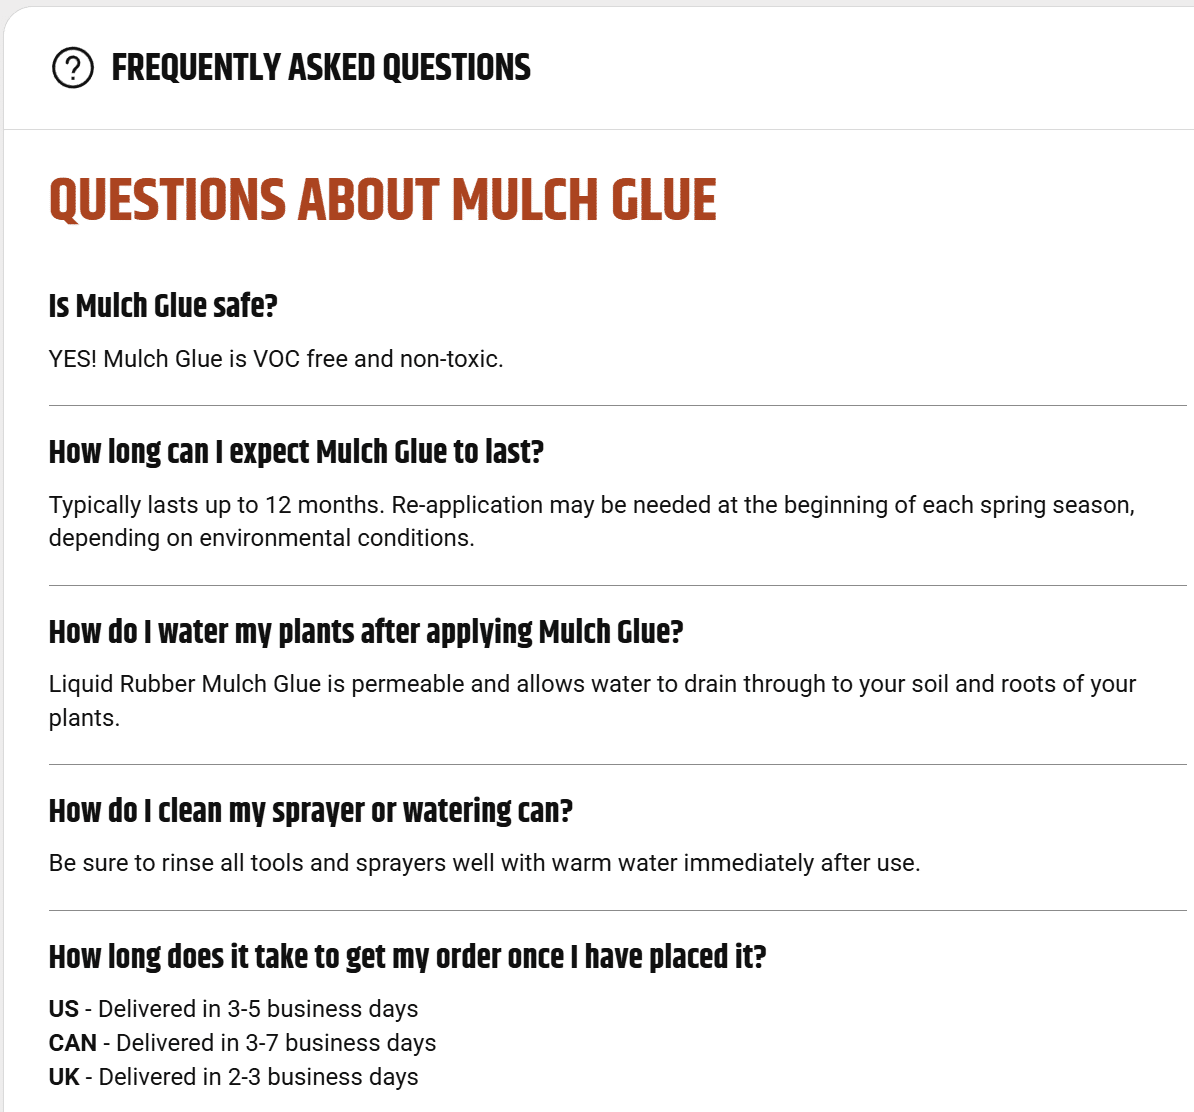
    FAQ section about mulch glue, covering safety, longevity, application, and delivery details.
    Discover everything you need to know about Mulch Glue, from safety and longevity to watering tips and delivery times.

    Are the product’s intended use cases and audience clear?

    AI matches products with people and their needs, not just keywords. Explicitly stating who the product is for and how it’s used makes it more likely to be recommended by AI.

    Action item: I list the top use cases and audience segments for each product, considering situations, pain points, and goals.
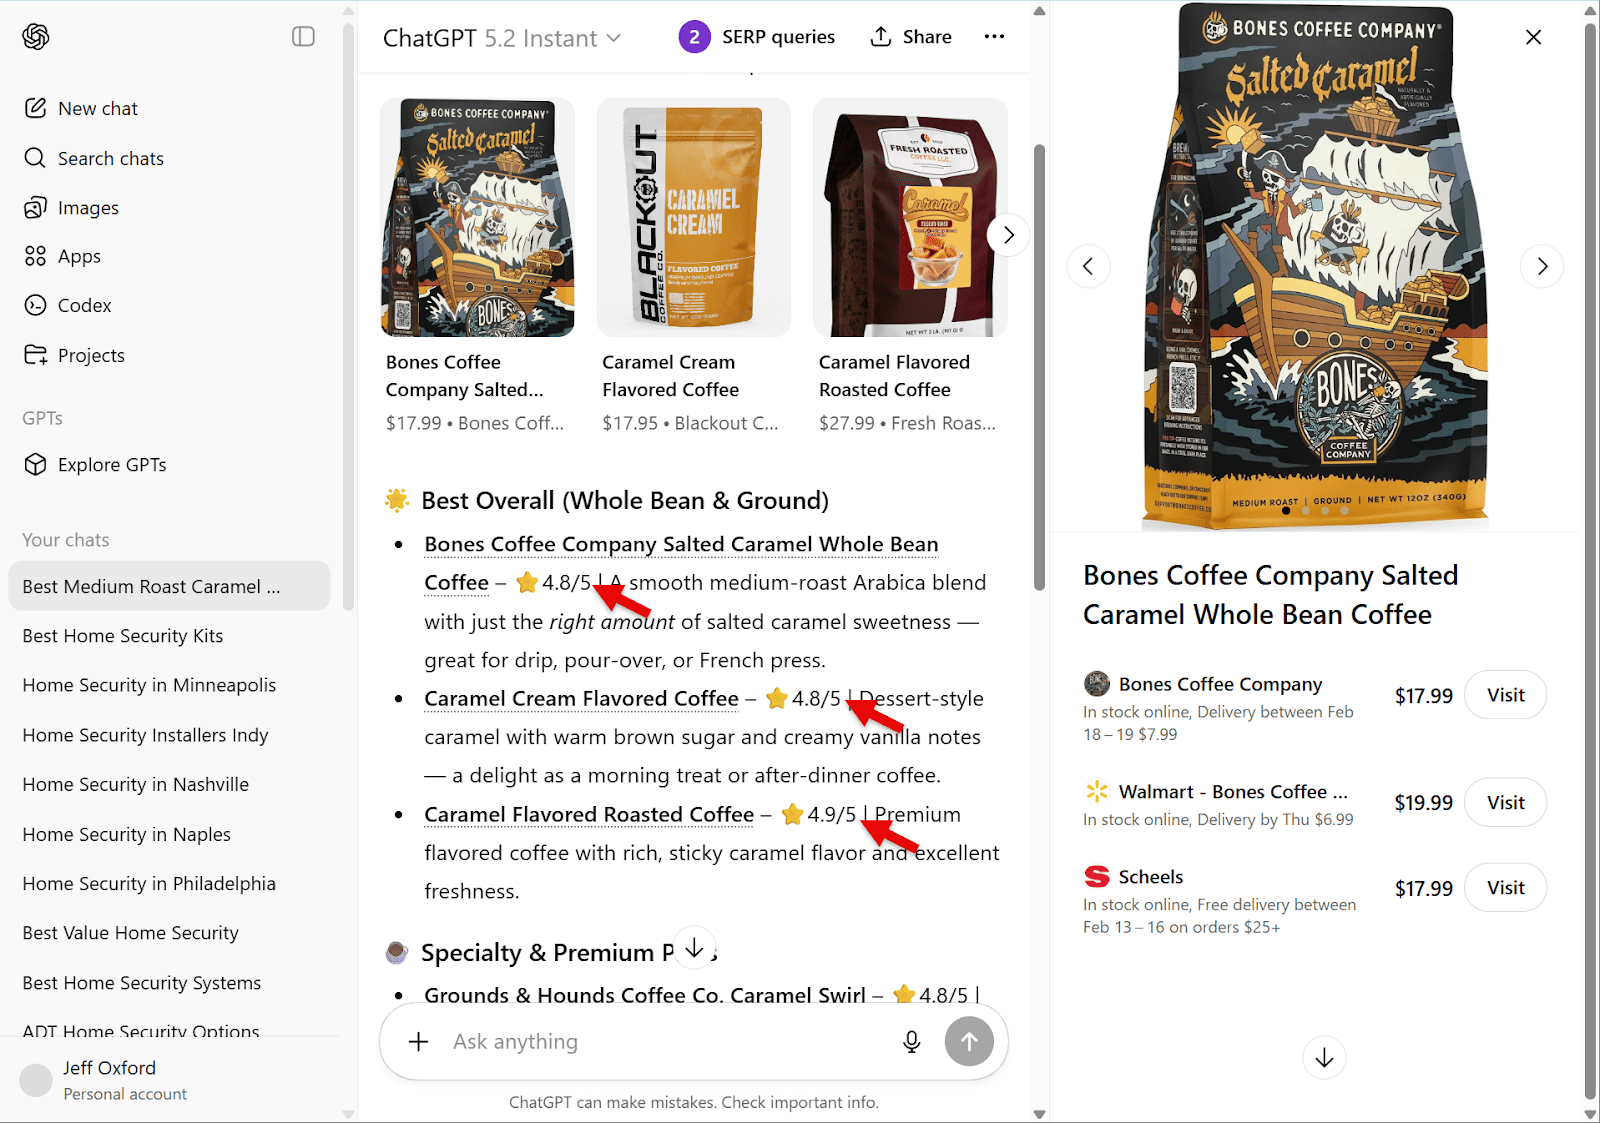
    ```json
{
  "alt": "Comparison of various caramel flavored coffees including Bones Coffee Company Salted Caramel with ratings and prices displayed.",
  "caption": "Discover the top-rated caramel flavored coffees with Bones Coffee Company's Salted Caramel leading the pack, offering a smooth blend perfect for any coffee lover.",
  "description": "The image showcases a comparison of caramel flavored coffees, highlighting Bones Coffee Company Salted Caramel Whole Bean Coffee as a top choice. This medium roast Arabica blend is noted for its perfect balance of salted caramel sweetness, earning a 4.8/5-star rating. Ideal for drip, pour-over, or French press brewing, it is competitively priced at $17.99 with delivery options. The image also shows offerings from other brands with varied flavors and ratings, providing a comprehensive look at customer favorites."
}
```

    4. FAQ section

    Does the product page include an FAQ section answering common questions about the product?

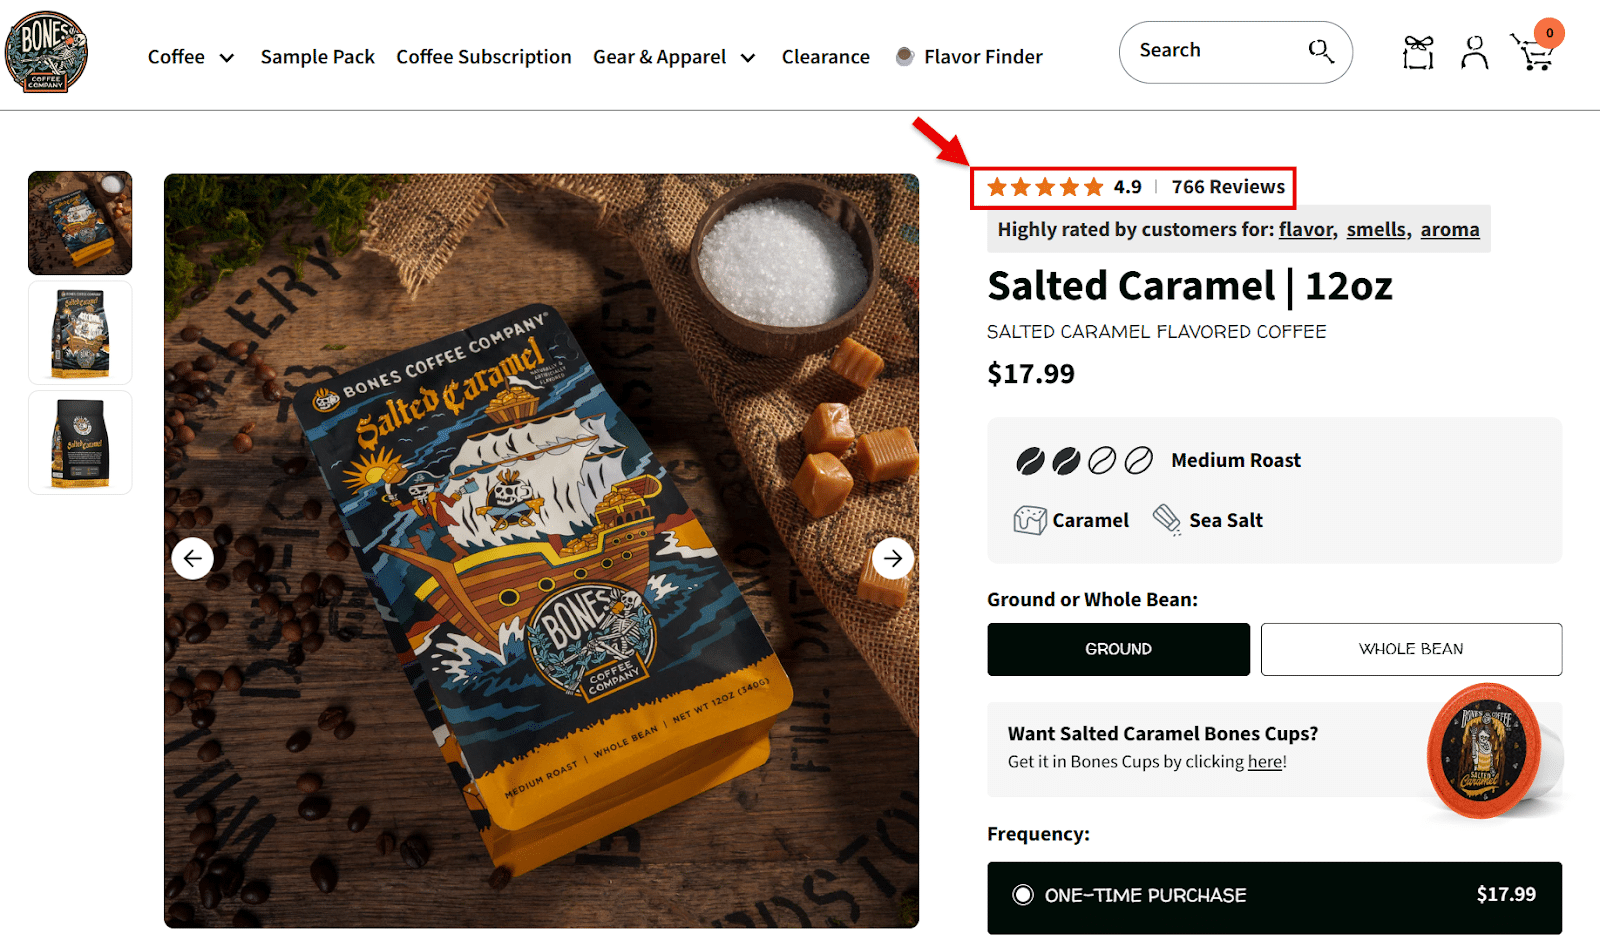
    FAQs can bolster AI’s confidence in recommending my products by showing they’re a good fit for specific queries. The more detailed the FAQ section, the more it helps in AI search contexts.
    ```json
{
  "alt": "Bones Coffee Company Salted Caramel 12oz bag on a rustic surface with caramel cubes and sea salt.",
  "caption": "Delight in the flavors of Bones Coffee Company's Salted Caramel blend. This 12oz medium roast promises a rich taste, adored by coffee lovers everywhere.",
  "description": "This image showcases a 12oz bag of Bones Coffee Company's Salted Caramel flavored coffee, featuring a distinctive pirate ship design. Surrounded by coffee beans, caramel cubes, and sea salt, this medium roast coffee is highly rated for its unique taste and aroma. Available for purchase at $17.99, this whole bean coffee is perfect for those seeking a sweet and salty coffee experience."
}
```

    Action item: I gather and answer the most common questions from customer inquiries, reviews, and even competitor analysis to include on product pages.

    5. Product reviews

    Does the product page display customer ratings and review counts?
    ```json
{
  "alt": "Screenshot of JSON-LD script for Bones Coffee Company's Salted Caramel coffee product details.",
  "caption": "Delve into the rich details of Bones Coffee Company's Salted Caramel coffee, from product specs to price offerings, in this JSON-LD snippet.",
  "description": "This image showcases a JSON-LD script detailing the product information for Bones Coffee Company's Salted Caramel coffee. It includes the product name, image URL, description, SKU, price offers, availability, and aggregate rating with a high score of 4.9 out of 5. Key attributes like the brand and pricing in USD are also highlighted, providing a comprehensive digital representation of the coffee product for online listings and SEO optimization."
}
```

    AI recommends products with proven reputations. Displaying a high rating and substantial number of reviews increases the chances of my products being recommended by AI.

    Action item: I ensure high visibility for product ratings and review counts on every product page, possibly using third-party platforms to solicit reviews.

    6. Product structured data
    ```json
{
  "alt": "Comparison of whey protein and weighted blankets on a webpage.",
  "caption": "Discover the top recommendations for whey protein powders and weighted blankets on this informative webpage comparison.",
  "description": "The image displays a webpage comparison between top whey protein powders and the best overall weighted blankets. On the left, Google Search results highlight the '100% Whey Protein Optimum Nutrition Gold Standard,' marked with an arrow for emphasis, priced at $26.97, and rated 4.7 stars. On the right side, ChatGPT presents alternatives for the best weighted blankets, including Gravity and Casper, with prices and images shown. This comparison visually guides users to informed purchasing decisions based on product reviews and ratings."
}
```

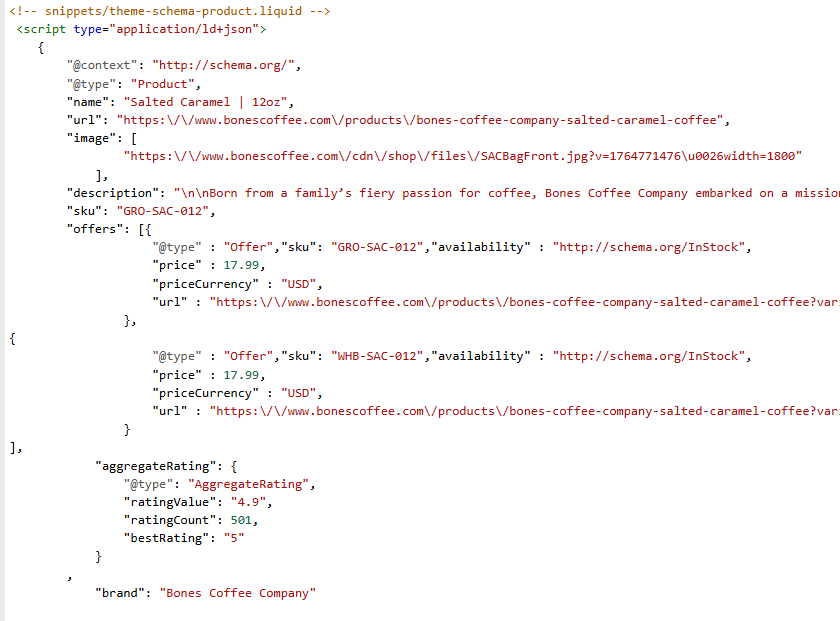
    Does the product page include structured data for price, availability, reviews, and other key attributes?

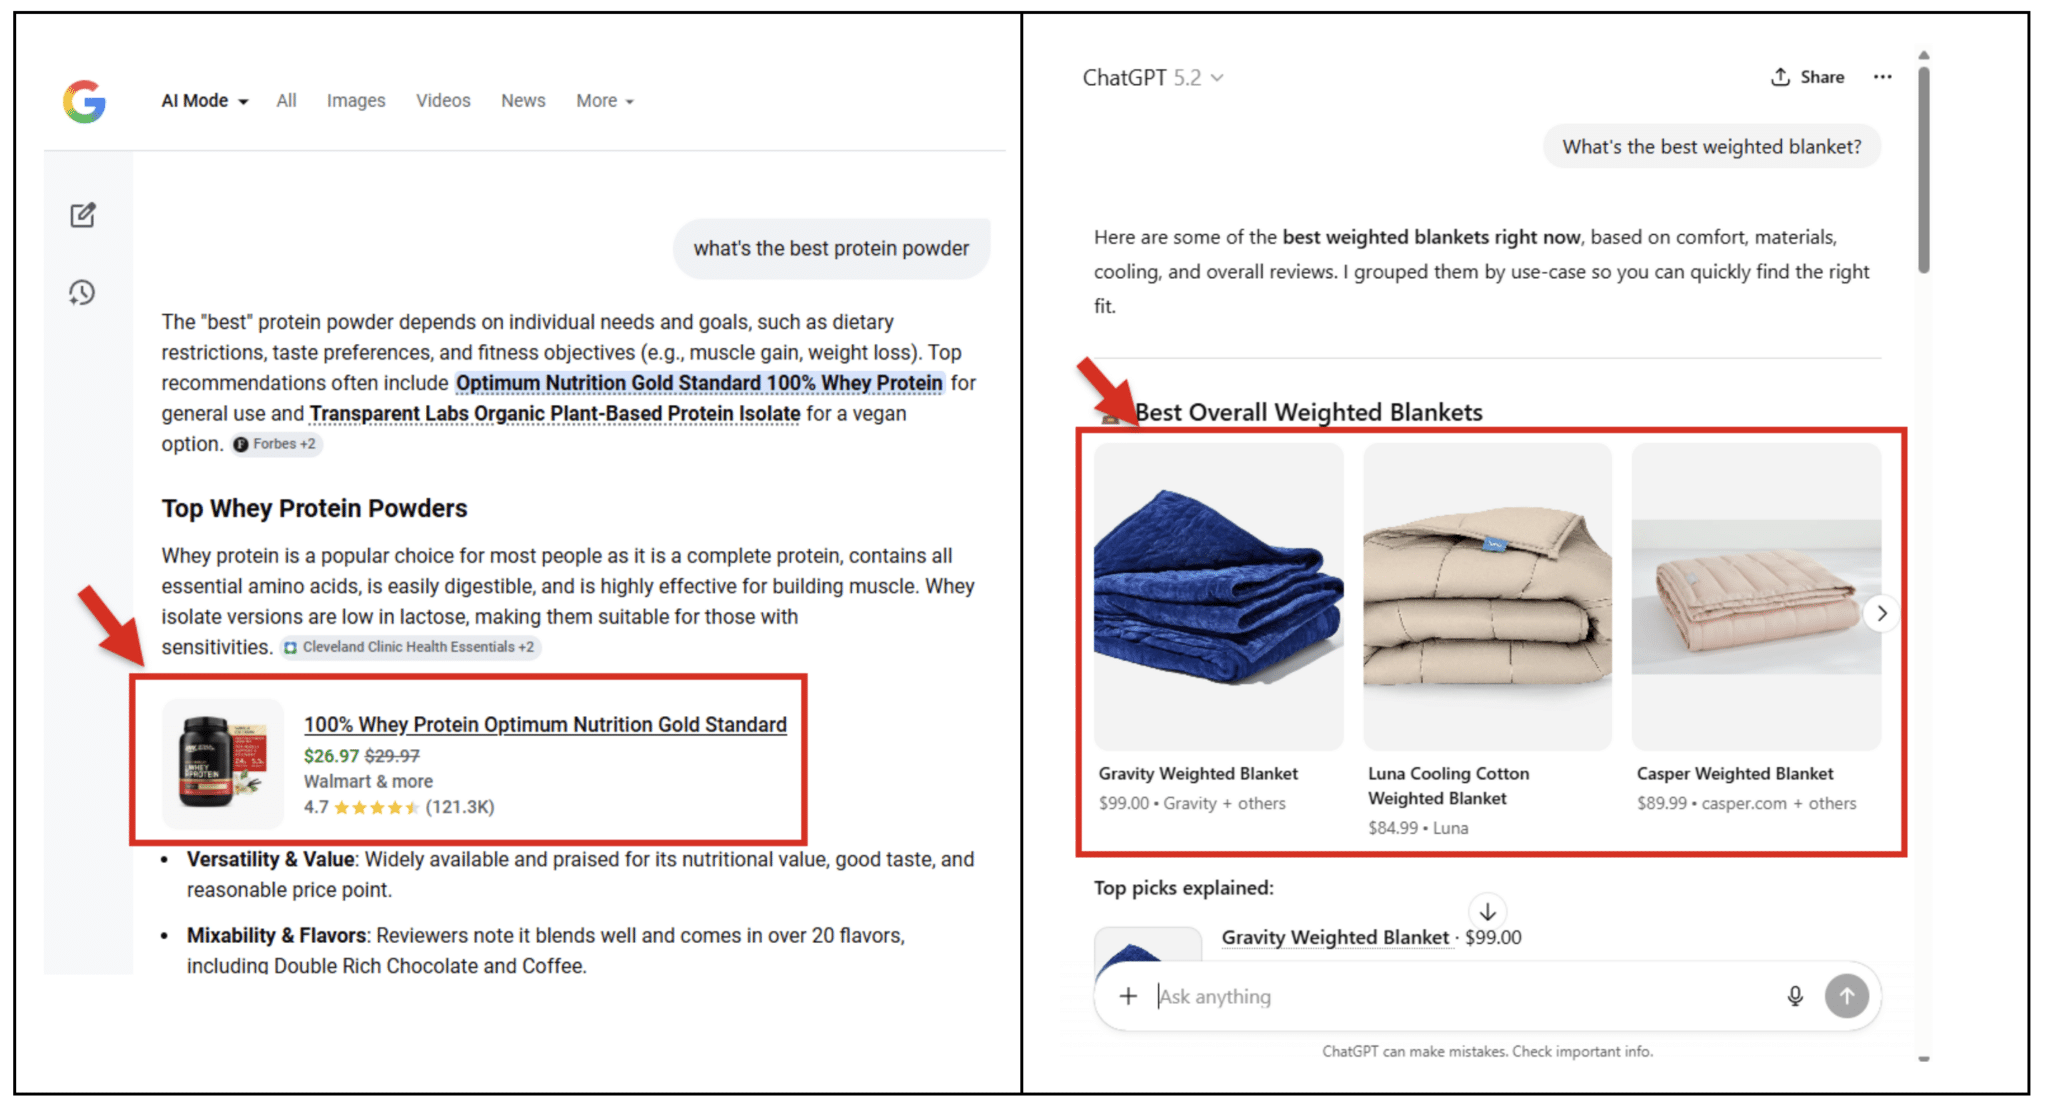
    Structured data helps AI understand my product information effortlessly and even feeds into knowledge graphs that power AI recommendations.

    I understand that as AI agents engage more deeply in commerce, detailed product data becomes crucial for comparisons and purchasing.
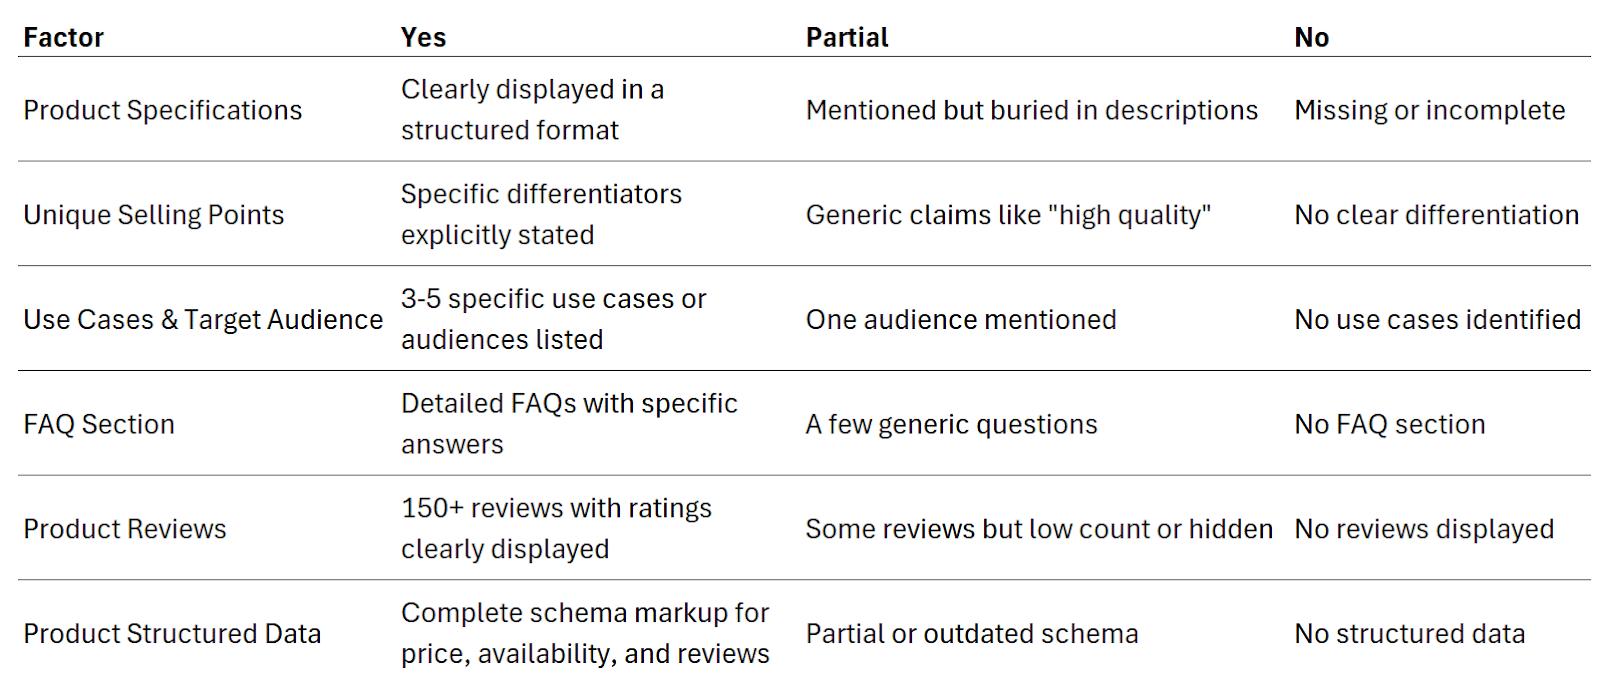
    ```json
{
  "alt": "Comparison table showing product factors rated as Yes, Partial, or No.",
  "caption": "A comprehensive comparison table evaluating product factors like specifications, unique selling points, and reviews with clear Yes, Partial, or No ratings.",
  "description": "This image displays a comparison table assessing various product-related factors. Each factor is categorized under columns labeled Yes, Partial, or No. Factors include Product Specifications, Unique Selling Points, Use Cases & Target Audience, FAQ Section, Product Reviews, and Product Structured Data. This layout provides a clear and structured overview, aiding in identifying strengths and weaknesses of product listings for better visibility and decision-making."
}
```

    Putting the scorecard to work

    Here’s my concise strategy to audit and enhance my product pages for AI optimization, focusing on closing gaps where AI might overlook my products.

    Prioritizing these optimizations means I’m not only engaging effectively but also increasing my competitiveness in the AI-driven market landscape.


    Inspired by this post on Search Engine Land.


    crushpress.ai community screenshot
  • Boost Local SEO: Fix Your Google Map Pin for Better Rankings

    Boost Local SEO: Fix Your Google Map Pin for Better Rankings

    Your local business rankings might be suffering, and surprisingly, it could all be due to your map pin. Google’s placement of your business on their map significantly impacts your visibility, and addressing hidden addresses and setup issues is crucial.

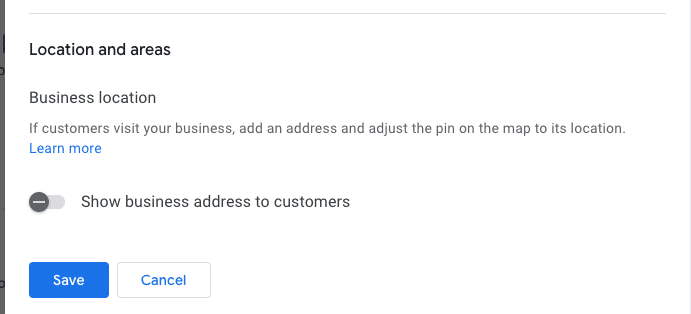
    I’ve often found myself engrossed in the ongoing debate within the local SEO community about the ‘hide address’ toggle for service area businesses (SABs). Many business owners consider this option a mere privacy setting, but it’s much more—a decision that affects how Google’s algorithm perceives your physical relevance.

    ```json
{
  "alt": "Settings interface for business location visibility with toggle option and save button.",
  "caption": "Easily manage the visibility of your business address with a simple toggle switch. Options to save or cancel changes make location management straightforward.",
  "description": "The image displays a digital settings interface focused on business location visibility. It features a toggle switch labeled 'Show business address to customers,' which is turned off. Below the toggle are 'Save' and 'Cancel' buttons for submitting changes. This screenshot is relevant for understanding business location management settings in online profiles or platforms. Keywords: business location, settings interface, visibility toggle, save button."
}
```

    Here are some questions to consider:

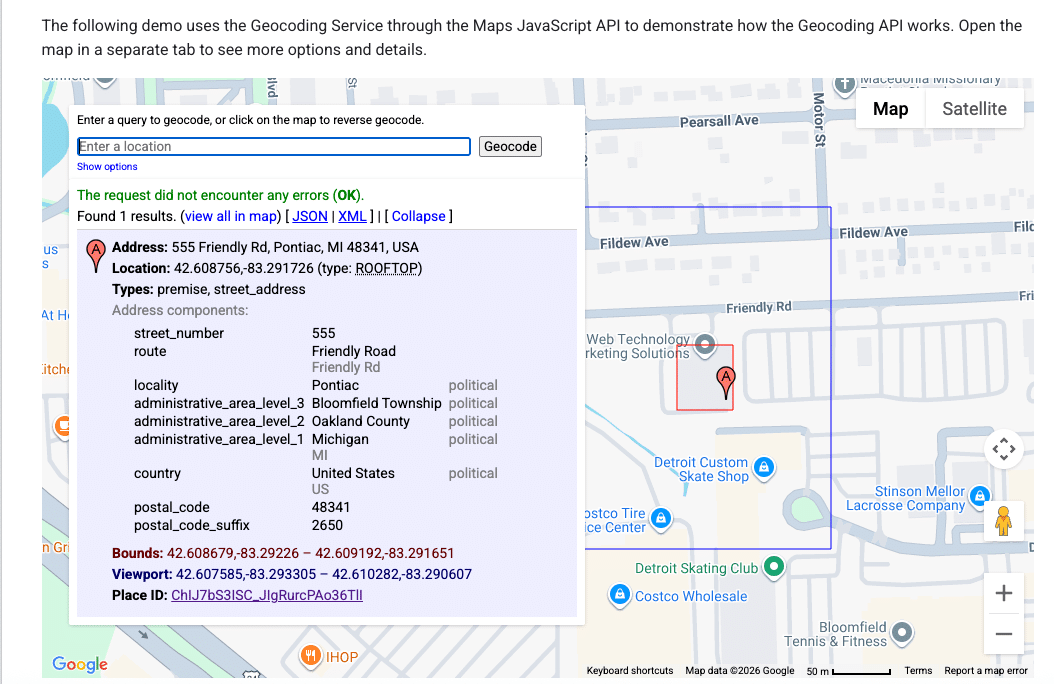
    ```json
{
  "alt": "Geocoding service demo using Maps JavaScript API with address details and location on map.",
  "caption": "Explore the Maps JavaScript API with this geocoding demo, showcasing address details for 555 Friendly Rd, Pontiac, MI.",
  "description": "This image displays a geocoding service demo using the Maps JavaScript API. It highlights the detailed address of 555 Friendly Rd, Pontiac, MI 48341, USA. The interface shows the address components, coordinates (42.608756, -83.291726), and a map section indicating the location. The demo explains how to use geocoding for retrieving precise address information and viewing it on a map with options for different data formats like JSON and XML."
}
```
    • Does your defined service area affect your ranking?
    • Does hiding your street address impact your visibility in the local pack?
    • Is Google erasing that data, or does your map pin become an invisible anchor?
    ```json
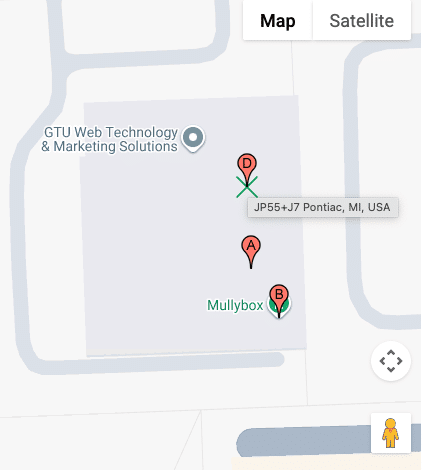
{
  "alt": "Map showing GTU Web Technology & Marketing Solutions and Mullybox with pinpoints in Pontiac, MI.",
  "caption": "Discover the location of GTU Web Technology & Marketing Solutions and Mullybox in Pontiac, MI, with this detailed map view.",
  "description": "This image displays a map highlighting GTU Web Technology & Marketing Solutions and Mullybox in Pontiac, MI. The map features pinpoints indicating specific locations labeled A, B, and D. The area is shown in a standard map view with street outlines and an overlay for easy navigation. This visual guide can help users find exact locations and understand the surrounding layout in Pontiac. Keywords: map, GTU Web Technology & Marketing Solutions, Mullybox, Pontiac, MI, location."
}
```

    These are foundational questions in understanding how proximity works when you choose to ‘hide’ on the map.

    ```json
{
  "alt": "Guide on parsing response components with types like ROOFTOP and APPROXIMATE.",
  "caption": "Understanding Geocode Location Types: Dive into the specifics of parsing response components from postal code localities to precise geocodes.",
  "description": "This image provides detailed guidance on parsing response components in geolocation data. It highlights how to interpret arrays like postcode_localities, and explains geometry details that include location types such as ROOFTOP, RANGE_INTERPOLATED, GEOMETRIC_CENTER, and APPROXIMATE. This is crucial for understanding accuracy and the precision of geocoding results, aiding in effective data handling and utilization."
}
```

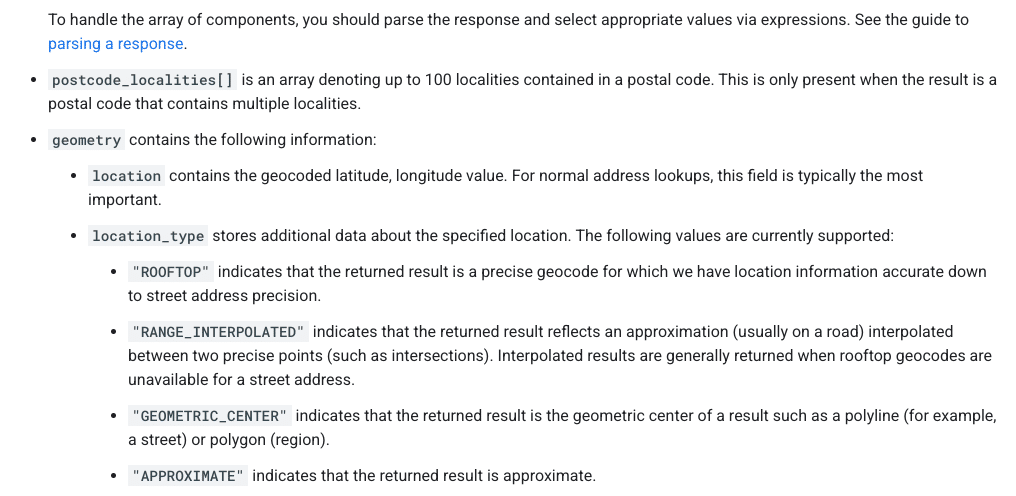
    How Google Determines Your Map Pin

    ```json
{
  "alt": "Forum post discussing Google Maps giving wrong directions after business address change.",
  "caption": "Frustration mounts as a business struggles with incorrect Google Maps directions following an address change, causing customers to get lost.",
  "description": "The image shows a forum post about issues with Google Maps providing incorrect directions to a business after its address change. Despite updating Google Business Profile, the directions lead 20 minutes off. Attached is a Google Maps screenshot indicating both old and new locations. The post has had 166 views and 1 reply, highlighting the frequent errors with directions and the efforts taken to rectify the situation."
}
```

    It’s essential to know that your address and map pin are not the same. Entering an address into your Google Business Profile doesn’t just place a pin; it’s processed through Google’s geocoding engine, comparing it against their database.

    ```json
{
  "alt": "Heat map visualization of water damage restoration needs in an urban area, showing numbered zones with color coding.",
  "caption": "Explore this dynamic heat map illustrating water damage restoration priorities across a city with distinct color-coded zones.",
  "description": "This image represents a heat map of water damage restoration needs in an urban area on March 6, 2026, at 1:42 PM EST. The map features a darkened city street layout with numbered circular zones indicating priority levels. Green circles with the number '2' indicate low priority areas, while orange circles marked with '9' highlight higher urgency zones. This visualization aids in strategic planning for restoration services."
}
```

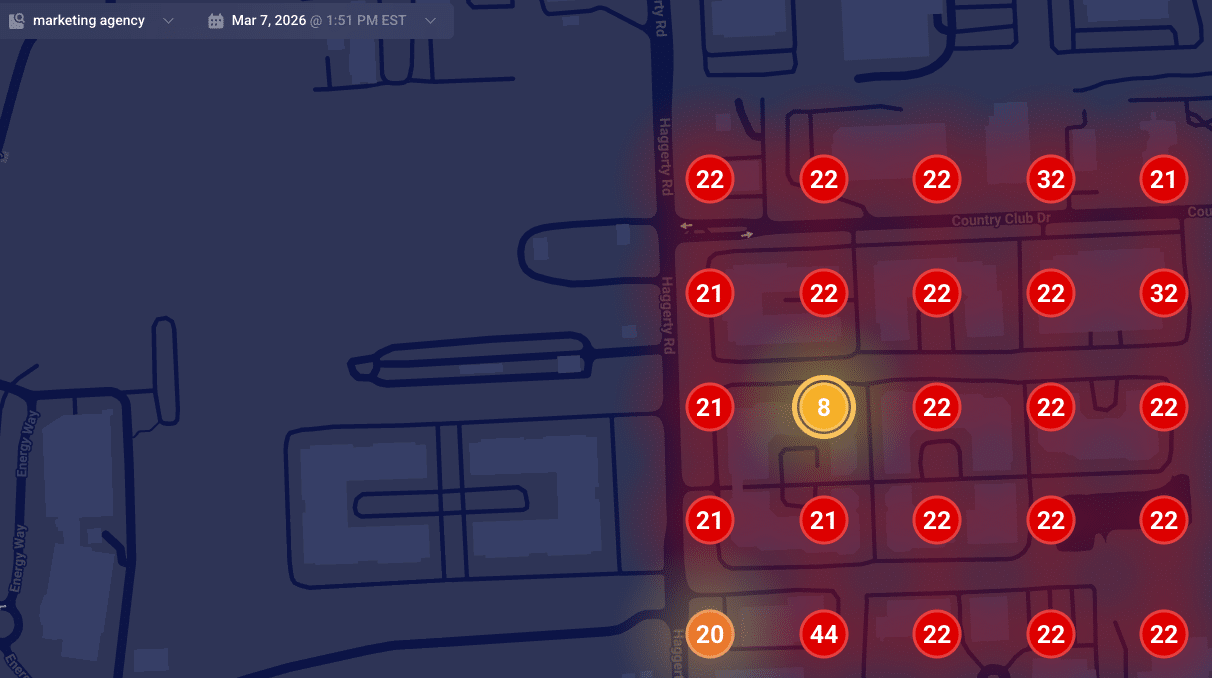
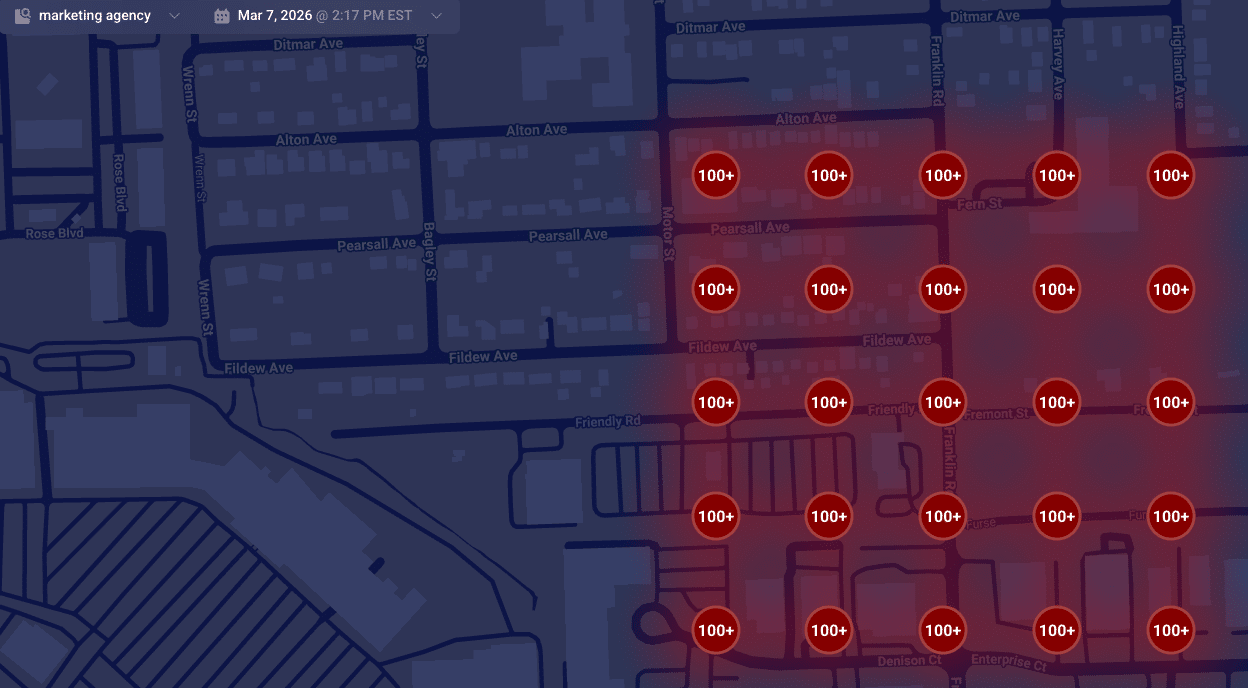
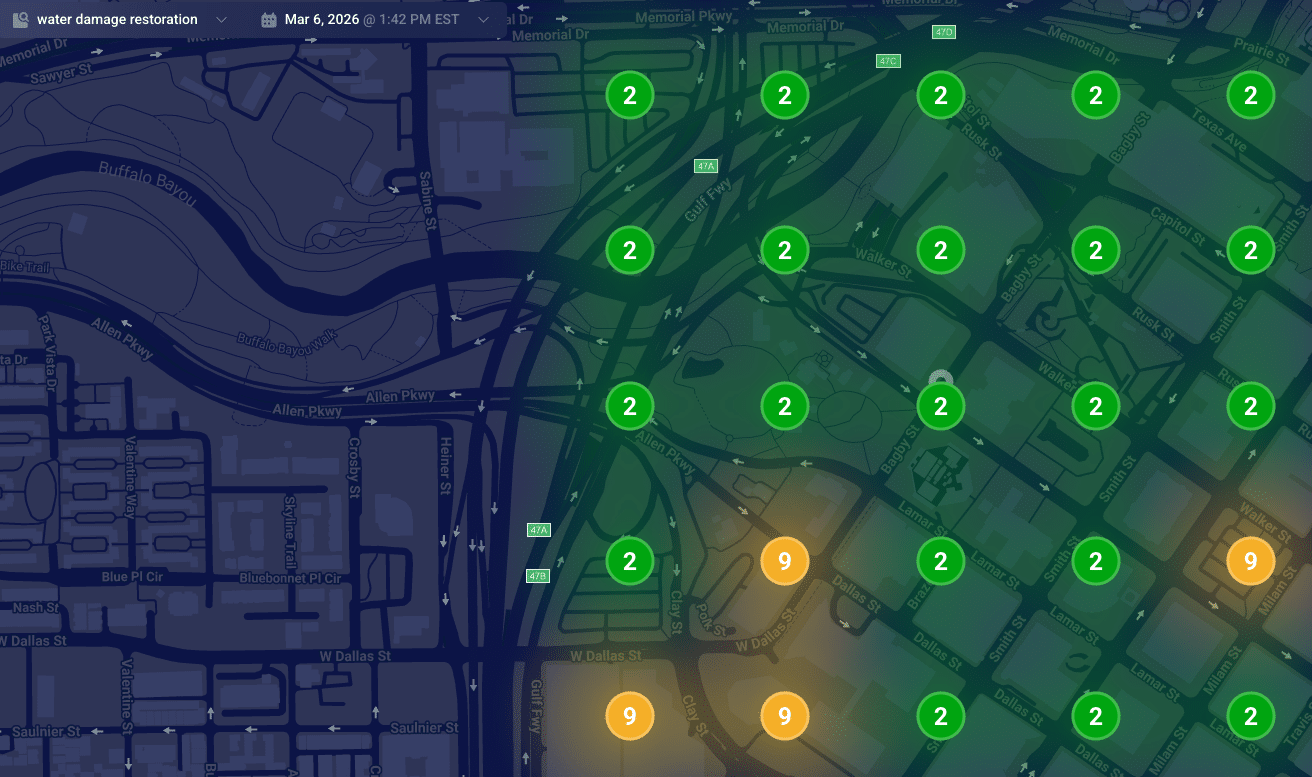
    Understanding Google’s data models is key to understanding why your pin might be misplaced:

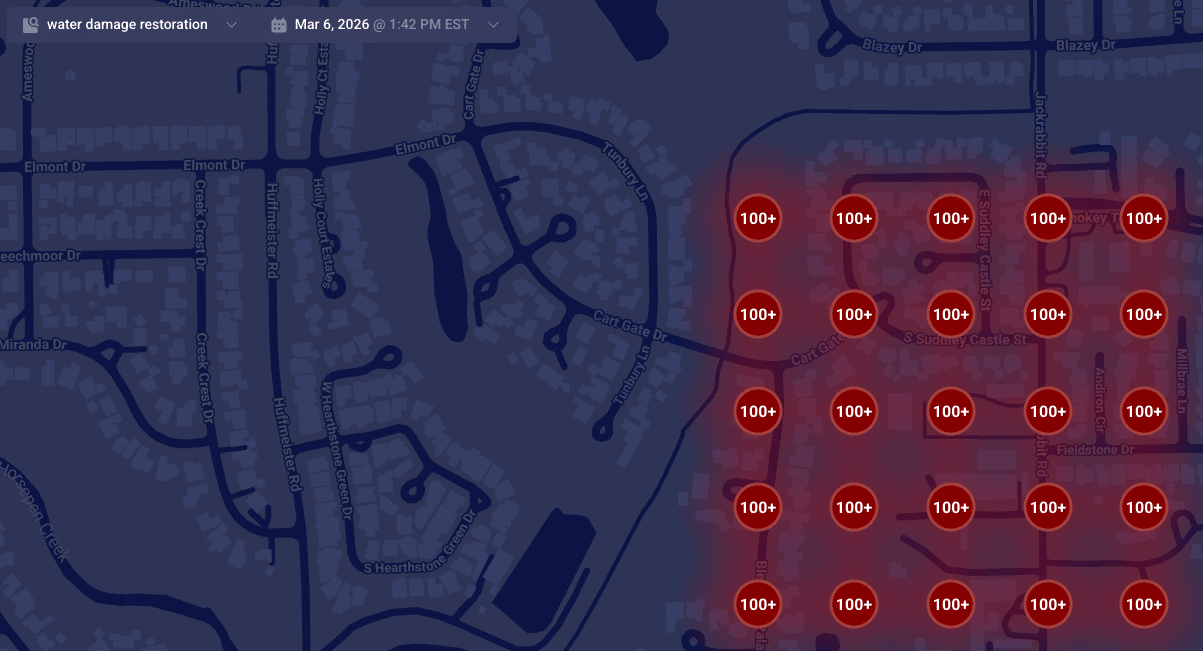
    ```json
{
  "alt": "Map highlighting areas with over 100 instances of water damage restoration services.",
  "caption": "A map visualization displaying clusters of water damage restoration needs, with over 100 cases highlighted in red.",
  "description": "This map illustrates a dense concentration of water damage restoration demands in a residential area. Red circles marked with '100+' indicate regions with over 100 service instances. The map is set against a dark background, featuring roads and street names for context. This visualization aids in identifying service hotspots, essential for targeting restoration efforts efficiently."
}
```
    ```json
{
  "alt": "Heatmap showing numerical data points on a dark map layout.",
  "caption": "A vibrant heatmap reveals numerical trends across a dark-themed map, spotlighting key data points for insightful analysis.",
  "description": "This image showcases a heatmap overlaid on a map, displaying various data points marked with numbers. The numbers, like 8, 22, and 44, are highlighted within colored circles ranging from yellow to red, indicating varying data intensities. Designed for data visualization, it suggests a real-time analysis function, useful for trend analysis or strategic planning. The heatmap context is set against a dark map background, enhancing the visibility of the highlighted data points."
}
```

    When Google finds a reliable match, they place your pin accurately at your building’s rooftop. Understanding how these data models work can help explain why SABs sometimes rank differently in local searches.

    ```json
{
  "alt": "Map displaying high-density markers with '100+' in a red shaded area across various streets.",
  "caption": "This heat map reveals a high concentration area, with red-marked zones indicating significant density across streets like Pearsall Ave and Fildew Ave.",
  "description": "The map illustrates a geographic area with a high concentration of points marked '100+', shaded in red to indicate density. Streets such as Pearsall Ave, Fildew Ave, and Motor St are visible, providing a visual representation of congestion or population density. The interface is dated March 7, 2026, at 2:17 PM EST, possibly generated by a marketing agency tool, useful for spatial analysis or resource planning."
}
```

    Is Your Map Pin Placement Accidental?

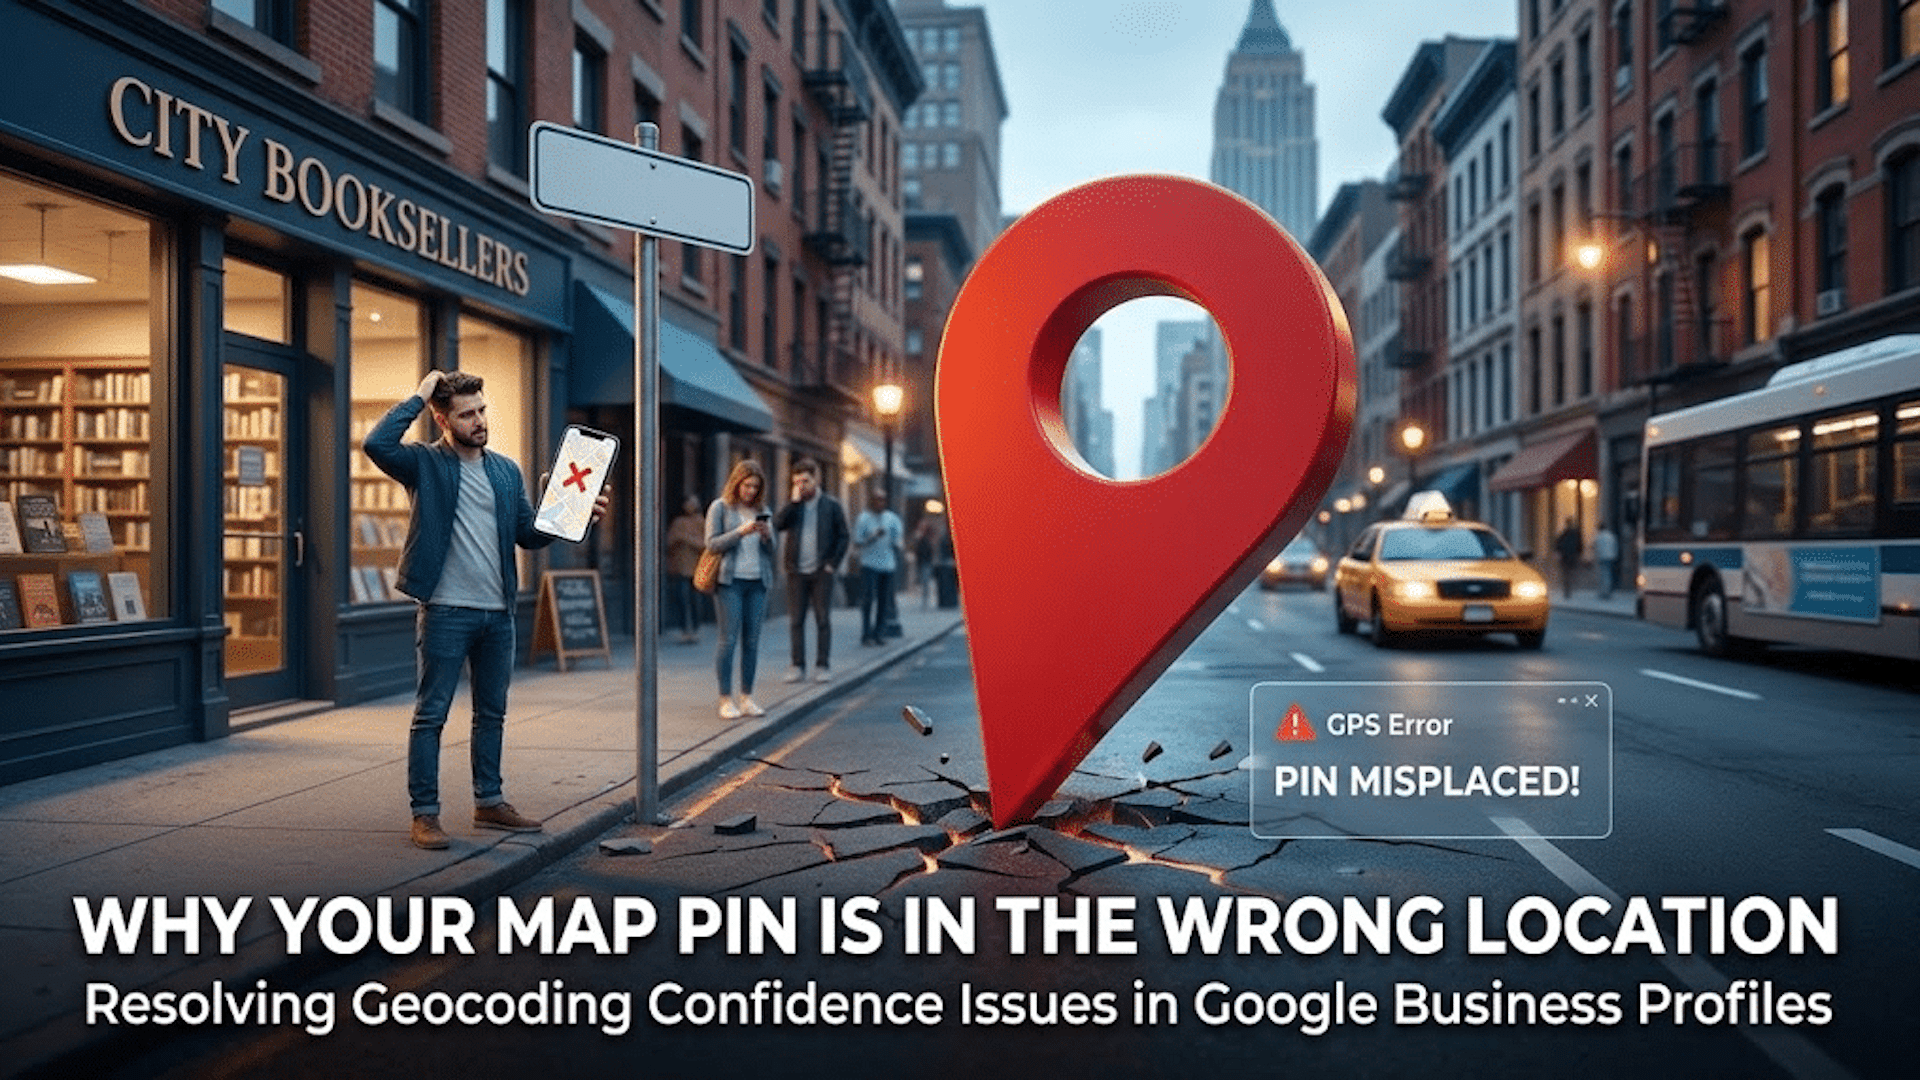
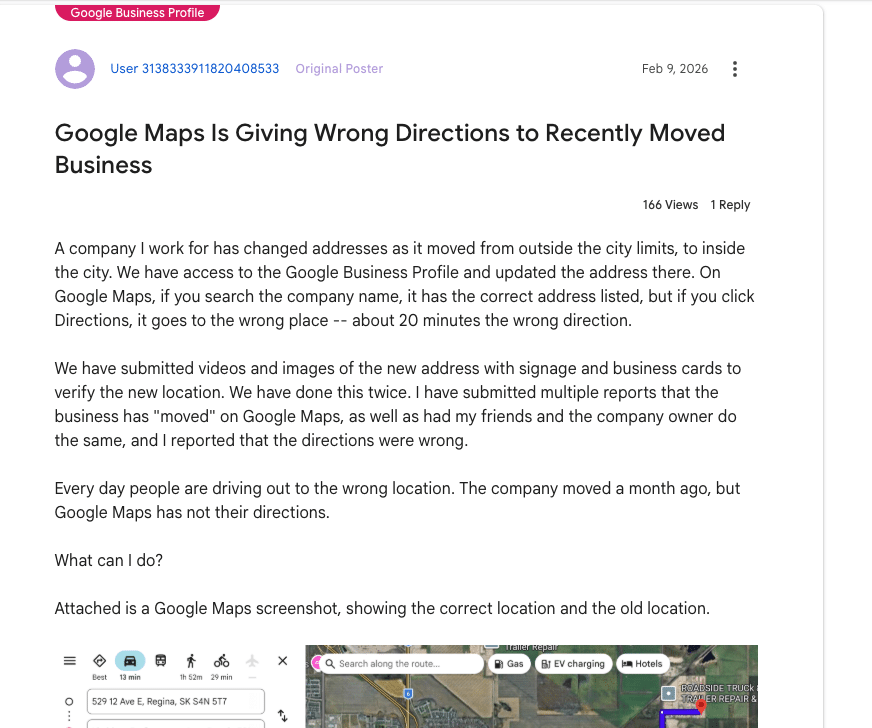
    Don’t be mistaken, it’s not a bug but a failure in converting text to precise map coordinates. When this fails, your business may end up with a map pin that’s misplaced, affecting your local ranking authority.

    When unable to secure a high-confidence match from your building, Google defaults to using the city’s center as your pin’s fallback location, often causing your business to rank from a less relevant area.

    Suite Number Issues

    I’ve warned clients countless times about the pitfalls of including suite numbers in Address line 1. These numbers aren’t street-level data; embedding them can lead to geocoding conflicts, making your map pin default to a broader location like a city center.

    Properly Anchoring Your Map Pin

    For accurate map pin placement, ensure your address in Google’s system is geocoding-friendly. Keep unnecessary details out of the first address line and verify how Google reads your address using their developer tools.

    When addressing geocoding problems, prepare for possible re-verification requests. Stay consistent in your corrections until Google verifies your business’s precise location.


    Inspired by this post on Search Engine Land.

    crushpress.ai community screenshot
  • Unlock Unique Insights: Harness First-Party Data for Content Success

    Unlock Unique Insights: Harness First-Party Data for Content Success

    Have you ever wondered how to set your content apart in a competitive landscape? As a content marketer, I often face the challenge of using the same tools and data sources as everyone else, like Semrush, making it hard to create truly unique content.

    We are all casting our nets in the same pond, using identical resources to gather content ideas. The result? Overly similar content across the board. But there’s a smarter way.

    I realized that the wealth of data about my audience and customers is a goldmine, just waiting to be mined. These insights are invisible to my competitors, as they remain untouched and underutilized within my marketing team.

    I discovered how third-party tools often lead to an echo chamber of commoditized content. While essential, these tools don’t always align with what my specific audience is truly looking for, leading to a flood of generic content.

    Recognizing this challenge encouraged me to tap into my own data, creating content that appeals directly to people already interested in my services.

    First-party data is the information I need. It includes internal insights that only I have access to, such as site search queries, sales call transcripts, CRM data, support tickets, and email interactions.

    Let’s dive deeper into why this approach is effective. First-party data is proprietary. No matter how advanced a competitor’s tools might be, they can’t access my internal data, and this gives me a unique edge.

    This data reflects real buyer language, which helps me avoid assumptions based on my internal knowledge bias. I can tailor my content to match the language my audience uses.

    ```json
{
  "alt": "The CapmatchOne logo with a gradient circle and bold text.",
  "caption": "Discover innovation with the CapmatchOne logo, featuring sleek typography and a modern gradient circle.",
  "description": "The CapmatchOne logo features bold, modern typography coupled with a gradient circle, symbolizing connection and innovation. The sleek design conveys a sense of progress and creativity. This image can be used for branding or promotional purposes, appealing to audiences interested in innovative solutions and forward-thinking designs."
}
```

    By mapping this data to my entire marketing funnel, I fill gaps at every stage, driving not just traffic, but conversions and loyalty.

    How do I turn these insights into content ideas? I start with internal site searches. Examining how visitors use my site can reveal content gaps and opportunities for new offerings.

    Next, I analyze sales call transcripts and CRM data to uncover recurring themes and objections, crafting content that addresses potential buyers’ concerns directly.

    My support tickets provide another source of inspiration. By identifying common customer complaints, I create resources that help both my customers and support team.

    Lastly, I pay close attention to email replies and engagement metrics. Tracking which types of communication yield the greatest response helps me understand content preferences.

    Embracing first-party data helps my brand stand out. While competitors can mimic my content style, they can’t replicate these unique insights. Every week, I make it a point to explore a new data set and extract fresh content ideas.


    Inspired by this post on Search Engine Land.

    crushpress.ai community screenshot
  • Unlock the Power of GSC’s Branded Query Filter for SEO Success

    Unlock the Power of GSC’s Branded Query Filter for SEO Success

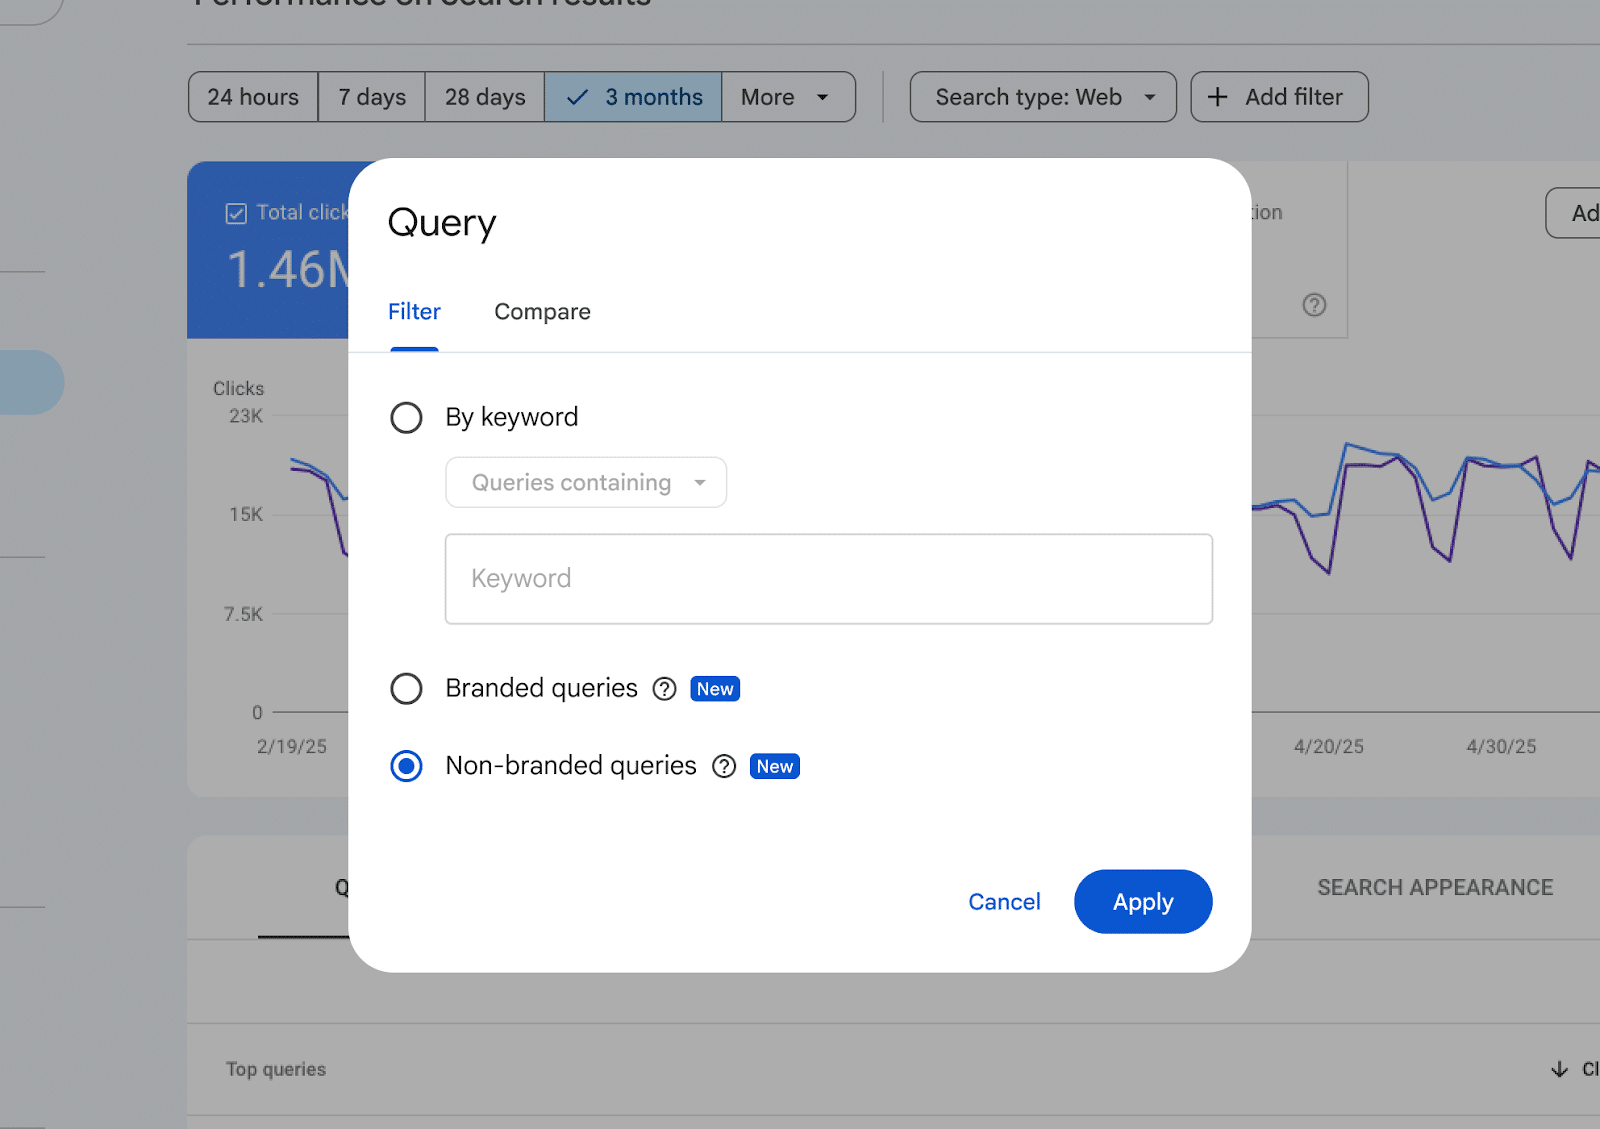
    I recently delved into Google Search Console’s branded query filter, which has become a game-changer for SEO reporting. This feature now allows me to track brand awareness, diagnose performance drops, and truly measure the impact of my SEO efforts.

    In November 2025, Google introduced a solution to a long-standing SEO challenge: the ability to distinguish branded from non-branded search performance directly within Google Search Console (GSC). The rollout is now complete for eligible properties, and I was ecstatic to try it out.

    For so long, I’ve had to rely on regex filters, custom dashboards, or third-party tools, which weren’t always reliable. But GSC’s branded query filter simplifies the process, positioning it as a native feature in a platform widely used for organic reporting.

    ```json
{
  "alt": "Search query filter options in a web analytics tool showing filters by keyword and query type.",
  "caption": "Explore search query trends with detailed filters: select by keyword or focus on branded versus non-branded queries for insightful analysis.",
  "description": "The image displays a query filter interface in a web analytics tool, featuring options to filter by keyword and prioritize either branded or non-branded queries. The interface is overlaid on a chart displaying click data over time, illustrating performance metrics for search results. Keywords: web analytics, search queries, data filtering."
}
```

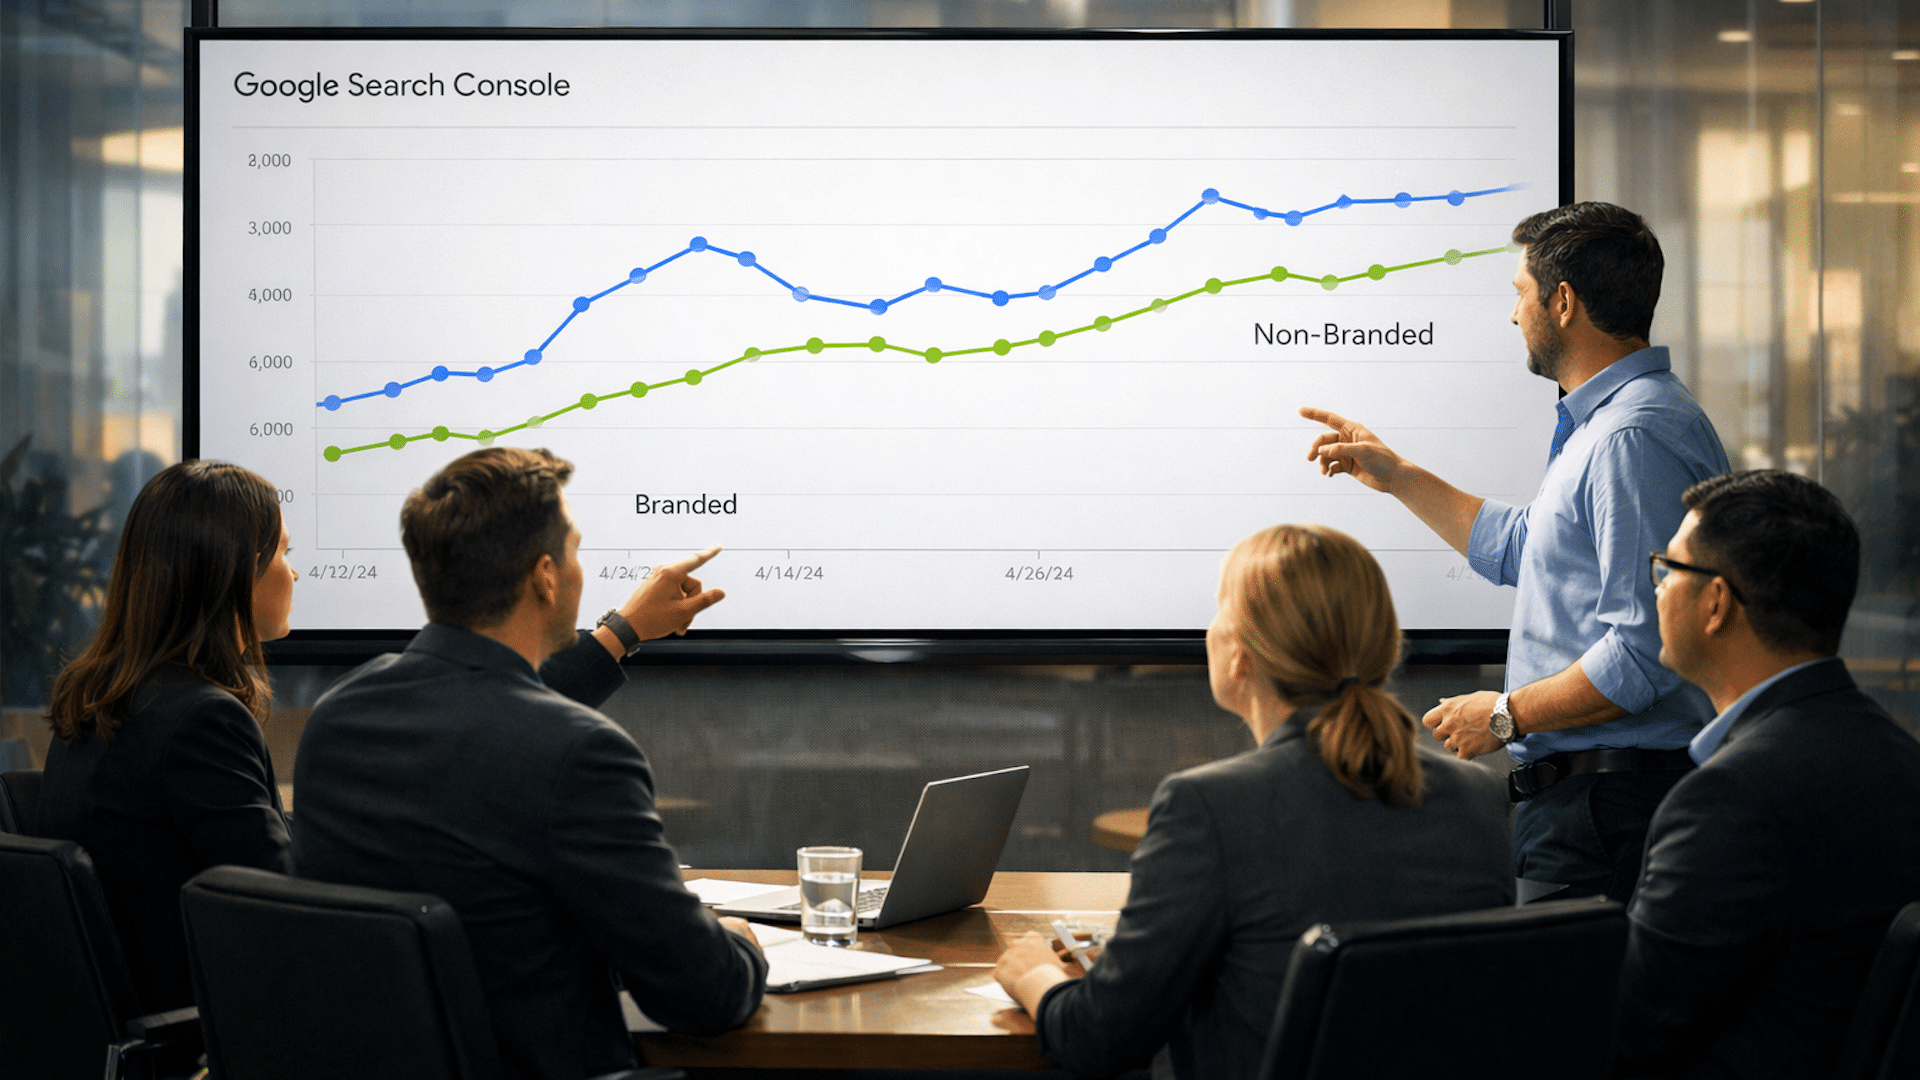
    This change makes it easier for me to close a crucial gap in SEO reporting. Now, I can independently evaluate brand demand and discovery, leading to improved performance analysis supported by first-party data.

    In essence, GSC’s new filter performs its function by sorting queries into two categories:

    ```json
{
  "alt": "The CapmatchOne logo with a gradient circle and bold text.",
  "caption": "Discover innovation with the CapmatchOne logo, featuring sleek typography and a modern gradient circle.",
  "description": "The CapmatchOne logo features bold, modern typography coupled with a gradient circle, symbolizing connection and innovation. The sleek design conveys a sense of progress and creativity. This image can be used for branding or promotional purposes, appealing to audiences interested in innovative solutions and forward-thinking designs."
}
```
    • Branded queries that include recognized brand terms.
    • Non-branded queries covering all other discovery queries.

    This filter is accessible directly via:

    ```json
{
  "alt": "Line graph and analytics showing changes in clicks, impressions, CTR, and position over time.",
  "caption": "Diving into the data: This graph reveals key changes in clicks, impressions, CTR, and average position over the last three months compared to last year.",
  "description": "The image displays a line graph depicting trends in total clicks, impressions, CTR, and average position. The graph compares the last three months to the same period last year, highlighting a 31.74% decrease in clicks and a 32.72% decline in CTR. Impressions show a slight increase of 1.42%. Keywords: analytics, data visualization, SEO metrics."
}
```
    • Performance > Search results > + Add filter > Query.
    • Query groups.
    • API-accessible data exports.

    These features empower me to group queries by topic or intent, filter by branded and non-branded types, and create detailed reports without external processing.

    ```json
{
  "alt": "Graph showing interest over time with fluctuating blue line and descending green trend line from 2024 to 2026 in the US.",
  "caption": "Dive into the trend: This graph illustrates the ups and downs of interest from 2024 to 2026, showing a notable decline overall despite several peaks.",
  "description": "This image depicts a line graph representing interest over time from October 2024 to January 2026 in the United States. A blue line captures the fluctuating interest levels, with notable peaks in early and late 2025. Meanwhile, a green arrowed line indicates an overall downward trend. The graph provides an insightful visual representation of interest dynamics during this period, reflecting both temporary spikes and a general decline."
}
```

    Historically, separating branded from non-branded performance wasn’t new but maintaining consistency was challenging. I used to manually segment with regex, keyword tagging in rank-tracking tools, or through custom dashboards.

    These methods worked but were fragile. Common issues included character limits on regex, language variants for international sites, and no shared standard for branded terms. With GSC’s update, I find these challenges largely eliminated.

    ```json
{
  "alt": "Line graph comparing branded and non-branded CTR over time, showing notable variance from October 2025 to January 2026.",
  "caption": "Exploring the dynamics of branded versus non-branded CTR, this graph reveals intriguing trends from late 2025 into 2026.",
  "description": "This line graph illustrates the comparison between branded and non-branded click-through rates (CTR) over a period from October 2025 to early January 2026. The vertical axis represents the percentage of CTR, ranging from 0% to 25%, while the horizontal axis shows the timeline. The graph demonstrates fluctuating rates, with branded CTR peaking notably around early 2026, while non-branded CTR remains relatively steady and low throughout the period. This visualization provides insights into the effectiveness of brand recognition on digital engagement metrics. Keywords: Branded CTR, Non-Branded CTR, Click-Through Rate, Digital Marketing Analytics."
}
```

    Branded traffic is crucial, being both a signal of brand awareness and a major source of conversions. However, when mixed with non-branded data, it skews the interpretation of SEO performance.

    By segmenting this data, I can now accurately identify brand demand versus discovery, allowing clearer insights. This helps me to better understand what’s genuinely boosting performance and address key questions like:

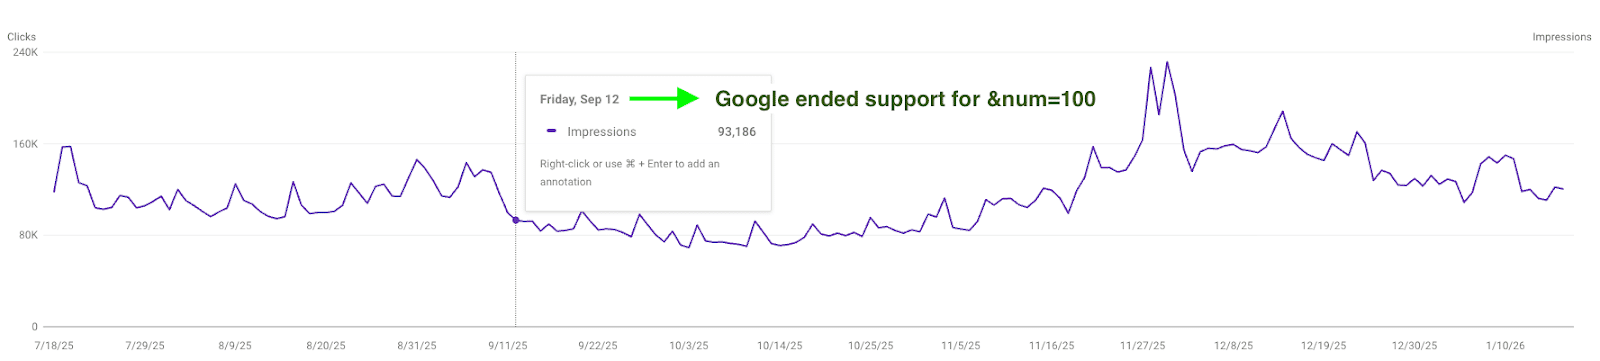
    ```json
{
  "alt": "Line graph showing impressions over six months with a note about Google ending support for &num=100 on September 12.",
  "caption": "A dynamic graph illustrating search impressions over time, noting Google's change in support, influencing trends.",
  "description": "This image features a line graph depicting the number of impressions over a six-month period. It includes an annotation on September 12, highlighting Google's end of support for &num=100. The graph shows a fluctuating trend with notable spikes, marked by a vertical guide at the annotation point. Useful for observing impact on search performance metrics."
}
```
    • Are we enhancing brand demand or expanding non-branded reach?
    • Is our content strategy bolstering non-branded visibility?
    • Is the current strategy effective as anticipated?

    Having used the filter, branded search trends have become one of the clearest indicators of brand health. Monitoring these trends reveals gaps and provides opportunities across various channels.

    This functionality isn’t just a feature; it signifies a paradigm shift in SEO measurement. The consistency it brings to branded versus non-branded reporting is transforming how SEO work gets done, making reporting more consistent and actionable.

    As I continue to evaluate and use these insights, I find that adopting this feature means less time spent reconciling data and more focus on interpreting results. This results in more confident and consistent communication, ultimately driving greater impact.


    Inspired by this post on Search Engine Land.

    crushpress.ai community screenshot
  • Enhance Forum Visibility: Google’s New Structured Data Update

    Enhance Forum Visibility: Google’s New Structured Data Update

    I recently discovered that Google has enhanced its structured data support for forum and Q&A pages. This update introduces new properties that allow us to better signal reply threads, quoted content, and identify whether content is generated by AI or humans.

    With these changes, which aim to boost Google’s accuracy in interpreting discussions and Q&A content, we can now ensure our content is represented more precisely.

    What’s New. Google has updated its QAPage documentation to include commentCount and digitalSourceType. Moreover, the DiscussionForumPosting documentation now supports sharedContent alongside these new properties.

    The Details. Using Q&A markup, I’m able to apply commentCount to questions, answers, and comments, showcasing the total number of comments even if they are not fully marked up. This total should align with answerCount + commentCount, representing all types of replies.

    How It Works. The digitalSourceType property allows me to indicate whether content is produced by a model or simple automation. I can use TrainedAlgorithmicMediaDigitalSource for advanced outputs and AlgorithmicMediaDigitalSource for basic bots. If this property is left out, Google assumes the content is human-generated.

    What’s New for Forums. The sharedContent property helps me to mark the primary item that’s being shared in a post. Google supports various content types like WebPage, ImageObject, and more, including quotes or reposts.

    Why This Matters. This update provides me with greater control over how Google interprets community content, which is particularly important for sites rich in forums, support communities, UGC platforms, and Q&A sections. Google can now distinguish between answers and comments more effectively, tally partial threads across multiple pages, and recognize when a post primarily shares specific media types.

    Documentation. The official documentation was updated on March 24, providing all the details I need to apply these new capabilities.


    Inspired by this post on Search Engine Land.

    crushpress.ai community screenshot
  • Inside Google AI: Why It’s Citing Itself More Than Ever

    Inside Google AI: Why It’s Citing Itself More Than Ever

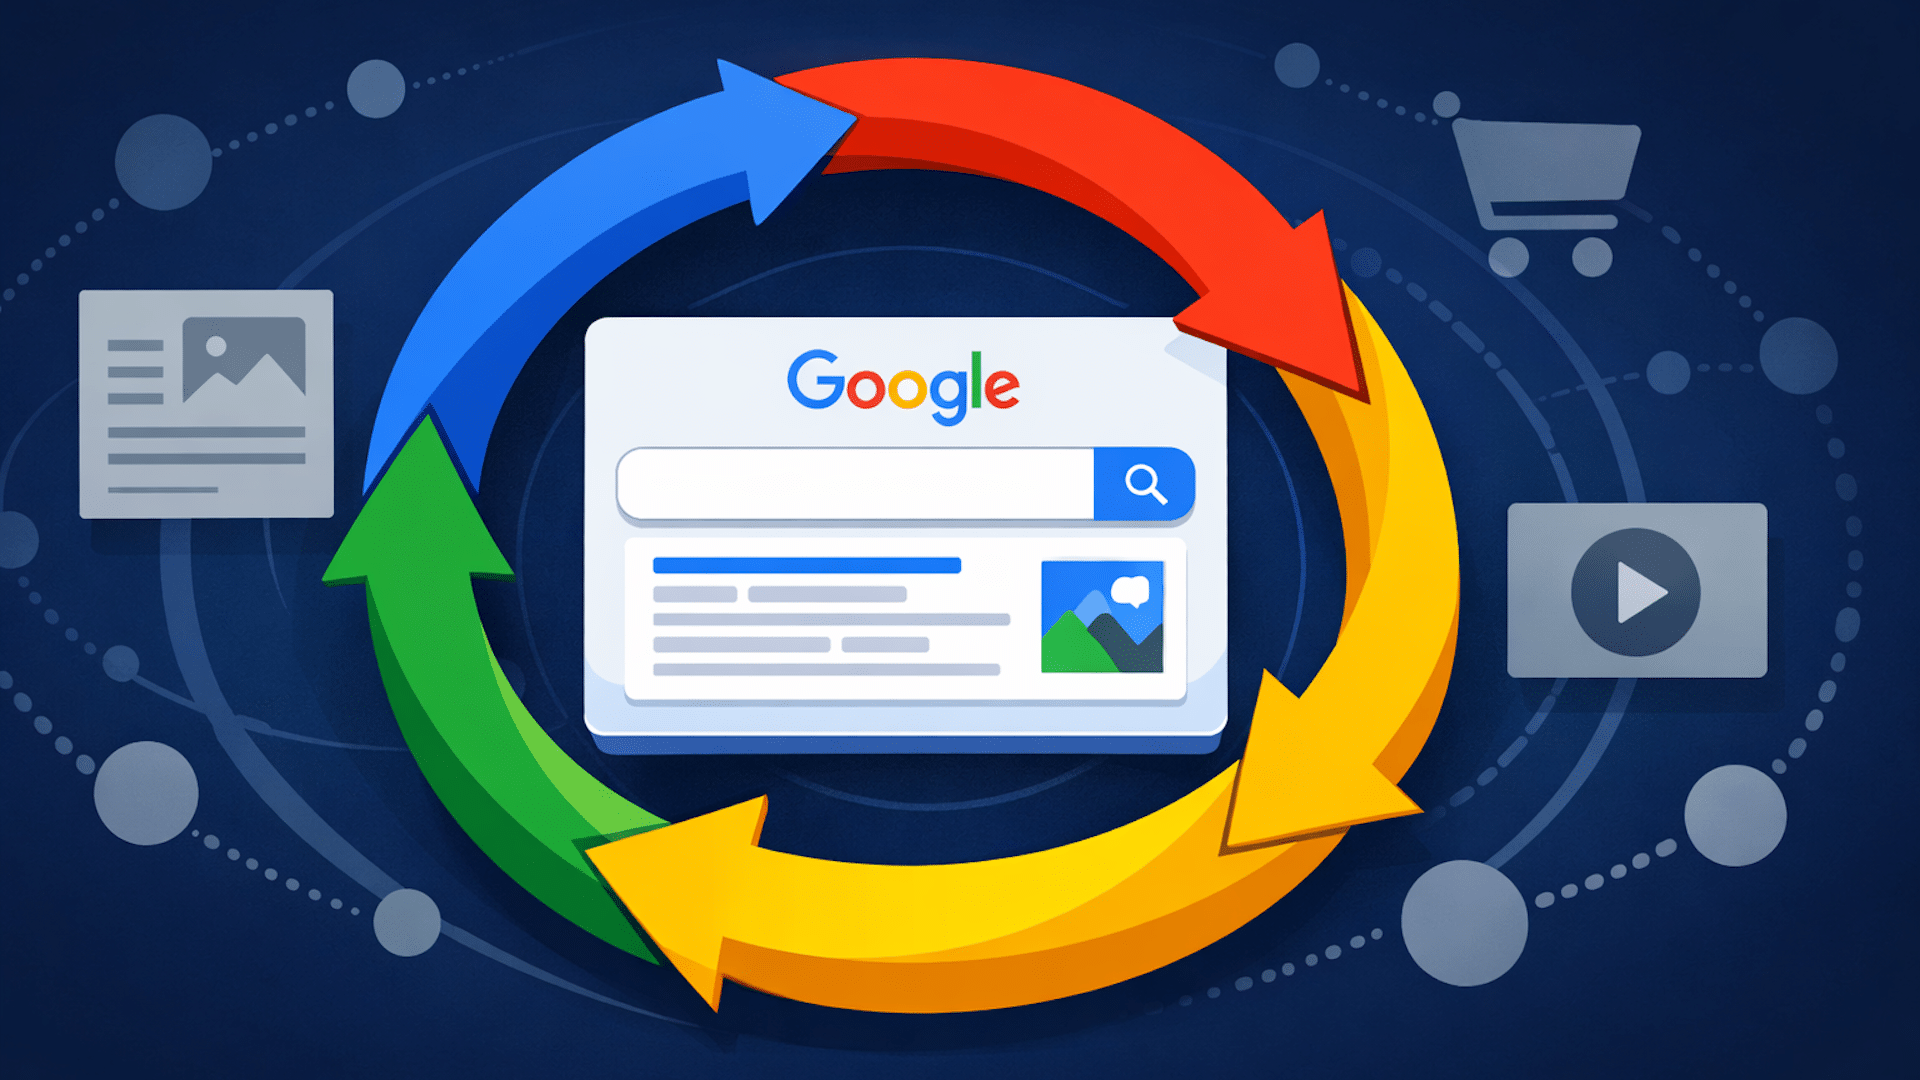
    It’s fascinating to see the evolution of Google’s AI Mode and how it increasingly cites Google itself. In fact, almost one out of every five sources in its AI-generated answers now originates from Google, often guiding users back to more Google searches.

    Why does this matter to us? As someone deeply involved in the world of digital content and SEO, I’m aware that AI search should highlight the best online sources. If Google prioritizes its own content, there’s a risk that we might encounter fewer direct links and see a reduction in traffic as users remain within Google’s ecosystem.

    So let’s delve into the details. Research by SE Ranking reveals that Google.com is the most cited source within AI Mode responses, making up 17.42% of all references. This makes Google more mentioned than even the combined total of the next six well-known platforms: YouTube, Facebook, Reddit, Amazon, Indeed, and Zillow.

    In an accelerated trend, back in June 2025, Google referenced itself in only 5.7% of AI-generated answers, but now that figure has tripled.

    Almost one out of five AI citations is from Google. When considering YouTube, Google-owned properties account for about 20% of all sources.

    This self-referencing is quite pronounced, with AI Overviews linking heavily to Google properties such as Maps, Images, and YouTube. AI Mode expands on this by further embedding users within the Google environment, often through presenting additional search results rather than directing them to external sites.

    This strategy keeps users engaged with Google platforms where monetized content such as ads and reviews can be found.

    What’s changed? Previous research showed that Google was mostly citing Google Business Profiles. However, this trend has shifted:

    • Travel: 53.18% of citations
    • Entertainment & hobbies: 48.74% of citations
    • Real estate: 30.54% of citations

    Interestingly, the one area where Google is not the top source is Careers and Jobs, where Indeed appears more than three times as often as Google.

    The data supporting these findings were gathered by SE Ranking, who analyzed 68,313 keywords across 20 industries, reviewing over 1.3 million AI Mode citations to determine how frequently Google.com was referenced.

    If you’re interested, I recommend checking out the full report titled “Is Google stealing your clicks in AI Mode? (1.3M+ citations analyzed)” for an in-depth exploration.


    Inspired by this post on Search Engine Land.

    crushpress.ai community screenshot
    • 59% of citations now direct to conventional Google search results.
    • 36.1% still reference Google Business Profiles.
    • A smaller portion links to Google Support (1.7%), Google Flights (0.1%), and other Google services.
    • Often, these AI citations are accompanied by a mini search results panel beside the answer, effectively creating a new search opportunity.

    Industry differences are also evident. Google dominates citations across several topics, but some sectors show a stronger dependency on Google:

    • Travel: 53.18% of citations
    • Entertainment & hobbies: 48.74% of citations
    • Real estate: 30.54% of citations

    Interestingly, the one area where Google is not the top source is Careers and Jobs, where Indeed appears more than three times as often as Google.

    The data supporting these findings were gathered by SE Ranking, who analyzed 68,313 keywords across 20 industries, reviewing over 1.3 million AI Mode citations to determine how frequently Google.com was referenced.

    If you’re interested, I recommend checking out the full report titled “Is Google stealing your clicks in AI Mode? (1.3M+ citations analyzed)” for an in-depth exploration.


    Inspired by this post on Search Engine Land.

    crushpress.ai community screenshot
  • Unlock Video Ad Success: Vital Metrics and Strategies

    Unlock Video Ad Success: Vital Metrics and Strategies

    As someone passionate about video advertising, I’ve noticed how easily videos can now be distributed across platforms like YouTube, paid social media, and connected TV. It’s an immense opportunity for exposure.

    However, I often find myself questioning the real effectiveness of these videos. Campaigns sometimes show impressive metrics, but lack in tangible business impact due to strategic missteps.

    The issue isn’t so much about targeting or budget; it’s about focusing more on outputs—views, impressions—rather than crucial outcomes like attention and persuasion. That’s where most video strategies falter.

    Misunderstanding Attention: A Common Pitfall in Video Ads

    Many video ads operate under the assumption that they’re just like TV commercials, but that’s a misunderstanding of how attention works today.

    In past meetings, we’ve defined success by views and impressions, not realizing these metrics don’t always translate to engagement or conversion.

    True success lies in transforming impressions into meaningful actions, and that requires a drastic shift in strategy.

    Dig deeper: Explore the latest in YouTube Ads

    The First Five Seconds: Capturing Attention Fast

    I’ve learned that the opening seconds of a video ad are critical. Initially, I assumed upfront branding mattered most, but ads that opened with engagement hooks performed better.

    View-through rates don’t equate to persuasion. Real impact happens before the viewer can skip the ad.

    An effective hook makes all the difference, whether it’s striking visuals or compelling questions. That initial grab of attention sets the stage for success.

    Scrappy Ads Often Outperform Polished Productions

    It’s surprising how often simple videos outperform higher quality productions. Authenticity resonates more with audiences than polished, overtly professional content.

    Audiences and algorithms favor content that feels genuine over what looks like an ad. It’s about fitting in with the platform’s native content style.

    Dig deeper: Improve Meta Ads with Vertical Video Formats

    Ad Length: A Creative Choice, Not a Limitation

    Through experience, I’ve realized that the optimal length for an ad depends on the message itself. Sometimes a longer duration with a well-crafted story outperforms shorter clips.

    A well-paced narrative keeps viewers engaged, making them more receptive to the brand’s message, regardless of duration.

    Understanding Metrics: Decoding Signals, Not Outcomes

    The abundance of data can be misleading, with metrics often misinterpreted as outcomes. I’ve seen campaigns with high completion rates fail to drive any business impact.

    The true measure of success is how video metrics correlate with real-world actions and conversions.

    Aligning Briefs with Creative Outcomes

    A common issue is poorly defined briefs leading to lackluster creative. Clear objectives and a deep understanding of the target audience guide more effective video strategies.

    Knowing precisely who you’re speaking to and what action you desire them to take results in more intentional and impactful creative.

    Creative and Distribution: An Inseparable Duo

    Strategically planning how and where ads are distributed is just as crucial as content creation. I’ve witnessed great ideas fall flat due to mismatched platform contexts.

    Designing ads tailored for specific platforms ensures they resonate and are effective in their intended environment.

    Insight-Driven Testing: Beyond Mere Variance Generation

    Effective testing focuses on key elements that engage audiences. Hypothesis-driven testing yields insights far more valuable than superficial variant testing.

    Ultimately, I’m looking for tools that prove reliable in predicting real-world outcomes, enhancing creative confidence well before any campaign goes live.

    @media (max-width: 768px) { .headline-responsive { font-size: 30px !important; line-height: 1.3 !important; } }

    Optimizing for People: The Ultimate Strategy

    Despite evolving platforms and algorithms, I’m convinced that the core elements of attention, curiosity, and trust remain constantly human.

    The most successful video ads I’ve been part of focused on relevance, respecting viewers’ time, and delivering valuable content. That’s what truly captivates audiences.

    Success in video advertising comes from understanding people—not just appealing to platform metrics.


    Inspired by this post on Search Engine Land.

    crushpress.ai community screenshot
  • Revamp Your Vehicle Listings with Google’s ‘Build to Order’ Feature

    Revamp Your Vehicle Listings with Google’s ‘Build to Order’ Feature

    When I discovered Google’s latest update to the Merchant Center, I was thrilled. They’ve added a ‘build to order’ option for vehicle listings, offering sellers like me a streamlined way to display customizable models that customers can factory-order.

    I immediately saw how this attribute could revolutionize my listings. It’s designed for dealers who, like myself, don’t always have every model available on the lot. This addition allows us to tag vehicles that aren’t in stock but can be tailored and ordered. It’s a game-changer!

    What needs to change. I’m aware that updating my listings involves two critical steps. First, I need to adjust my structured data by setting availability to BuildToOrder. Secondly, I must align my Merchant Center feed with the same availability code. Ensuring consistency is key to avoid listing disapprovals.

    Instruction on when to use the availability [availability] attribute in GMC 

    Why we care. This update is a breath of fresh air for us sellers. Until now, conveying a vehicle’s unavailability for immediate pickup was challenging. Now, the ‘build to order’ option clearly mirrors the operations of modern automakers, especially those like Tesla and Rivian that offer direct-to-consumer customization. It helps set clear expectations for our customers and ensures our data is pristine for Google.

    ```json
{
  "alt": "Guidelines for product availability status including in stock, out of stock, preorder, backorder, and build to order.",
  "caption": "Explore the different product availability statuses: from in stock and out of stock to preorder, backorder, and even build to order for vehicle ads.",
  "description": "This image illustrates guidelines for product availability statuses required for all products. It lists supported values businesses can use: in stock, out of stock, preorder, backorder, and build to order, with detailed descriptions for each. These values ensure that product feed information matches the website details, facilitating smooth transactions. This guide aids businesses in managing inventory visibility effectively."
}
```

    The fine print. Remember, if a vehicle is categorized as ‘build to order,’ it must have the condition attribute set to ‘new.’ If it’s listed as ‘used,’ it will be disapproved. Google regards build-to-order vehicles as newly configured, not pre-owned.

    Bottom line. For anyone like me selling customizable or factory-order vehicles, this update is a more precise way to reflect vehicle availability. However, it only works if my feed, structured data, and condition fields are in synchronization.

    I first learned about this update from Google Shopping specialist Emmanuel Flossie, who kindly explained how to implement it on his blog.

    Dig deeper. For more insights, check out the “Availability [availability]” Google Merchant Centre help doc


    Inspired by this post on Search Engine Land.

    crushpress.ai community screenshot
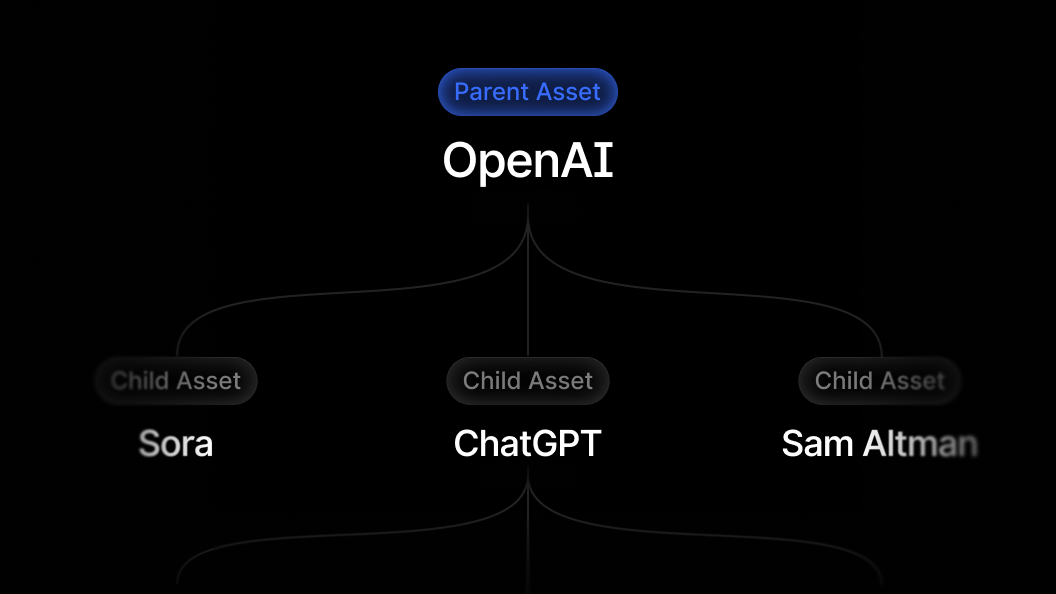
  • Unlock In-Depth Insights with Asset Hierarchies

    Unlock In-Depth Insights with Asset Hierarchies

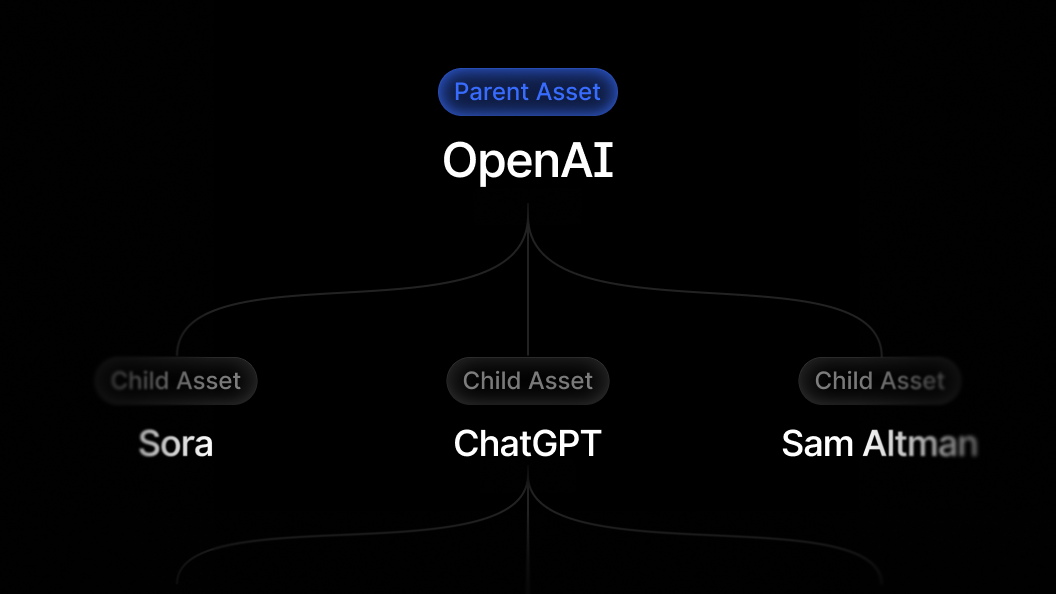
    I’ve discovered that Asset Hierarchies offer a powerful way to track each of my products, features, and other sub-assets individually. Despite this detailed tracking, everything seamlessly integrates back into the bigger picture of overall brand performance.

    This approach allows me to gain granular insights while still maintaining an understanding of my brand’s overall landscape.


    Inspired by this post on Try Profound Blog.


    crushpress.ai community screenshot
  • Boost Your B2B Visibility: Get Noticed by AI in Vendor Searches

    Boost Your B2B Visibility: Get Noticed by AI in Vendor Searches

    As a B2B company, I’ve noticed a significant shift in how buyers conduct vendor research, especially with the growing use of AI-driven platforms like ChatGPT. This trend presents a unique opportunity for us to increase our visibility and be recommended during the buying process.

    To capitalize on this, it’s essential to understand how AI search works and how we can optimize our presence to stand out. By leveraging AI visibility strategies, we can make sure our company appears at the top of vendor search results.

    One of the key tactics I’ve explored is incorporating AI-powered SEO tools to fine-tune our website and content. This approach not only enhances our searchability but also aligns with the evolving digital landscape where AI is becoming a primary decision-making tool.

    Moreover, staying informed about market trends and continuously adapting our strategies ensures that we remain competitive. Engaging with our audience through personalized content and targeted campaigns can build the brand authority needed to get recommended by AI systems.

    In conclusion, as AI continues to reshape the purchasing journey, positioning ourselves strategically in AI searches is vital. By embracing these changes, we can effectively increase our B2B visibility and ensure we’re on the radar of potential buyers.


    Inspired by this post on genmark.ai Blog.


    crushpress.ai community screenshot