Tag: Semrush

  • Unveiling ChatGPT’s Traffic Path: Google’s Surprising Role

    Unveiling ChatGPT’s Traffic Path: Google’s Surprising Role

    I recently came across an intriguing Semrush study that revealed some fascinating insights into ChatGPT’s traffic patterns. Despite a whopping 206% increase in referrals, surprisingly few sites actually see significant traffic. This is largely because many queries are backed by pre-trained knowledge rather than live web searches.

    According to the study, over 30% of outbound clicks go to just 10 domains. Google alone claims more than 20% of these clicks. It’s intriguing to see how much weight the tech giant holds in this landscape.

    ChatGPT is gradually leaning less towards live web searches. It only triggers search functions in 34.5% of queries now, a decline from 46% in late 2024. This shift indicates a change in how the platform’s role is evolving in navigating the web.

    Let me break it down further. Although ChatGPT’s referral traffic saw a significant rise, the traffic mainly flows towards a limited number of sites. In fact, about 21.6% of this traffic heads straight to Google, followed by nine other domains that make up a total of just over 30%.

    Many other websites are left with a small fraction of residual traffic. The number of domains receiving any referrals peaked at around 260,000 in 2025 but has since settled near 170,000.

    Why is this important for us? The visibility on ChatGPT doesn’t always translate directly into traffic. Often, the impact of referrals may seem marginal. Plus, the decline in search-triggered queries makes securing citations and traffic even more challenging.

    While ChatGPT defaults to pre-trained knowledge, it resorts to web searches in certain scenarios, like when users request sources, inquire about current events, or when the model shows uncertainty.

    I’ve noticed a shift in user behavior—most ChatGPT prompts don’t mirror typical search queries. Instead, between 65% and 85% reflect complex, conversational inputs, indicating a transformation in engagement. Interestingly, the number of queries per session jumped 50% in late 2025.

    Looking into the data, Semrush analyzed over a billion lines of U.S. clickstream data between October 2024 and February 2026. This analysis tracked prompts, referral destinations, and patterns in search usage.

    For those interested, more detailed insights can be found in the ChatGPT traffic analysis. The study, titled “ChatGPT traffic analysis: Insights from 17 months of clickstream data,” is an enlightening read.


    Inspired by this post on Search Engine Land.


    crushpress.ai community screenshot
  • Why Human-Written Content Outperforms AI on Google

    Why Human-Written Content Outperforms AI on Google

    I’ve come across some fascinating findings that demonstrate the prowess of human-written content on Google. According to data from Semrush, it turns out that content crafted by us, humans, stands a significant chance of claiming the top spot in Google’s search results, unlike its AI-generated counterpart.

    The Semrush study, analyzing 42,000 blog posts, revealed that human-written content dominates the No. 1 position on Google 80% of the time. In comparison, purely AI-generated pages manage to capture this coveted spot only 9% of the time.

    The details. Semrush conducted an analysis of 20,000 keywords and their top 10 results, utilizing an AI detector to classify the content.

    Human-authored pages outshined both AI-generated and mixed content across all top 10 positions.

    The gap was most pronounced at Position 1, where human content had an 8x higher likelihood of ranking.

    Meanwhile, I noticed that AI-generated content tended to appear more frequently in the lower spots on Page 1, with a nearly double increase from Positions 1 to 4.

    Yes, but. AI detection tools, as widely acknowledged, can be inconsistent. This inconsistency often leads to misclassifications between human and AI-generated content, introducing a degree of “fuzziness” in these classifications.

    Why we care. While AI-generated content can occasionally perform well, the data suggests that the insights and intuition of human writers still drive superior results. For competitive queries, originality, expertise, and sound editorial judgment remain valuable advantages.

    Perception vs. data. It’s intriguing that 72% of SEO professionals regard AI content as performing as well as or even better than human content. Yet, the actual ranking data clearly indicates a strong advantage for human-written content at the top.

    How teams use AI. It doesn’t surprise me to find that AI is widely adopted, especially in creating a hybrid workflow:

    A substantial 87% of teams retain significant human involvement during content creation.

    64% employ a human-led, AI-assisted approach.

    AI proves most beneficial in research, drafting, and optimization stages.

    However, AI usage noticeably declines for multimedia, localization, and tasks requiring heightened judgment.

    What’s driving adoption. While AI speeds up output, it doesn’t consistently enhance content quality.

    73% of respondents highlighted faster production as AI’s primary benefit.

    Yet, only 19% asserted that it improves content quality.

    About the data: The analysis’s foundation lies on 42,000 blog pages from 200,000 URLs associated with 20,000 keywords. GPTZero was used to classify content for this study, which also includes insights from a survey of 224 SEO professionals involved in content and search.

    The study. Does AI content rank well in search? [Survey + Data study]


    Inspired by this post on Search Engine Land.


    crushpress.ai community screenshot
  • Effortlessly Integrate Semrush SEO Data with Profound Agents

    Effortlessly Integrate Semrush SEO Data with Profound Agents

    I’ve always sought ways to streamline my workflow, especially when it comes to managing multiple SEO tools. That’s why I’m thrilled to bring Semrush’s comprehensive SEO data directly into the heart of Profound Agents. This integration allows me to seamlessly access domain metrics, analyze backlink profiles, conduct thorough keyword research, and dive into organic search data—all within the same environment where I monitor AI visibility, generate content, and perform competitive analysis.

    Imagine the efficiency of handling everything without the need for exports, constant tab switching, or manual data collation. This integration is more than just a feature; it’s a game-changer for anyone who’s passionate about optimizing their SEO strategy while saving time.


    Inspired by this post on Try Profound Blog.


    crushpress.ai community screenshot
  • 59% of SEO Roles Now Senior-Level: The AI-Powered Shift

    59% of SEO Roles Now Senior-Level: The AI-Powered Shift

    I’ve noticed a significant shift in the SEO industry toward senior, strategy-focused roles. As AI increasingly handles execution tasks, the demand for seasoned strategists has grown, along with an increase in salaries and responsibilities that span multiple channels.

    The change in hiring trends is evident when looking at a recent Semrush analysis of 3,900 job listings. It appears companies are now prioritizing leadership skills, innovative experimentation, and cross-channel visibility over purely technical execution.

    Why it matters to me. The landscape for SEO careers and skillsets is evolving. Entry-level positions are mostly focused on execution, while leadership roles require a firm grasp of strategy across various domains such as search, AI assistants, and paid channels, ensuring they drive significant revenue.

    What’s changing now. Senior roles account for 59% of job listings, clearly dominating the landscape. In contrast, mid-level positions like specialists and managers are less prevalent, with only 15% and 10%, respectively.

    Companies are redirecting their budgets towards strategic roles as AI tools begin to absorb more of the technical workload.

    The shift in skills. The skills in demand now extend beyond traditional SEO to include coordination, experimentation, and decision-making capabilities:

    Project management is mentioned in over 30% of the listings, highlighting its importance.

    Communication is highlighted in 39.4% of non-senior roles, indicating its fundamental role in the industry.

    Experimentation is noted in 23.9% of senior roles, compared to just 14% of other roles.

    Technical SEO appears in approximately 6% of postings, showing its niche but crucial role.

    Tools and channels. The modern SEO toolkit now includes analytics, paid media, and comprehensive data tools.

    Google Analytics is cited in up to 47.7% of job listings, underlining its importance.

    Google Ads features in 29% of the listings, showcasing its growing relevance.

    Demand for SQL skills is rising, especially at the senior level.

    AI tools, such as ChatGPT, are increasingly mentioned, reflecting their future role in SEO.

    AI expectations. AI literacy is shifting from being a nice-to-have to an essential skill:

    31% of senior roles now reference AI capabilities.

    Nearly 10% of listings highlight familiarity with LLMs.

    Concepts such as AI search and AEO are increasingly common in job descriptions.

    Pay and positioning. SEO is being increasingly recognized as a vital business function:

    The median salary for senior roles has reached $130,000, markedly higher than the $71,630 for other roles, with some positions offering even more.

    Preferred degrees are leaning towards business and marketing, reflecting the strategic emphasis.

    Remote work prevalence. Remote options are available in over 40% of job listings, indicating a shift towards flexible work environments across all levels.

    About the data. This analysis by Semrush covers 3,900 SEO job listings in the U.S., gathered from Indeed as of November 25. The roles were deduplicated and segmented by seniority before a semantic keyword extraction analysis was applied.

    Discover more about the study. For a deeper dive into these findings, check out Semrush’s detailed study titled What 3,900 SEO Job Listings Reveal for 2026: Experiments, AI, and Six-Figure Salaries.


    Inspired by this post on Search Engine Land.


    crushpress.ai community screenshot
  • Adobe Phases Out Marketo SEO: Export Your Data by March 31

    Adobe Phases Out Marketo SEO: Export Your Data by March 31

    As a regular user of Adobe’s Marketo Engage, I recently learned that Adobe plans to discontinue the SEO feature by the end of March 2026. This information was detailed in Adobe’s February 2026 release notes, and I wanted to share my thoughts and remind you to take action if you use this tool.

    I know how crucial it is to export existing SEO data before the tool’s deprecation on March 31, 2026. You can find export instructions on this page. It’s essential to act promptly, as the SEO tile will be removed from the platform starting April 1.

    So, what’s the story here? Adobe’s Keith Gluck mentioned that retiring underutilized features will allow the Marketo Engage team to refocus resources elsewhere. If you’re seeking alternative SEO tools, Adobe’s acquisition of Semrush in 2025 offers a robust solution, with Semrush being a comprehensive SEO and visibility tool. (Remember, Semrush now owns Third Door Media, the publisher of Search Engine Land.)

    I wasn’t taken aback by this news, as it’s been common knowledge among those who keep up with Marketo updates. Reports have indicated that not many users fully tapped into the SEO capabilities. Additionally, the Marketo Engage team hasn’t prioritized these features recently.

    With shifts in the search landscape, driven by rapid advancements like LLMs, saying goodbye seemed timely. Semrush’s entry into the Adobe ecosystem feels like a fitting evolution of their service offerings.

    If you’re interested, check out a related update on LinkedIn:


    Inspired by this post on Search Engine Land.


    crushpress.ai community screenshot
  • Discover the Top Brands Shaping AI Search Visibility

    Discover the Top Brands Shaping AI Search Visibility

    I’m excited to share that Semrush has launched the new AI Visibility Awards, highlighting which brands are excelling in AI-generated search results.

    As AI chatbots increasingly become our go-to for travel plans and product recommendations, I often wonder how we can ensure our brands feature prominently in their answers.

    Semrush seems to have found the solution and has introduced this award program to celebrate the trailblazers in this field.

    The AI Visibility Awards honor brands frequently mentioned and recommended in AI-generated responses, assessed using Semrush’s AI Visibility Index—a dataset crafted from over 2,500 real prompts processed through ChatGPT and Google’s AI Mode.

    Andrew Warden, Semrush’s CMO, notes:

    • “This year marks a turning point in how visibility is achieved. It’s driven by actual user behavior rather than submissions or panels. These awards spotlight those marketers who have mastered AI interaction and earned significant trust inside the answers.”

    What the AI Visibility Awards Measure

    The awards recognize three performer types within four major industries:

    • Category Leaders: Brands with the biggest presence in AI searches
    • Growth Engines: Brands rapidly gaining visibility
    • Challengers: Emerging brands gaining AI traction

    To illustrate, Google tops the Business & Professional Services category, while Rippling stands out as a Challenger. In Consumer Electronics, Samsung leads, with Logitech and Nothing Technology recognized as a Growth Engine and Challenger, respectively.

    Other notable winners include:

    • Microsoft, named Category Leader for Digital Tech & Software
    • UNIQLO as a Growth Engine in Fashion & Apparel
    • Anthropic as a Challenger in Digital Tech & Software

    The award insights reveal some emerging truths about AI-powered discovery:

    • Stability among leaders: Top brands display less than 20% monthly volatility in AI share-of-voice, suggesting AI platforms tend to “lock in” trusted names.
    • Niches break through: Brands with niche relevance—like Patagonia in ethical fashion or Logitech in gaming accessories—prove advantageously positioned.
    • Challengers can compete: Newer players, like Nuuly and Anthropic, gain traction with robust positioning and strategic momentum.
    • Verticals behave differently: While some sectors, such as Business & Professional Services, stay fiercely competitive, others benefit from consistency or unique specialization.

    These awards highlight a significant message for marketers: gaining AI visibility is turning into a crucial part of the competitive landscape. For certain brands, it’s already reshaping strategies.


    Inspired by this post on Search Engine Land.


    crushpress.ai community screenshot
  • Master AI Search: Techniques to Enhance Your SERP Strategy

    Master AI Search: Techniques to Enhance Your SERP Strategy

    As I dive into the evolving landscape of search, I’ve noticed a shift from traditional keywords to more conversational prompts. In today’s digital world, searchers are replacing shorter queries with detailed prompts, seeking comprehensive answers rather than a mere list of links.

    Until we’re equipped with an AI-specific Google Search Console or Bing Webmaster Tools, understanding our audience’s behavior on AI platforms feels like a guessing game. But fear not, as we can still trace their journey using data proxies. By leveraging these proxies, I can uncover how my audience might be searching and track those prompts with my preferred AI Tracking Tool.

    ```json
{
  "alt": "Screenshot showing SEO-related questions and a link to 'SEO For Dummies' on Amazon.",
  "caption": "Curious about SEO? Discover answers to common questions and explore 'SEO For Dummies' on Amazon to enhance your understanding and skills.",
  "description": "This image is a screenshot of a Google search result displaying SEO-related questions under 'People also ask', including 'What is SEO and how does it work?' and 'What is SEO for dummies?'. It features a highlighted link to 'SEO For Dummies (For Dummies (Computer/Tech))' on Amazon, designed to guide beginners in optimizing websites for better search engine ranking. Keywords: SEO, search engine optimization, SEO guide, Amazon SEO book."
}
```

    One invaluable tool is the ‘People Also Ask’ feature on search engines. This well-known SERP component can help transition from keywords to questions. Introduced in 2014, it suggests related questions, allowing me to explore queries that echo conversational prompts.

    ```json
{
  "alt": "The CapmatchOne logo with a gradient circle and bold text.",
  "caption": "Discover innovation with the CapmatchOne logo, featuring sleek typography and a modern gradient circle.",
  "description": "The CapmatchOne logo features bold, modern typography coupled with a gradient circle, symbolizing connection and innovation. The sleek design conveys a sense of progress and creativity. This image can be used for branding or promotional purposes, appealing to audiences interested in innovative solutions and forward-thinking designs."
}
```

    Using platforms like AlsoAsked, I can extract these questions at scale, finding long conversational queries that closely resemble AI prompts.

    ```json
{
  "alt": "Search performance dashboard showing top queries for 12 months.",
  "caption": "Explore the top search queries of the past year with this performance dashboard, highlighting key interests and trends in software and SaaS platforms.",
  "description": "This image displays a section of a performance dashboard for search results, focused on the last 12 months. It highlights top search queries, including interests in software companies and SaaS pricing comparisons. Tabs like QUERIES and options to filter data by time are visible. This tool helps analyze search trends and insights for business strategies."
}
```

    Another avenue I explore is through Userbots such as ChatGPT-User and Perplexity-User. These bots offer insights into how my content is utilized in AI search, highlighting pages that are frequently cited without needing to guess the relevance of prompts.

    ```json
{
  "alt": "Screenshot showing advice on attic maintenance with related article links.",
  "caption": "Considering attic improvements? Explore expert advice with links to related DIY guides and tips.",
  "description": "This image features a section of a website discussing attic maintenance, emphasizing hiring professionals for complex roof issues and HVAC sealing. It also includes related article links on topics such as insulation materials, R-value requirements, air sealing steps, and DIY materials comparison. Icons for sharing, exporting, and rewriting are visible, providing users with interactive options."
}
```

    The process, called RAG (Retrieval-Augmented Generation), effectively grounds language models in factual data. It’s fascinating to consider how my content can play a role in shaping user responses, even if it doesn’t result in a direct click.

    ```json
{
  "alt": "Dashboard showing data on content marketing including related topics, prompts, brands, and source domains.",
  "caption": "Explore the dynamic world of content marketing with this informative dashboard, featuring insights on topics, prompts, brands, and source domains, highlighting the ever-evolving landscape of digital strategies.",
  "description": "This image displays a data dashboard focused on content marketing research. Key elements include related topic volume of 1.6 million, 137 topics, 3,000 prompts, and the mention of 4,000 brands. The graph indicates informational intent as the dominant type. Brands like LinkedIn, Google, and Instagram are highlighted, alongside top sources YouTube.com, LinkedIn.com, and Reddit.com. The dashboard offers valuable insights into current trends and strategies in content marketing as of October 31, 2025. Keywords: content marketing, data dashboard, digital strategy, brand insights."
}
```

    Gaining insights from long queries through tools like Google Search Console is another method I employ. By utilizing innovative techniques like Ziggy Shtrosberg’s complex regex filters, I can unearth queries that simulate AI search behavior.

    ```json
{
  "alt": "Screenshot of a browser developer tools network panel with filters and response details displayed.",
  "caption": "Diving into the network panel: A behind-the-scenes look at web page data with browser dev tools. Explore the intricacies of online transactions with ease.",
  "description": "This image shows a screenshot of a browser's developer tools, focusing on the network panel. The interface includes options like 'Preserve log' and 'Disable cache,' along with a filter search for 'conversation.' Various request names are shown, along with detailed response headers and values. This tool is essential for developers to track and debug network requests and responses efficiently, aiding in webpage optimization and debugging."
}
```

    It’s essential to approach this data cautiously, as some patterns might stem from automated trackers rather than genuine human interaction. For instance, high-appearance queries with zero clicks could indicate non-human usage.

    ```json
{
  "alt": "A list of search queries for family-friendly all-inclusive resorts in Antalya for 2025.",
  "caption": "Explore the top family-friendly resorts in Antalya for an all-inclusive 2025 vacation. Discover the best deals for families and enjoy unforgettable memories.",
  "description": "The image displays search queries related to family-friendly all-inclusive resorts in Antalya for the year 2025. Queries include resort names like Cornelia Diamond Golf Resort & Spa, Barut Lara, and Rixos Premium Belek, focusing on family room pricing for two adults and one child. Keywords like 'price per night' and 'summer' are present, highlighting user interest in affordable, comprehensive vacation packages in Antalya's popular hotel destinations."
}
```

    Engaging with Perplexity AI’s follow-up feature is also enlightening. This feature can hint at how users might prompt AI systems, aiding my understanding of expected human interaction.

    Finally, the Semrush AI Visibility Tool provides an ingenious way to manage the scaling challenge of unique prompts. By merging prompts into broader topics and using AI to distill their meanings, I gain valuable insights into intent and brand mentions across different regions.

    In a rapidly changing tech environment, staying grounded in data is vital. Not all prompts engage Retrieval-Augmented Generation (RAG), which means those needing answers already in training data may bypass linking to new page sources.

    However, when users seek recommendations (for example, dining options or attractions), page visibility within AI-generated answers can still convert offline interactions, benefiting brand exposure.

    Checking the background operations of ChatGPT reveals search prompts within Chrome Dev Tools. By identifying searches and their relevancy to RAG, I can strategize to optimize this invisible layer of search behavior.

    The quest to master AI search dynamics is ongoing. New AI models and evolving user behaviors necessitate continuous adaptation to comprehend and leverage audience interactions effectively.


    Inspired by this post on Search Engine Land.


    crushpress.ai community screenshot
  • How Google AI Overviews Transformed Search in 2025

    How Google AI Overviews Transformed Search in 2025

    I’ve been captivated by how Google AI Overviews shifted the search landscape in 2025. Since then, I’ve delved into a detailed analysis by Semrush, which evaluated over 10 million keywords, revealing significant volatility, an increase in ads, stronger click-through rates (CTRs), and AI Overviews venturing beyond purely informational searches.

    The year witnessed a rapid expansion of AI Overviews in Google’s search functions, which eventually tapered off as they began appearing in commercial and navigational inquiries. Between January and November, Semrush’s analysis identified these dynamic changes.

    AI Overviews surged, then retreated. The deployment of AI Overviews was far from linear. Google introduced them at a rapid pace, peaking mid-year, then scaled back based on user data and feedback:

    • January: AI Overviews appeared in 6.5% of all queries.
    • July: Their presence peaked, appearing in nearly 25% of searches.
    • November: By this time, their appearance was retracted to less than 16%.

    Zero-click behavior defied expectations. Contrary to initial beliefs, I noticed that click-through rates for searches with AI Overviews have increased steadily. It seems that rather than reducing clicks, AI Overviews may actually encourage them.

    • AI Overviews are more common on searches that generally lead to no clicks.
    • But when examining the same keywords pre and post-introduction of an AI Overview, the zero-click rates decreased from 33.75% to 31.53%.

    Informational queries no longer dominate. At the start of 2025, AI Overviews predominantly served informational purposes:

    • January: 91% informational
    • October: 57% informational

    Eventually, I observed AI Overviews appearing in commercial and transactional searches:

    • Commercial queries: Jumped from 8% to 18%
    • Transactional queries: Increased from 2% to 14%

    Navigational queries are rising fast. Interestingly, there’s a noticeable increase in AI Overviews intercepting brand and destination searches:

    • Navigational AI Overviews rose from under 1% in January to over 10% by November.

    Google Ads + AI Overviews. Earlier this year, ads rarely appeared next to AI Overviews. Now, their presence is much more common:

    • Ads alongside AI Overviews grew from about 3% in January to around 40% by November.
    • Roughly 25% of AI Overview SERPs now show ads at the bottom.

    Science is the most impacted industry. In terms of keyword saturation, Science tops the list with AI Overviews appearing in 25.96% of searches. This is followed by Computers & Electronics at 17.92%, and People & Society at 17.29%.

    • Since March, Food & Drink has experienced the fastest growth among all categories in AI Overview usage.
    • In contrast, sectors like Real Estate, Shopping, and Arts & Entertainment see AI Overviews in less than 3% of queries.

    Why we care. With AI Overviews persistently reshaping click behaviors, commercial visibility, and ad placements, I believe it’s important to keep a close eye on these shifts and adapt accordingly.

    The report. For a deeper dive, you can explore the full Semrush AI Overviews Study: What 2025 SEO Data Tells Us About Google’s Search Shift.

    Dig deeper. Earlier, in May, I reported on the initial findings of Semrush’s study in Google AI Overviews now show on 13% of searches: Study.


    Inspired by this post on Search Engine Land.


    crushpress.ai community screenshot
  • Win an All Access Pass: Help Shape SMX Advanced 2026!

    Win an All Access Pass: Help Shape SMX Advanced 2026!

    I’m excited about the opportunity to influence the future of search marketing events. You can help shape SMX Advanced 2026 by sharing your insights and preferences. The event is happening from June 3-5 at the Westin Boston Seaport, and we want to know what you’re eager to learn and who you’re interested to hear from.

    Reflecting on June’s event, it was thrilling to reunite in person for the first time since 2019 at SMX Advanced. It was more than just a conference; it felt like a global reunion for search marketers to connect, share ideas, and dive into cutting-edge insights.

    The world of search is ever-evolving, with swift changes in AI SEO, algorithm updates, and the delicate balance of AI with a human touch. Advanced, actionable education is more crucial than ever, and that’s where you come in.

    Help Shape SMX Advanced 2026

    Our aim for SMX Advanced 2026 is to make it the most relevant and exciting yet, but we need your expertise to get there. Your input is invaluable, and we’re inviting you to directly influence the 2026 curriculum.

    Completing our brief survey lets you help build a program that addresses the critical challenges and opportunities you’re facing. Share with us:

    • Which advanced topics will boost your professional growth.
    • The search changes and complexities that concern you the most.
    • Experts and innovators you’re excited to hear from.
    • Preferred session formats, whether deep-dive clinics, lightning talks, or interactive panels.

    Fill out the survey here.

    Be Entered to Win an All Access Pass

    As a token of our appreciation, everyone completing the survey gets a chance to enter an exclusive drawing.

    One lucky winner will receive an All Access pass to SMX Advanced 2026! Join us for this landmark event at the Westin Boston Seaport from June 3-5.

    Submit a Session Pitch

    Beyond influencing the agenda, we’re offering you the chance to submit a session pitch. If you’ve developed a groundbreaking strategy or have valuable insights, lead the conversation and showcase your expertise.

    Check out our guide to speaking at SMX for details on submitting your session idea. When you’re ready, create your profile and send us your pitch.

    I’m looking forward to your submissions and insights! If you have questions, feel free to reach out to me at kathy.bushman@semrush.com.


    Inspired by this post on Search Engine Land.


    crushpress.ai community screenshot
  • Mastering LLM Visibility: Metrics and Insights for Real Impact

    Mastering LLM Visibility: Metrics and Insights for Real Impact

    I’ve been deeply involved in the compelling discussions around AI, especially the intriguing intersection of ‘AI hype meets AI reality.’ Tools like Semrush One and its Enterprise AIO tool have taken center stage, offering invaluable insights into what’s happening inside LLMs. The big questions I often ponder are: How many citations are we capturing and just how many mentions are our brands accumulating?

    When this data first emerged, it felt revolutionary. However, it quickly prompted other questions, like ‘What’s the ROI here?’ and ‘How can I integrate this data into my team’s marketing strategy?’ Ensuring that this valuable and fascinating data translates into actionable insights is a challenge I enjoy tackling.

    ```json
{
  "alt": "The CapmatchOne logo with a gradient circle and bold text.",
  "caption": "Discover innovation with the CapmatchOne logo, featuring sleek typography and a modern gradient circle.",
  "description": "The CapmatchOne logo features bold, modern typography coupled with a gradient circle, symbolizing connection and innovation. The sleek design conveys a sense of progress and creativity. This image can be used for branding or promotional purposes, appealing to audiences interested in innovative solutions and forward-thinking designs."
}
```

    It’s no secret that the data these tools provide is incredibly valuable. But, what steps do I take next? Let’s uncover this journey together.

    ```json
{
  "alt": "Trending products list showing ranking of TV brands and models by share of voice.",
  "caption": "Discover what's trending in TV technology as LG and TCL lead the rankings by share of voice.",
  "description": "This image displays a list of trending TV products ranked by share of voice. LG's G3 model takes the top spot with 11%, followed by LG's C3 and TCL's 6-Series both with an 8% share. Samsung's QN90C and S95C, along with TCL's QM8K, also feature among the top-ranked models. The list highlights popular brands and models in the current TV market, useful for consumers looking to stay informed about top choices."
}
```

    The Fundamental Challenges of Tracking LLMs

    Tracking LLMs can be more challenging than traditional metrics like Google rankings. Google rankings may show where I stand, but ranking doesn’t always correlate with traffic or revenue. Even if I rank highly, an AI Overview could dominate the search, reducing my traffic for a given keyword. I need to ask myself, is this the right traffic for my business goals?

    ```json
{
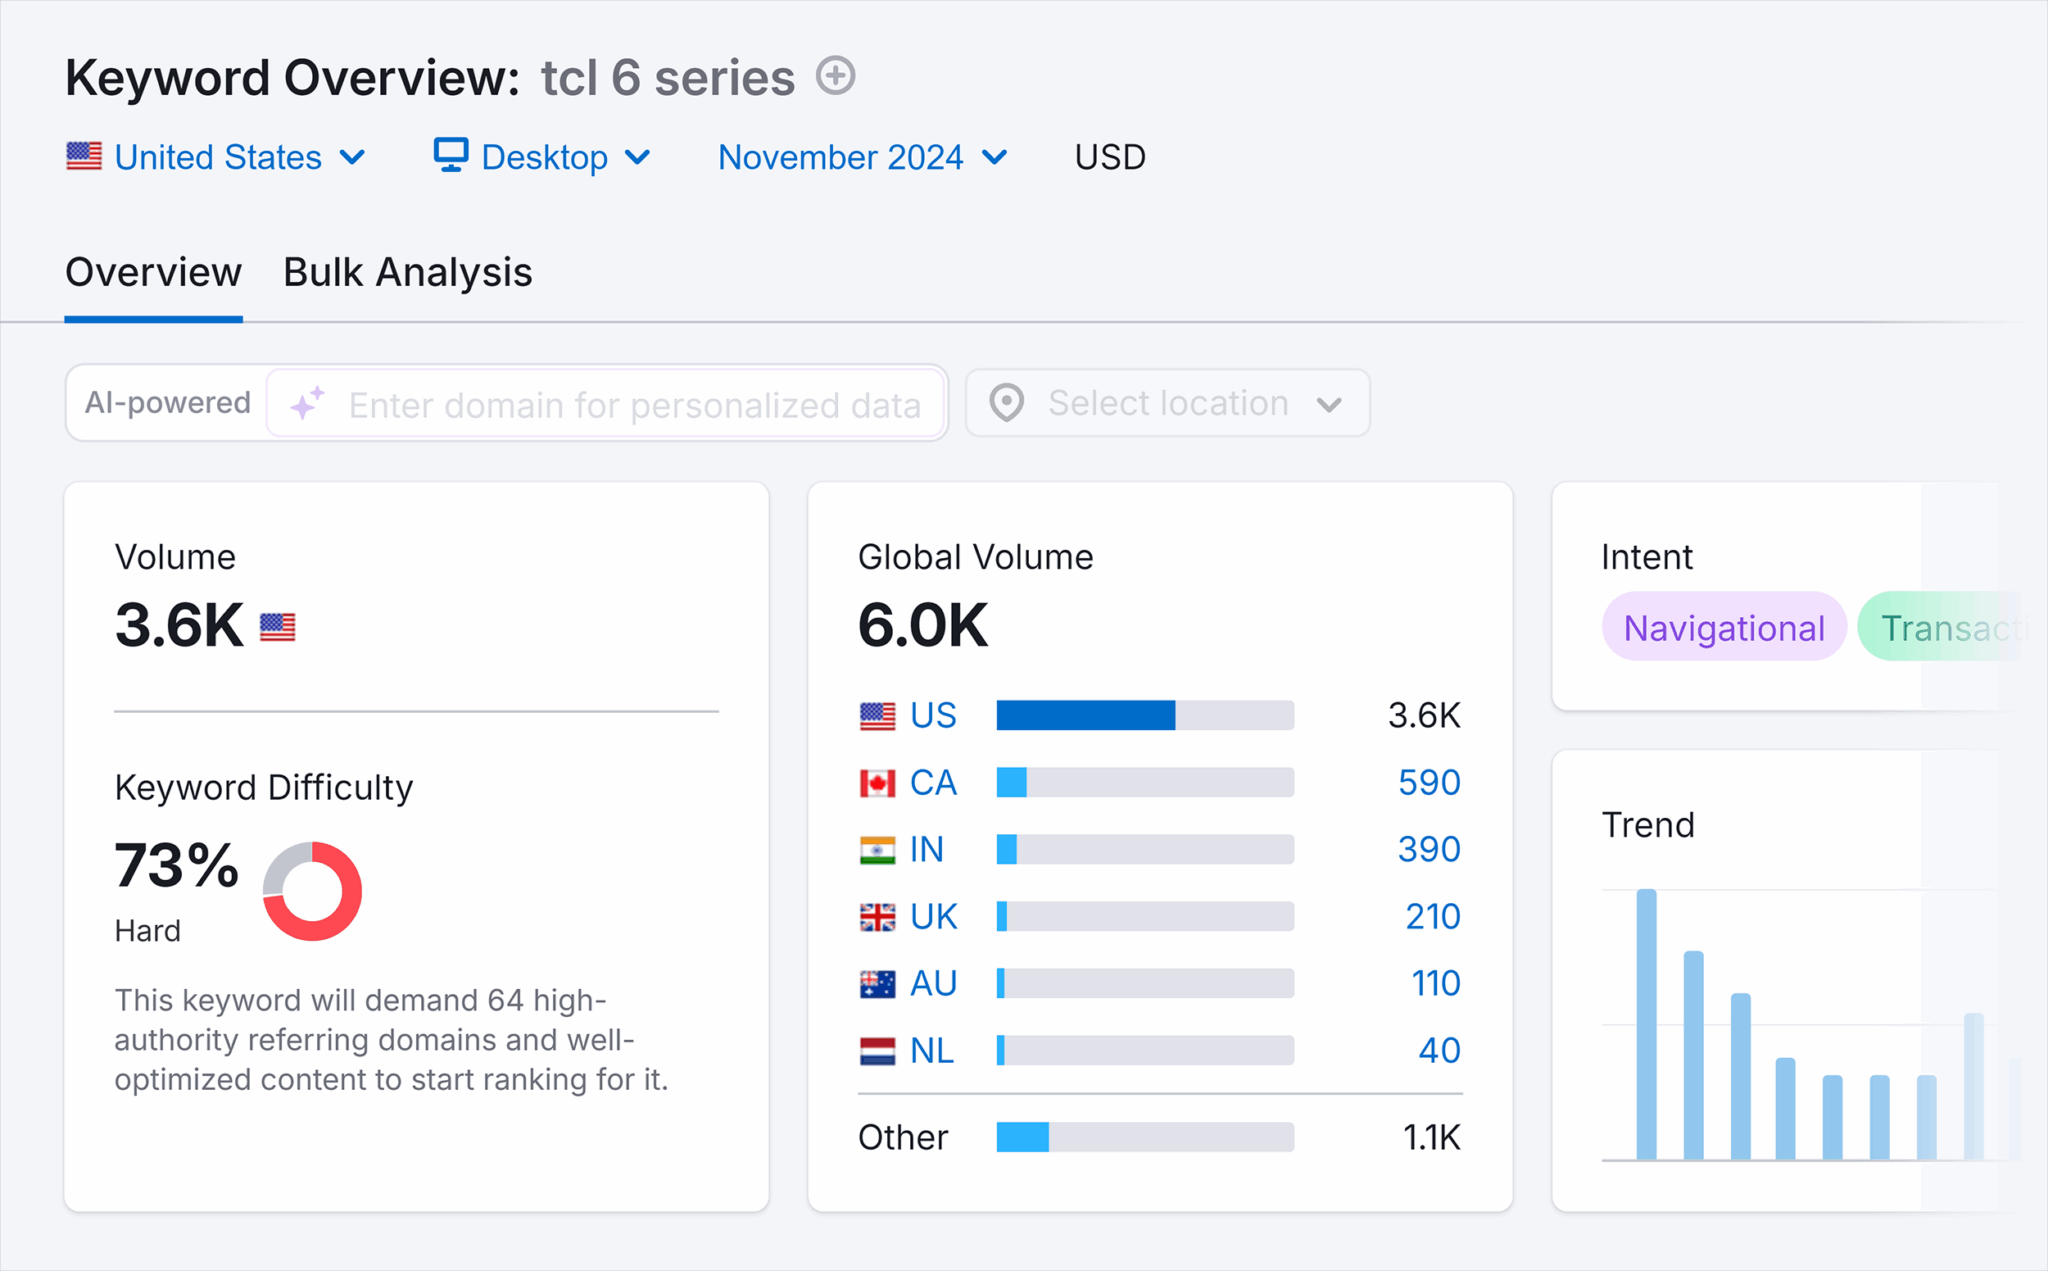
  "alt": "Keyword overview of TCL 6 series showing search volume, keyword difficulty, and trend data.",
  "caption": "Explore the keyword analysis for 'TCL 6 series' with detailed volume, global reach, and trend insights for November 2024.",
  "description": "This image displays a keyword analysis dashboard for the 'TCL 6 series.' In November 2024, the keyword has a search volume of 3.6K in the US and 6K globally, with a difficulty score of 73%, indicating high competition. The data is segmented by country, revealing insights into search intent and trend progression, helpful for content strategists and SEO professionals optimizing for this keyword."
}
```

    The big difference between traditional SEO rankings and LLM visibility is the straightforward correlation between strong rankings and increased revenue, which is more complex with LLMs. I can easily track user behavior after they land on my site from organic search, but it’s not so clear-cut with LLMs.

    ```json
{
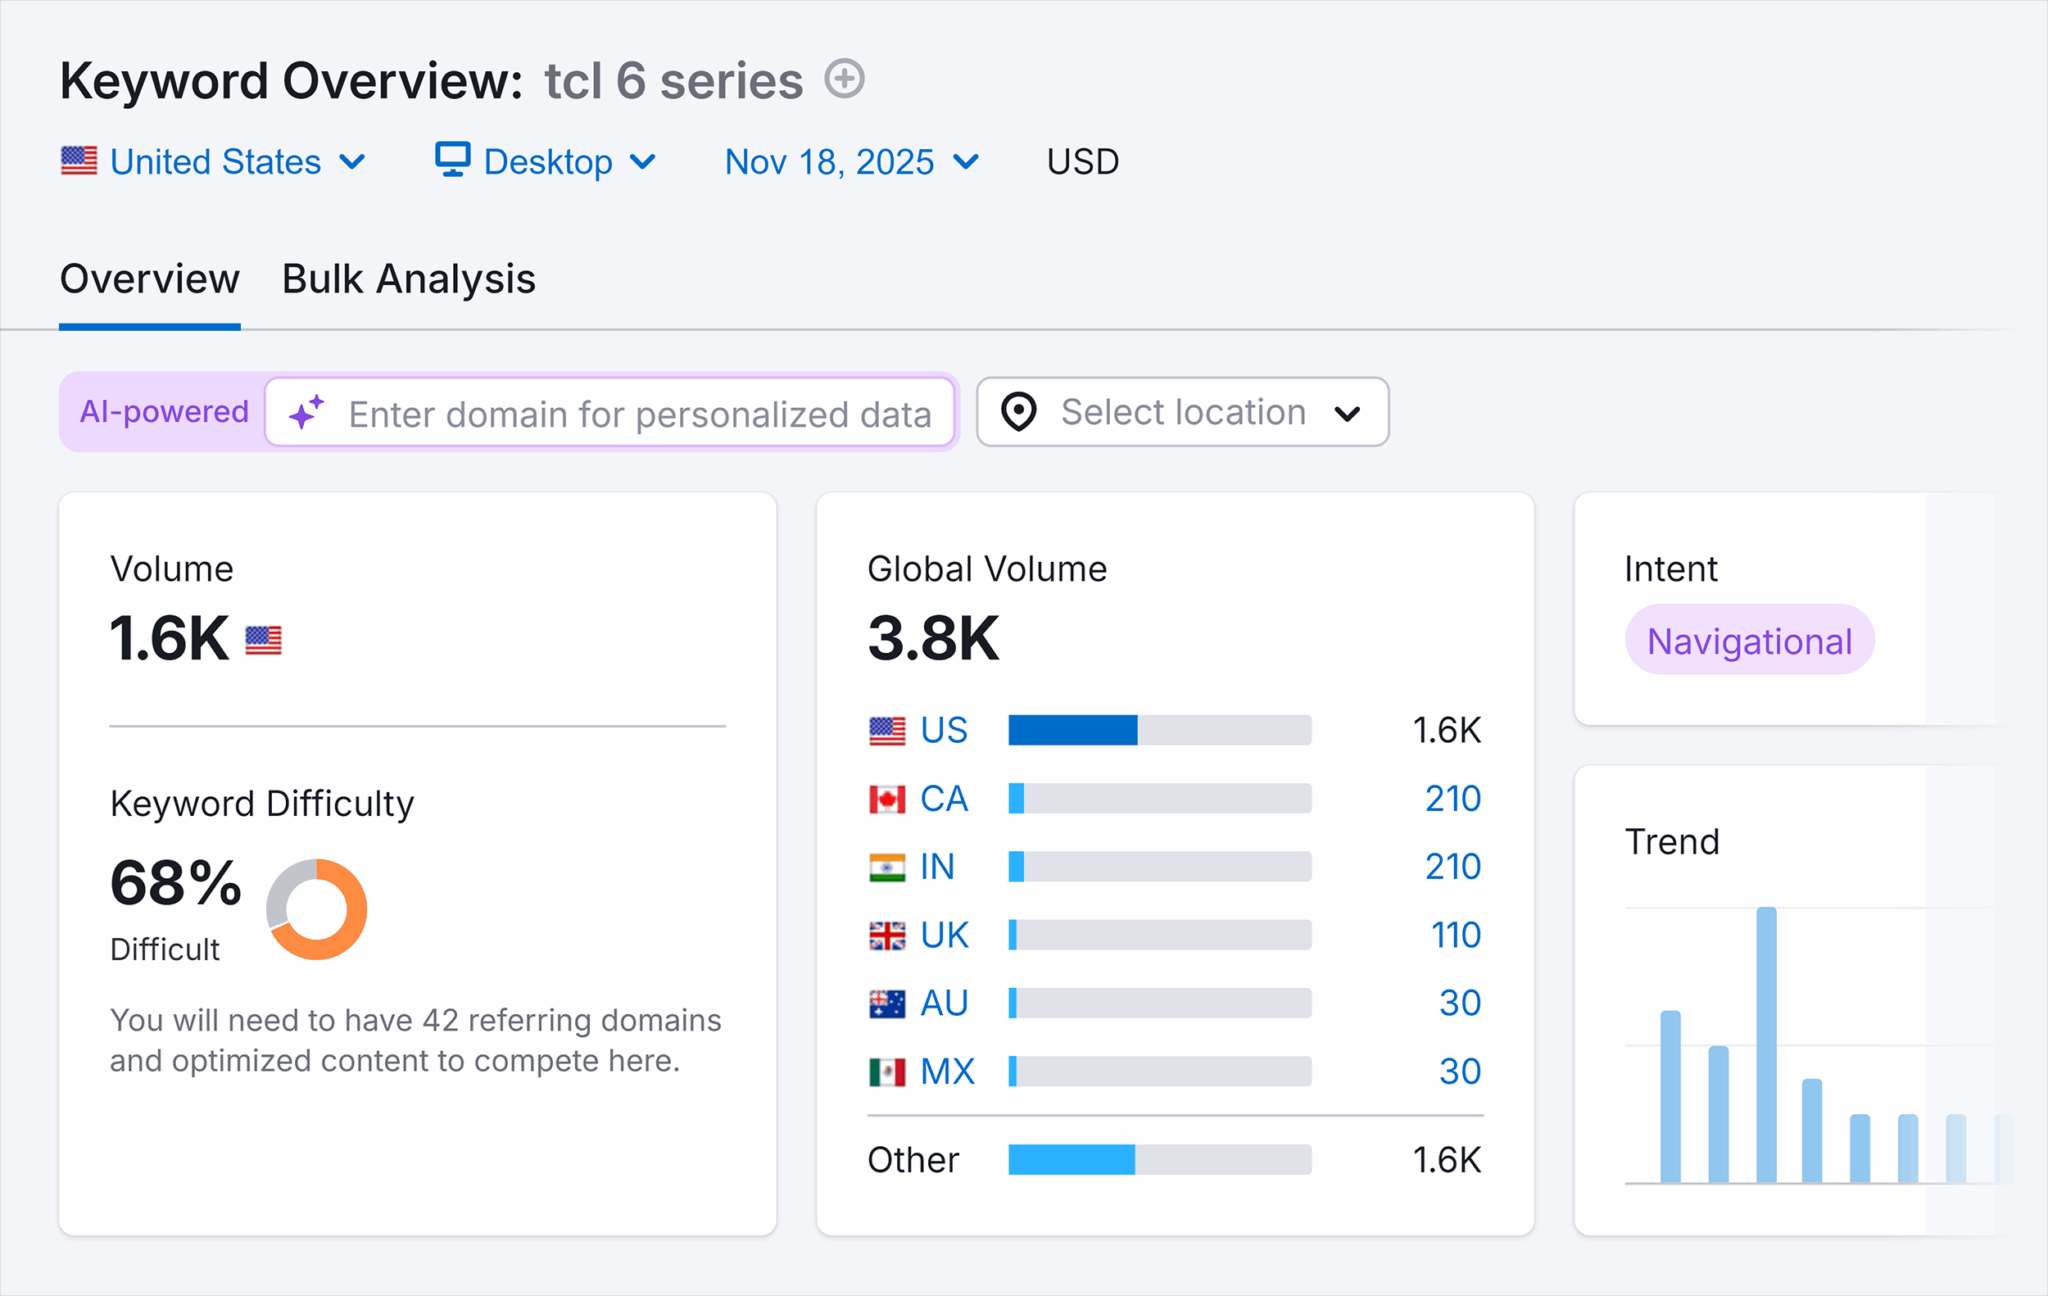
  "alt": "Keyword overview for TCL 6 series, showing search volumes, keyword difficulty, and intent.",
  "caption": "Explore detailed keyword insights for the TCL 6 Series, highlighting search volume, difficulty, and intent to refine your SEO strategy.",
  "description": "The image presents a keyword overview for the TCL 6 Series, detailing a search volume of 1.6K in the US and a global volume of 3.8K. It notes a keyword difficulty of 68%, indicating a challenging competition level. The intent is labeled as navigational, with trends visualized in a bar graph. This data is segmented by countries, including CA, IN, UK, AU, and MX, offering a comprehensive analysis suitable for refining SEO efforts. Keywords: TCL 6 Series, Keyword Overview, Search Volume, SEO, Navigational Intent."
}
```

    SEO effectively drives traffic to my site, allowing me to evaluate the success of my conversion rate optimization (CRO) strategies. However, LLMs operate differently, leaving me with the task of creatively connecting the dots.

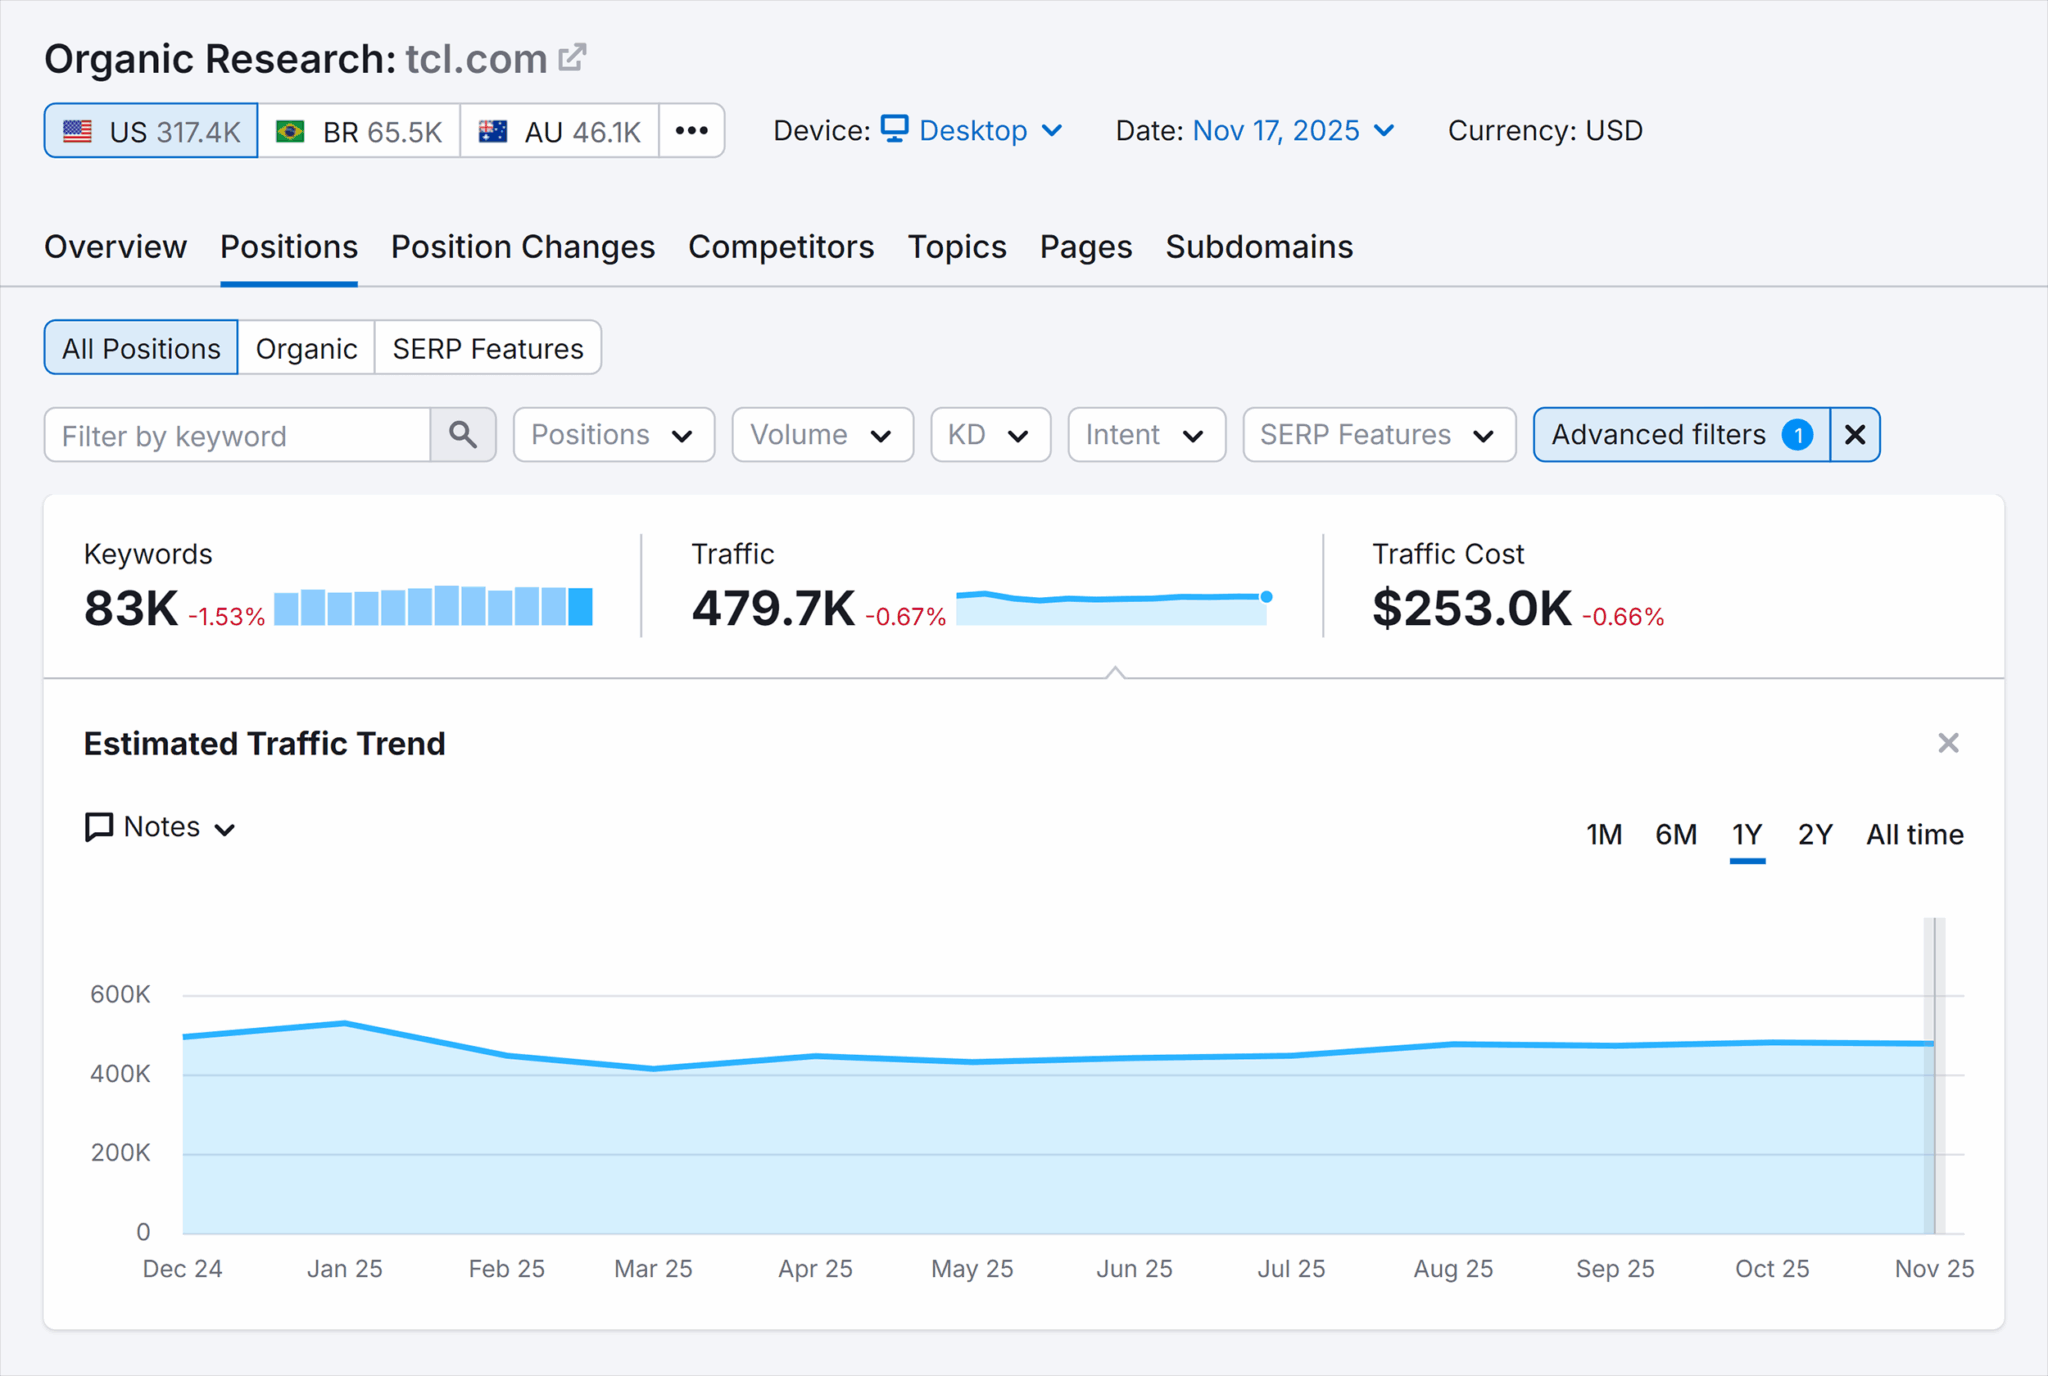
    ```json
{
  "alt": "SEO report for tcl.com showing keyword, traffic, and cost data with a traffic trend graph.",
  "caption": "Dive into the SEO stats for tcl.com, showcasing keyword performance, traffic data, and cost analysis, all accompanied by a visual traffic trend over the past year.",
  "description": "This image presents an SEO report for tcl.com as of November 17, 2025. It highlights key statistics such as 83K keywords, 479.7K monthly traffic, and a traffic cost of $253K, each experiencing slight decreases. The report includes a traffic trend graph showing fluctuations over the past year. This report is useful for analyzing search performance and strategizing for better visibility. Keywords: SEO, traffic, keywords, tcl.com, report, analysis, performance, trend."
}
```

    The Problem with Methodology

    As I dive deeper into using LLM-related data, I realize this approach requires me to step out of my comfort zone as a performance marketer. My usual reliance on direct attribution and data points is shifted toward constructing a narrative that ties LLM visibility to larger brand storytelling.

    ```json
{
  "alt": "SEO report showing organic research data for tcl.com including keywords, traffic, and estimated traffic trend over two years.",
  "caption": "An in-depth look into tcl.com's SEO performance: Explore key metrics like declining keywords and traffic, alongside an estimated trend over the past two years.",
  "description": "This image displays a detailed SEO report on tcl.com, featuring data such as a 5.37% drop in keywords to 317, a 1.72% decrease in traffic to 2.2K, and an 8.13% rise in traffic cost to $1.1K. The chart illustrates the estimated traffic trend for desktop devices over a two-year span from January 2024 to October 2025, with significant fluctuations and an overall downward trajectory. This visual is essential for analyzing SEO metrics and understanding website performance in different markets, including the US, Brazil, and Australia."
}
```

    This method isn’t novel, however. Brand marketers have dealt with indirect metrics since the days of billboard advertising. Still, the shift requires me to create insights from what might seem like fragmented LLM data.

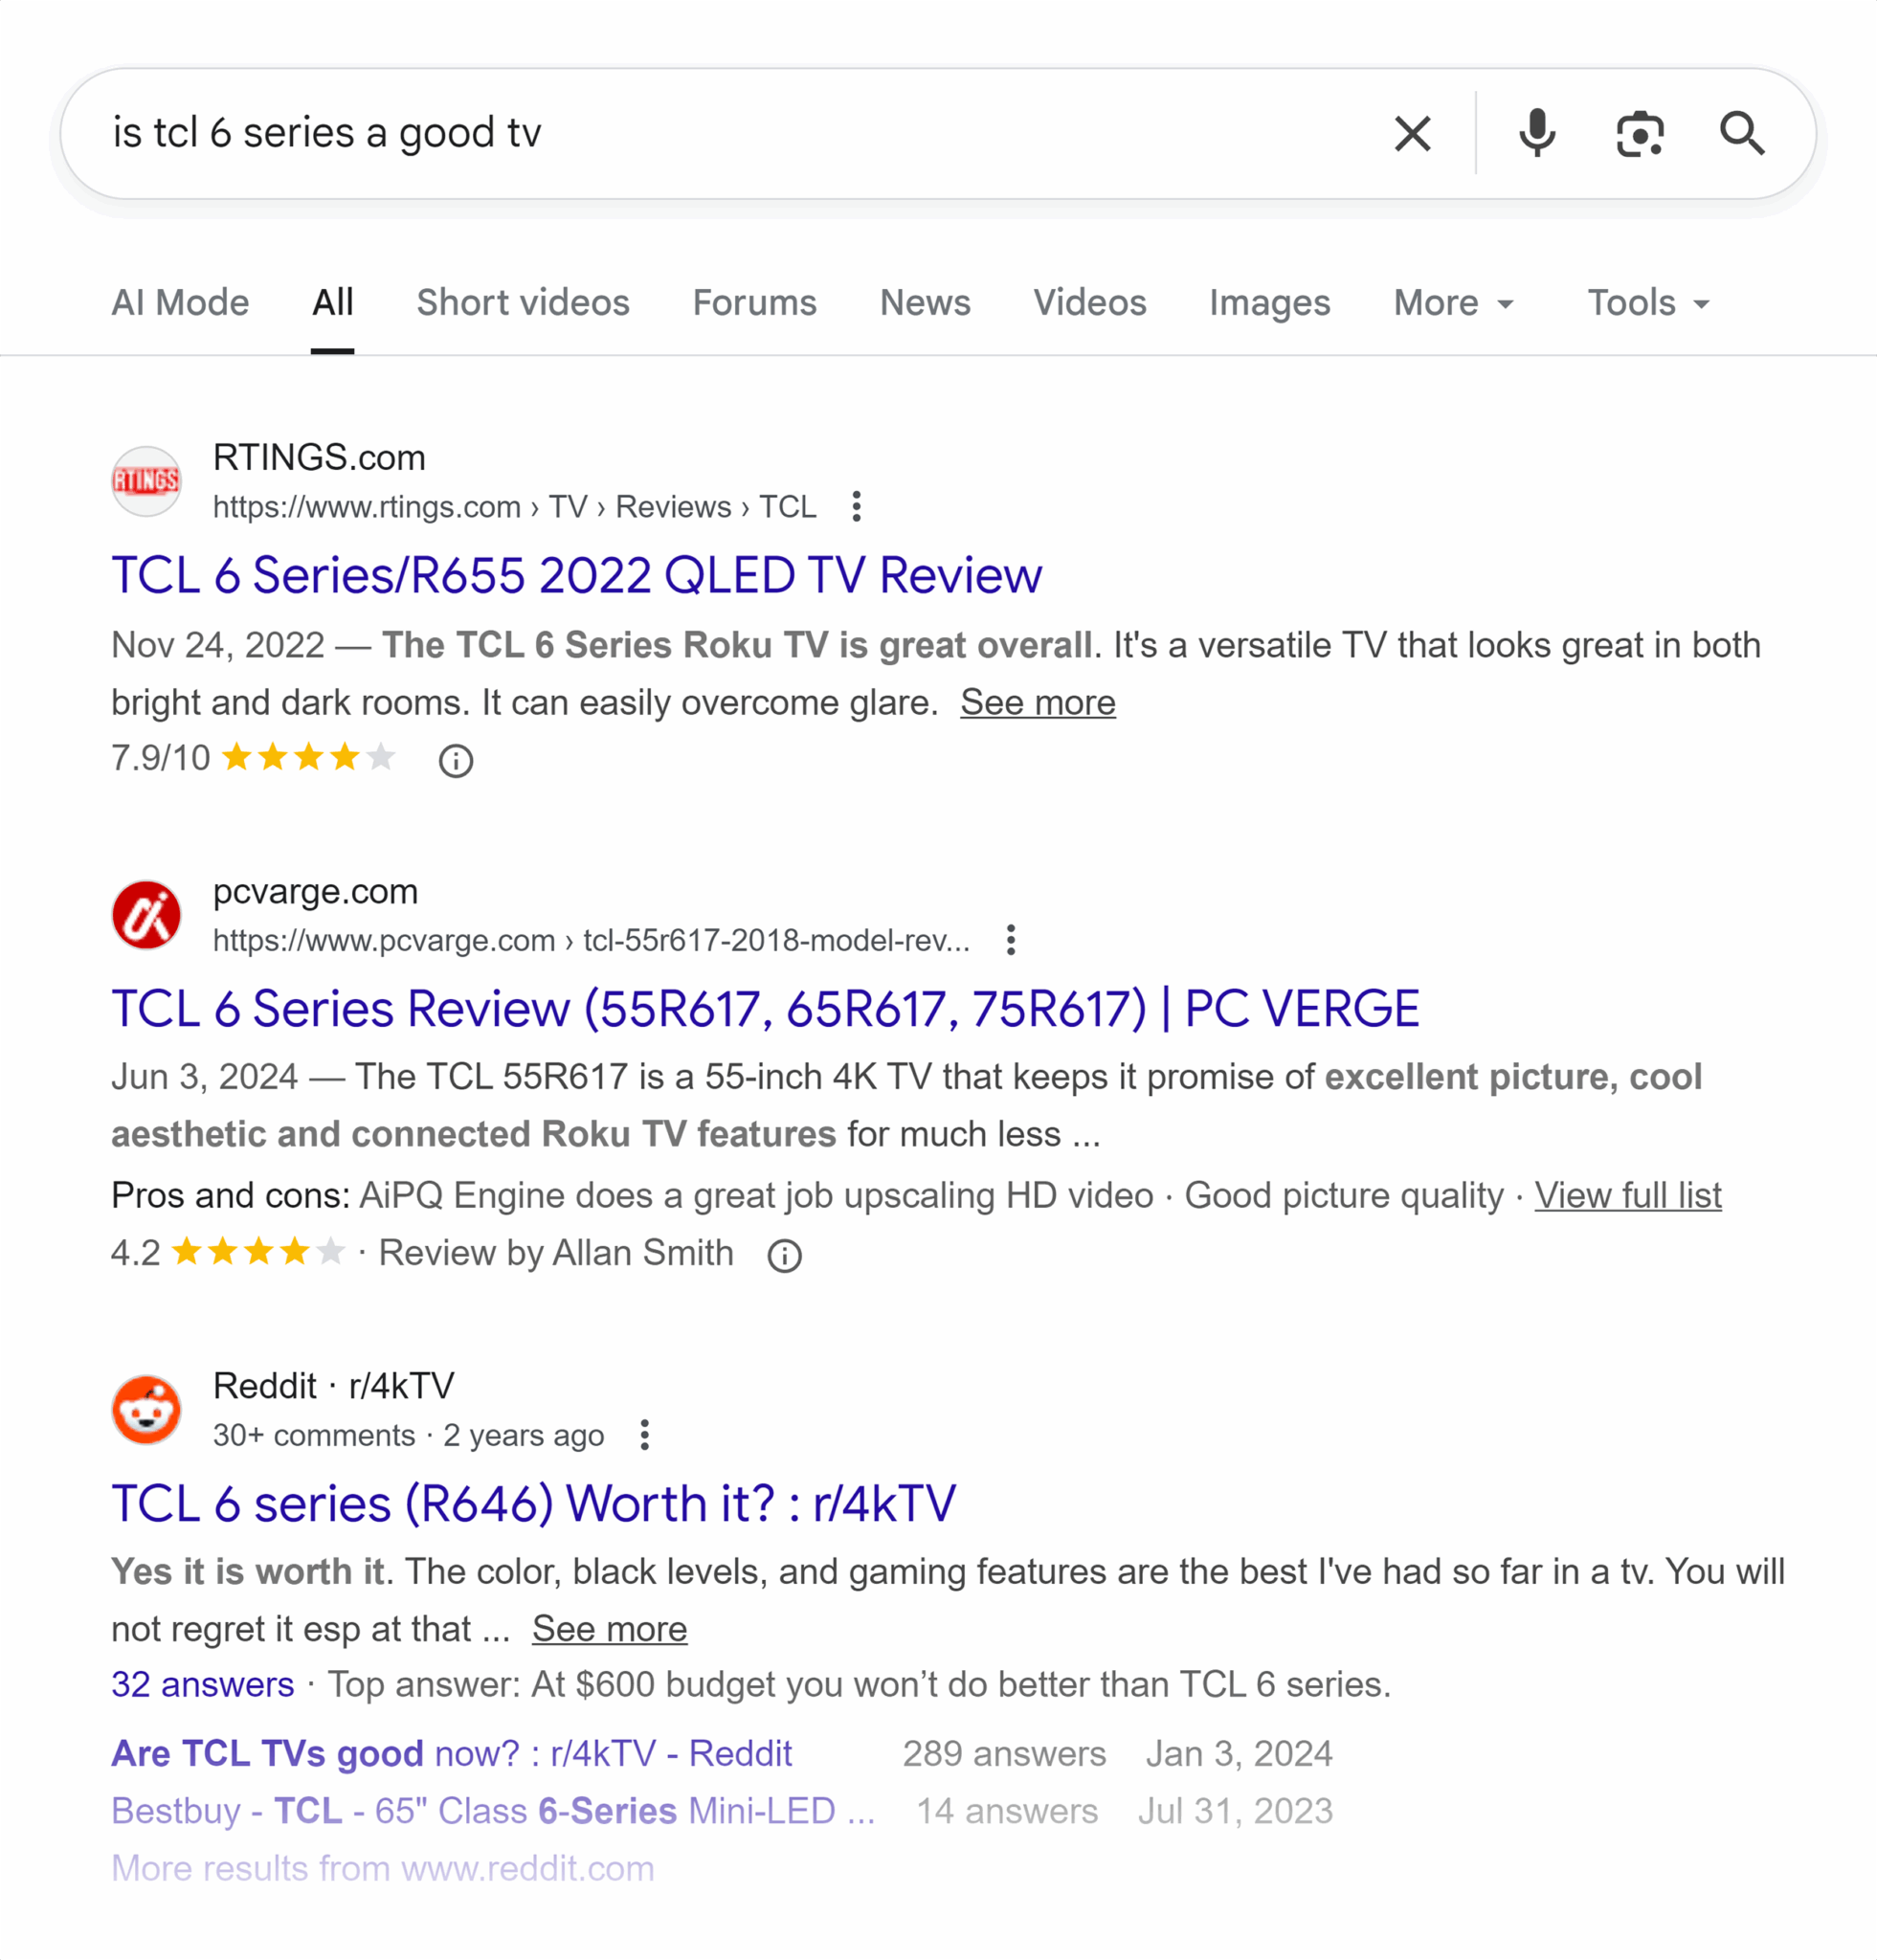
    ```json
{
  "alt": "Search results for 'is tcl 6 series a good tv' showing review snippets from RTINGS, PC Verge, and Reddit.",
  "caption": "Curious about the TCL 6 Series TV? Explore a compilation of expert reviews and user opinions from RTINGS, PC Verge, and Reddit.",
  "description": "This image displays Google search results for the query 'is tcl 6 series a good TV.' The results include snippets from RTINGS, PC Verge, and Reddit discussing the TCL 6 Series TV. The RTINGS review describes it as a great overall product, highlighting its versatility. PC Verge emphasizes the TV's excellent picture quality and Roku features, with a 4.2-star rating. Meanwhile, a Reddit thread discusses the TCL 6 Series model R646, with users praising its color and gaming features. This image provides a quick overview of expert and user assessments of the TCL 6 Series TV."
}
```

    Metrics and Approach to LLM Impact Measurement

    Uncovering the true value brought by LLM visibility metrics is a layered and comprehensive process. To do this accurately, I need to understand the wider ecosystem of my organization’s promotional efforts. This understanding allows me to determine the root cause of site traffic or branded searches effectively.

    ```json
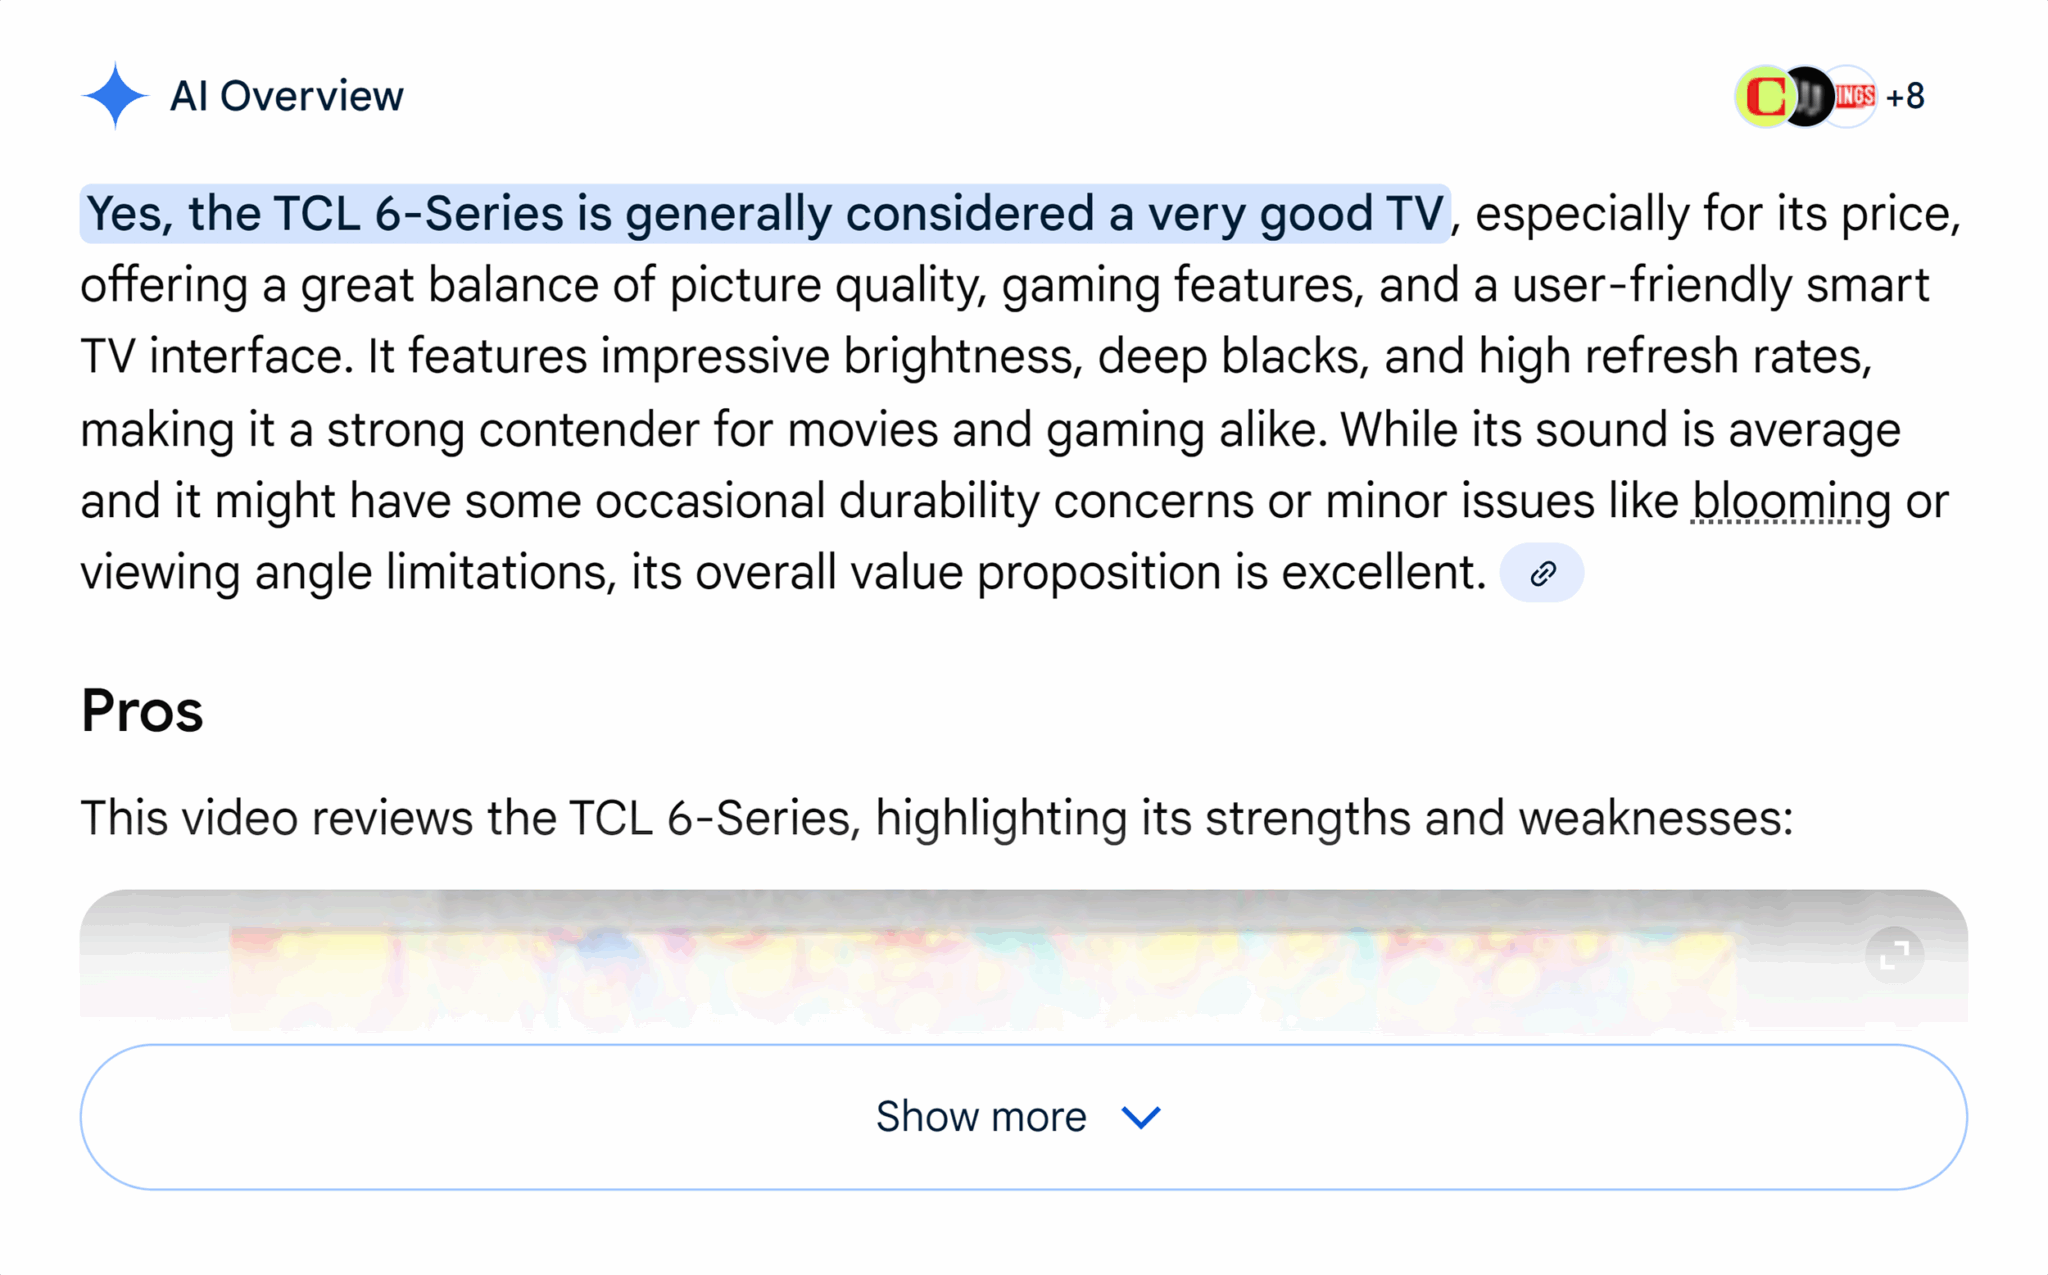
{
  "alt": "Text review of the TCL 6-Series TV highlighting its strengths and weaknesses.",
  "caption": "Discover why the TCL 6-Series TV is celebrated for its picture quality and gaming features, balancing affordability with performance.",
  "description": "This image features a text review of the TCL 6-Series TV, emphasizing its value for money with excellent picture quality, gaming features, and a smart TV interface. The text acknowledges minor issues like blooming and sound quality but highlights the TV’s competitive edge for movies and gaming. Keywords: TCL 6-Series, TV review, picture quality, gaming features, smart TV."
}
```

    For instance, if a TV ad campaign runs concurrently with optimizing for LLM mentions, analyzing their impact becomes essential. Only with complete awareness of such activities can I identify true causality or correlation.

    ```json
{
  "alt": "Line graph showing share of voice trends for Samsung, LG, and TCL over a span of one month.",
  "caption": "Explore the fluctuating share of voice for Samsung, LG, and TCL across a bustling month, revealing dynamic brand interactions.",
  "description": "This line graph displays the share of voice trends for three major brands: Samsung (blue), LG (yellow), and TCL (green), over a monthly period starting October 3rd to November 2nd. The graph showcases the daily variations in visibility and mentions for each brand, highlighting peaks and troughs in their market presence. Useful for tracking brand performance and consumer engagement over time."
}
```

    From here, I find that LLM visibility data is usually just the starting point. It’s unlike traditional SEO insights, which might be more apparent and direct. My task is to delve deeper, probing these data points to uncover richer insights.

    ```json
{
  "alt": "Visibility overview dashboard for buffalowildwings.com showing AI visibility score and audience data across multiple platforms.",
  "caption": "Explore the visibility insights of buffalowildwings.com with this detailed dashboard, highlighting AI visibility scores and audience metrics over time.",
  "description": "The image displays a visibility overview dashboard for buffalowildwings.com. It includes AI visibility scores, with a total score of 74 out of 100, labeled as medium. There are graphs indicating trends in total AI visibility, Chat GPT, AI Overview, and AI Mode from September to October 2025. The audience metrics show a monthly audience of 98.7 million, with an increase of 3.9 million, and mentions at 18.4K, which decreased by 390. The mention sources include Chat GPT, AI Overview, and AI Mode, with future integration of Gemini."
}
```

    The Branded Search of It All

    I’ve noticed that brand search provides exceptional insights into LLM performance, offering a rich vein of marketing intelligence. The comparison between two competing chicken wing chains, Buffalo Wild Wings and Wingstop, brightened this understanding for me. While their LLM citations differ, their brand awareness through social media presence offers a clearer picture of market positioning.

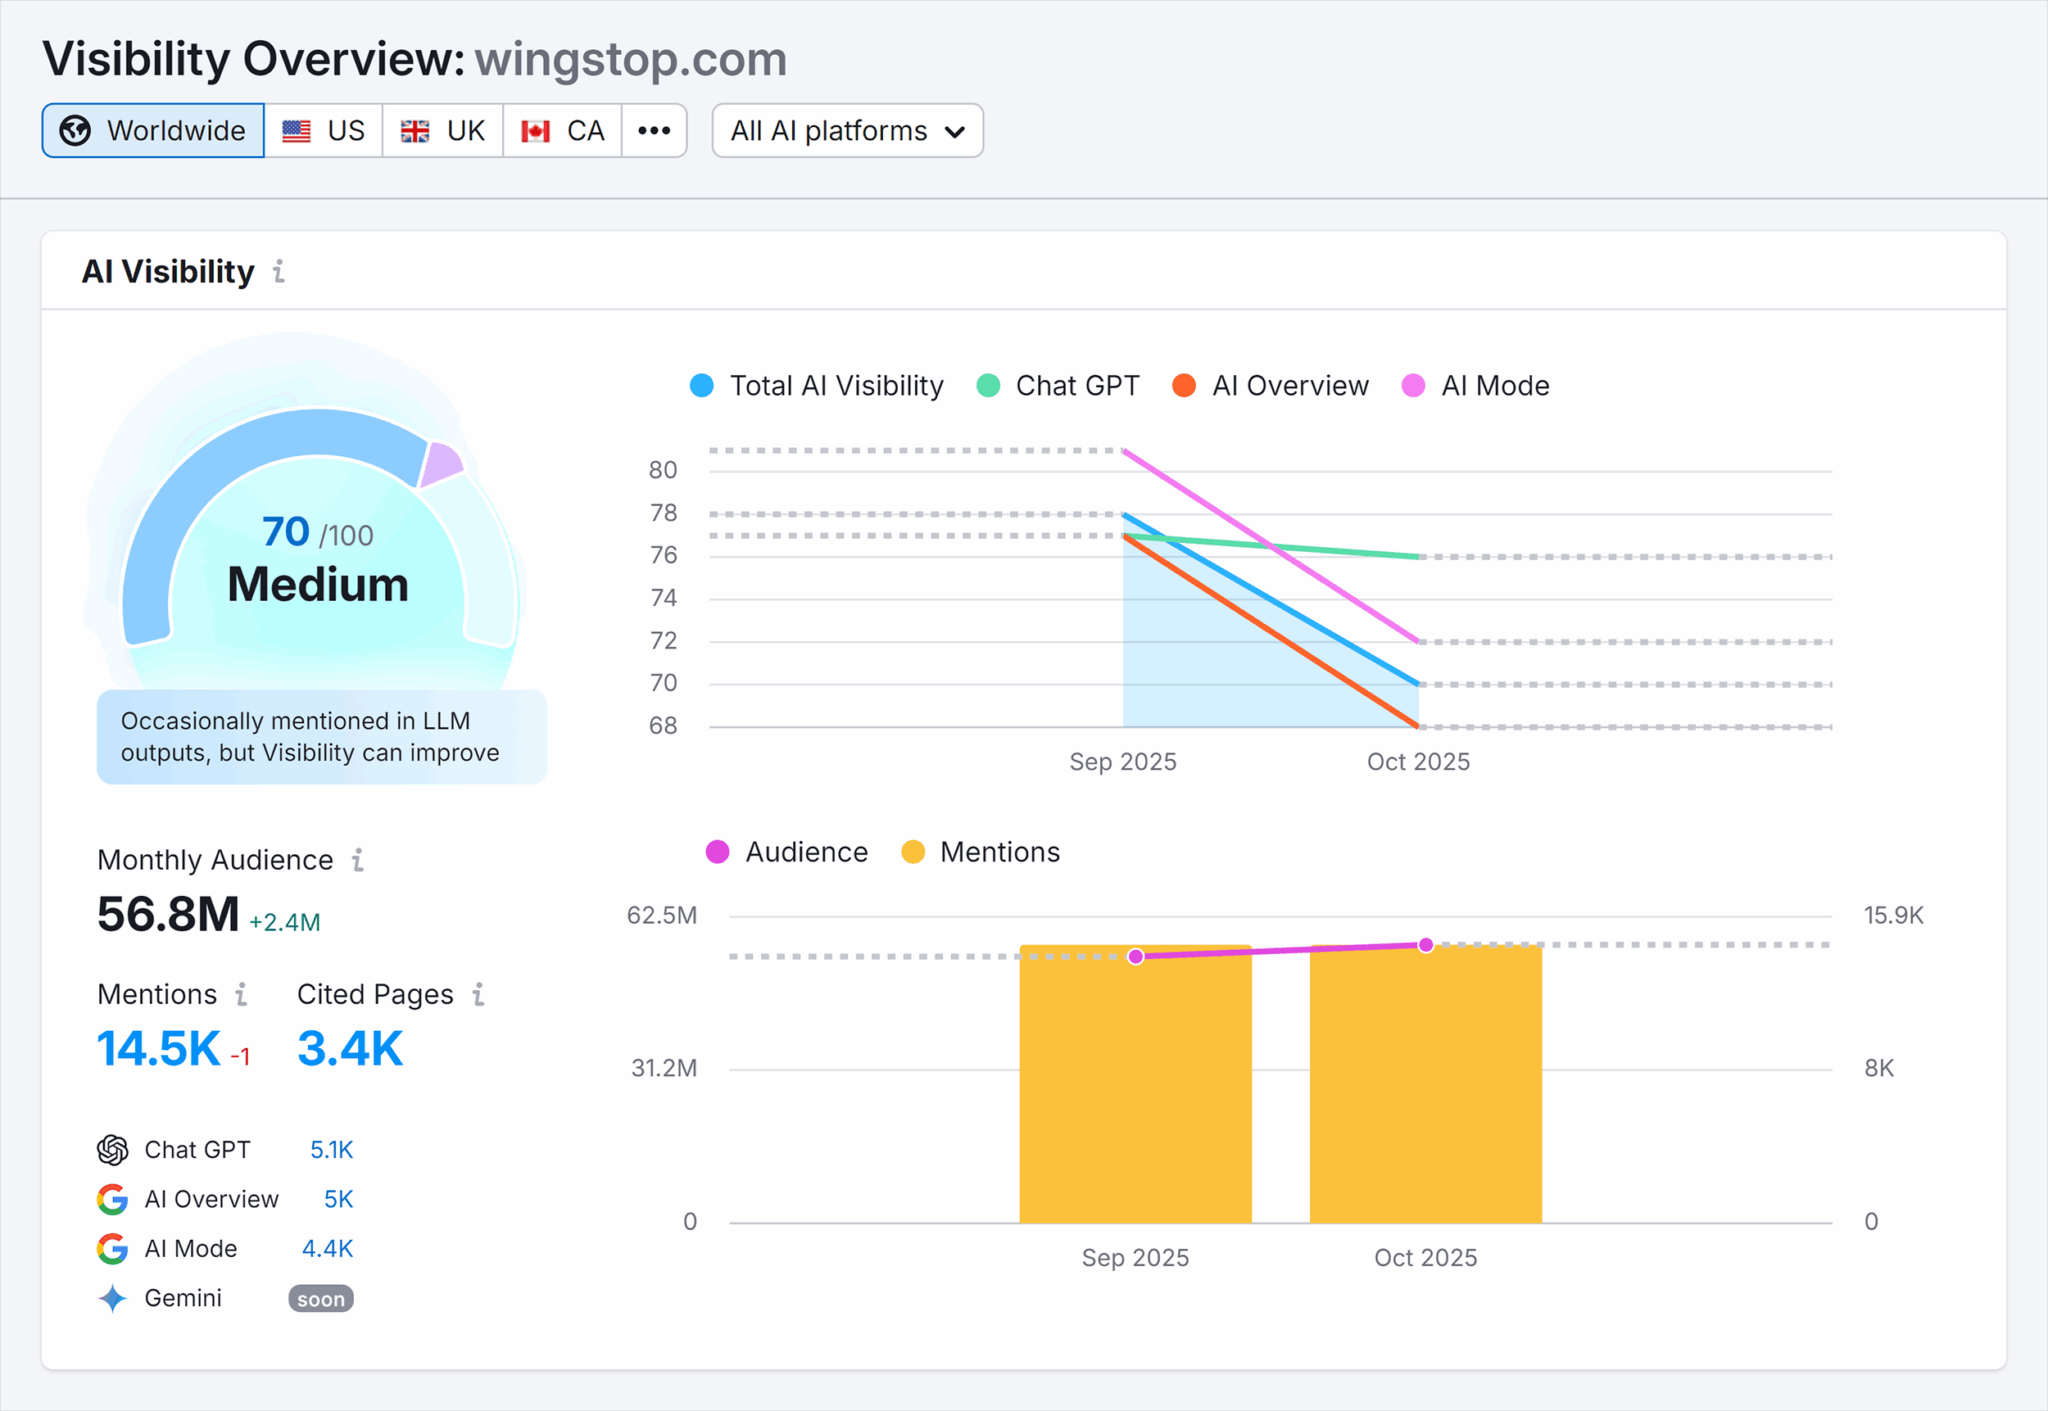
    ```json
{
  "alt": "AI visibility overview for wingstop.com showing medium AI visibility and audience metrics for Sep to Oct 2025.",
  "caption": "Wingstop.com is currently rated as having medium AI visibility with audiences engaging steadily through to October 2025.",
  "description": "This image displays an AI visibility overview for wingstop.com. It highlights a medium visibility score of 70/100, with key metrics such as monthly audience at 56.8M and mentions at 14.5K. The accompanying chart visualizes trends in audience and mentions from September to October 2025 across platforms like Chat GPT and AI Overview."
}
```

    Simply examining the branded search traffic showed me how both brands performed similarly on Google, despite their different social media followings. Here lies the heart of utilizing search data creatively to find LLM visibility data strategies.

    ```json
{
  "alt": "Instagram profiles of Wingstop and Buffalo Wild Wings with logos and follower counts.",
  "caption": "Wingstop and Buffalo Wild Wings go head-to-head on Instagram, showcasing their vibrant profiles and follower stats. Which wing will you pick?",
  "description": "This image displays the Instagram profiles of two popular restaurants, Wingstop and Buffalo Wild Wings. Wingstop's profile features a green logo, 772K followers, and promotes their 'Fiery Lime' flavor. Buffalo Wild Wings showcases a yellow logo with a bison, boasting 540K followers, and advertises their 'Pick 6 Meal For 2'. Both profiles include website links and number of posts and followings, emphasizing their presence on social media."
}
```

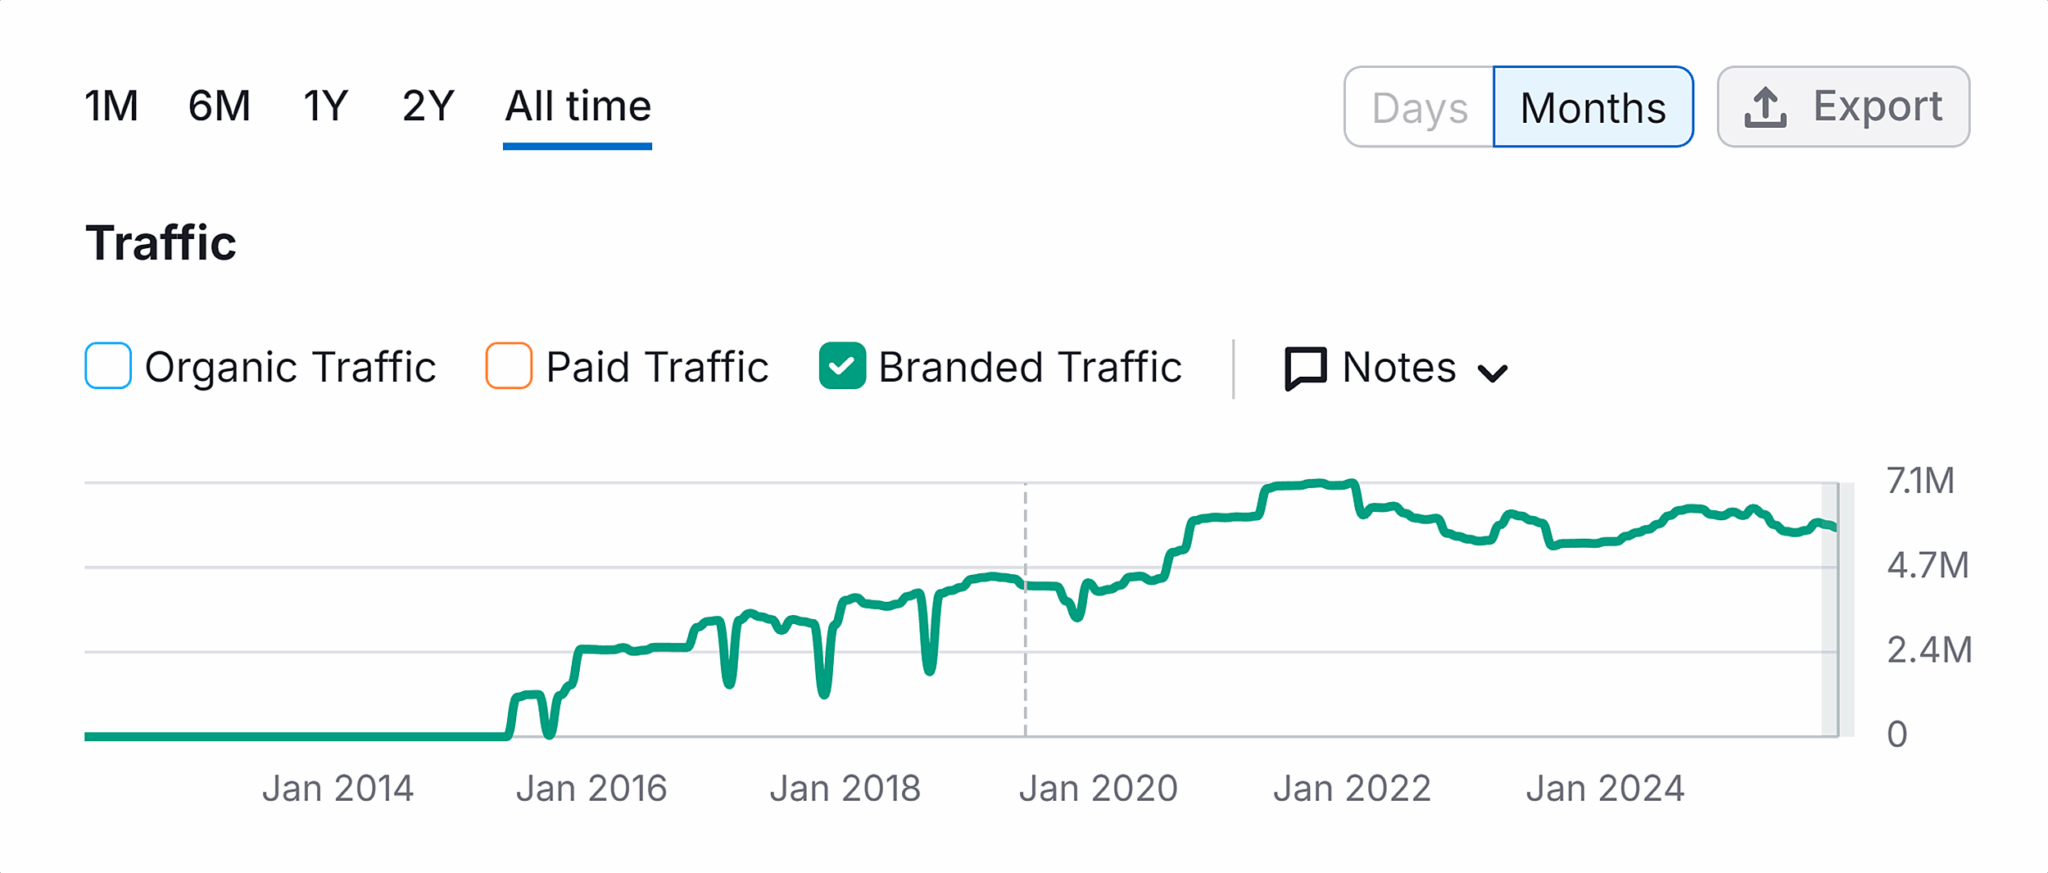
    Rather than merely counting traffic, I am now compelled to consider the number of branded keywords involved, providing a sometimes surprising view on brand awareness and diversity. This approach provides a richer understanding of LLM visibility’s impact.

    ```json
{
  "alt": "Graph showing branded traffic growth from 2014 to 2024.",
  "caption": "Branded traffic trends over a decade reveal growth patterns and fluctuations from 2014 to 2024.",
  "description": "This line graph illustrates the growth of branded traffic from 2014 to 2024. Displayed over a timeline, the data reveals significant upward trends with moments of fluctuation, particularly notable around 2018 and 2022. The graph uses a green line to represent branded traffic, with metrics ranging from 0 to 7.1 million. The interface includes options to view data in various time frames, including days and months, and features a menu for exporting the data."
}
```

    Direct Traffic: My Trusted LLM Data Companion

    I’ve come to see direct traffic as an essential part of my LLM data narrative. Far from being a black hole, direct traffic can often indicate brand awareness and affinity, especially when correlated with LLM visibility metrics. Understanding these correlations allows me to paint a clearer picture of AI’s practical impact on consumer behavior.

    ```json
{
  "alt": "Traffic chart showing branded traffic from January 2014 to January 2024 with steady growth and fluctuations.",
  "caption": "Charting Success: This graph illustrates the rise and fluctuations in branded traffic over a decade, painting a picture of strategic growth!",
  "description": "This image features a traffic chart depicting the growth of branded traffic from January 2014 to January 2024. The graph shows a green line that represents the number of visitors in millions, starting near zero in 2014 and rising to over 4.7 million by 2024. The data reflects a general upward trend with noticeable fluctuations, representing periodic changes in traffic levels. The chart includes options for viewing organic and paid traffic, and it is set to display monthly data over the entire period. Keywords: traffic chart, branded traffic, growth, analytics."
}
```

    For instance, if I compare LG and TCL, LG’s superior direct traffic and increasing momentum in LLM visibility suggest a tangible AI-driven influence, a possibility I must explore through multi-metric analysis.

    ```json
{
  "alt": "SEO dashboard for buffalowildwings.com showing keyword metrics and traffic data.",
  "caption": "Explore the SEO metrics of buffalowildwings.com, showcasing keyword rankings and traffic trends as of November 17, 2025.",
  "description": "The image displays an SEO research interface for buffalowildwings.com, focusing on positions and metrics. It highlights keyword usage of 360.2K with a 3.28% change, alongside traffic data of 5.7M visitors and a traffic cost of $886.4K. The dashboard offers a detailed view of SEO performance across different regions, including the US, Canada, and the UK, with device-specific metrics for desktop usage."
}
```

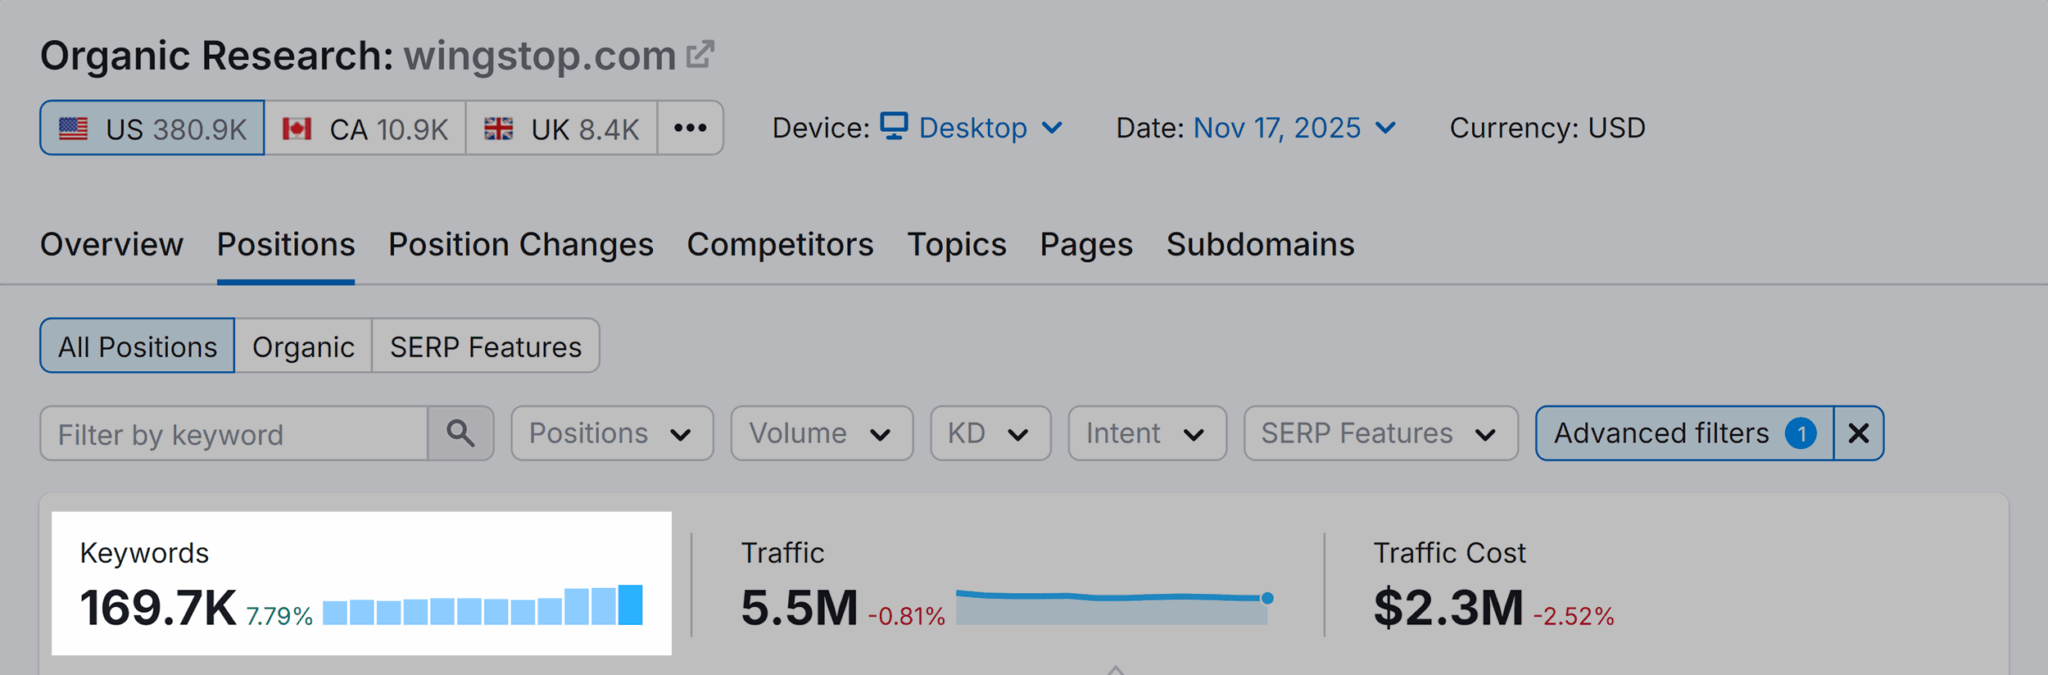
    Considering various metrics together and identifying shared trends offer insight into how LLM visibility might be affecting my brand’s overall recognition and engagement.

    ```json
{
  "alt": "Screenshot of organic research data for wingstop.com showing keyword statistics, traffic, and traffic cost.",
  "caption": "Explore Wingstop.com's robust organic search performance, showcasing a substantial keyword volume and valuable traffic data insights.",
  "description": "This image displays a screenshot from an SEO tool showing organic research data for wingstop.com. It highlights key metrics, including 169.7K keywords with a growth of 7.79%, 5.5M in traffic with a slight decrease of 0.81%, and a traffic cost of $2.3M, down 2.52%. The interface presents data for the US, Canada, and the UK, with options to filter results by keywords and positions. This detailed view assists in analyzing website performance and search engine visibility."
}
```

    Not Just One Metric: Stitching Together LLM Data Stories

    Ultimately, it’s about developing a comprehensive data story from LLM visibility insights. This story goes beyond direct KPIs, utilizing various data sources, such as bounce rates and organic traffic, to add depth and relevance to the narrative. Every piece of performance-focused data stands as testimony to the expertise we can bring to LLM visibility.

    ```json
{
  "alt": "Dashboard showing keyword, traffic, and cost metrics for 'sauce' with a traffic trend graph.",
  "caption": "Explore the SEO journey of 'sauce' with detailed keyword performance, traffic data, and cost analysis over the past year.",
  "description": "This image depicts an SEO dashboard for the keyword 'sauce,' showing 406 keywords with a 3.79% decrease, traffic at 10.4K with a slight 0.04% drop, and a traffic cost of $585 reflecting a 5.49% decrease. A traffic trend graph illustrates data over a year, highlighting fluctuations. Useful for SEO analysis and tracking keyword performance metrics."
}
```

    Total LLM visibility data, when creatively amalgamated with performance data, can transform insights into actionable strategies that align with pragmatic business objectives, showcasing our value in the AI-driven landscape.


    ```json
{
  "alt": "Traffic analytics chart showing keyword and traffic data for 'sauce'.",
  "caption": "Dive into the analytics! This chart reveals keyword dynamics and traffic trends for the term 'sauce' over the past year.",
  "description": "This image displays a traffic analytics dashboard for the keyword 'sauce', revealing data on keyword volume, traffic, and traffic costs. The chart shows an estimated traffic trend spanning a year from December to November, with metrics indicating a slight decline in keyword count and traffic cost, but an increase in total traffic. The interface includes advanced filter options and time range adjustments for detailed insights."
}
```

    Inspired by this post on Search Engine Land.


    crushpress.ai community screenshot