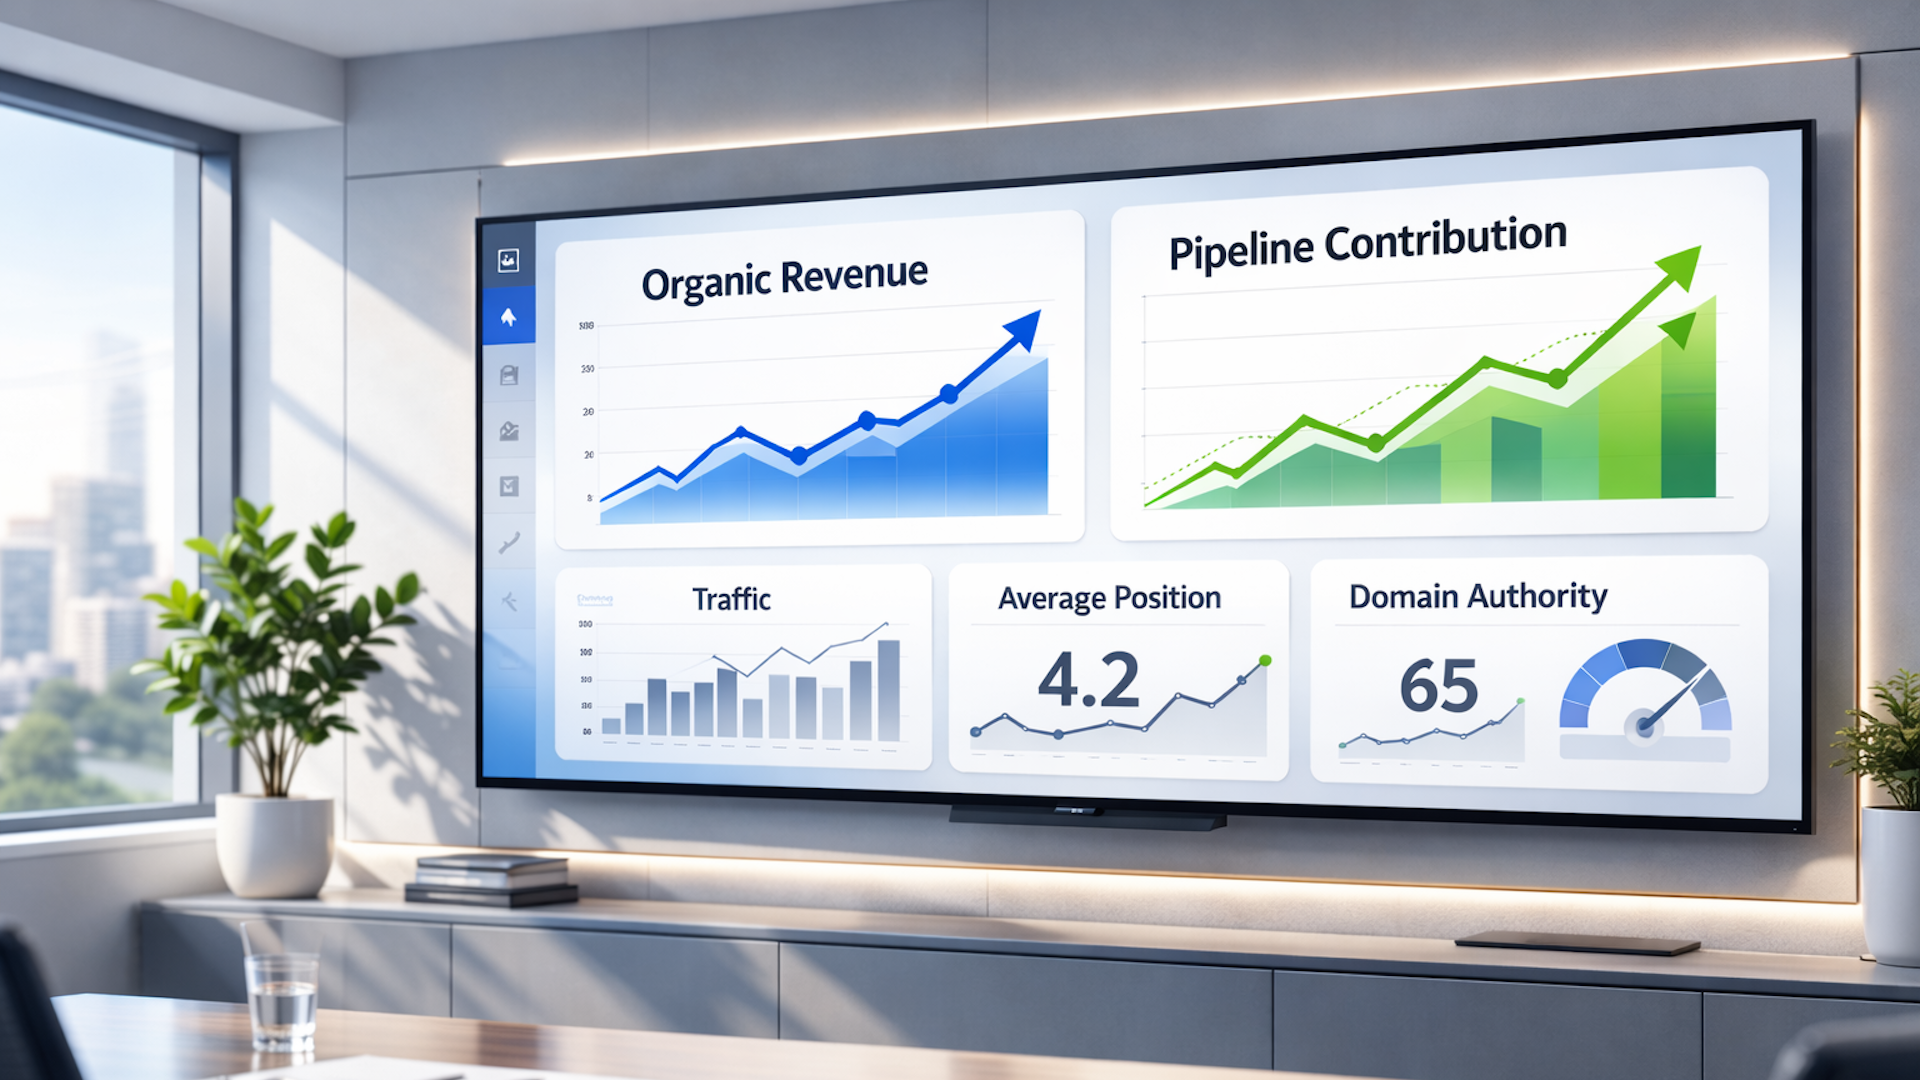
Tag: Google Search Console

  • Retire These SEO Metrics to Supercharge Your 2026 Strategy

    Retire These SEO Metrics to Supercharge Your 2026 Strategy

    I’ve realized that many of us, myself included, might be tracking the wrong SEO metrics lately. We need to shake things up, especially with 2026 approaching.

    Picture this: I present an impressive chart depicting a 47% increase in site traffic. But instead of excitement, I’m met with puzzled looks from the CMO, wondering why revenue remains stagnant. Or, I celebrate a top-three ranking for a keyword nobody searches for.

    The SEO metrics that boosted my confidence back in 2019 might just be steering me wrong in 2026. With AI Overviews taking over search results and zero-click searches becoming the new standard, clinging to outdated metrics might jeopardize my strategy and budget.

    I’m ready to take you through the precise metrics that our SEO team should retire and which new, revenue-focused metrics to prioritize instead.

    Traffic Metrics

    1. Organic Traffic

    Organic traffic has been my go-to KPI in SEO reports ever since I started. But relying solely on it doesn’t provide enough context.

    Not all traffic is equally valuable. A thousand visitors who bounce instantly are not beneficial. However, a hundred visitors converting at an 8% rate? That’s a success story.

    I witnessed a local HVAC company whose traffic dropped by 22%, year on year. Panic, right? Yet, organic revenue increased by 31%. We focused on enriching high-intent service pages, pruning low-intent content. Fewer visitors, but better ones.

    Before panicking over traffic drops, I always reassess where traffic is declining. If losses involve informational articles and customer login pages, it’s not a revenue issue. That’s just noise exiting my dashboard.

    2. Total Impressions Without Intent Segmentation 

    This metric can mislead. A million impressions from merely informational queries like “what is SEO” might build some awareness, but they contribute zero revenue. Meanwhile, ten thousand impressions from business-driven queries like “best enterprise SEO agency” could significantly boost my pipeline.

    Google Search Console offers this data, but many teams, myself included, often fail to segment it intelligently.

    3. Traffic Growth Without Revenue Correlation

    This is a risky trap for SEO teams. Bringing a 35% increase in organic traffic to a quarterly review sounds impressive, right until the CFO asks, “And how does this translate to revenue?” If I can’t answer that, I’m just reporting noise.

    Ranking Metrics

    4. Average Keyword Position 

    This metric might look compelling in a dashboard, but it doesn’t hold up under scrutiny. If I rank first for a keyword with ten monthly searches and fiftieth for one with 50,000, my average position might seem okay, but I’m losing where it matters most. 

    The average position treats all keywords as identical when they aren’t. With personalized search results, an “average position” can vary greatly by user and location.

    5. Isolated Keyword Tracking

    Searchers these days don’t typically use isolated keywords. They pose questions, explore themes, and adjust their queries. Google’s focus has shifted toward semantic search and topic modeling.

    Tracking a solitary keyword like “lawyer” is pointless without understanding intent — are searchers interested in criminal defense, divorce services, or merely looking up what lawyers do?

    6. Share of Top 10 Rankings 

    This metric sounds clever until it’s clear that 80% of my top-10 rankings might involve low-intent, low-volume queries. Meanwhile, competitors claim the top-three spots for crucial commercial queries in my niche.

    Achieving a No. 1 ranking for a high-converting transactional keyword is more valuable than holding 50 top-10 positions for low-value informational queries.

    Authority and Engagement Metrics

    7. Domain Authority and Domain Rating 

    DA and DR might not align with Google’s metrics. They’re proprietary scores from SEO tool companies. Yet, teams often set misguided goals like boosting DA from 42 to 50 by Q3. 

    It’s possible for a competitor with a DA of 35 to outperform my DA of 65 if their content aligns better with search intent. So, let’s keep these out of executive dashboards.

    I’ve seen how backlink volume is often overrated. Google’s algorithm prioritizes link quality, relevance, and context over sheer volume.

    A single link from a high-quality, relevant site outweighs hundreds of low-grade directory links. I’ve seen sites with 100,000+ backlinks struggle to rank for meaningful terms because most links lacked quality.

    9. Bounce Rate 

    I’ve found bounce rate misunderstood for years. If someone searches for my company’s business hours, finds them on the contact page, and leaves, that’s a success with a 100% bounce rate.

    Google replaced bounce rate with “engagement rate” in GA4 for a reason. Similarly, session duration and pages per session need context. A high pages-per-session score on my pricing page may indicate confusion, not engagement. 

    Why These SEO Metrics Are Failing Now

    ```json
{
  "alt": "The CapmatchOne logo with a gradient circle and bold text.",
  "caption": "Discover innovation with the CapmatchOne logo, featuring sleek typography and a modern gradient circle.",
  "description": "The CapmatchOne logo features bold, modern typography coupled with a gradient circle, symbolizing connection and innovation. The sleek design conveys a sense of progress and creativity. This image can be used for branding or promotional purposes, appealing to audiences interested in innovative solutions and forward-thinking designs."
}
```

    I’ve noticed the search landscape shifting quite a bit. Up to 58.5% of U.S. and 59.7% of EU Google searches now conclude without a click, as per SparkToro’s zero-click study. This means, for every 1,000 searches, only 360 result in a visit to a site.

    AI technologies are capturing and synthesizing information, bypassing the need for a click. My content can gain visibility and influence without contributing to sessions in Google Analytics.

    • Wynter’s latest B2B buyer research indicates nearly 24% of CMOs now utilize AI tools like ChatGPT for research, a significant rise from last year.

    Buyers discover brands via AI tools and use Google to validate those discoveries. This alters my SEO focus from merely driving traffic to ensuring my brand is visible during pivotal decision-making stages.

    Modern customer journeys can be erratic. Often, users who initially find us through organic search might return through paid ads or direct links. If we use last-click attribution, the true value of SEO is obscured, although this organic start was critical for conversion.

    Dig deeper: Measuring zero-click search: Visibility-first SEO for AI results

    What to Measure Instead

    Revenue and Pipeline Contribution From Organic 

    For ecommerce, I aim to track revenue from organic sessions by product category and landing pages. For lead-generation, I’ll track how many leads convert to customers. Integrating with a CRM helps in connecting those dots.

    No one’s interested in your DA if you can demonstrate $1.2 million in revenue attributed to organic channels.

    Conversion-weighted Visibility 

    I’ll focus on visibility for high-value terms that lead to conversions.

    A franchise client noticed they dominated low-intent queries but were invisible for crucial local terms. We adjusted priorities, and their qualified leads doubled in four months.

    Topic Cluster Performance 

    This metric supersedes individual keyword rankings. Monitoring how I rank across full topic clusters, and the aggregate visibility and conversions from these clusters, gives a comprehensive view of topic authority.

    SERP Real Estate Ownership 

    By gauging control over the entirety of search pages, not just listings, including snippets and local packs, I can effectively keep competitors at bay for crucial queries.

    AI Platform Visibility and Brand Mentions

    My focus will also be on how frequently my brand is mentioned in AI responses. Mentions are becoming as crucial as click-through rates.

    For instance, if I secure a favorable recommendation rate across multiple AI platforms for vital topics, it’s a win, even if website traffic appears unchanged.

    While tools are emerging to monitor this, manual spot checks can reveal valuable insights, enhancing authority and awareness, eventually leading to brand searches and conversions.

    Branded Search and Direct Traffic as AI Visibility Proxies

    I notice when buyers find out about my brand through zero-click searches, they often search the brand name directly instead of clicking through. This reflects in my branded and direct traffic rather than organic metrics.

    If I see no change in nonbranded organic traffic but an increase in branded search and direct visits, it usually indicates that my content gains attention in AI Overviews.

    How to Transition My Reporting

    Revamping reporting around new metrics might feel daunting. Stakeholders are comfortable with old metrics.

    I start by evaluating my current dashboard, ensuring relevant metrics face business outcomes directly rather than just tallying activities.

    Transition by gradually omitting vanity metrics. If organic traffic was my focal KPI, I now introduce it segmented by intent and accompany it with organic-attributed revenue. Gradually, I pivot focus and phase out the dated metrics.

    When I introduce new metrics, I frame them in relatable terms. Avoid using “conversion-weighted visibility.” Opt for “visibility metrics for top-converting terms.”

    The Metrics That Prove SEO’s Value

    The metrics we’ve relied upon — organic traffic, average keyword position, domain authority, bounce rate — aren’t inherently harmful. They’re just incomplete, providing a potentially false sense of security while others prioritize revenue-generating metrics.

    Newly adopted metrics — revenue contributions, conversion-oriented visibility, topic authority, SERP dominance, AI platform mentions — directly relate SEO to tangible business outcomes. They prove ROI, justify budgets, and align strategies with business growth.

    Consider which metrics in your dashboard lend false impressions of activity over effectiveness. Retire them. Replace them.

    Ultimately, no one’s concerned with traffic numbers or DA scores. They want to know if SEO drives growth. Make sure your metrics affirm it.


    Inspired by this post on Search Engine Land.


    crushpress.ai community screenshot
  • Unlock the Power of AI: New Google Search Console Features

    Unlock the Power of AI: New Google Search Console Features

    Recently, I discovered that Google’s AI-powered configuration tool for the Search Console is available to everyone, and it’s been quite an exciting update! This tool allows us to interact with the performance reports by asking AI-driven questions and receiving detailed insights in return.

    I found out about this rollout on LinkedIn where Google enthusiastically announced, “The Search Console’s new AI-powered configuration is now available to everyone!” This means we can all experience this amazing functionality firsthand.

    AI-Powered Configuration: With this tool, I can describe the type of analysis I want in plain language. Google’s AI then converts my inputs into specific filters and settings, creating a customized report immediately.

    ```json
{
  "alt": "Performance dashboard showing 2.14K total clicks and 250K total impressions over three months with a line graph.",
  "caption": "Discover insights from your performance dashboard with 2.14K clicks and 250K impressions. Visualize trends over the last three months with this engaging line graph.",
  "description": "This performance dashboard displays web metrics over the last three months, highlighting 2.14K total clicks and 250K total impressions. A dynamic line graph shows click and impression trends, with options for daily reports. A feature for customizing reports using AI is suggested. Useful for analyzing web performance and optimizing strategies."
}
```

    Rolling Out Now: When I logged into my Search Console account and checked the performance report, a new note caught my eye: “New! Customize your Performance report using AI.” By clicking on it, I gained access to this innovative AI tool.

    More Details: This AI-powered configuration is designed to simplify our analysis by managing three key tasks: selecting metrics, applying filters, and configuring comparisons.

    ```json
{
  "alt": "Web analytics dashboard showing clicks, impressions, CTR, and position over three months.",
  "caption": "Discover insights with a detailed web analytics dashboard displaying key metrics like clicks, impressions, and CTR over a three-month period.",
  "description": "This web analytics dashboard provides a visual representation of data over a three-month period, showing total clicks (2.14K), impressions (250K), average CTR (0.9%), and average position (16). The line graph illustrates trends in clicks and impressions over time, with filters for different date ranges and search types. An AI-powered configuration tool for customized data views is available, along with example prompts for user guidance. Keywords: web analytics, dashboard, clicks, impressions, data visualization."
}
```

    • Selecting Metrics: I can choose from metrics like Clicks, Impressions, Average CTR, and Average Position based on my queries.
    • Applying Filters: This allows me to refine data by various parameters such as query, page, country, device, or date.
    • Configuring Comparisons: I can establish intricate comparisons, like custom date ranges, without manual configuration.

    Why We Care: While currently limited to the Performance report for Search results, I’m excited to see how AI might soon enhance reports for Discover and News. Even though the AI might not always provide perfect answers, exploring its potential has been an enlightening experience, sparking new ideas.

    So, why not give it a try yourself?


    Inspired by this post on Search Engine Land.


    crushpress.ai community screenshot
  • Understanding Googlebot’s Crawling File Limits Explained

    Understanding Googlebot’s Crawling File Limits Explained

    I recently discovered some updates that Google made to its help documents, clarifying the file limits for Googlebot’s crawling abilities. They shared insights about how much data Googlebot can process for different file types.

    In these updates, Google specified the limits for crawling by file type, some of which continue from previous guidelines and aren’t entirely new. These updates cover:

    15MB for web pages: According to Google, by default, their crawlers only process the first 15MB of a file. This means any content beyond that limit gets ignored.

    64MB for PDF files: When it comes to PDFs, Googlebot has a larger limit, crawling up to the first 64MB. This applies when Googlebot indexes PDFs in Google Search.

    2MB for supported file types: Googlebot processes the first 2MB of other supported file types, along with the 64MB limit for PDFs.

    Rest assured, these limits are pretty generous, meaning most websites won’t be affected or even reach these thresholds.

    Google’s documentation explains, “By default, Google’s crawlers only process the first 15MB of a file. Individual projects may have different limits, and they might differentiate between file types, providing larger limits for PDFs compared to HTML.”

    Furthermore, the data beyond the specified limit doesn’t get indexed as Googlebot halts the fetch after the limit is reached. This applies to all resources referenced in the HTML, like CSS and JavaScript, except PDFs.

    Why should we care? Knowing these limits can enhance your website’s SEO strategy, even though most won’t come close to these limits. Still, it’s vital to be aware of the boundaries set for Googlebot’s crawling.


    Inspired by this post on Search Engine Land.


    crushpress.ai community screenshot
  • Google Searches: Same URL Counts as One Impression

    Google Searches: Same URL Counts as One Impression

    Recently, I’ve been delving into the nuances of Google Search Console and its impression counts.

    I learned from John Mueller of Google that when a URL shows up in both an AI Overview and the traditional blue links on SERPs, it is counted as just one impression, not two.

    This clarification came to light through John Mueller, after a lively discussion among SEO experts, sparked by Jamie Indigo and publicly shared by Mark Williams-Cook from Candour on LinkedIn.

    The background. Initially, Mark Williams-Cook had assumed that because of historical practices with SERP features like tweet boxes, the URL might be counted twice.

    Testing this theory was challenging, but ultimately, Mueller confirmed that the Search Console treats these appearances as a single impression.

    What’s happening. Google’s policy treats an AI Overview as a singular position in search results. Each link within the Overview shares that position, governed by standard impression rules.

    So, when a URL appears more than once in the same search experience, the Search Console doesn’t double count these for the same query.

    Why this happens. Google defines an impression based on a user’s visibility of a link within the current set of results. Multiple instances of the same URL on one results page are aggregated, not counted separately.

    This approach aligns with other SERP features like knowledge panels, where scrolling past and returning, or seeing the URL in different elements, won’t create additional impressions.

    Why we care. In this AI-centric era, interpreting performance metrics can be a challenge. Knowing that both AI Overviews and blue links count as a single impression clarifies how these listings influence visibility. Although the impression count doesn’t rise, appearing in both strengthens brand visibility and boosts credibility among Google users.


    Inspired by this post on Search Engine Land.


    crushpress.ai community screenshot
  • Master Canonicalization with Google’s JavaScript SEO Update

    Master Canonicalization with Google’s JavaScript SEO Update

    Earlier this week, I noticed Google made another tweak to its JavaScript SEO best practices document. This time, they focused on clarifying canonicalization best practices. In essence, Google suggests that setting the canonical URL to match the URL in the original HTML is crucial. If that’s not possible, it’s better to leave the canonical URL out of the HTML altogether.

    Google’s New Additions. Google introduced a fresh section that explains:

    “The rel=‘canonical’ link tag helps Google identify a page’s canonical version. While you can use JavaScript for this, it shouldn’t alter the canonical URL from what’s set in the original HTML. Ideally, use HTML to set it, but if JavaScript is necessary, ensure the JavaScript sets it identically to the HTML. If HTML isn’t an option, use JavaScript and omit the canonical URL in the HTML.”

    Understanding Google’s Stance on Noindex. They also issued a warning earlier regarding noindex tags—advising not to use them in the original page code if you want the page indexed.

    Why This Matters to Me. If I rely on JavaScript for setting canonical links, Google’s advice is to verify its recognition through the Google Search Console’s URL Inspection tool. It’s a great reminder to review these updated best practices, especially if JavaScript plays a crucial role on my site.


    Inspired by this post on Search Engine Land.


    crushpress.ai community screenshot
  • Google Search Console Performance Reports: Delay Resolved

    Google Search Console Performance Reports: Delay Resolved

    Screenshot of Google Search Console

    After enduring weeks of delays, I’m relieved to see that the performance reports in Google Search Console are finally back to normal. These reports had been set back by over 50 hours, creating quite the challenge for anyone relying on timely data.

    Latest Status: If you access the search performance report now, you’ll notice the data delay is significantly reduced to just 2 to 6 hours, which is fairly typical. Compare this to the over 70-hour delays we experienced recently!

    This is exactly what I observe:

    The delays started a few weeks back and it took about three weeks for Google to resolve the issue, clearing the backlog in the process.

    ```json
{
  "alt": "Interface features including icons for help, account settings, notifications, apps, and export option.",
  "caption": "Navigate with ease using intuitive icons for help, account settings, notifications, and more. Export your data seamlessly with up-to-date features.",
  "description": "This image showcases a user interface section with various icons, including a question mark for help, a user icon for account settings, a bell for notifications, and a grid for app access. An export option is available, highlighting recent updates with a timestamp indicating the last update was 2.5 hours ago. These features are part of a streamlined access panel designed for user convenience."
}
```

    Page Indexing Update: Unfortunately, the page indexing report delay we mentioned earlier is still not resolved. It’s frustrating to note that this delay has stretched to nearly a month, with Google acknowledging the issue in a notice:

    “Due to internal issues, this report has not been updated to reflect recent data”

    Why This Matters: If you depend on Search Console for analytics and reporting to clients, these delays can be incredibly frustrating. While it’s a relief that performance reports are up-to-date, the ongoing delay in the indexing report can still disrupt reporting processes.

    Meanwhile, Google has rolled out several exciting new features recently, including:


    Inspired by this post on Search Engine Land.


    crushpress.ai community screenshot
  • Unlock Insight with Google Search Console’s New Reports

    Unlock Insight with Google Search Console’s New Reports

    I’m thrilled about the latest update from Google Search Console, which now offers both weekly and monthly views in their performance reports. This change allows me to dive deeper into the data, providing a more detailed analysis beyond the usual 24-hour view.

    What it looks like. At the recent Google Search Central event in Zurich, I snapped some photos of the announcement. It was a fantastic experience to see these changes unveiled in real-time.

    ```json
{
  "alt": "Presenter on stage with a large screen displaying 'Weekly and Monthly Views' at a Google event.",
  "caption": "On stage at a Google event, a presenter delivers key insights about 'Weekly and Monthly Views' to an engaged audience.",
  "description": "This image captures a presenter speaking at a Google event. The stage features a large screen with the text 'Weekly and Monthly Views,' emphasizing a new update. The setting is a modern auditorium with colorful lighting and a Google-branded podium, indicating a professional tech environment. This scene highlights a focus on new features or metrics relevant to Google's audience, suitable for discussions on data analysis, business insights, and innovation."
}
```

    Why we care. These updates, though small, are invaluable for SEOs, publishers, and site owners like me. The granular data now available helps me investigate changes in performance more effectively, whether it’s over a specific month, week, or day.

    ```json
{
  "alt": "Presenter explaining the Time Granularity Selector feature on stage at a Google event.",
  "caption": "A speaker at a Google event introduces the Time Granularity Selector, a tool for data aggregation, with a dynamic presentation.",
  "description": "The image captures a speaker at a Google event explaining the Time Granularity Selector feature, which allows users to view data aggregated by weeks or months. The stage is set with a colorful backdrop, and the presenter stands next to a podium with the Google logo, holding a clicker. The large screen displays a visual representation of the feature. This presentation highlights Google's focus on data management solutions."
}
```

    Inspired by this post on Search Engine Land.

    crushpress.ai community screenshot
  • Unleashing AI in Google Search Console for Dynamic Reporting

    Unleashing AI in Google Search Console for Dynamic Reporting

    Imagine being able to simply type what data you want in a report, and, voilà, Google creates it for you on the spot. That’s exactly what’s happening with Google’s new experimental feature in Search Console!

    Recently, I learned about Google’s exciting “AI-powered configuration” update within the Search Console Performance report. This experimental feature allows you to request a specific report, and Google will instantly configure it for you. Not everyone can access it just yet, but it’s definitely something to keep an eye on.

    I immediately thought of the AI-powered advisors Google offers for Ads and Analytics. Now, similar technology is being harnessed for Search Console. According to Google, this AI-powered configuration lets you describe the analysis you want in everyday language. Your description is then transformed into appropriate filters and settings, configuring the report instantly!

    Curious about how it looks? There’s a GIF demonstration that perfectly showcases how it generates reports based on your questions, making the process seem almost magical.

    The cool part is that this feature streamlines your analysis by handling several key elements. First, it automatically selects metrics like Clicks, Impressions, Average CTR, and Average Position based on your query.

    It also applies filters to narrow down data by different factors such as query, page, country, device, search appearance, or date range. Additionally, you can set up complex comparisons without having to fiddle with manual setup.

    ```json
{
  "alt": "Graphical data report showing impressions, CTR, and average position over three months.",
  "caption": "Explore your engagement data with this interactive report showcasing impressions, CTR, and average position trends over the past three months.",
  "description": "This image features a data report interface displaying key metrics such as 1 million impressions, a 0.2% click-through rate (CTR), and an average position of 16.9 over a three-month period. The graphical line chart illustrates fluctuations in impressions, visualized in purple and blue lines against a white grid. Additional data tabs show countries, devices, and search appearance metrics. This analysis tool is ideal for tracking digital marketing performance and engagement patterns."
}
```

    Although the rollout is currently slow, Google plans to expand this feature over time. But, being early days, the feature does have some limitations. It’s solely meant for configuration tasks and doesn’t perform actions like sorting tables or exporting data.

    The feature currently only supports the Performance report for Search results and isn’t available for Discover or News reports. Also, since the AI might occasionally misinterpret requests, I recommend reviewing the suggested filters to make sure they align with your needs before diving into data analysis.

    Honestly, I’m excited about this tool because it could potentially unveil insights in reports that were otherwise challenging to discover using standard filters. While most of us still need to wait for this feature to be accessible, it’s worth a try once available to explore new data insights.

    If you’re looking for more information, head over to the Google help documentation. There’s plenty to learn and get familiar with!


    Inspired by this post on Search Engine Land.

    crushpress.ai community screenshot
  • Google Search Console Reporting Delays: What You Need to Know

    Google Search Console Reporting Delays: What You Need to Know

    I’ve recently encountered an issue with Google Search Console that’s affecting many of us in the SEO community. The index coverage report, also known as the page indexing report, is experiencing delays of about two weeks. It’s important to note that while this impacts reporting, it doesn’t affect the actual crawling, indexing, or ranking of websites.

    The page indexing report is crucial for me as it shows the pages Google can find and index on my site. It alerts me to any indexing problems encountered, and I can submit fixes to see if my resolutions are recognized by Google. Given the current delay, I won’t know if my fixes have worked until the report updates.

    Here’s a screenshot of my report, last updated on November 17th, although some users are seeing updates as late as the 18th. You can check out the screenshot here.

    ```json
{
  "alt": "Page indexing tool interface with a red arrow pointing towards the export option.",
  "caption": "Effortlessly export your page indexing data with a simple click, ensuring your insights are always up-to-date.",
  "description": "This image shows the interface of a page indexing tool. A red arrow points to the export option on the top right, highlighting where to download indexing data. The display indicates that the information was last updated on 11/17/25. This visual helps users quickly locate the export feature within the tool, designed for efficient data management and retrieval."
}
```

    In a statement on LinkedIn, Google confirmed the issue, saying:

    “FYI – Page indexing report delays We’re currently experiencing longer than usual delays in the Search Console Index Coverage report. This only affects reporting, not crawling, indexing, or ranking of websites. We’ll update here once this issue is resolved. Thanks for your patience!”

    This delay is particularly inconvenient as I prepare client reports at the beginning of each month. While I anticipate the report will catch up soon, it does mean delaying my own reporting to clients and stakeholders. Until then, it’s good to remember that this is just a reporting glitch.


    Inspired by this post on Search Engine Land.

    crushpress.ai community screenshot
  • Unlocking Success: How Structured Data Enhances Answer Engines

    Unlocking Success: How Structured Data Enhances Answer Engines

    In the rapidly changing world of search, I’ve discovered that Answer Engine Optimization (AEO) is becoming essential for content creators and marketers like me. Unlike traditional search engines, platforms such as Grok, Google’s featured snippets, and voice assistants focus on delivering precise and prompt answers to user questions. To stand out, I’ve found that using structured data is truly transformative. It enables answer engines to comprehend the content better, boosting the chances of my site appearing in instant answers, rich snippets, or voice search outcomes. Here’s my guide to leveraging structured data for AEO triumph.

    Structured data, to me, is like a format template that simplifies how search and answer engines interpret my webpage’s content. Utilizing schema.org markup, structured data organizes details into machine-readable formats, such as JSON-LD, which describe elements like articles, products, events, or FAQs. This clarity is vital for answer engines, as they rely on well-structured data to provide fast, relevant responses.

    Why does structured data matter for AEO? Well, I’ve observed that answer engines aim to furnish direct answers, frequently extracting information from structured data for featured snippets, knowledge panels, or voice responses. Without employing structured data, my quality content might be ignored. For instance, a blog post like “how to bake a chocolate cake” with proper recipe schema markup stands a better chance of being highlighted as a step-by-step guide than one without. Structured data bridges the disparity between my content and the algorithmic processes powering answer engines, making it indispensable for visibility.

    Here’s how I’ve learned to harness structured data for AEO:

    First, I identify the relevant schema types that suit my content. Common types for AEO include FAQPage for question-and-answer content, HowTo for tutorials or guides, Article for enhancing blog posts, and specific schemas like Recipe, Product, or Event for niche areas. I utilize tools like Google’s Structured Data Markup Helper to explore suitable schemas.

    Then, I implement JSON-LD markup, the preferred format for structured data, due to its simplicity and compatibility with answer engines. I add JSON-LD scripts to my website’s <head> or <body> sections. For example, an FAQ schema can look like this snippet I’ve used:

    Testing the markup using Google’s Rich Results Test is a step I never skip, ensuring everything is error-free.

    Optimizing for conversational queries is next. Answer engines flourish on natural language queries. I structure content to answer questions clearly and employ schema to highlight those answers, boosting chances in voice search or answer boxes.

    Finally, monitoring and refining is key. After integrating structured data, I track performance metrics like impressions, clicks, or appearances in featured snippets using Google Search Console. Continually updating the schema and experimenting with new types keeps my content competitive.

    I’ve identified a few common pitfalls to dodge: using incorrect schema types, overloading with irrelevant markup, and neglecting updates to schema.org as it evolves.

    In conclusion, I find that structured data is a formidable resource for unlocking the potential of answer engines. By implementing it strategically, optimizing for natural queries, and actively monitoring performance, I can position my content to thrive in instant answers and voice search results. As answer engines continually influence search dynamics, mastering structured data positions me ahead, driving valuable traffic and engagement to my site.


    Inspired by this post on AnswerEngineOptimization.blog.


    crushpress.ai community screenshot