Tag: Ads

  • Google Ads Updates: Audit Creative and Conversion Signals

    Google Ads Updates: Audit Creative and Conversion Signals

    Google can now surface videos automatically inside Merchant Center, while eligible Google Ad Grants accounts can make shop visits a primary goal. One change expands the creative Google can see. The other expands the outcome its bidding systems can pursue.

    If you manage a retail or nonprofit account, your next move should not be to accept every imported asset or enable every available goal. First determine what Google can now use, whether it represents the organization accurately, and what campaign behavior you are authorizing.

    Two updates, two different control points

    The Merchant Center change affects campaign inputs. The Ad Grants change affects campaign objectives. That distinction determines who should review each update and what can go wrong if nobody does.

    Platform changeWhat is newThe decision you need to make
    Merchant Center Video AssetsThe previously empty area is being populated automatically, including with videos from YouTube.Which discovered videos are accurate, current, and suitable for commerce campaigns?
    Google Ad Grants shop visitsEligible accounts can include store visit conversions in their primary account goals.Should automated optimization prioritize physical attendance alongside, or instead of, existing online outcomes?

    The connecting theme is delegation. Google is doing more to discover usable creative and letting advertisers optimize toward an outcome closer to real-world activity. Your work moves upstream: govern the inputs, define the outcome hierarchy, and verify what the system actually did.

    Audit auto-populated videos as potential ad inventory

    A content manager sorts generic product and storefront video previews into separate review trays at a desk.

    Google previewed the Merchant Center Video Assets area at Google Marketing Live 2025. The rollout began in September, but the section remained blank for many users before populated libraries started appearing. That progression matters because the interface is no longer just a placeholder. It is now an operational surface that retail teams need to review.

    Automatic discovery reduces upload work, but it also changes the failure mode. An old demonstration, expired promotion, superseded product, or video created for a different audience can enter the creative workflow without anyone deliberately adding it to that screen. Treat the library as a review queue, not a quality endorsement.

    1. Record what appeared. Create a review sheet with the visible video title, apparent origin, relevant product or category, owner, and review status. If the interface does not expose a field you need, mark it unknown instead of guessing.
    2. Confirm the authoritative version. Identify whether the asset comes from an official YouTube presence or another approved business source. Duplicate edits and abandoned channel uploads are easy to mistake for current creative.
    3. Check every commercial claim. Compare product names, availability, model references, prices, promotions, and calls to action with the current product feed and destination page. A polished video is still unsafe to use if its facts have expired.
    4. Watch it as an ad, not as archived content. The product and brand should be identifiable without relying on surrounding page copy. The main point should remain understandable when audio is unavailable, and the clip should not depend on an earlier episode or presentation for context.
    5. Classify it internally. Use clear statuses such as commerce-ready, correction required, and not intended for advertising. Assign an owner and a reason for every non-ready classification.
    6. Review changes at the source carefully. A YouTube video may serve customer support, education, or organic discovery even when it is unsuitable for an ad. Do not remove or rewrite a useful source asset merely to tidy Merchant Center until you understand the effect on its other uses.

    A populated library does not prove delivery

    Performance reporting and optimization controls in the Video Assets area remain open questions. The presence of a video confirms that Google discovered it. It does not, by itself, prove that the video was selected, served in Shopping or Performance Max, or influenced campaign results.

    Keep three states separate in your reporting: discovered in the library, permitted or selected through the controls available to your account, and confirmed as served in campaign reporting. Without that distinction, teams can mistakenly call an imported video an active ad or attribute a performance change to an asset that never received delivery.

    This is also why your first audit should be reversible. Document and classify before making broad changes to channels, source videos, or campaign assets. The interface is live, but the available controls and reporting may not yet answer every governance question.

    Make shop visits primary only when attendance is the priority

    A campaign manager selects a path toward a community shop visit while a separate online-action path remains secondary.

    A primary conversion goal is not a decorative reporting preference. It tells the account which outcomes should matter to bidding and optimization. Changing that priority can change the traffic an automated campaign pursues and how it values one user action against another.

    Before this update, selecting shop visits in Google Ad Grants could produce an error. Eligible accounts can now place store visit conversions in their primary goal settings, giving organizations with physical locations a way to align advertising more closely with in-person activity.

    The option is especially relevant when attendance is the mission outcome: a museum needs visitors, a community center needs participation, and a place of worship may value physical attendance more than a page view. Those are among the organizations that can connect local search activity with real-world visits.

    Availability does not make the goal appropriate for every account. Before making it primary, ask whether a visit is genuinely more important than an online donation, registration, appointment request, membership application, or other existing conversion. If the answer differs by campaign, do not let an account-level default silently settle that strategic question.

    1. Write the outcome hierarchy in plain language. For example: physical visits are the primary outcome, event registrations are the next priority, and general page views are diagnostic only. Get agreement before changing the platform.
    2. Inspect the current goal configuration. Record the existing primary goals, the campaigns relying on account-level goals, and the bidding approach in use. This gives you a defensible before-state.
    3. Confirm that the option exists in the account. The capability applies to eligible accounts. If shop visits are unavailable, do not describe the rollout as universal or treat the missing control as proof that somebody configured the account incorrectly.
    4. Verify the local journey. Make sure the ad destination and public location information identify the correct organization and place. Optimizing for visits cannot compensate for inaccurate location details or a landing page that leaves visitors unsure where to go.
    5. Document the change. Record the date, owner, reason, affected goals, and expected behavior. Without a change log, a later shift in campaign results can look mysterious.
    6. Evaluate mission outcomes, not just clicks. Review spend, reported visits, online conversions, and the downstream result the organization actually values. A campaign that produces more visits is not automatically better if those visits do not support the intended program or location.

    The financial risk is straightforward: automated bidding may pursue visit-rich traffic while online donations or registrations receive less emphasis. That trade may be correct, but it should be deliberate. If the organization has not agreed on the relative value of those outcomes, leave the current primary configuration unchanged until it has.

    Keep paid activation separate from SEO, AEO, and GEO

    Neither update is evidence of an organic ranking change. A video appearing in Merchant Center does not prove that it will rank in Google Search or be cited by an AI system. Making shop visits primary in Ad Grants does not, by itself, improve local organic visibility. These are advertising workflow and optimization changes.

    The paid and organic teams should still coordinate because both depend on the same underlying facts. The useful connection is operational consistency, not a promise of cross-channel ranking benefits.

    • Use one factual source of truth. Product names, models, availability, offers, organization names, locations, and destination URLs should not contradict one another across videos, feeds, landing pages, and local content.
    • Keep activation controls channel-specific. Merchant Center asset discovery, Performance Max asset use, Ad Grants conversion goals, organic pages, and AI visibility each have their own mechanisms. Approval in one system should not be treated as approval in every other system.
    • Measure each channel on its own evidence. Paid delivery and conversions belong in advertising reporting. Search visibility, organic traffic, and AI citations require their own observations. A simultaneous change is not enough to claim that one caused the other.
    • Treat structured data as a separate implementation. Product, video, organization, or local-business markup may make appropriate page facts machine-readable, but neither rollout gives you a basis to expect JSON-LD alone to populate Merchant Center’s video library or enable an Ad Grants goal.
    • Share governance, not conclusions. SEO, content, ecommerce, local, and paid-media owners should use the same approved facts and change log while retaining separate success criteria.

    This separation prevents a common reporting error: turning an advertising-platform observation into a claim about search or AI visibility. It also makes coordination more useful. When a product changes, one approved update can trigger reviews of the feed, landing page, video library, structured data, and campaign creative without pretending those surfaces perform the same job.

    Key takeaways

    • Merchant Center’s populated Video Assets area should be treated as an asset-discovery queue, not proof that every video is approved or serving.
    • Review imported videos against current product data and landing pages before allowing them to influence commerce campaigns.
    • Shop visits can now be a primary goal in eligible Ad Grants accounts, but the setting should reflect an agreed hierarchy of real organizational outcomes.
    • Record account settings before changing primary goals because automated optimization may shift emphasis away from existing online conversions.
    • Keep Google Ads activation, organic search performance, structured data, and AI visibility separate in measurement, even when the teams share the same factual source of truth.

    Start with one controlled audit. Retail teams should open the Video Assets library, record what Google discovered, and assign every asset a review status. Ad Grants teams should write down their current primary goals and decide where physical visits belong before changing the account. Automation becomes useful when somebody still owns the facts, the priorities, and the evidence.

    References

  • AdSense Revenue Declines: How to Diagnose the Real Cause

    AdSense Revenue Declines: How to Diagnose the Real Cause

    Your AdSense revenue has fallen sharply, but your traffic looks normal. The expensive mistake is to assume that SEO is responsible and immediately change your content, schema, ad layout, or site architecture. Those changes can erase the evidence you need and introduce a second problem.

    You can usually narrow the cause by comparing pageviews, ad impressions, page RPM, and eCPM across the same sites, countries, devices, and ad units. The goal is not to explain every dollar immediately. It is to identify whether traffic, ad delivery, advertiser demand, or reporting broke first.

    First, identify which number actually broke

    An icon-based diagnostic pathway separates website activity, ad delivery, advertiser demand, and reporting problems across devices and regions.

    Revenue is the result, not the diagnosis. Page RPM tells you how much revenue you earned per thousand pageviews. eCPM tells you how much revenue was generated per thousand ad impressions. A fall in either metric matters, but the surrounding numbers tell you where to look.

    Start with equivalent, complete reporting periods. Do not compare a partial day with a completed day. Then examine the metrics in this order:

    1. Independent traffic: Check pageviews or sessions outside AdSense. This establishes whether fewer people actually reached the site.
    2. Ad impressions: Compare the change in ad impressions with the change in pageviews. A much larger impression decline points toward serving, rendering, consent, or placement problems.
    3. Page RPM: If traffic is stable but page RPM collapses, the problem is monetization rather than the number of visits alone.
    4. eCPM: If ad impressions remain comparatively stable while eCPM falls, weaker auction pricing or a change in traffic mix becomes more plausible.
    5. Rendered ads: Open representative pages and confirm whether the expected ad slots appear. Missing ads are operational evidence, not merely a dashboard fluctuation.

    This distinction mattered during a severe episode that began late on January 14 and intensified on January 15. Publishers reported eCPM and page RPM declines of up to 70%, simultaneous effects across multiple sites, and ads partially or completely disappearing. Google also acknowledged systemic Google Ad Manager problems involving declining AdX match rates and reduced delivery from Google Ads and DV360, with web and mobile web display inventory particularly affected.

    That acknowledgement is important, but it does not prove that the Ad Manager incident explained every AdSense account’s decline. Your own metric sequence still matters. A platform incident can coexist with a traffic loss, a local implementation fault, or a reporting anomaly.

    Pattern you seeMost plausible problem areaWhat to check next
    Traffic and ad impressions fall together while page RPM is comparatively stableAudience acquisition or search visibilityAnalytics, server logs, landing pages, and Search Console performance
    Traffic is stable but ad impressions fall or ads disappearAd serving, rendering, consent, policy, or implementationLive pages, affected templates, ad code, consent states, policy notices, and recent deployments
    Traffic and ad impressions are stable but eCPM fallsAuction demand, match rate, or traffic-mix changeCountry, device, site, and ad-unit segments
    Revenue changes without corresponding movement in the underlying metricsReporting delay or anomalyPlatform notices and whether reported figures are subsequently revised
    Traffic, impressions, and RPM all fallMore than one problem may be presentDiagnose the traffic and monetization changes separately

    Use the blast radius to separate local faults from platform failures

    The first useful question is not simply, “How much revenue did we lose?” Ask, “Where did the decline begin, and where did it not happen?” A single account-wide average can hide the answer.

    1. Split by site. If unrelated sites in the same account decline at the same time, a shared platform or demand problem becomes more plausible. If only one site changes, inspect that site’s deployments, templates, audience, and policy status.
    2. Split by country. Advertising demand and delivery can move differently by market. A global average may therefore make a regional problem look universal.
    3. Split by device. A mobile-only decline points toward different templates, consent behavior, viewport rendering, or mobile-web delivery.
    4. Split by ad unit or placement. A failure concentrated in one unit is a different problem from an account-wide eCPM decline.
    5. Compare the onset time. Metrics that change together are more likely to share a cause. Changes beginning at different times should be treated as separate events until the data connects them.

    Regional differences during the January episode show why this segmentation matters. Self-reported losses for U.S.-focused sites ranged from 35% to 70%, while selected European country domains reported declines ranging from 63% to 90%. These were publisher reports, not official performance benchmarks, so they should not be used to predict your expected loss. They do demonstrate that a single blended percentage can conceal materially different market behavior.

    Blast-radius analysis produces probabilities, not certainty. Several sites failing simultaneously makes a shared dependency more plausible, but it does not rule out a common change made across those sites. Check shared consent management, ad code, deployment pipelines, CDN rules, and account settings before concluding that the platform is solely responsible.

    Do not confuse monetization failure with an SEO or AI-search loss

    A search ranking change reduces revenue by reducing or changing visits. It does not directly explain why the same pageviews suddenly produce far fewer ad impressions or why previously visible ad slots stop rendering.

    An unconfirmed Google Search ranking update coincided with the reported AdSense decline. That timing creates a reasonable hypothesis, but timing alone is not causation. Test it with independent traffic data:

    • If Search Console clicks and analytics traffic decline while page RPM remains stable, investigate search visibility and landing-page losses.
    • If traffic remains stable while page RPM or ad impressions collapse, prioritize monetization and serving diagnostics.
    • If traffic and page RPM decline together, maintain two incident tracks. Fixing or explaining one does not automatically explain the other.
    • If organic traffic volume is stable but eCPM changes by country or device, examine audience mix before blaming rankings.

    AI Overviews were also raised as a possible indirect factor because those search-result experiences displayed no ads during the period being discussed. However, no causal connection was established between AI Overviews and the sudden publisher revenue collapse. Treat AI-search displacement as a longer-term distribution question unless your referral and landing-page data show that it caused the traffic change in front of you.

    The same discipline applies to AEO, GEO, and structured data. Schema can help machines interpret content, and answer-focused optimization may improve discoverability, but neither can repair a falling AdX match rate or restore an ad slot that is not being served. Measure AI visibility, AI referrals, organic clicks, ad delivery, and revenue as separate layers. Connect them only when the data supports the connection.

    Respond without destroying the evidence

    An analyst documents untouched website analytics under a transparent cover while modification tools remain set aside.

    Broad changes made during an unexplained incident create confounding variables. If you alter ad density, templates, consent logic, content, and internal links at once, you will not know whether the original problem recovered or your intervention changed the result.

    1. Record the onset. Note when the decline first appears and which account, site, country, device, and ad-unit views show it.
    2. Preserve the baseline. Export or capture the relevant pageview, ad-impression, page RPM, eCPM, and revenue reports before dashboard values or date ranges change.
    3. Verify traffic independently. Use analytics, server logs, and Search Console rather than relying on an AdSense pageview metric alone.
    4. Test representative pages. Check more than the homepage. Include major templates, mobile and desktop layouts, important countries you can validly test, and the consent states your site supports.
    5. Review shared dependencies. Inspect policy notices, consent-management changes, ads.txt changes, ad-code changes, recent releases, caching, CDN behavior, and security rules that could prevent requests or rendering.
    6. Check platform communications. Match any acknowledged incident to your affected product, inventory type, geography, and onset time. A status notice is evidence only when its scope fits your metrics.
    7. Change one layer at a time. If the evidence identifies a local fault, make the smallest relevant correction and annotate it. Keep SEO and content changes out of an ad-serving test.

    Communicate the same distinction internally. “Revenue is down” is not an operational diagnosis. A useful incident note says, for example, that traffic is stable, mobile-web ad impressions fell across several sites, and no site deployment preceded the change. That statement tells technical, editorial, and financial teams what is known without pretending the cause is settled.

    If the decline affects payroll, debt, tax payments, or another consequential financial decision, work from confirmed cash and account data rather than an assumed recovery. An accountant or financial adviser should review any irreversible response to a temporary or disputed dashboard event.

    Plan for a decline that does not fully recover

    An overnight incident and a structural revenue decline require different responses. The first calls for controlled diagnosis. The second calls for a business-model decision.

    Some publishers reported losses of 70% to 80% extending back to mid-2025. Those reports do not prove that traditional content sites are being systematically deprioritized, and they should not be treated as a forecast for every publisher. They do show why waiting for a dashboard to return to an old high can become a strategy of its own.

    If your decline persists after serving and reporting issues are excluded, build the plan from your observed economics:

    • Chart RPM by segment, not just account. Identify which sites, countries, devices, templates, and topics still produce sustainable returns.
    • Map concentration risk. Record how much of the site’s operation depends on one ad platform, one search channel, or one high-value audience segment.
    • Use a conservative operating case. Budget from revenue you can verify, not from an assumption that a previous RPM will return.
    • Evaluate adjacent revenue models against audience intent. Sponsorships, subscriptions, services, commerce, or affiliate revenue are useful only when they fit why the audience visits. Adding an unrelated monetization layer can damage trust without replacing the lost income.
    • Build direct audience access. Email subscriptions, repeat visits, and recognizable brand demand reduce dependence on any single discovery interface, including traditional search and AI-generated answers.
    • Track AI discovery separately. Measure citations, referral traffic, branded searches, conversions, and revenue where possible. AI visibility is not a business outcome until you can connect it to audience or commercial value.

    Key takeaways

    • Stable traffic with falling ad impressions points toward serving or rendering before it points toward SEO.
    • Stable impressions with falling eCPM makes auction demand or audience mix more plausible.
    • Simultaneous declines across unrelated sites suggest a shared dependency, but they do not prove a platform-wide cause.
    • A coincident search update or AI feature is a hypothesis until traffic and landing-page data connect it to the loss.
    • Preserve reports and change one layer at a time so that recovery remains measurable.
    • A persistent decline needs a lower-risk revenue plan, not indefinite dependence on a rebound.

    Your next move is to export the affected metrics and write a one-sentence diagnosis that the numbers support. If you cannot yet say whether traffic, impressions, or eCPM broke first, do not redesign the site. Find that missing comparison. Once the failure is classified, you can act on the correct system instead of spending an ad-delivery incident on an SEO fix.

    References

  • Google Ads and Measurement Updates: A Practical Action Plan

    Google Ads and Measurement Updates: A Practical Action Plan

    Your Google Ads account can look healthy while the business behind it becomes harder to explain. A Vehicle Ad can generate a phone call before the shopper visits your site, tag traffic can move through your first-party domain, and a mid-month budget edit can change spending behavior immediately.

    If your reporting still assumes a neat click-to-pageview-to-form path and evenly distributed daily spend, those changes create blind spots. The practical response is to manage calls, tagging and budgets as parts of the same revenue system: capture the demand, preserve the measurement signal and control what you spend to acquire it.

    Treat the updates as one revenue system

    These changes sit in different Google interfaces, but they affect one connected workflow. Vehicle Ads determine how a prospect reaches you. Google Tag Gateway affects how reliably eligible tag requests travel from your site to Google. Campaign budgets determine how much demand you can pursue and when.

    A failure at any point can distort the others. More calls are not valuable if nobody answers them. More observable events are not useful if duplicate or poorly defined conversions inflate the count. A larger budget is not productive if finance cannot reconcile the projected spend or the sales team cannot handle the resulting demand.

    Key takeaways

    • Treat a call from an ad as the start of a measurable sales path, not proof of a sale.
    • Use first-party tag routing to strengthen signal transport, but keep consent, event definitions and data quality controls separate.
    • Model a budget change before editing the campaign because Google can alter the applicable spending limit and pacing from the change date forward.
    • Give marketing, analytics, sales operations and finance a shared definition of success before you scale any of these changes.

    The unifying document should be a measurement contract. For every important event, write down what happened, which system recorded it, who owns the next step and which business decision the event supports. That short exercise exposes gaps that a polished dashboard can hide.

    Make click-to-call accountable past the tap

    A shopper calls beside a vehicle as a glowing signal links the phone to attribution checkpoints and a sales handshake.

    Google’s click-to-call capability for Vehicle Ads reduces the distance between a high-intent vehicle search and a live conversation with a dealership. It also moves part of the conversion experience away from the landing page and into an operational channel that paid-media teams do not always control.

    That changes the question you need to answer. It is no longer enough to ask whether the ad produced a call. You need to know whether the call connected, whether the caller was a plausible buyer, whether an appointment or useful follow-up resulted, and whether the opportunity eventually generated revenue.

    Build the call conversion chain

    1. Capture the ad interaction. Retain the campaign, ad group, advertised vehicle and other available acquisition context. Do not promise fields that your advertising, phone and CRM systems cannot actually pass between them.
    2. Record the operational outcome. Distinguish an initiated call from an answered call, a missed call, a disconnected attempt and a completed callback.
    3. Classify the sales outcome. Use a small, enforced set of CRM statuses such as unqualified, qualified, appointment booked, follow-up required, closed lost and sold.
    4. Attach value at the appropriate stage. A raw call and a completed sale should not carry the same meaning. If value is unavailable, report the outcome honestly instead of inventing a revenue proxy.
    5. Reconcile the systems. Compare ad-generated call records with phone-platform and CRM outcomes. Unmatched records should enter an exception queue rather than silently disappearing from reporting.

    A simple metric ladder makes the handoff visible:

    MetricCalculationWhat it helps you notice
    Connection rateAnswered calls divided by initiated callsRouting, staffing or phone-system friction
    Qualification rateQualified calls divided by answered callsWhether the ads are attracting plausible buyers
    Appointment yieldAppointments divided by qualified callsHow effectively staff convert intent into a next step
    Sales yieldCompleted sales divided by qualified callsWhether call volume is producing business value

    Do not collapse that ladder into a single conversion count. If initiated calls rise while the connection rate falls, bidding is not the first problem to solve. Check opening hours, routing rules, queue coverage and missed-call ownership. If calls connect but few qualify, inspect campaign targeting, inventory alignment and the expectations set by the ad. If qualified calls stall after the conversation, the failure sits in sales follow-up rather than media delivery.

    Give every call an operational owner

    Before enabling call-led demand broadly, document who handles each state:

    • Which team answers during advertised business hours.
    • Where a call goes when the primary recipient is unavailable.
    • Who reviews missed and abandoned calls.
    • How callbacks are associated with the original lead instead of counted as unrelated opportunities.
    • Which CRM field records qualification, appointment and sale outcomes.
    • Who audits missing outcomes and how often that review occurs.

    This is not administrative detail. Once the ad itself becomes a direct contact point, call handling becomes part of campaign performance. Media optimization cannot compensate for unanswered demand, and a sales team should not be judged on lead quality when the acquisition data cannot be connected to actual conversations.

    Use Tag Gateway to strengthen transport, not excuse data design

    Google Tag Gateway now has a beta deployment path through Google Cloud Platform. The workflow is available from Google Tag Manager and Google tag settings and uses Google Cloud’s Global External Application Load Balancer to route eligible tag traffic through your first-party domain before forwarding it to Google.

    The architecture places Google’s tagging infrastructure behind a same-site, same-origin first-party host. It is intended to improve signal quality and make measurement more resilient to some ad-blocking behavior and browser restrictions, including Apple’s Intelligent Tracking Prevention. Treat those benefits as the purpose of the design, not a guarantee that every missing signal will return.

    The distinction matters. A gateway can improve the route a request takes. It cannot repair a badly named event, an accidental duplicate, a broken data-layer value or a conversion that has no relationship to a business outcome. It also does not turn data collection into permission. Your consent rules, disclosure obligations, retention controls and internal governance still apply when traffic uses a first-party host.

    Deploy it as a measured infrastructure change

    1. Map the current request path. Record which Google tags load, where they load, which events they send and which teams own the site, tag manager, cloud infrastructure and analytics configuration.
    2. Capture a baseline. Preserve representative event counts, conversion counts, duplicate rates and known gaps before changing the route. Without a baseline, a higher count after deployment can be mistaken for an improvement even when it comes from duplication.
    3. Choose a contained scope. Because the Google Cloud integration is in beta, begin where you can validate the route and reverse the change without disrupting every property or campaign.
    4. Use the supported setup path. Complete the workflow from Google Tag Manager or Google tag settings and review the External Application Load Balancer configuration created in Google Cloud.
    5. Validate the route. Confirm that intended requests use the first-party host and reach the expected destination. Also verify that unrelated application traffic is not being caught by the routing rules.
    6. Test event behavior. Compare event names, parameters and conversion totals before and after the change. Investigate missing events, unexpected increases and duplicate conversions before calling the deployment successful.
    7. Document ownership and rollback. Record the hostname, routing configuration, deployment owner, monitoring owner and the safe procedure for returning to the previous path.

    The new GCP workflow reduces deployment friction for teams already operating in Google Cloud. Cloudflare had been the only automated option identified for Google Tag Gateway, while other content delivery networks required manual setup. Lower setup friction is useful, but it should not remove technical review. A one-click provisioner can create infrastructure; it cannot decide whether your event model is correct.

    Use reconciliation, not event volume, as the success test

    Measure the gateway at three levels. First, confirm transport health: intended requests use the expected first-party route and complete successfully. Second, confirm analytics integrity: event names, parameters and deduplication behavior remain correct. Third, reconcile business outcomes: the conversions used for bidding and reporting still agree with downstream lead, appointment, order or revenue records.

    An increase in observed events is only useful when you can explain it. The increase might represent recovered signal, but it might also expose a pre-existing implementation difference or introduce duplicate collection. Keep the classification open until the analytics and business records agree.

    Model every budget edit before you make it

    An operations specialist compares stable and surging token flows in a tabletop simulation before adjusting a budget control.

    A Google Ads average daily budget is not a strict daily ceiling. Google may spend up to twice that amount on a high-traffic day while applying the relevant monthly charging limit. That makes smooth daily pacing a planning assumption, not a platform promise.

    A mid-month budget change recalculates the plan from the edit date forward. The applicable monthly limit reflects the old budget for the earlier period and the new budget for the later period. The potential daily overdelivery threshold adjusts immediately, and Google re-optimizes pacing for the remaining time.

    This is why simply multiplying the new daily amount by the days left can give you the wrong expectation. It ignores what has already been spent, the earlier budget period and the platform’s pacing behavior.

    Use three projections for three different questions

    ControlQuestion it answersHow to use it
    Budget reportWhat spend is Google currently projecting?Review the campaign’s budget history, change marker and projected billing outcome.
    Performance PlannerWhat performance trade-off might a different budget create?Compare budget scenarios against projected clicks, conversions and other relevant outcomes.
    Manual calculationDoes the platform projection fit the business constraint?Subtract cost to date from the revised period goal, then divide the remainder by the days left as a planning guide.

    The manual check is deliberately simple:

    Remaining allowable spend = revised period goal minus cost to date.

    Planning pace = remaining allowable spend divided by the days left in the period.

    That pace is a finance guardrail, not a guarantee that Google will spend the same amount each day. Compare it with the budget report. If the platform projection does not fit the business constraint, resolve the difference before saving the edit.

    Performance Planner answers a separate question. A budget reduction may meet the spending requirement while also reducing projected clicks or conversions. Put both effects in the approval request. Saying that a change saves money without showing the likely opportunity cost leaves the decision incomplete.

    Use a repeatable edit protocol

    • Before the edit: capture cost to date, the current budget report projection, the relevant Performance Planner scenario and the revised business target.
    • At the edit: record the old budget, new budget, campaign, timestamp, approver and reason. Google Ads reporting can display a gray triangle at the change date, but your internal record should explain why the change happened.
    • After the edit: reopen the budget report and verify that the revised projection matches the intended direction. Do not rely on the number entered in the budget field as proof.
    • During the remaining period: compare actual cost with the remaining allowable amount and watch conversion quality. A campaign can underspend because demand, targeting or return-on-ad-spend constraints limit delivery, even when budget is available.
    • At period close: reconcile billed spend, reported performance and the approval record so the next planning cycle begins with an explainable baseline.

    Manage campaign total budgets separately from average daily budgets. Campaign total budgets aim to spend a defined amount by an end date and do not use the same daily-cap model. They can suit bounded promotional or video activity, but their end-date orientation makes them a different planning instrument, not a shortcut around daily-budget controls.

    Run the rollout as a controlled operating change

    The cleanest implementation assigns an owner and evidence standard to every workstream:

    WorkstreamPrimary ownersEvidence required before expansion
    Vehicle call conversionPaid media and sales operationsCalls can be connected to answer, qualification, appointment and sales outcomes.
    First-party tag routingAnalytics, web engineering and cloud infrastructureRequests use the intended route without unexplained loss, duplication or parameter changes.
    Budget controlPaid media and financeThe budget report, performance scenario and manual constraint check tell a coherent story.
    Business reconciliationMarketing operations and the relevant revenue ownerAdvertising conversions can be compared with downstream CRM or commerce outcomes.

    Start by writing the measurement contract for a contained campaign or property. Preserve the current baseline. Make the scoped change, then reconcile platform events with operational and financial outcomes. Expand only after the team can explain both gains and discrepancies.

    Your shared dashboard does not need every available Google Ads field. It needs the fields that reveal a broken handoff: spend to date, projected spend, the latest budget change, calls initiated, calls answered, qualified opportunities, appointments, sales outcomes, expected tag events, received tag events and unresolved exceptions.

    At your next change window, trace a real prospect from the ad through the call or site event, into the downstream business record and back to the budget decision. Wherever that trace breaks is where you should work next.

    References

  • Enhanced Google Ads Creator Tools Streamline YouTube Partnerships

    Enhanced Google Ads Creator Tools Streamline YouTube Partnerships

    Google Ads has introduced exciting updates to its Creator Partnerships, making it easier for me to manage collaborations with YouTube talents on a larger scale.

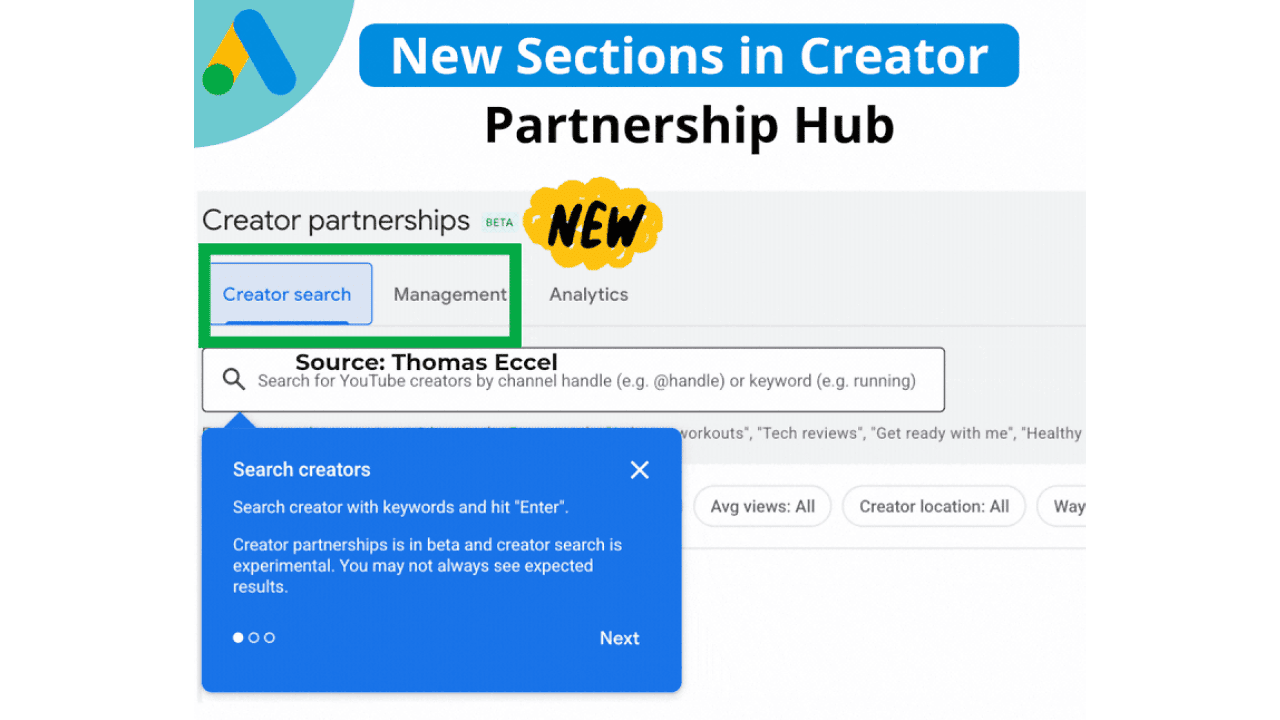
    With the introduction of Creator Search, I can now effortlessly find YouTube creators by utilizing keywords or channel handles. This tool allows me to refine my search based on subscriber count, average views, location, and their availability for contact. It’s a game-changer, significantly cutting down the manual work involved in discovering and reaching out to creators.

    In addition to the search feature, Google has unveiled a new Management section. This centralizes all communications with creators, allowing me to view their names, the status of inquiries, subjects, the latest updates, and scheduled response dates—all in one place with the convenience of direct email access.

    Why this matters to me. As creator-led campaigns become a core aspect of media strategies, having better tools to identify the right collaborators and maintain organized partnerships is crucial. The latest enhancements to Google Ads’ Creator Partnerships (beta) cater to these needs perfectly.

    ```json
{
  "alt": "Screenshot of new sections in Creator Partnership Hub with search features.",
  "caption": "Explore the latest features in the Creator Partnership Hub, including a new creator search tool to enhance your collaboration experience.",
  "description": "This image showcases the new sections in the Creator Partnership Hub, highlighting features like 'Creator search', 'Management', and 'Analytics'. A search box invites users to search for YouTube creators by channel handle or keyword. A blue dialog box provides guidance on the experimental 'Search creators' feature, noting it is in beta. Keywords for searchability include Creator Partnership Hub, search tool, collaboration, beta feature."
}
```

    First sightings. This update made headlines when Google Ads Specialist Thomas Eccel shared it on LinkedIn, making industry professionals eager to explore its capabilities.

    The big picture. These upgrades are pushing Creator Partnerships closer to a comprehensive workflow tool, aiding teams like mine to manage creator collaborations with the same efficiency and accountability that we apply to other paid media endeavors.

    Bottom line. By enhancing both discovery and organization, Google’s updates to Creator Partnerships empower me to execute creator campaigns at scale with ease.


    Inspired by this post on Search Engine Land.


    crushpress.ai community screenshot
  • Google Ads Original Conversion Value: A Practical Guide

    Google Ads Original Conversion Value: A Practical Guide

    Your Google Ads return can appear to improve even when the underlying value of your conversions has not. If value rules or lifecycle goals are active, the Conversion Value column can include adjustments intended to guide automated bidding.

    Original Conversion Value gives you a cleaner baseline. The point is not to replace adjusted value, but to stop using one number for two different jobs: steering Google Ads and measuring the value your conversion tracking originally recorded.

    What Original Conversion Value actually removes

    Two parallel channels of value tokens, with one unchanged and the other gaining colored rings after passing through translucent filters.

    Google Ads provides an Original Conversion Value column that separates the starting value from rule and lifecycle adjustments. The relationship is:

    Conversion Value – Value Rule Adjustments – Lifecycle Goal Adjustments = Original Conversion Value

    Value rules can change the value Google Ads assigns for optimization purposes. Lifecycle goals can add strategic value as well, including a bonus associated with new customer acquisition. Those adjustments may be entirely intentional. They still make the resulting Conversion Value unsuitable as a direct stand-in for unadjusted value.

    • Original Conversion Value answers: What value was present before these Google Ads adjustments?
    • Conversion Value answers: What value remains after Google Ads applies the relevant value rules and lifecycle goal adjustments?
    • The difference between them answers: How much of the reported value comes from the optimization layer rather than the original value layer?

    The word “original” needs one important qualification. This metric does not independently verify your sales, margins, customer lifetime value, or recognized revenue. It inherits the quality of the conversion values entering Google Ads. If those values are incomplete, duplicated, outdated, or based on an unsuitable proxy, removing adjustments will not repair the underlying measurement.

    It also does not tell you whether the number of conversions increased. A campaign can show more adjusted value without producing more conversion events. Check conversion volume separately when your question is about acquisition volume rather than value.

    Compare the gap before you trust reported ROAS

    The useful insight is rarely in either value column by itself. It is in the relationship between them. Build that comparison into your campaign audit instead of waiting for a mismatch between Google Ads and an internal report.

    1. Choose one reporting scope. Use the same account or campaign rows, conversion scope, and date range for every value you compare.
    2. Place the columns side by side. Include Cost, Conversion Value, and Original Conversion Value. Add conversion volume when you also need to determine whether the number of outcomes changed.
    3. Calculate the adjustment gap. Subtract Original Conversion Value from Conversion Value. Treat this as a diagnostic calculation, not as another revenue measure.
    4. Calculate both ROAS views. Divide Original Conversion Value by Cost for an unadjusted, ads-side view. Divide Conversion Value by Cost for the adjusted view that reflects optimization priorities.
    5. Break the comparison down by campaign. An account-level total can hide a large adjustment in one campaign behind an unadjusted result somewhere else.
    6. Map each meaningful gap to a setting. Check whether an active value rule or lifecycle goal explains it. An unexplained gap should be resolved before you use the adjusted result to defend a budget decision.

    You can read the resulting patterns quickly:

    • The two values match: the selected slice has no net difference from the value-rule and lifecycle adjustments represented by the formula.
    • Both values move together: the underlying conversion value is likely contributing to the change. Check the gap as well, because adjustments may still amplify or reduce it.
    • Conversion Value rises while Original Conversion Value stays flat: the apparent gain is adjustment-driven, not growth in the baseline value.
    • Original Conversion Value falls while Conversion Value holds steady or rises: adjustments may be masking deterioration in the baseline.
    • The gap changes sharply: investigate a rule, lifecycle goal, or change in the mix of conversions eligible for those adjustments before attributing the movement to campaign execution.

    This comparison is especially important across campaigns. If one campaign receives a new-customer bonus and another does not, their adjusted Conversion Values do not represent the same measurement policy. Original Conversion Value removes that particular source of distortion and gives you a more consistent starting point for comparison.

    Keep bidding value and business value in separate lanes

    Adjusted value is not automatically false or useless. Its purpose can be strategic. If acquiring a new customer matters more to the business than recording an otherwise similar conversion, a lifecycle adjustment can communicate that preference to Smart Bidding.

    The reporting problem begins when that strategic preference is presented as money already generated. A new-customer bonus can represent additional value you want bidding to recognize without being an amount paid during the conversion. Calling the entire adjusted total “revenue” erases that distinction.

    A practical performance report should therefore show separate lines for separate questions:

    • Cost: what you spent.
    • Original Conversion Value: the baseline value before the covered Google Ads adjustments.
    • Original-value ROAS: Original Conversion Value divided by Cost. Label this as your own calculated view rather than implying it is a different official metric.
    • Adjusted Conversion Value: the value after rules and lifecycle goals have shaped it.
    • Adjusted-value ROAS: Conversion Value divided by Cost.
    • Adjustment gap: the difference between the two value columns, accompanied by the rule or goal responsible for it.

    Use the original-value view when you need to assess unadjusted campaign output, compare campaigns operating under different value strategies, or explain why platform ROAS does not match a less adjusted report. Use the adjusted view when you need to understand the priorities being supplied to automated bidding.

    Neither view should be silently relabeled as booked revenue. If revenue accuracy matters to a financial decision, reconcile the ads-side numbers with the system your business uses to validate transactions and customers. Until that reconciliation exists, keep the platform’s own metric name in stakeholder reports.

    Audit the automation before changing budgets or rules

    A magnifying glass examines connected switches, gates, and value tokens in a miniature automation control system.

    An attractive adjusted ROAS is not enough reason to expand spending. It may reflect stronger underlying performance, a larger adjustment, or both. Diagnose those components before you change the budget.

    1. Confirm whether the improvement exists in Original Conversion Value. If it does, the baseline moved. If it does not, isolate the adjustment responsible for the reported improvement.
    2. Verify that the adjustment is intentional. A value rule or lifecycle bonus should express a current business priority, not survive merely because nobody revisited it.
    3. Separate the optimization decision from the investment decision. Ask whether the bidding system should continue favoring the adjusted outcome, then ask whether the baseline value justifies more spend. Those questions can have different answers.
    4. Compare campaigns on a consistent basis. Use Original Conversion Value when differing adjustment policies would otherwise make adjusted values misleading.
    5. Document the reason for the gap. A short reporting note identifying the applicable rule or lifecycle goal prevents a strategic bonus from being mistaken for unexplained revenue growth later.

    Do not remove an intentional value rule solely to make the dashboard resemble a revenue report. Value adjustments help steer Smart Bidding. If the strategy is sound, preserve the signal and fix the reporting presentation by showing the original and adjusted views separately.

    Conversely, do not defend a campaign solely with adjusted ROAS when Original Conversion Value is weakening. The adjustment may explain why automation still favors the campaign, but it does not erase the decline in its baseline value. That is a commercial issue to investigate, not a reporting inconvenience.

    Key takeaways

    • Original Conversion Value is the conversion value before value-rule and lifecycle-goal adjustments covered by the metric.
    • The gap between Conversion Value and Original Conversion Value shows how much adjusted value separates your optimization view from the baseline.
    • Original Conversion Value divided by Cost provides a cleaner ads-side ROAS for analysis, but it is not automatically the same as validated business revenue.
    • Adjusted Conversion Value remains useful for understanding the priorities supplied to Smart Bidding.
    • If adjusted value improves without a corresponding improvement in original value, investigate the adjustment before crediting campaign performance.
    • Campaign reports should label original value, adjusted value, both ROAS calculations, and the reason for any material gap.

    Before your next budget review, add Original Conversion Value beside Conversion Value and Cost, calculate the gap, and annotate the rule or lifecycle goal behind it. You will leave the meeting knowing whether you are discussing stronger conversion value, a stronger bidding preference, or a mixture of both.

    References