Category: SEO

  • Boosting Medical Device Marketing ROAS with SEO Maturity

    Boosting Medical Device Marketing ROAS with SEO Maturity

    I took our SEO to a whole new level, and the results were astonishing. From just $12K in ad spend, we skyrocketed to $1.6M in revenue. Let me share how building authority, optimizing conversion signals, and setting up CRM feedback loops made our PPC scalable.

    You might already be familiar with how important SEO is for improving traffic and authority, but what isn’t discussed enough is its impact on other channels like PPC. This case study reveals how we scaled performance marketing in the high-consideration B2B medical device market by nailing our SEO fundamentals.

    Marketing a premium pelvic floor chair isn’t your typical ad campaign. This device has a lengthy sales cycle and relies heavily on medical expertise. Our customers range from doctors to physiotherapists, all of whom demand reliable clinical evidence and credibility.

    ```json
{
  "alt": "The CapmatchOne logo with a gradient circle and bold text.",
  "caption": "Discover innovation with the CapmatchOne logo, featuring sleek typography and a modern gradient circle.",
  "description": "The CapmatchOne logo features bold, modern typography coupled with a gradient circle, symbolizing connection and innovation. The sleek design conveys a sense of progress and creativity. This image can be used for branding or promotional purposes, appealing to audiences interested in innovative solutions and forward-thinking designs."
}
```

    In markets like ours, when common performance tactics fell short, building credibility and authority was key. Without trust in our products and services, performance simply couldn’t scale. I’ve learned that no optimization works without it.

    Starting 2023, our Google Ads campaigns were launched with limited SEO. The lack of optimization led to underattribution and resulted in a minimal scaling effect. We also dealt with delays in Google Ads bidding algorithms due to conversion tracking issues.
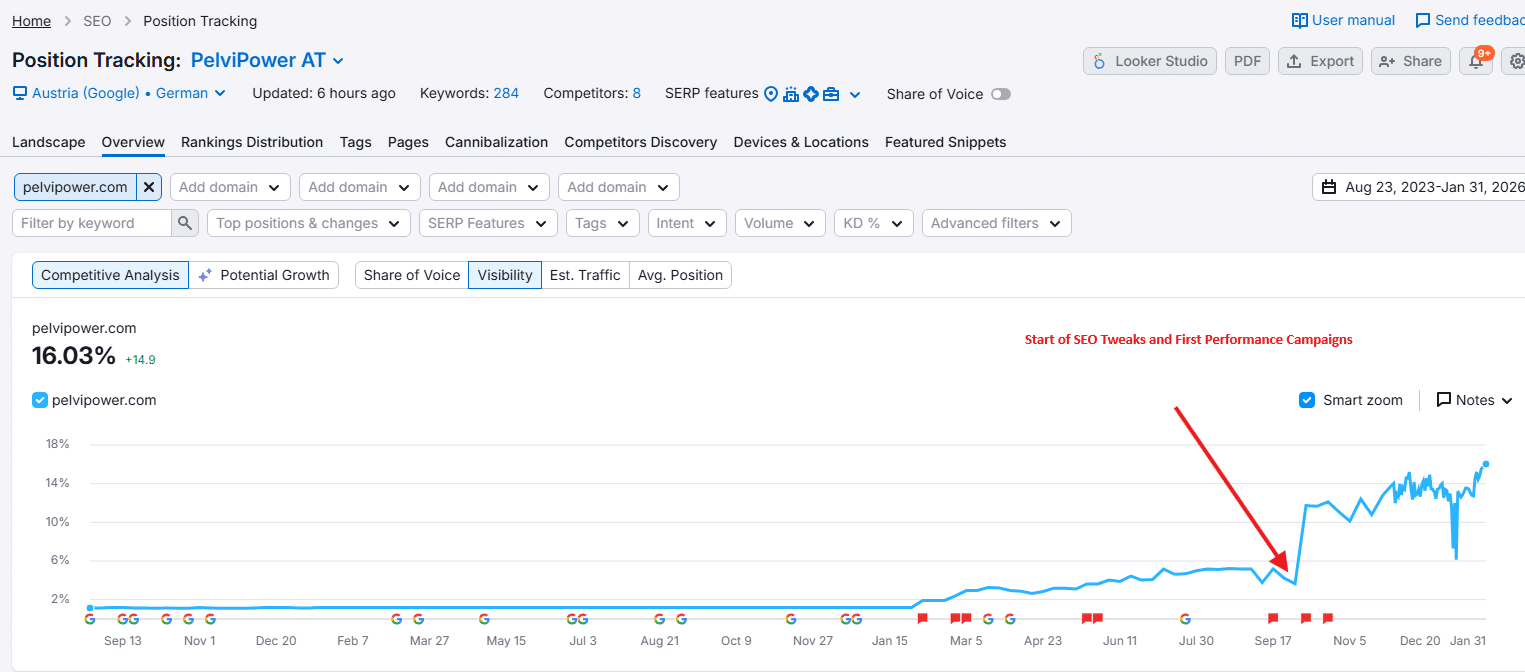
    ```json
{
  "alt": "SEO position tracking graph for pelvipower.com showing visibility trends from August 2023 to January 2026.",
  "caption": "Tracking SEO success: Pelvipower's visibility climbs with strategic tweaks and campaigns, showing a sharp increase in online presence.",
  "description": "This image displays an SEO position tracking graph for pelvipower.com, illustrating changes in search visibility from August 23, 2023, to January 31, 2026. Key events like the start of SEO tweaks and performance campaigns are marked, showing a significant increase in visibility. The graph indicates a rise from near 0% to over 16%, reflecting strategic adjustments in the site's SEO approach. Relevant for those analyzing competitive SEO growth and the impact of digital marketing strategies."
}
```

    Despite these challenges, early campaigns confirmed there was a demand. I realized that fixing the surrounding system was necessary to capitalize on this potential in the long run.

    By mid-2024, I shifted the focus to treating SEO as a central part of our revenue strategy rather than an additional enhancement. Rather than chasing quick rankings, we prioritized building authority in pelvic health. Our strategy involved educational content, mapping out the entire informational landscape around pelvic health issues.
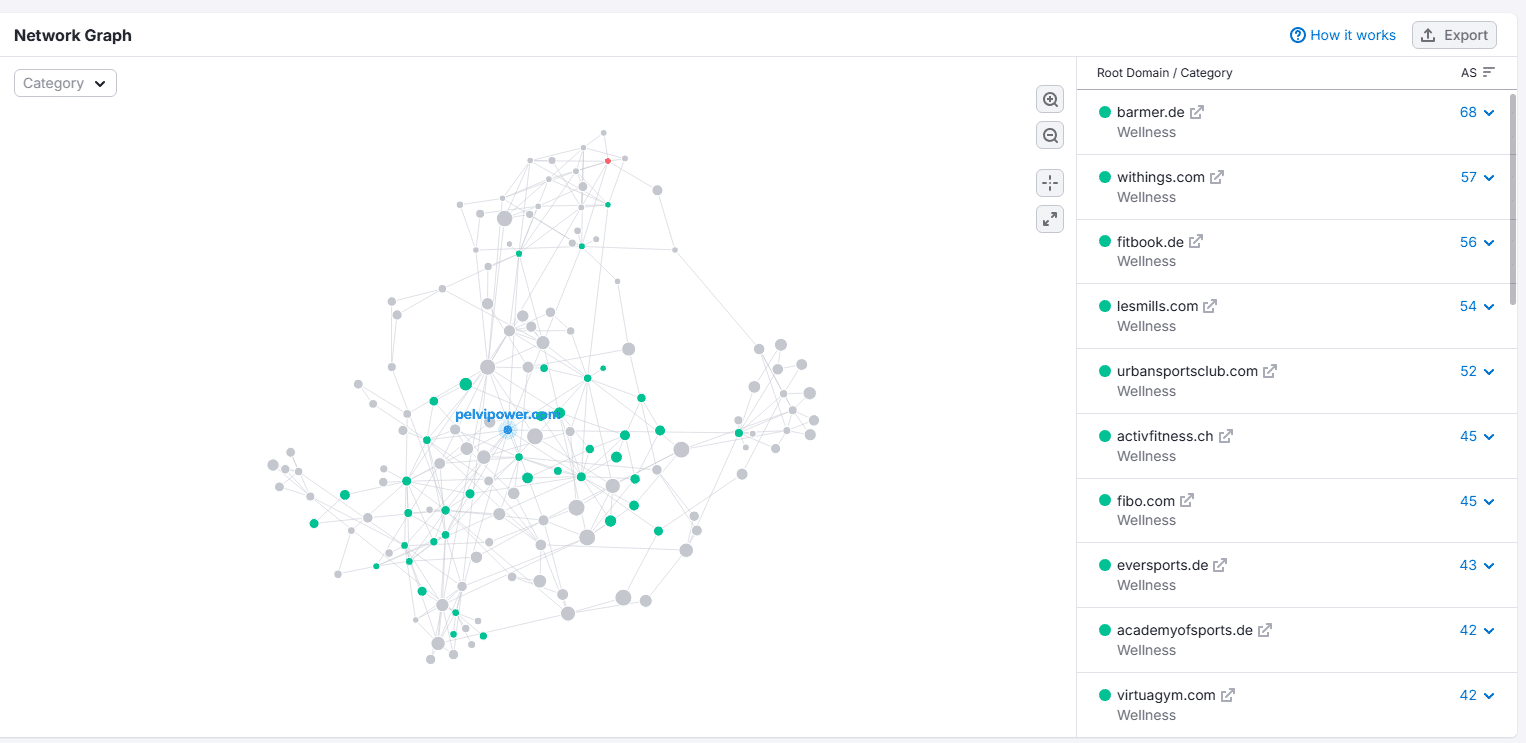
    ```json
{
  "alt": "Network graph showing interconnected nodes with a list of wellness domains on the right.",
  "caption": "Explore the intricate web of connections in this network graph, highlighting relationships among wellness domains.",
  "description": "This image displays a network graph with interconnected nodes, illustrating various relationships and connections. The nodes vary in size and color, indicating different categories or levels of connectivity within the graph. On the right, a list of wellness domains such as 'barmer.de' and 'withings.com' is presented, each associated with a connectivity score. This visualization aids in understanding complex relationships in a data set, ideal for analyzing wellness-related domains and their interactions. Keywords: network graph, connections, wellness domains."
}
```

    Our shift paid off. We invested in long-form content, structured it well, and embedded supporting visuals. This approach transformed us into a trusted resource over time and improved our credibility, which is essential in medical markets.

    Our biggest success came from leveraging partnerships with clinics and medical professionals. Providing ready-to-use content allowed us to establish valuable backlinking opportunities in exchange for using our resources. These links enhanced our visibility and authority in healthcare sectors.
    ```json
{
  "alt": "Screenshot of keyword rankings overview showing search terms related to pelvic floor chairs with their respective metrics.",
  "caption": "An insightful glance at keyword performance metrics for various search terms related to pelvic floor chairs, illustrating potential traffic and ranking positions.",
  "description": "This image displays a rankings overview for keywords like 'beckenboden behandlung stuhl' and 'beckenbodentrainer stuhl'. It highlights metrics such as potential traffic and keyword difficulty. The table captures changes in positional rankings between January 2 and January 31, emphasizing keywords with significant traffic growth. This analysis helps in understanding the SEO performance and visualization of keyword optimization strategies."
}
```

    Ultimately, this strategy resulted in a manifold increase in referring domains and significantly boosted our topical authority. Our backlinks were closely aligned with Google’s assessment of expertise and trust.

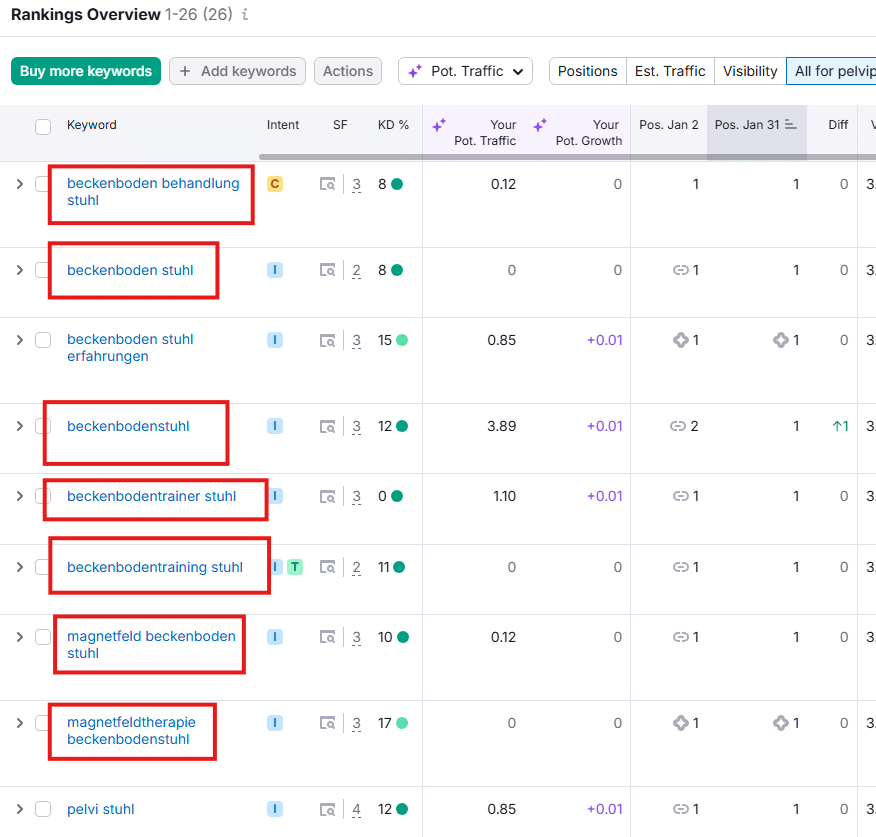
    By late 2024, our top rankings for crucial keywords like ‘Beckenbodenstuhl’ clearly demonstrated our growing organic visibility. Prospects repeatedly encountered our brand in their research phase, reinforcing trust even before they saw our ads.
    ```json
{
  "alt": "Table showing ad groups with status and interaction rates, highlighting certain percentages.",
  "caption": "Paused campaigns with notable interaction rates. Discover which ad groups stood out with impressive engagement!",
  "description": "This image displays a table of ad groups with columns for status and interaction rate. The status is 'Nicht aktiv' indicating paused campaigns. Several interaction rates are highlighted in red and black, emphasizing their significance. Keywords: ad groups, interaction rate, paused campaigns, marketing analytics."
}
```

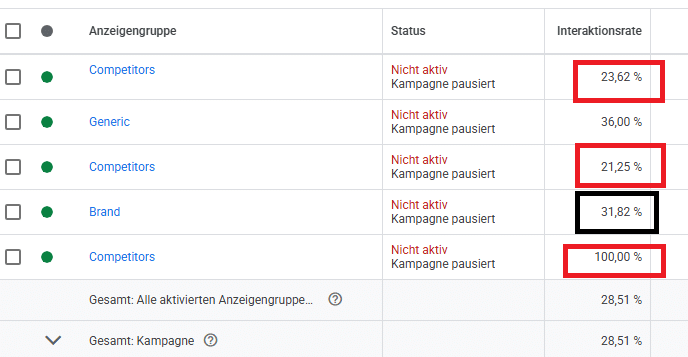
    Our organic presence also reshaped how users engaged with our ads. Familiarity bred trust, and many users chose our advertisements due to previous organic encounters. This effect was even more pronounced in competitor-specific campaigns, where we achieved high click-through rates.

    Improving conversion tracking was the next game-changer. Moving away from standard GA4-imported conversions to GTM-native events allowed us to get faster and cleaner signals, optimizing bidding algorithms effectively.

    Integrating our HubSpot CRM closed the loop between marketing and sales. We tracked not only the quantity of leads but also their quality, feeding this data back into our Google Ads to optimize really meaningful outcomes.

    With $12,000 in ad spend during 2025, our integrated SEO and PPC strategy led to impressive growth. In just two years, we observed a 140% sales increase from 2023-2024, followed by another 79% in 2025. This equated to a fourfold growth in our sales volume fueled by digital marketing.

    The key to scaling PPC lies in trust and quality signals, underscored by sound SEO practices. It’s not about one-off optimizations but a holistic system that includes aligned SEO, precise tracking, and insightful CRM feedback.

    Complex markets don’t fail because the strategies are wrong; they fail due to incorrect assumptions about simplicity solving complexity.


    Inspired by this post on Search Engine Land.


    crushpress.ai community screenshot
  • Boost Local SEO: Fix Your Google Map Pin for Better Rankings

    Boost Local SEO: Fix Your Google Map Pin for Better Rankings

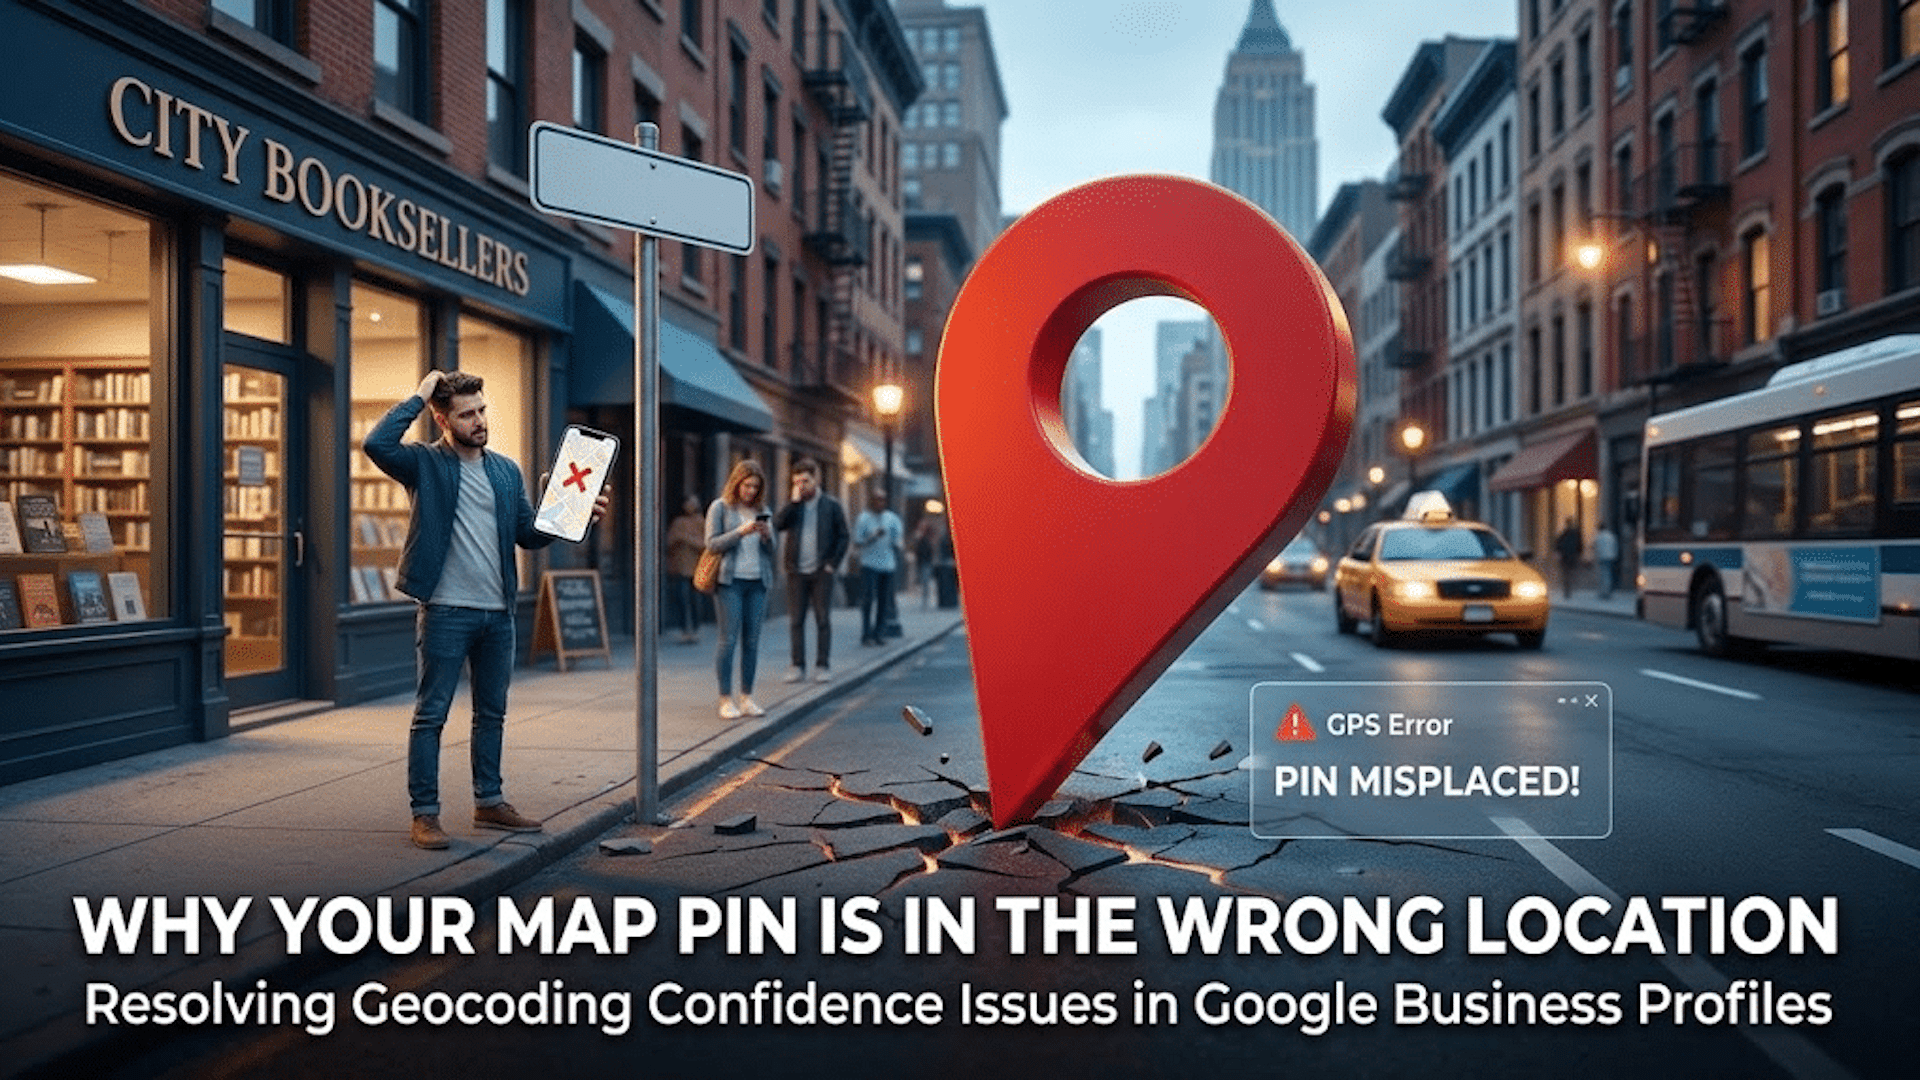
    Your local business rankings might be suffering, and surprisingly, it could all be due to your map pin. Google’s placement of your business on their map significantly impacts your visibility, and addressing hidden addresses and setup issues is crucial.

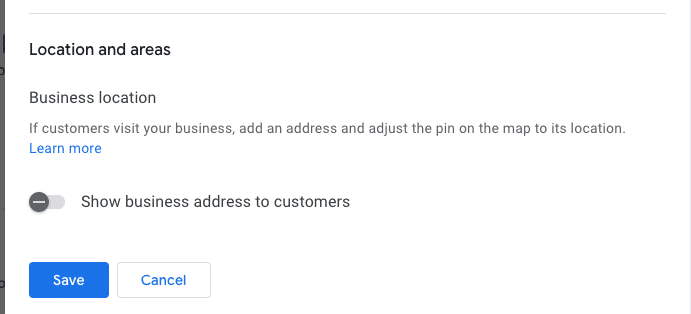
    I’ve often found myself engrossed in the ongoing debate within the local SEO community about the ‘hide address’ toggle for service area businesses (SABs). Many business owners consider this option a mere privacy setting, but it’s much more—a decision that affects how Google’s algorithm perceives your physical relevance.

    ```json
{
  "alt": "Settings interface for business location visibility with toggle option and save button.",
  "caption": "Easily manage the visibility of your business address with a simple toggle switch. Options to save or cancel changes make location management straightforward.",
  "description": "The image displays a digital settings interface focused on business location visibility. It features a toggle switch labeled 'Show business address to customers,' which is turned off. Below the toggle are 'Save' and 'Cancel' buttons for submitting changes. This screenshot is relevant for understanding business location management settings in online profiles or platforms. Keywords: business location, settings interface, visibility toggle, save button."
}
```

    Here are some questions to consider:

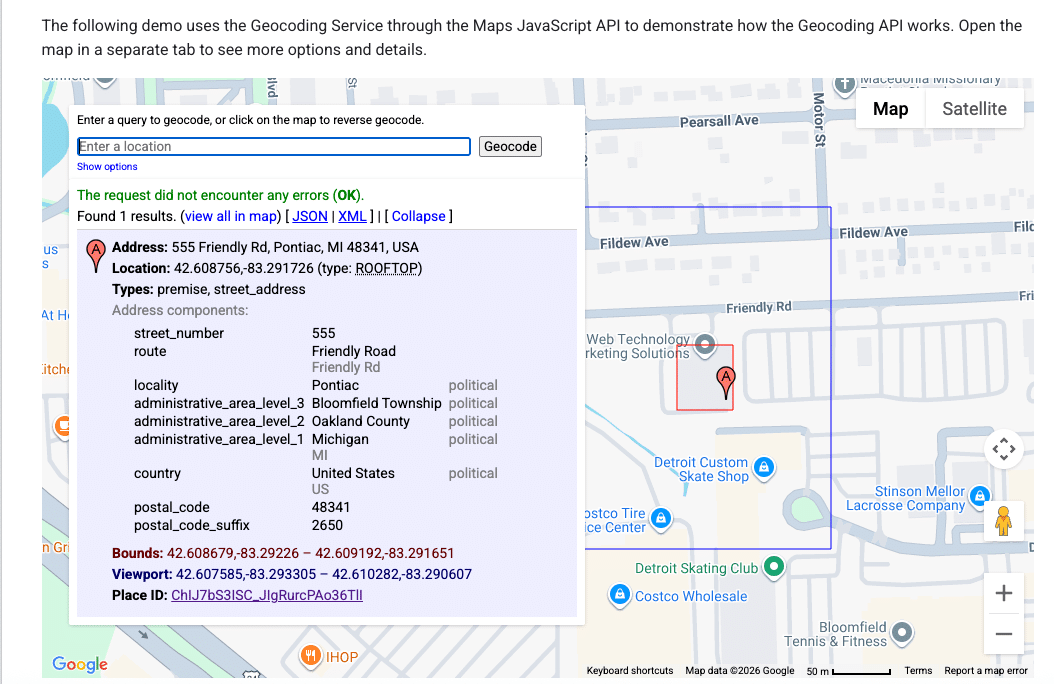
    ```json
{
  "alt": "Geocoding service demo using Maps JavaScript API with address details and location on map.",
  "caption": "Explore the Maps JavaScript API with this geocoding demo, showcasing address details for 555 Friendly Rd, Pontiac, MI.",
  "description": "This image displays a geocoding service demo using the Maps JavaScript API. It highlights the detailed address of 555 Friendly Rd, Pontiac, MI 48341, USA. The interface shows the address components, coordinates (42.608756, -83.291726), and a map section indicating the location. The demo explains how to use geocoding for retrieving precise address information and viewing it on a map with options for different data formats like JSON and XML."
}
```
    • Does your defined service area affect your ranking?
    • Does hiding your street address impact your visibility in the local pack?
    • Is Google erasing that data, or does your map pin become an invisible anchor?
    ```json
{
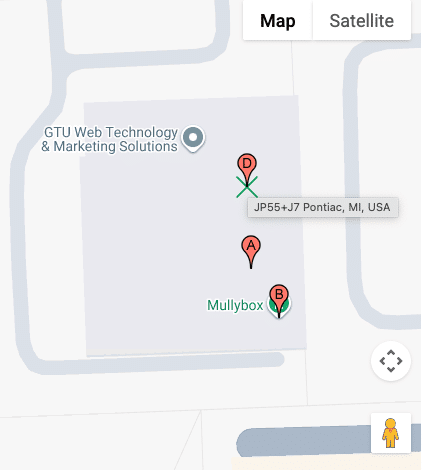
  "alt": "Map showing GTU Web Technology & Marketing Solutions and Mullybox with pinpoints in Pontiac, MI.",
  "caption": "Discover the location of GTU Web Technology & Marketing Solutions and Mullybox in Pontiac, MI, with this detailed map view.",
  "description": "This image displays a map highlighting GTU Web Technology & Marketing Solutions and Mullybox in Pontiac, MI. The map features pinpoints indicating specific locations labeled A, B, and D. The area is shown in a standard map view with street outlines and an overlay for easy navigation. This visual guide can help users find exact locations and understand the surrounding layout in Pontiac. Keywords: map, GTU Web Technology & Marketing Solutions, Mullybox, Pontiac, MI, location."
}
```

    These are foundational questions in understanding how proximity works when you choose to ‘hide’ on the map.

    ```json
{
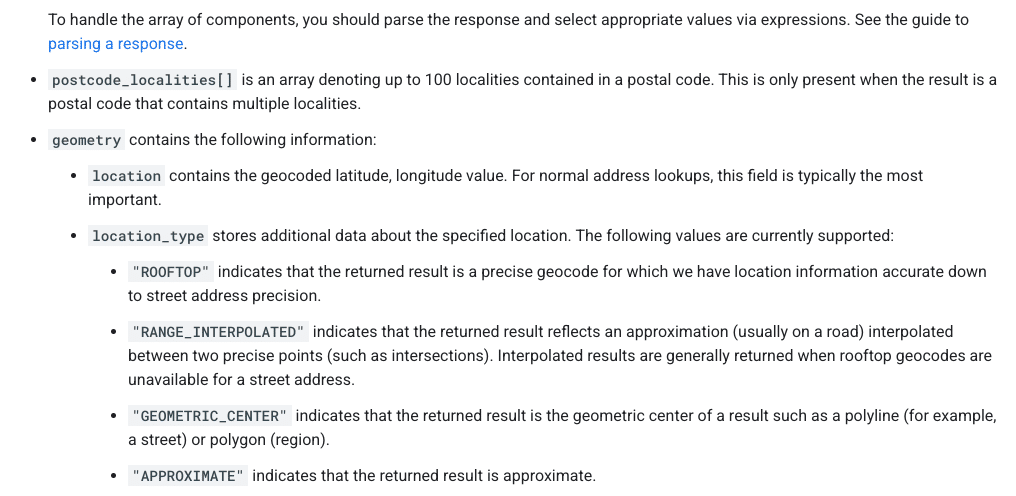
  "alt": "Guide on parsing response components with types like ROOFTOP and APPROXIMATE.",
  "caption": "Understanding Geocode Location Types: Dive into the specifics of parsing response components from postal code localities to precise geocodes.",
  "description": "This image provides detailed guidance on parsing response components in geolocation data. It highlights how to interpret arrays like postcode_localities, and explains geometry details that include location types such as ROOFTOP, RANGE_INTERPOLATED, GEOMETRIC_CENTER, and APPROXIMATE. This is crucial for understanding accuracy and the precision of geocoding results, aiding in effective data handling and utilization."
}
```

    How Google Determines Your Map Pin

    ```json
{
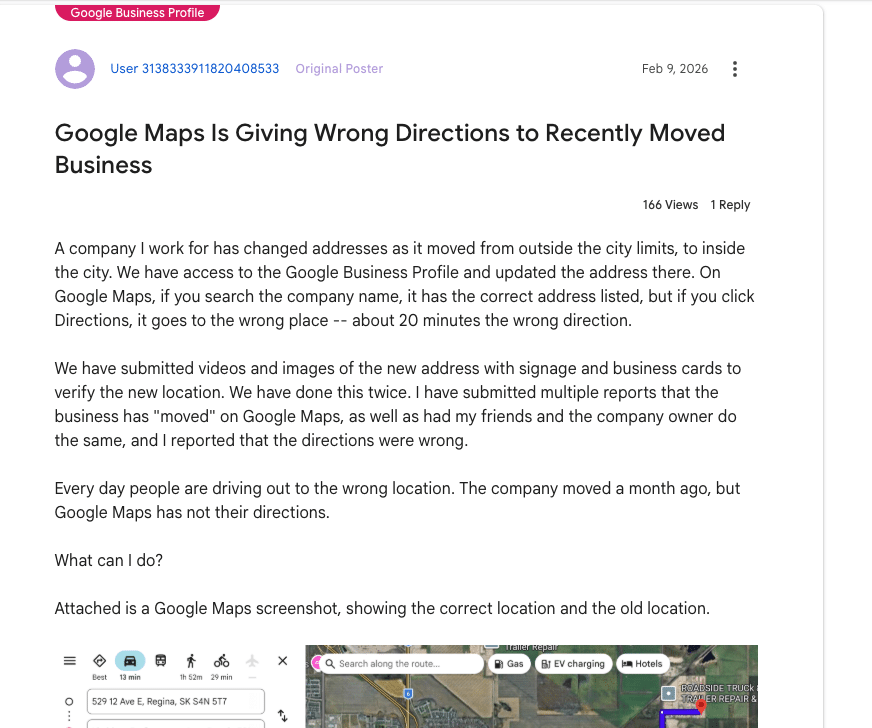
  "alt": "Forum post discussing Google Maps giving wrong directions after business address change.",
  "caption": "Frustration mounts as a business struggles with incorrect Google Maps directions following an address change, causing customers to get lost.",
  "description": "The image shows a forum post about issues with Google Maps providing incorrect directions to a business after its address change. Despite updating Google Business Profile, the directions lead 20 minutes off. Attached is a Google Maps screenshot indicating both old and new locations. The post has had 166 views and 1 reply, highlighting the frequent errors with directions and the efforts taken to rectify the situation."
}
```

    It’s essential to know that your address and map pin are not the same. Entering an address into your Google Business Profile doesn’t just place a pin; it’s processed through Google’s geocoding engine, comparing it against their database.

    ```json
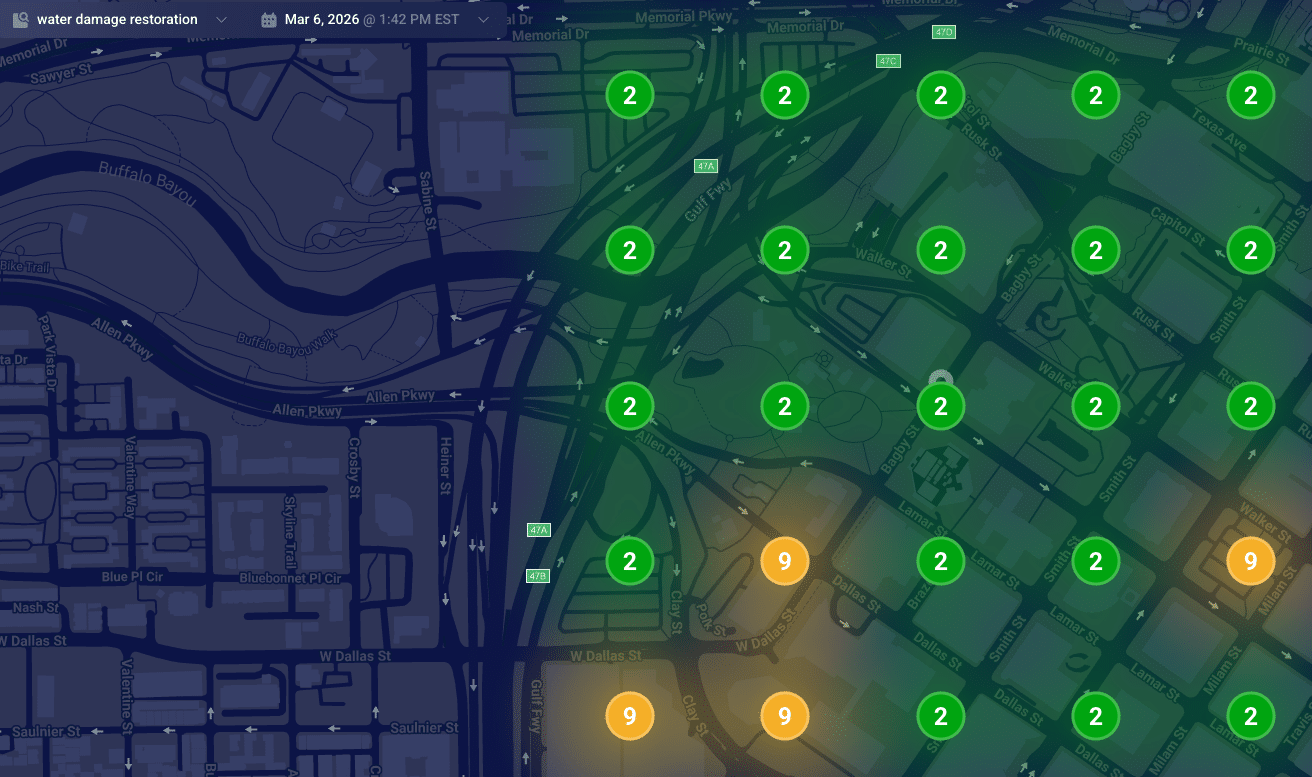
{
  "alt": "Heat map visualization of water damage restoration needs in an urban area, showing numbered zones with color coding.",
  "caption": "Explore this dynamic heat map illustrating water damage restoration priorities across a city with distinct color-coded zones.",
  "description": "This image represents a heat map of water damage restoration needs in an urban area on March 6, 2026, at 1:42 PM EST. The map features a darkened city street layout with numbered circular zones indicating priority levels. Green circles with the number '2' indicate low priority areas, while orange circles marked with '9' highlight higher urgency zones. This visualization aids in strategic planning for restoration services."
}
```

    Understanding Google’s data models is key to understanding why your pin might be misplaced:

    ```json
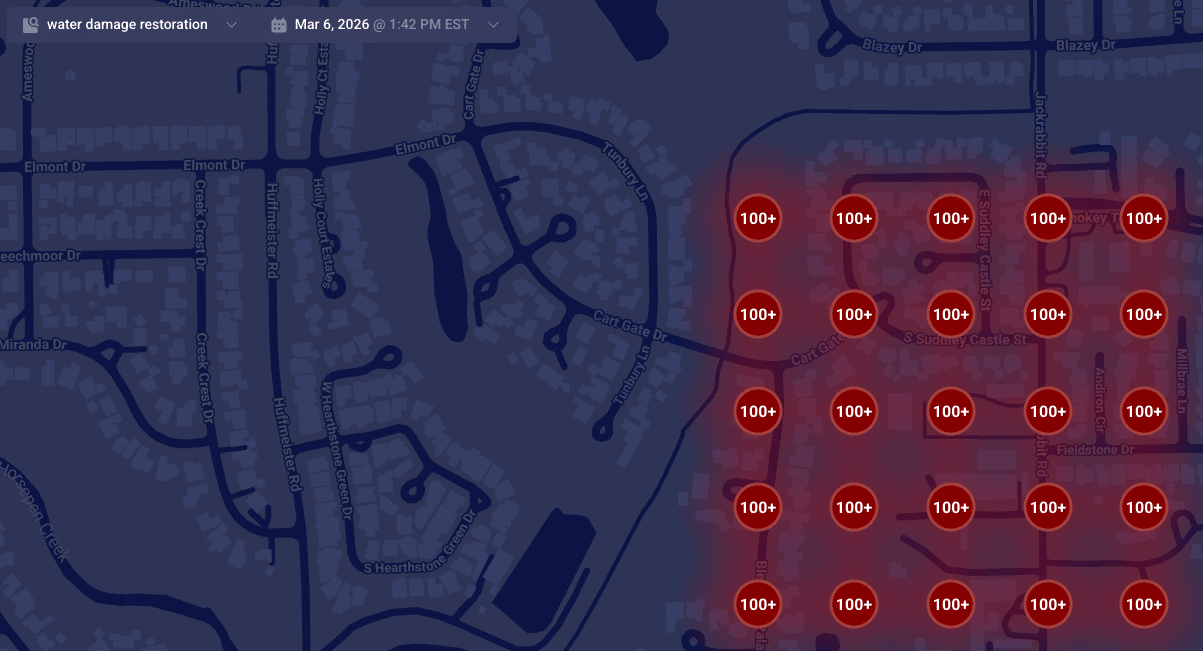
{
  "alt": "Map highlighting areas with over 100 instances of water damage restoration services.",
  "caption": "A map visualization displaying clusters of water damage restoration needs, with over 100 cases highlighted in red.",
  "description": "This map illustrates a dense concentration of water damage restoration demands in a residential area. Red circles marked with '100+' indicate regions with over 100 service instances. The map is set against a dark background, featuring roads and street names for context. This visualization aids in identifying service hotspots, essential for targeting restoration efforts efficiently."
}
```
    ```json
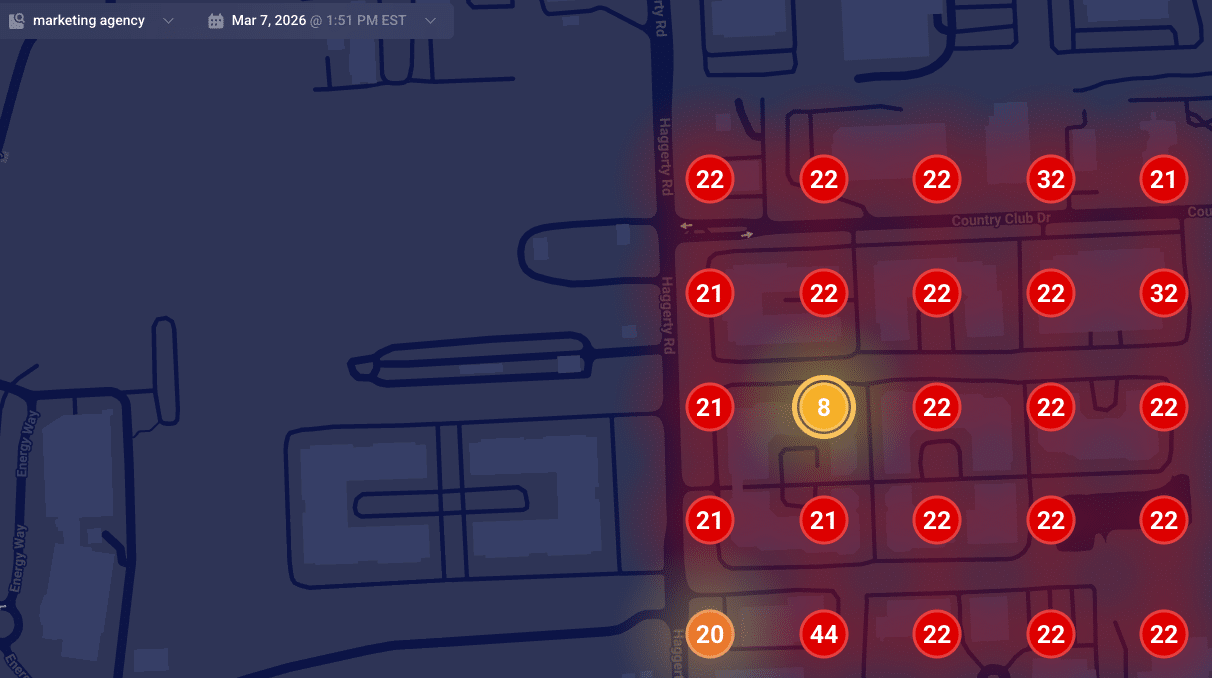
{
  "alt": "Heatmap showing numerical data points on a dark map layout.",
  "caption": "A vibrant heatmap reveals numerical trends across a dark-themed map, spotlighting key data points for insightful analysis.",
  "description": "This image showcases a heatmap overlaid on a map, displaying various data points marked with numbers. The numbers, like 8, 22, and 44, are highlighted within colored circles ranging from yellow to red, indicating varying data intensities. Designed for data visualization, it suggests a real-time analysis function, useful for trend analysis or strategic planning. The heatmap context is set against a dark map background, enhancing the visibility of the highlighted data points."
}
```

    When Google finds a reliable match, they place your pin accurately at your building’s rooftop. Understanding how these data models work can help explain why SABs sometimes rank differently in local searches.

    ```json
{
  "alt": "Map displaying high-density markers with '100+' in a red shaded area across various streets.",
  "caption": "This heat map reveals a high concentration area, with red-marked zones indicating significant density across streets like Pearsall Ave and Fildew Ave.",
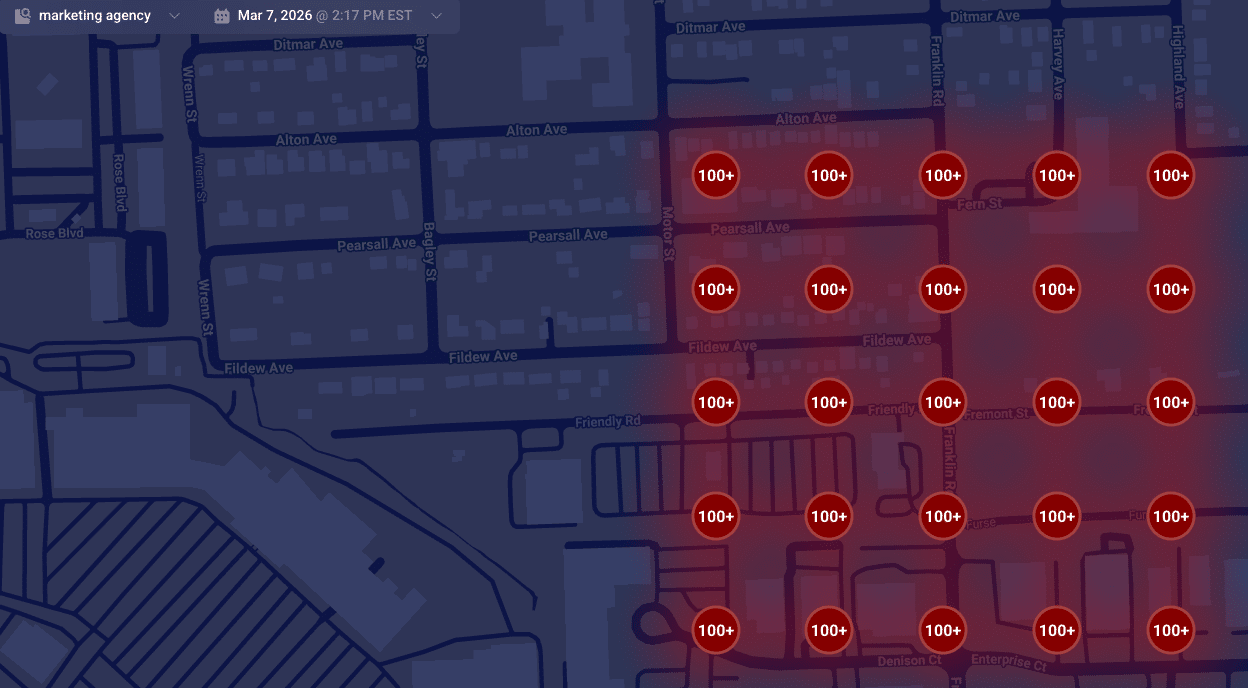
  "description": "The map illustrates a geographic area with a high concentration of points marked '100+', shaded in red to indicate density. Streets such as Pearsall Ave, Fildew Ave, and Motor St are visible, providing a visual representation of congestion or population density. The interface is dated March 7, 2026, at 2:17 PM EST, possibly generated by a marketing agency tool, useful for spatial analysis or resource planning."
}
```

    Is Your Map Pin Placement Accidental?

    Don’t be mistaken, it’s not a bug but a failure in converting text to precise map coordinates. When this fails, your business may end up with a map pin that’s misplaced, affecting your local ranking authority.

    When unable to secure a high-confidence match from your building, Google defaults to using the city’s center as your pin’s fallback location, often causing your business to rank from a less relevant area.

    Suite Number Issues

    I’ve warned clients countless times about the pitfalls of including suite numbers in Address line 1. These numbers aren’t street-level data; embedding them can lead to geocoding conflicts, making your map pin default to a broader location like a city center.

    Properly Anchoring Your Map Pin

    For accurate map pin placement, ensure your address in Google’s system is geocoding-friendly. Keep unnecessary details out of the first address line and verify how Google reads your address using their developer tools.

    When addressing geocoding problems, prepare for possible re-verification requests. Stay consistent in your corrections until Google verifies your business’s precise location.


    Inspired by this post on Search Engine Land.

    crushpress.ai community screenshot
  • Unveiling Google’s March 2026 Core Update: What You Need to Know

    Unveiling Google’s March 2026 Core Update: What You Need to Know

    I just found out that Google has officially rolled out its much-anticipated March 2026 core update. This marks the inaugural core update of 2026, closely following the recent March 2026 spam update and February 2026 Discover update.

    Google made the announcement today, confirming the start of the rollout. They mentioned this process could stretch out over two weeks. I find it fascinating how these updates play a pivotal role in shaping search algorithms and ultimately influence how content is surfaced on Google.

    What Google is saying. In an update on their Search Status Dashboard, Google stated: “Released the March 2026 core update. The rollout may take up to 2 weeks to complete.” They also took to LinkedIn to emphasize that this is a regular update focused on showcasing relevant and satisfying content for searchers across various sites, reiterating the two-week completion window.

    About core updates. Google’s core updates happen several times annually and bring broad alterations to search algorithms and systems. While we expect some updates, they surprised us by adding some smaller, unannounced changes. The anticipation of frequent updates didn’t quite pan out as we thought.

    What to do if you are hit. If your site takes a hit from this core update, Google hasn’t provided any new guidance, but in previous instances, they’ve advised us to focus on creating helpful content. They stress there’s no specific action to swiftly rectify any negative impact; however, recovery could occur gradually with subsequent core updates.

    In summary, Google’s enduring guidance remains: create content for people, not just search engines. There’s nothing extraordinary creators need to do for this update as long as they provide gratifying content meant for users. If rankings slip, Google encourages looking through their helpful content guidelines.

    For comprehensive details about Google’s core updates, Google’s technical documentation provides in-depth information.

    Previous core updates. Let’s have a quick glance at some recent core updates. The December 2025 update began on December 11 and wrapped up by December 29. Similarly, the June 2025 update ran from June 30 to July 17. It’s intriguing to see these timelines and their impact on content visibility across Google’s domain.

    Why we care. Every core update brings a ripple effect to Google’s search results and rankings. I view these updates as opportunities—some of us might see a beneficial shift in rankings and search visibility, while others may need to adapt to new fluctuations. I sincerely hope this update benefits your efforts, boosting both traffic and conversions.


    Inspired by this post on Search Engine Land.

    crushpress.ai community screenshot
  • Explosive Growth: Automated Traffic Surpassing Human Activity

    Explosive Growth: Automated Traffic Surpassing Human Activity

    I recently came across an intriguing report by HUMAN Security revealing a seismic shift in internet traffic dynamics. Automated traffic is accelerating at a staggering rate, outpacing human traffic growth by eightfold. Machines aren’t just passively scrolling; they’re actively engaging online!

    In 2025, automated traffic surged by 23.5% compared to the previous year, while human traffic increased by a mere 3.1%. This data, outlined in the State of AI Traffic report, paints a compelling picture of our digital evolution.

    AI-driven traffic is spearheading this transformation, with its monthly volume skyrocketing by 187% year over year. Notably, AI agents and agentic browsers, such as OpenAI’s Atlas and Perplexity’s Comet, experienced an astonishing growth of nearly 8,000%!

    As defined in the report, automated traffic encompasses all internet activity generated by software systems rather than humans. This includes classic automation like search engine crawlers and monitoring bots, as well as more sophisticated AI-driven traffic.

    Matthew Prince, Cloudflare’s CEO, foresaw this trend, predicting that bots might overtake human web usage by 2027. A bold forecast, but one that seems increasingly plausible.

    Why we care. The landscape of search is evolving beyond mere human interaction. AI agents now delve into discovery, comparisons, and transactions, dynamically influencing Google’s evolving results and other AI-powered interfaces.

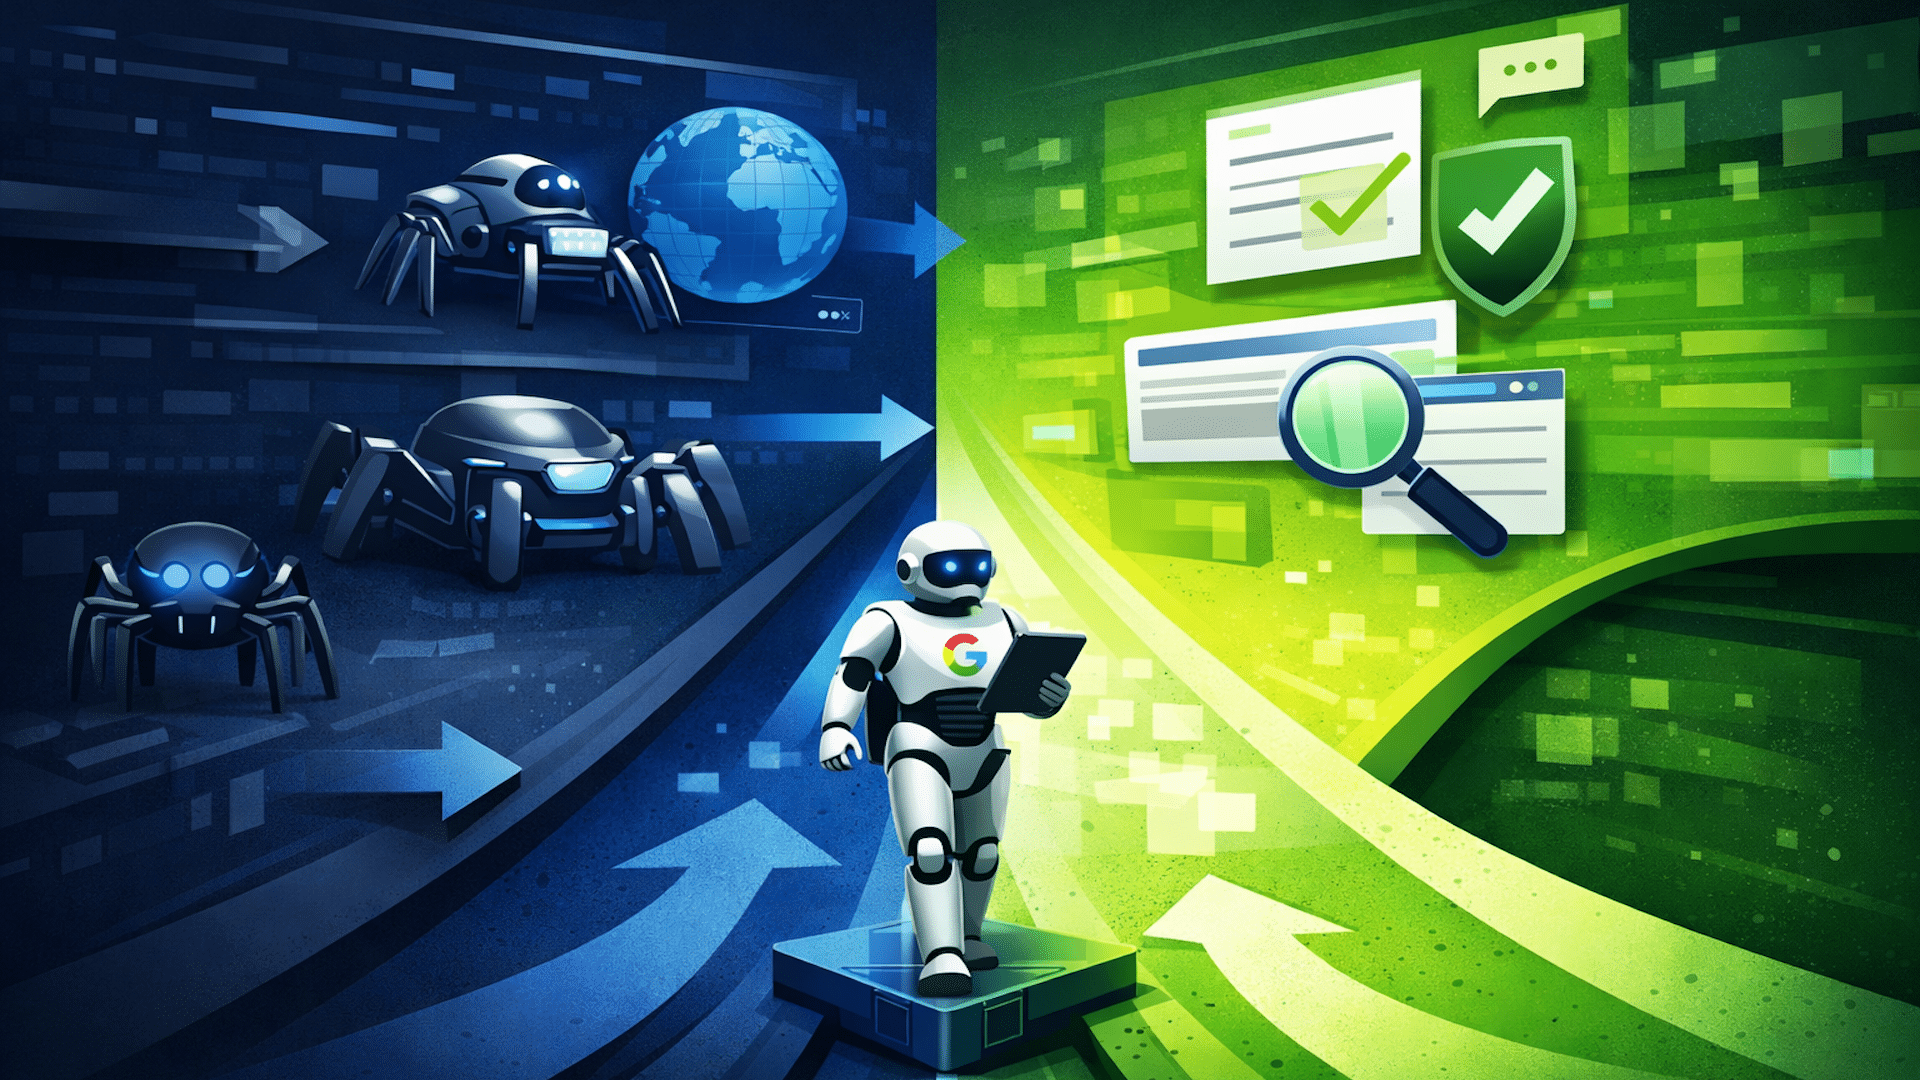
    The details. HUMAN categorizes AI-driven traffic into three main types:

    1. Training crawlers, which still dominate AI traffic at 67.5%, though their lead is waning as scrapers and agents gain traction.

    2. Real-time scrapers, which are essential for AI searches and live answer engines, boosted by nearly 600% in 2025.

    3. Agentic AI systems, which autonomously execute tasks, are smaller in share but growing rapidly and proving to be highly disruptive.

    AI agents behave more like users. These systems are becoming more sophisticated, engaging in navigation, logging in, and conducting transactions. In 2025:

    – 77% of agentic activity was observed on product and search pages.

    – Close to 9% involved account-level interactions.

    – Over 2% reached checkout processes.

    About the data. HUMAN examined over a quadrillion interactions from 2022 to 2025, using aggregated, anonymized data from its customers. The report classified AI-driven traffic into three categories using user-agent strings, infrastructure signals, and activity characteristics. However, self-reported bot identities may not fully capture AI-driven activity.

    Bottom line. The digital world is shifting from being solely human-focused. Discovery is no longer restricted to search engines. Optimizing content now involves deciding which machines can access and act upon it.

    The report. For deeper insights, you can check out the 2026 State of AI Traffic & Cyberthreat Benchmark Report.


    Inspired by this post on Search Engine Land.

    crushpress.ai community screenshot
  • Discover Google-Agent: Revolutionizing AI Traffic Tracking

    Discover Google-Agent: Revolutionizing AI Traffic Tracking

    I’ve recently come across news about a fascinating development from Google: the introduction of the Google-Agent user agent. It’s designed to signal when AI agents complete tasks on behalf of users, marking a significant step towards AI-driven web interactions. I’m eager to share what I’ve learned about this new feature and its implications.

    What Happened: Google added Google-Agent to its collection of user-activated fetchers on March 20, and it’s currently rolling out gradually. This intrigued me because it means a novel way of tracking AI interactions is becoming available to us.

    The Google-Agent user agent identifies requests made by AI programs running on Google’s infrastructure, which includes experimental tools like Project Mariner. It’s fascinating to see how advanced Google is getting in this space.

    How It Works: Google-Agent appears in HTTP requests when an AI agent visits a site to complete tasks initiated by users. Imagine it like a helping hand behind the scenes, orchestrating internet tasks for us.

    For example, Google-Agent could be used for browsing pages, evaluating content, or performing actions like submitting forms. This differs from traditional crawlers like Googlebot that operate continuously without user prompts. It’s exciting to think about how this technology could evolve further.

    IP Ranges: Google has shared the IP ranges for its desktop agent, and notably for its mobile agent as well. This transparency is helpful as it allows us to better manage and identify website traffic.

    Why We Care: With this insight, I can now distinguish between traditional crawl activity and visits spawned by users through AI agents using server logs. This capability will enable me to track agent-assisted conversions, understand emerging user behaviors, and prepare for what might be called ‘agentic search’.

    What They’re Saying: According to Google’s announcement, “The Google-Agent user agent is rolling out over the next few weeks, and will be used by Google agents hosted on Google infrastructure to navigate the web and perform actions upon user request.” This statement makes me realize the potential impact on our digital interactions.

    What to Watch: While early volumes of activity may be low, now is the ideal time to establish a baseline. Monitoring logs for Google-Agent activity ensures I stay informed, and I need to ensure that my CDN and WAF configurations aren’t unintentionally blocking these IP ranges.

    Furthermore, it’s crucial for me to validate that key site actions, including forms and user flows, function smoothly for automated agents, ensuring an optimized experience for users.

    Dig Deeper: For those as curious as I am about this exciting development, here’s more insight into Google-Agent.


    Inspired by this post on Search Engine Land.

    crushpress.ai community screenshot
  • Unlock Unique Insights: Harness First-Party Data for Content Success

    Unlock Unique Insights: Harness First-Party Data for Content Success

    Have you ever wondered how to set your content apart in a competitive landscape? As a content marketer, I often face the challenge of using the same tools and data sources as everyone else, like Semrush, making it hard to create truly unique content.

    We are all casting our nets in the same pond, using identical resources to gather content ideas. The result? Overly similar content across the board. But there’s a smarter way.

    I realized that the wealth of data about my audience and customers is a goldmine, just waiting to be mined. These insights are invisible to my competitors, as they remain untouched and underutilized within my marketing team.

    I discovered how third-party tools often lead to an echo chamber of commoditized content. While essential, these tools don’t always align with what my specific audience is truly looking for, leading to a flood of generic content.

    Recognizing this challenge encouraged me to tap into my own data, creating content that appeals directly to people already interested in my services.

    First-party data is the information I need. It includes internal insights that only I have access to, such as site search queries, sales call transcripts, CRM data, support tickets, and email interactions.

    Let’s dive deeper into why this approach is effective. First-party data is proprietary. No matter how advanced a competitor’s tools might be, they can’t access my internal data, and this gives me a unique edge.

    This data reflects real buyer language, which helps me avoid assumptions based on my internal knowledge bias. I can tailor my content to match the language my audience uses.

    ```json
{
  "alt": "The CapmatchOne logo with a gradient circle and bold text.",
  "caption": "Discover innovation with the CapmatchOne logo, featuring sleek typography and a modern gradient circle.",
  "description": "The CapmatchOne logo features bold, modern typography coupled with a gradient circle, symbolizing connection and innovation. The sleek design conveys a sense of progress and creativity. This image can be used for branding or promotional purposes, appealing to audiences interested in innovative solutions and forward-thinking designs."
}
```

    By mapping this data to my entire marketing funnel, I fill gaps at every stage, driving not just traffic, but conversions and loyalty.

    How do I turn these insights into content ideas? I start with internal site searches. Examining how visitors use my site can reveal content gaps and opportunities for new offerings.

    Next, I analyze sales call transcripts and CRM data to uncover recurring themes and objections, crafting content that addresses potential buyers’ concerns directly.

    My support tickets provide another source of inspiration. By identifying common customer complaints, I create resources that help both my customers and support team.

    Lastly, I pay close attention to email replies and engagement metrics. Tracking which types of communication yield the greatest response helps me understand content preferences.

    Embracing first-party data helps my brand stand out. While competitors can mimic my content style, they can’t replicate these unique insights. Every week, I make it a point to explore a new data set and extract fresh content ideas.


    Inspired by this post on Search Engine Land.

    crushpress.ai community screenshot
  • How Clickout Media Transformed News Sites into Gambling Channels

    How Clickout Media Transformed News Sites into Gambling Channels

    I recently stumbled upon a report about Clickout Media, a company that’s notoriously transforming reputable news sites into hubs of AI-driven gambling content. Google refers to this practice as ‘site reputation abuse’. Essentially, it involves using legacy news brands, adding fabricated bylines, embedding casino links, and eventually abandoning these sites after they incur penalties from Google.

    According to PressGazette, Clickout Media has been buying sports, gaming, and tech sites only to pivot them from authentic editorial content to topics saturated with casinos and cryptocurrency. Former employees revealed that original reporting gets stripped and replaced with AI-generated articles that promote offshore gambling links.

    The approach leverages existing domain authority to manipulate Google rankings. Initially, legitimate content is maintained to preserve the site’s credibility. However, as time passes, gambling content takes over, with human writers being replaced by AI-generated articles and fake author profiles. The revenue stream mainly comes from affiliate deals with casino operators, often linked to player losses.

    It’s disheartening to see the impact—several previously active publications are now deindexed, with repercussions including layoffs and closures. Alarmingly, even charity websites have been repurposed to host gambling content.

    In Google’s view, publishing content at such a scale purely to manipulate rankings is a breach of their policies, labeled ‘site reputation abuse.’ This can result in manual actions and the removal of these sites from Google’s search index.

    As someone who cares about the integrity of SEO, it’s clear this isn’t search engine optimization in any authentic sense. It’s a blatant manipulation of reputation to deceive and gain at scale.

    For those interested in learning more, Rob Waugh has an in-depth report on this issue titled ‘The SEO Parasites Buying, Exploiting and Ultimately Killing Online Newsbrands’


    Inspired by this post on Search Engine Land.

    crushpress.ai community screenshot
  • Unlock the Power of GSC’s Branded Query Filter for SEO Success

    Unlock the Power of GSC’s Branded Query Filter for SEO Success

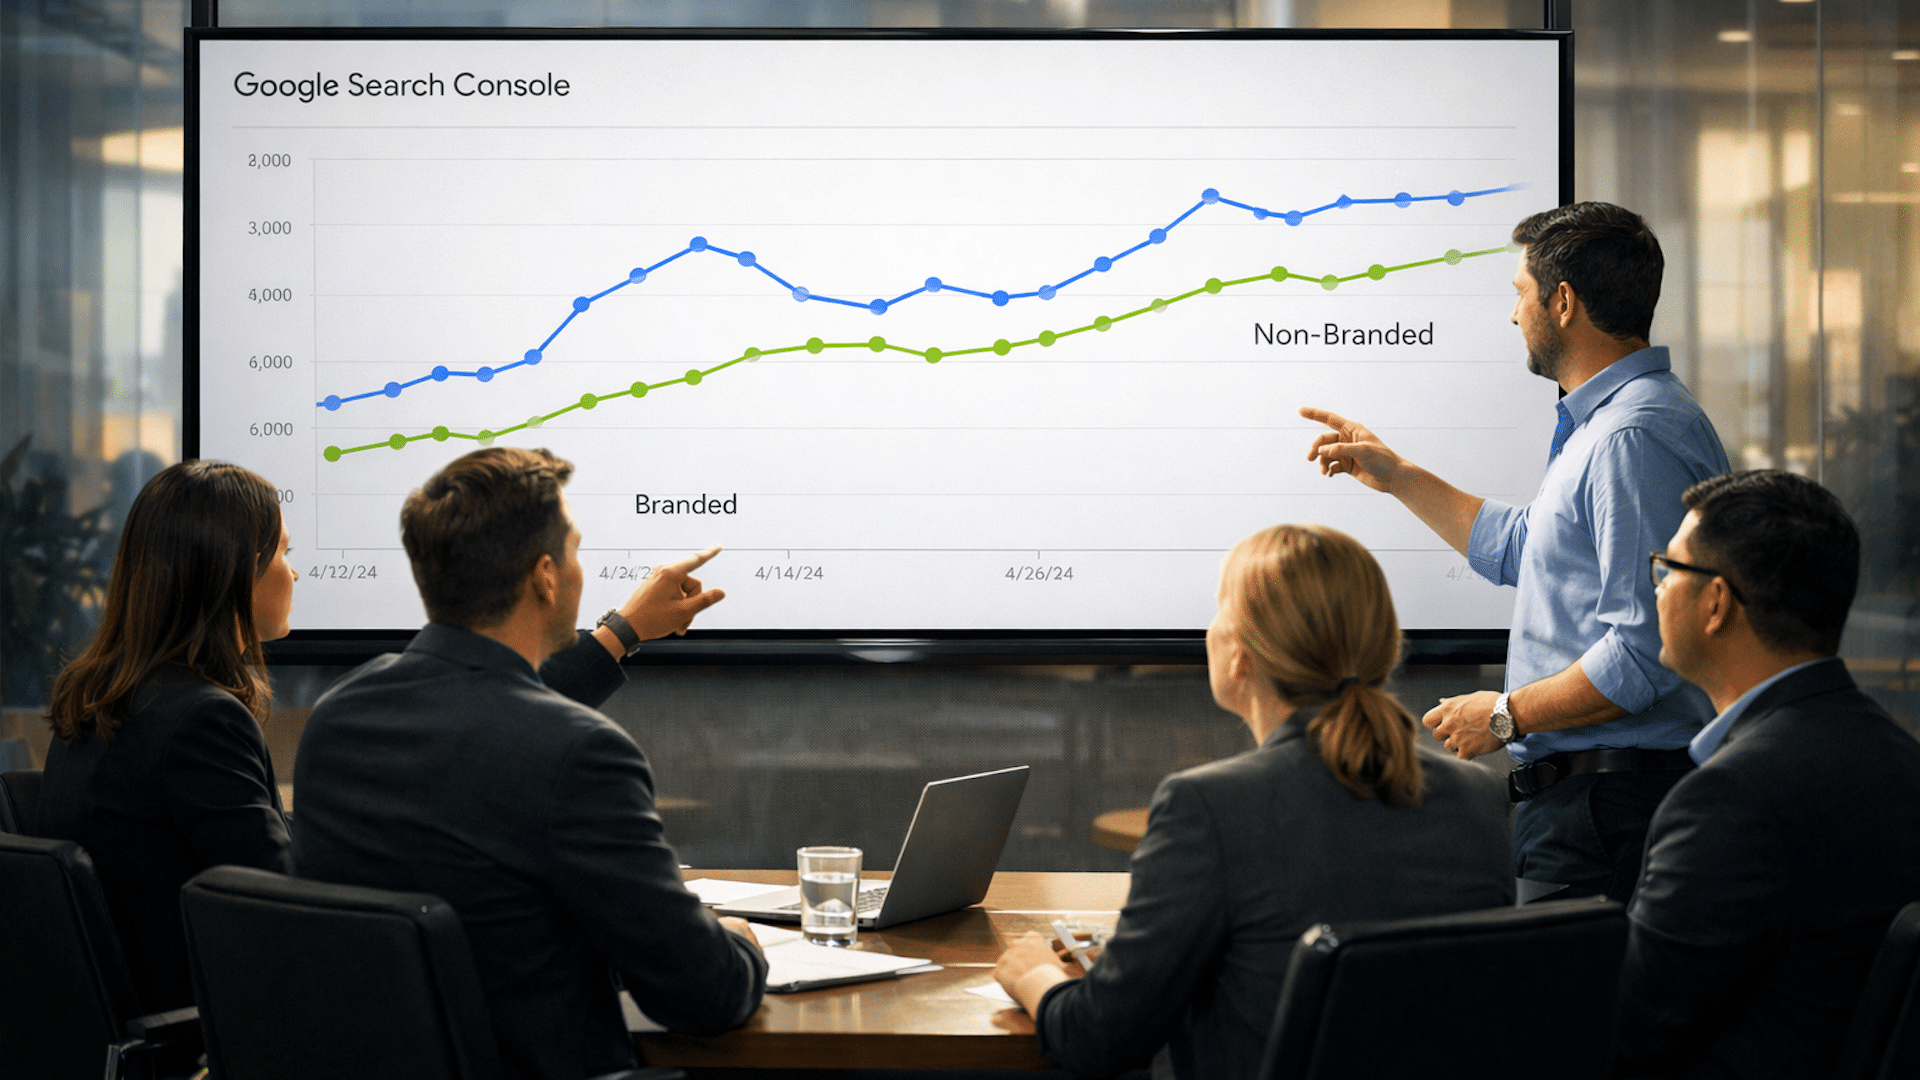
    I recently delved into Google Search Console’s branded query filter, which has become a game-changer for SEO reporting. This feature now allows me to track brand awareness, diagnose performance drops, and truly measure the impact of my SEO efforts.

    In November 2025, Google introduced a solution to a long-standing SEO challenge: the ability to distinguish branded from non-branded search performance directly within Google Search Console (GSC). The rollout is now complete for eligible properties, and I was ecstatic to try it out.

    For so long, I’ve had to rely on regex filters, custom dashboards, or third-party tools, which weren’t always reliable. But GSC’s branded query filter simplifies the process, positioning it as a native feature in a platform widely used for organic reporting.

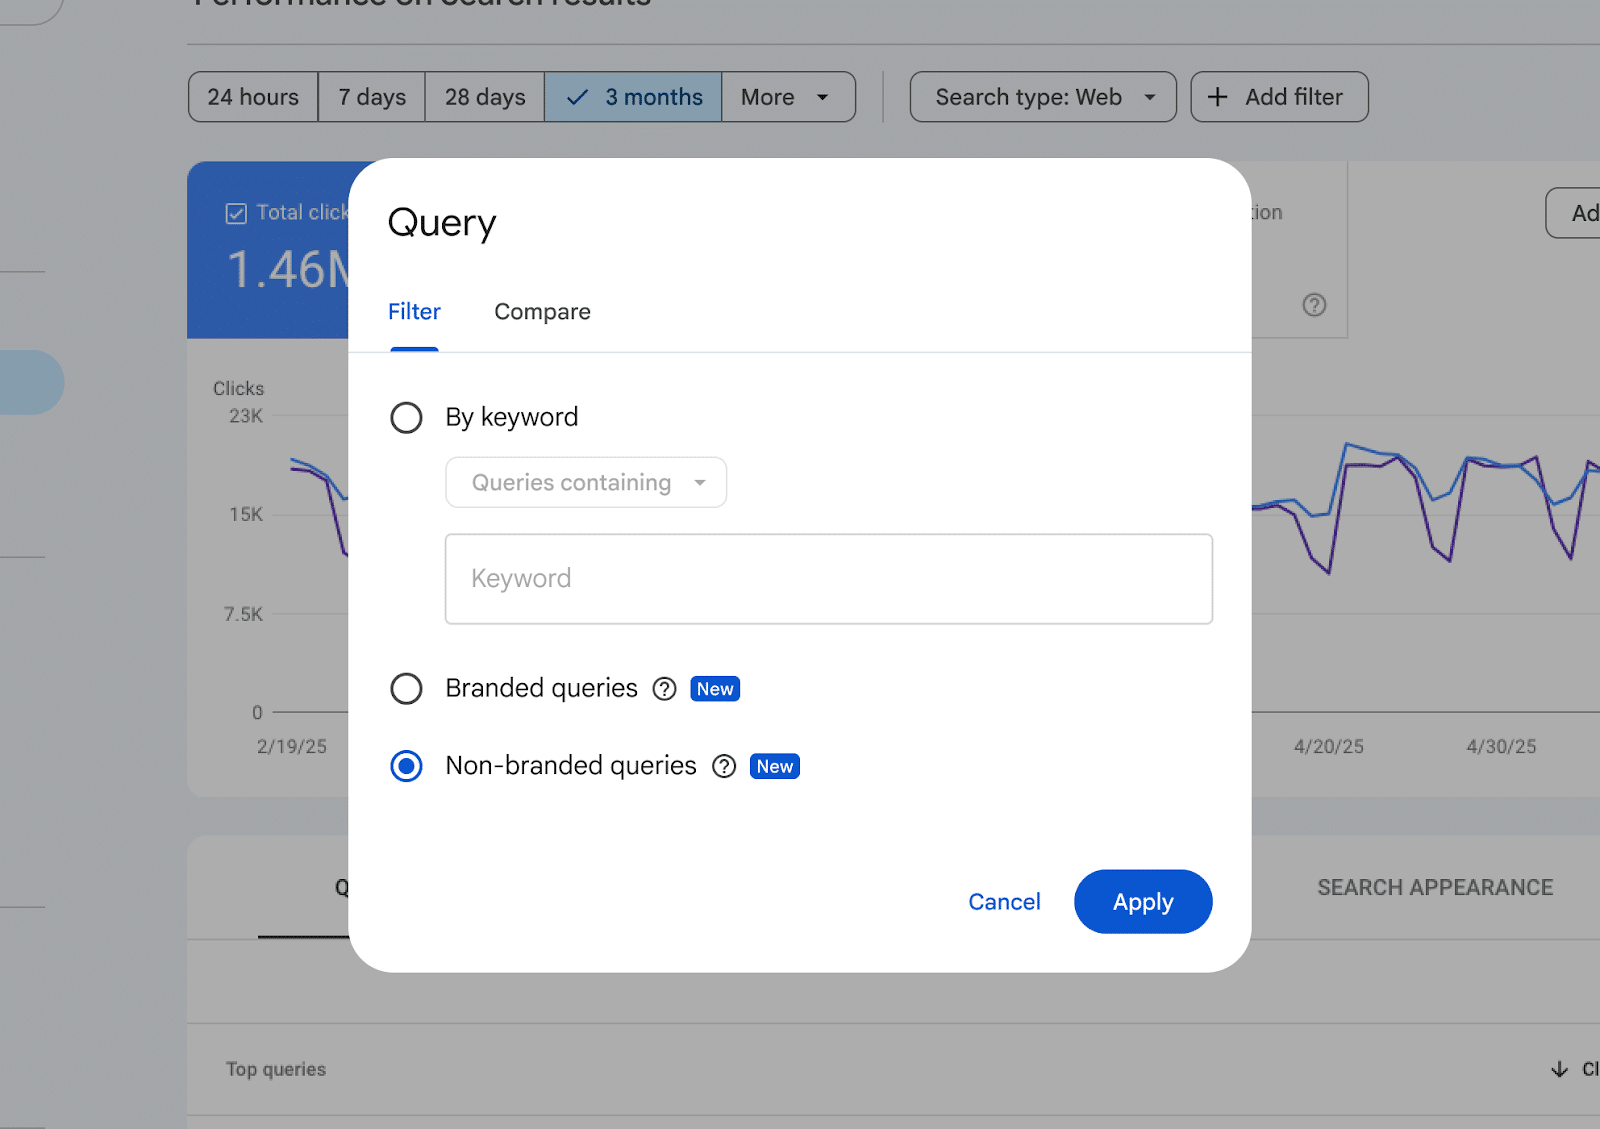
    ```json
{
  "alt": "Search query filter options in a web analytics tool showing filters by keyword and query type.",
  "caption": "Explore search query trends with detailed filters: select by keyword or focus on branded versus non-branded queries for insightful analysis.",
  "description": "The image displays a query filter interface in a web analytics tool, featuring options to filter by keyword and prioritize either branded or non-branded queries. The interface is overlaid on a chart displaying click data over time, illustrating performance metrics for search results. Keywords: web analytics, search queries, data filtering."
}
```

    This change makes it easier for me to close a crucial gap in SEO reporting. Now, I can independently evaluate brand demand and discovery, leading to improved performance analysis supported by first-party data.

    In essence, GSC’s new filter performs its function by sorting queries into two categories:

    ```json
{
  "alt": "The CapmatchOne logo with a gradient circle and bold text.",
  "caption": "Discover innovation with the CapmatchOne logo, featuring sleek typography and a modern gradient circle.",
  "description": "The CapmatchOne logo features bold, modern typography coupled with a gradient circle, symbolizing connection and innovation. The sleek design conveys a sense of progress and creativity. This image can be used for branding or promotional purposes, appealing to audiences interested in innovative solutions and forward-thinking designs."
}
```
    • Branded queries that include recognized brand terms.
    • Non-branded queries covering all other discovery queries.

    This filter is accessible directly via:

    ```json
{
  "alt": "Line graph and analytics showing changes in clicks, impressions, CTR, and position over time.",
  "caption": "Diving into the data: This graph reveals key changes in clicks, impressions, CTR, and average position over the last three months compared to last year.",
  "description": "The image displays a line graph depicting trends in total clicks, impressions, CTR, and average position. The graph compares the last three months to the same period last year, highlighting a 31.74% decrease in clicks and a 32.72% decline in CTR. Impressions show a slight increase of 1.42%. Keywords: analytics, data visualization, SEO metrics."
}
```
    • Performance > Search results > + Add filter > Query.
    • Query groups.
    • API-accessible data exports.

    These features empower me to group queries by topic or intent, filter by branded and non-branded types, and create detailed reports without external processing.

    ```json
{
  "alt": "Graph showing interest over time with fluctuating blue line and descending green trend line from 2024 to 2026 in the US.",
  "caption": "Dive into the trend: This graph illustrates the ups and downs of interest from 2024 to 2026, showing a notable decline overall despite several peaks.",
  "description": "This image depicts a line graph representing interest over time from October 2024 to January 2026 in the United States. A blue line captures the fluctuating interest levels, with notable peaks in early and late 2025. Meanwhile, a green arrowed line indicates an overall downward trend. The graph provides an insightful visual representation of interest dynamics during this period, reflecting both temporary spikes and a general decline."
}
```

    Historically, separating branded from non-branded performance wasn’t new but maintaining consistency was challenging. I used to manually segment with regex, keyword tagging in rank-tracking tools, or through custom dashboards.

    These methods worked but were fragile. Common issues included character limits on regex, language variants for international sites, and no shared standard for branded terms. With GSC’s update, I find these challenges largely eliminated.

    ```json
{
  "alt": "Line graph comparing branded and non-branded CTR over time, showing notable variance from October 2025 to January 2026.",
  "caption": "Exploring the dynamics of branded versus non-branded CTR, this graph reveals intriguing trends from late 2025 into 2026.",
  "description": "This line graph illustrates the comparison between branded and non-branded click-through rates (CTR) over a period from October 2025 to early January 2026. The vertical axis represents the percentage of CTR, ranging from 0% to 25%, while the horizontal axis shows the timeline. The graph demonstrates fluctuating rates, with branded CTR peaking notably around early 2026, while non-branded CTR remains relatively steady and low throughout the period. This visualization provides insights into the effectiveness of brand recognition on digital engagement metrics. Keywords: Branded CTR, Non-Branded CTR, Click-Through Rate, Digital Marketing Analytics."
}
```

    Branded traffic is crucial, being both a signal of brand awareness and a major source of conversions. However, when mixed with non-branded data, it skews the interpretation of SEO performance.

    By segmenting this data, I can now accurately identify brand demand versus discovery, allowing clearer insights. This helps me to better understand what’s genuinely boosting performance and address key questions like:

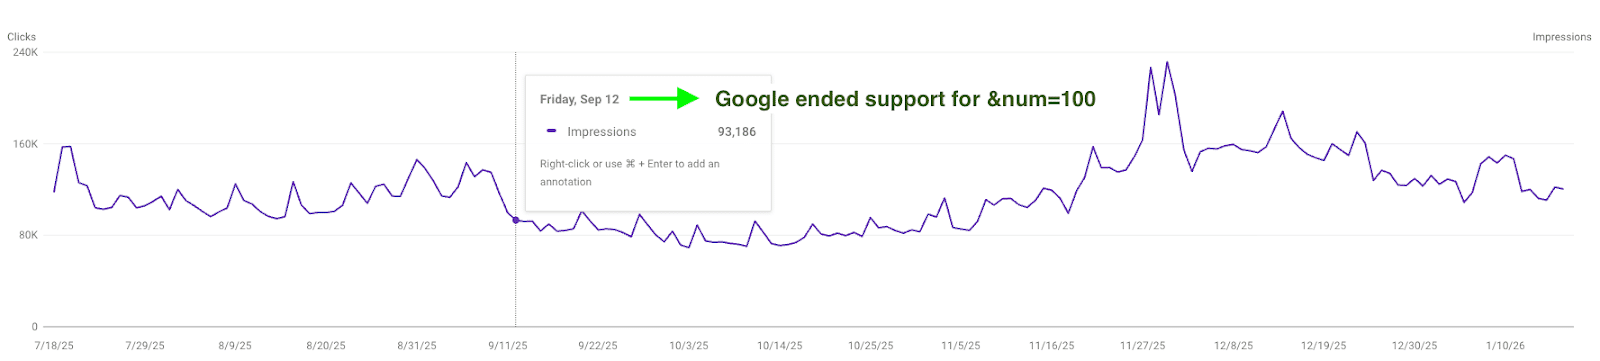
    ```json
{
  "alt": "Line graph showing impressions over six months with a note about Google ending support for &num=100 on September 12.",
  "caption": "A dynamic graph illustrating search impressions over time, noting Google's change in support, influencing trends.",
  "description": "This image features a line graph depicting the number of impressions over a six-month period. It includes an annotation on September 12, highlighting Google's end of support for &num=100. The graph shows a fluctuating trend with notable spikes, marked by a vertical guide at the annotation point. Useful for observing impact on search performance metrics."
}
```
    • Are we enhancing brand demand or expanding non-branded reach?
    • Is our content strategy bolstering non-branded visibility?
    • Is the current strategy effective as anticipated?

    Having used the filter, branded search trends have become one of the clearest indicators of brand health. Monitoring these trends reveals gaps and provides opportunities across various channels.

    This functionality isn’t just a feature; it signifies a paradigm shift in SEO measurement. The consistency it brings to branded versus non-branded reporting is transforming how SEO work gets done, making reporting more consistent and actionable.

    As I continue to evaluate and use these insights, I find that adopting this feature means less time spent reconciling data and more focus on interpreting results. This results in more confident and consistent communication, ultimately driving greater impact.


    Inspired by this post on Search Engine Land.

    crushpress.ai community screenshot
  • Enhance Forum Visibility: Google’s New Structured Data Update

    Enhance Forum Visibility: Google’s New Structured Data Update

    I recently discovered that Google has enhanced its structured data support for forum and Q&A pages. This update introduces new properties that allow us to better signal reply threads, quoted content, and identify whether content is generated by AI or humans.

    With these changes, which aim to boost Google’s accuracy in interpreting discussions and Q&A content, we can now ensure our content is represented more precisely.

    What’s New. Google has updated its QAPage documentation to include commentCount and digitalSourceType. Moreover, the DiscussionForumPosting documentation now supports sharedContent alongside these new properties.

    The Details. Using Q&A markup, I’m able to apply commentCount to questions, answers, and comments, showcasing the total number of comments even if they are not fully marked up. This total should align with answerCount + commentCount, representing all types of replies.

    How It Works. The digitalSourceType property allows me to indicate whether content is produced by a model or simple automation. I can use TrainedAlgorithmicMediaDigitalSource for advanced outputs and AlgorithmicMediaDigitalSource for basic bots. If this property is left out, Google assumes the content is human-generated.

    What’s New for Forums. The sharedContent property helps me to mark the primary item that’s being shared in a post. Google supports various content types like WebPage, ImageObject, and more, including quotes or reposts.

    Why This Matters. This update provides me with greater control over how Google interprets community content, which is particularly important for sites rich in forums, support communities, UGC platforms, and Q&A sections. Google can now distinguish between answers and comments more effectively, tally partial threads across multiple pages, and recognize when a post primarily shares specific media types.

    Documentation. The official documentation was updated on March 24, providing all the details I need to apply these new capabilities.


    Inspired by this post on Search Engine Land.

    crushpress.ai community screenshot
  • How Rising CPC Affects Your Business and Ways to Counter it

    How Rising CPC Affects Your Business and Ways to Counter it

    I’ve noticed that the cost-per-click (CPC) is increasing across most industries, and I’m sure you’re observing the same. Let’s dive into what’s causing this trend and explore strategies to safeguard your profit margins.

    According to WordStream by LocaliQ’s 2025 benchmarks, nearly 87% of industries saw their CPCs rise year-over-year. The average CPC for Google Ads across sectors is now at $5.26 per click. In high-intent verticals, such as legal services, the average is $8.58, with some competitive B2B segments reaching $8 to $9 per click.

    These increases reflect significant shifts in the design of search results pages, the optimization of auctions, and inefficiencies that accumulate across paid search accounts. Often, these issues remain hidden until a detailed PPC audit brings them to light. To begin reclaiming your budget, especially your branded terms, you need to understand the current landscape.

    Here are the five trends every advertiser needs to grasp at this moment.

    What’s Driving Your CPC?

    More Advertisers Are Chasing the Same Limited Inventory

    At its core, search advertising is an auction. As more advertisers target the same keywords, prices naturally increase. While global PPC spending continues to rise (Quantumrun Research), the number of available click slots on search results pages hasn’t expanded at the same pace. This results in higher CPCs, as more money competes for limited inventory.

    The pandemic has had a permanent effect on this shift. Brands that previously didn’t invest in paid search have now joined Google’s auction and have stayed active.

    Google’s AI Overviews Are Taking Over

    Over the past decade, one of the most significant changes in paid search is happening right within the Search Engine Results Page (SERP). Google’s AI Overviews now dominate the space for informational and exploratory questions. As they grow into 2024 and 2025, they diminish the number of organic and paid listings visible above the fold.

    A late-2025 analysis by Seer Interactive, reviewing 3,119 search terms across 42 organizations, revealed that the paid click-through rate (CTR) on queries with AI Overviews declined by 68%—from 19.7% to 6.34%.

    The straightforward mechanism is that AI Overviews take more real estate (Skai), reducing the number of visible paid placements above the fold. As a result, impression share tightens, and automated bidding becomes more aggressive, driving up prices.

    The important detail here is that users who navigate beyond an AI Overview tend to be further in their purchasing journey. WordStream data indicates approximately 65% of industries experienced higher conversion rates despite the increase in CPCs. This suggests the need to shift budgets toward high-intent transactional queries where AI Overviews are less likely to dominate, and away from informational queries where they are prevalent.

    Smart Bidding Is Raising Auction Costs

    Modern Google Ads campaigns more heavily rely on automated bidding strategies like maximizing conversions or targeting CPA. According to Google’s Smart Bidding documentation, the system precisely sets bids for each auction based on predicted conversion chances, prioritizing performance over cost control.

    ```json
{
  "alt": "Bluepear advertisement offering brand audit with a shield icon and promo code BRANDAUDIT.",
  "caption": "Discover who's bidding on your brand! Register with Bluepear and receive a personalized report within 48 hours using the promo code: BRANDAUDIT.",
  "description": "This image is an advertisement for Bluepear, spotlighting their service to uncover bidding activities on your brand. It features a sleek shield icon with a lock, set against a dark blue background. The text invites users to register for a custom report in 48 hours with promo code BRANDAUDIT. The attractive design aims to engage businesses seeking brand protection."
}
```

    As almost every competitor utilizes the same logic, there’s a self-reinforcing loop of rising bid pressure, a market-wide dynamic that you need to adapt to rather than reverse.

    Unauthorized Brand Bidding Is Inflating Costs Internally

    Although platform algorithms and macroeconomics are beyond your control, one significant driver of CPC inflation is something you can manage.

    When affiliates, partners, or competitors bid on your trademarked keywords, they enter an auction that should have minimal competition. Each additional bidder elevates your branded CPC, making you pay twice: once to create the demand, and again when third parties capture that same searcher at the bottom of the funnel.

    The impacts accumulate. AI Overviews have already condensed available click inventory; unauthorized brand bidding further inflates the inventory cost you actually secure.

    Detecting violations goes beyond manual SERP checks. Unauthorized bidders frequently use cloaking—geotargeting away from your headquarters or dayparting outside business hours—to evade detection. With a platform like Bluepear, you can implement automated 24/7 monitoring across search engines, geographies, and devices, capturing ad copy and landing page evidence to contest invalid affiliate commissions and enforce trademark guidelines at scale. Fewer bidders on your branded terms mean less auction pressure and lower CPCs for traffic you rightfully own. It’s one of the few paid search levers that doesn’t need a comprehensive strategic overhaul to be effective.

    What To Do About It: Three Priorities for Advertisers

    The gathered data indicates three clear priorities as you navigate this environment:

    • Protect your branded baseline. Your branded keywords represent demand you’ve already generated. Rigorously monitor competitors in those auctions and eliminate unauthorized bidders with automated brand protection tools—an essential high-leverage action at present.
    • Anchor optimization to cost per acquisition. Based on WordStream’s 2025 benchmarks, higher CPCs can bring a higher-quality, further-down-funnel user, leading to a lower CPA. The headline CPC figure is becoming an unreliable measure for campaign health.
    • Build first-party data infrastructure. The best defense against continued CPC inflation is leveraging high-quality, proprietary conversion signals for your bidding algorithms, thus minimizing reliance on the platform’s broad audience approximations.

    Average CPCs are reaching new heights and this trend is unlikely to reverse. Advertisers who effectively manage costs have already adjusted their strategies in response.

    Unsure how many unauthorized bidders are in your branded auction at the moment? Register with the promo code BRANDAUDIT to receive a personalized audit of your branded search landscape from the Bluepear team within 48 hours!

    For continuous insights into branded search and paid search protection, follow Bluepear on LinkedIn.


    Inspired by this post on Search Engine Land.

    crushpress.ai community screenshot