Tag: ROAS

  • I Let groas Run Google Ads: What Really Changed Fast

    I Let groas Run Google Ads: What Really Changed Fast

    I have watched paid search change into something far faster and less forgiving than the old reporting rhythm was built to handle. Auction dynamics shift by the hour, competitor bids move in real time, and search behavior changes across devices, times of day, and audience segments before a monthly report can even catch up.

    For me, the real cost has always lived in the gap between a performance signal and the moment a person can respond. groas is built to close that gap every hour of every day, and the data shows what can happen when that response loop gets dramatically shorter.

    When I sign up with groas, the process starts with a human account manager auditing the existing Google Ads account in detail. This is not a quick surface check. Campaign structure, keyword strategy, bidding logic, budget allocation, conversion tracking, quality scores, search term reports, and auction insights all get reviewed.

    I see that audit as the foundation for everything that follows. groas optimizes toward the goals and account structure defined in the roadmap, so a clean conversion hierarchy, accurate tracking, and a well-organized account give the system stronger signals to work with. That early human judgment matters because it shapes the machine’s operating environment.

    From there, I like that the rollout is paced across the first 60 days. The system does not start moving aggressively before it understands the account it is working in.

    Weeks 1 to 2, observation: groas ingests historical performance data, establishes baselines, and maps patterns across search terms, device performance, time-of-day variance, and audience behavior. During this stage, no changes are made while the system learns the account.

    Weeks 3 to 4, calibration: The system starts making targeted optimizations, including bid adjustments, negative keyword additions, match type refinements, and budget reallocations between campaigns. These are deliberate campaign-by-campaign changes, so each move can build on the last.

    Weeks 5 to 6, traction: I begin to see early changes show up in the data. Performance shifts become visible across ROAS, conversion value, and wasted spend as the optimizations compound.

    Weeks 7 to 8, scaling: Around the 60-day mark, the account has usually stabilized enough for groas to scale. More budget moves into the campaigns and keywords with the strongest conversion history, expanding from a proven base instead of guessing.

    Google Ads performance dashboard showing conversions, ROAS, conversion value and cost metrics with multicolor trend lines for April 2026.
    A Google Ads performance snapshot tracks April 2026 shifts in conversions, ROAS, conversion value and cost, highlighting the volatility behind paid search optimization.

    Once groas is running, I see it work across the full account the way a skilled team would, except it does not stop. It writes and tests ad copy, deploys dynamic landing pages that adjust around each search, turns ad groups on and off when performance calls for it, moves budget where it earns the most, and adjusts bidding strategies in response to live signals.

    Anything a person can do inside Google Ads, groas can do too, around the clock.

    Capability matters, but results matter more.

    The clearest way I can explain the value of continuous, full-surface management is through a real account groas took over. It was a high-spend search account in a tough paid search category: a U.S.-based online mobile recharge platform that lets people instantly top up prepaid mobile phones across major U.S. carriers without creating an account or paying added transaction fees.

    This business operates in prepaid wireless, serving many pay-as-you-go and underbanked customers who recharge monthly or even more often, usually right when their balance runs out. That model puts Google Ads at the center of growth.

    Demand is intensely intent-driven. When someone’s credit runs out, they search for a way to recharge and often buy within minutes. Capturing that moment is the whole game. But it is also a punishing channel to manage profitably because transactions are low-value and high-volume, margins are thin, and the auction is crowded with carrier brand terms and generic “recharge” and “top up” searches.

    In an account like this, a few cents of wasted CPC multiplied across hundreds of daily conversions can decide whether the account is profitable or quietly leaking money.

    In this account, a conversion meant a completed recharge. So the numbers are not abstract to me. Every point of ROAS and every additional daily conversion means more recharges processed and more revenue generated on the same budget base.

    Google Ads performance dashboard showing conversions, ROAS, conversion value and cost with multi-line PPC trend chart from May 5 to June 5, 2026.
    A Google Ads reporting view tracks PPC performance after optimization, with conversions, ROAS, conversion value and spend moving across a month of campaign activity.

    The comparison looked at two account reporting periods: before groas assumed optimization and after.

    Spend: up 18% to $164,000.

    ROAS: up 30%.

    Average CPC: down 15%.

    Conversions per day: up 29%.

    Conversion value: up 44%.

    Cost per conversion: down 14%.

    The clearest improvement was return on ad spend. ROAS rose from 1.02x to 1.32x, which is roughly a 30% improvement in value returned for each dollar spent.

    Google Ads performance dashboard showing conversions, cost, ROAS and conversion value trends after connecting to groas.
    A Google Ads trend chart marks the moment groas was connected, with conversion, cost, ROAS and value lines tracking performance shifts through spring 2026.

    At the same time, average cost per click fell from $2.34 to $2. But the more important point is what the account did with the clicks it paid for. Conversions and conversion value both grew faster than spend, which means each dollar worked harder than it had under the previous setup.

    Daily conversions rose from 571 to 739, about 29%. Daily conversion value rose even faster, from $4,702 to $6,772, or roughly 44%.

    What stands out to me is that these gains came through consolidation, not expansion. groas focused spend into 10 active search campaigns, down from 17.

    Budget that had been spread thinly across underperforming campaigns was redirected into the keywords and campaigns with the strongest conversion history. Fewer campaigns, lower click costs, and more value returned created a cleaner, more focused account.

    That is what an account looks like when waste is removed and budget is concentrated where it can compound.

    The mechanism behind results like these is speed plus breadth of attention. Under traditional management tied to weekly or monthly reporting cycles, an underperforming search term might run for 7 to 14 days before anyone acts. A target CPA can drift far from its goal between reviews. An autonomous system narrows the time between signal and response to hours while watching every campaign at once.

    As groas gathers more data on audience behavior, search patterns, and conversion value, its decisions become more precise. Budget can then concentrate further into the campaigns that return the most value.

    That is the structural difference I see between autonomous management and periodic manual review. Each optimization creates new data, and that data informs the next decision. A system running continuous observe-and-optimize cycles can draw more signal from the same account over time.

    Futuristic data archive with glowing server-like filing cabinets, stacked documents, and network lights symbolizing AI marketing data infrastructure.
    Rows of illuminated data cabinets and paper files stretch into the distance, capturing the pressure on marketers to turn fragmented customer data into a smarter performance engine.

    Business context still belongs with the people who understand the business. When a client launches a new product line, changes pricing, or redefines which conversions matter most, that direction has to come from a person. groas optimizes toward the goal it is given, and setting that goal is strategic work.

    Creative is where I see the human and machine layers working together most clearly. groas writes and tests ad copy and landing page variations at a pace no human team could match, while the people on the account define brand voice, positioning, and creative direction. The strategist shapes the message, and groas finds the specific wording and layout combinations that convert.

    For businesses ready to see better results

    If I am looking at a current setup that runs on monthly reports and weekly changes, I expect to find a steady gap between what the data says and what actually happens in the account. That gap is where budget gets wasted and opportunities close. In the account above, it showed up as more than 15 active search campaigns, many spending inefficiently, with budget spread too thin to compound.

    groas’s onboarding is structured to keep the transition low-risk. The first two weeks are analysis only, measured changes follow, and meaningful performance shifts usually appear within the first month or two, with scaling beginning around day 60. Live campaigns keep running throughout calibration, and the initial audit grounds changes in context from the start.

    For businesses that have stayed with the same agency for a long time without material improvement, I would expect the audit alone to surface issues that have gone unaddressed.

    Get started here.

    For agencies running groas white-label

    I do not think execution-layer account management scales well on its own.

    Continuous optimization, bid management, negative keyword maintenance, and budget pacing take a lot of time at volume. As an agency adds clients, it usually has to add headcount or accept that some accounts get less attention than others. Most agencies know exactly which accounts are underserved.

    With groas handling execution autonomously across a client portfolio, I can see the team shifting toward strategy, client relationships, and new business.

    The work that differentiates an agency is also the hardest to automate. Clients see stronger results, and team capacity moves toward the work that creates the most value.

    Get started here.


    Inspired by this post on Search Engine Land.


    crushpress.ai community screenshot
  • Google Shopping Bidding Update Gives Me More Control

    Google Shopping Bidding Update Gives Me More Control

    I’m seeing an important shift for Standard Shopping campaigns: Google is bringing Maximize Conversion Value bidding to these campaigns without requiring a Target ROAS. That gives advertisers more room to pursue value-based optimization without immediately being locked into a specific return target.

    What’s happening. Google is rolling out Maximize Conversion Value bidding for Standard Shopping campaigns, and advertisers no longer have to set a Target ROAS to use it.

    Before this update, if I wanted to optimize around conversion value in Standard Shopping, I generally had to use a Target ROAS bidding strategy. Now, this new option lets campaigns focus on maximizing conversion value while giving Google’s bidding system more flexibility to find the highest-value opportunities.

    Why I care. This matters because I can now use Google’s value-based bidding in Standard Shopping without being constrained by a Target ROAS goal. That gives me more flexibility while preserving the control and transparency that many advertisers still prefer in Standard Shopping campaigns.

    It may also reduce the need to run feed-only Performance Max campaigns just to access Maximize Conversion Value bidding. For advertisers who prefer tighter campaign control, that is a meaningful change.

    Between the lines. I know many advertisers have continued to favour Standard Shopping because it offers more visibility and control than Performance Max. But when they wanted flexible value-based bidding, they often created feed-only Performance Max campaigns as a workaround.

    With this update, that workaround may no longer be necessary for some accounts.

    Why advertisers should care. I can now combine the structure and transparency of Standard Shopping with a more flexible automated bidding strategy. In practical terms, this could simplify campaign setups, reduce unnecessary Performance Max usage, and make account management cleaner.

    The bottom line. Google is narrowing one of the biggest feature gaps between Standard Shopping and Performance Max. For me, this gives advertisers another reason to keep using Standard Shopping while still benefiting from automated value-based bidding.

    First spotted. Performance marketer Yash Mandlesha spotted the update and shared the option on LinkedIn.


    Inspired by this post on Search Engine Land.


    crushpress.ai community screenshot
  • Bad Conversion Data Is Quietly Wrecking Google Ads

    Bad Conversion Data Is Quietly Wrecking Google Ads

    I used to think bad data mainly meant bad reporting. Now, in Google Ads, I see it as something much more expensive: bad delivery. When conversion data is wrong, it does not just make a dashboard confusing. It can train campaigns to spend budget chasing the wrong people.

    As automation takes over more of the ad-buying process, from creative generation to bidding, data has become one of the few inputs I can still control. It may also be the most important one, because automation can only optimize toward the signals I give it.

    I keep coming back to one question: what is worse, a brilliant ad shown to the wrong audience or an average ad shown to the right one? The first burns budget on people I do not want. The second may not win every click, but when someone does engage, at least they are closer to the customer I actually need.

    That is why I have to ask myself a harder question before launching any automated campaign: did I spend more time verifying the data than writing the ad copy?

    The cost of bad data has changed

    A few years ago, bad tracking was mostly a reporting problem.

    If a tag fired twice, a conversion was mishandled, a value came through incorrectly, or offline conversions stopped working for a few weeks, the main result was a dashboard that did not add up. It was frustrating, but the damage was usually limited. Someone would eventually question the numbers in a monthly review, I would trace the issue, fix it, and the next report would look cleaner.

    That same data now feeds the algorithm buying paid media. Smart Bidding does not wait for me to interpret a report or sit through a monthly review. It reads conversion data and acts on it before I may even notice that something is broken.

    The same wrong number now creates a very different outcome. A bad number in a report requires an explanation in a meeting. A bad number in a conversion action used for bidding costs money immediately, because the algorithm does not know the signal is wrong.

    It simply optimizes toward that signal the moment it sees it, and it does so efficiently.

    Google does not understand my funnel or my business

    Google may let me label conversion actions as “lead,” “opportunity,” or something similar, but those labels are mainly for organization. The platform does not truly understand where each conversion event sits in my funnel.

    What it sees is a conversion event with a numeric value attached to it, usually a currency value. It does not inherently know that a newsletter signup might be worth $2 in eventual value, a lead might be worth $60, and an opportunity might be worth $400. To Google, those are conversion events. Without better signals, it has no real context that one may be worth 200 times another.

    The algorithm is not optimizing for my business outcome by default. It is optimizing for the data I provide. If that data is wrong, the optimization will be wrong too.

    For example, if every form submission fires the same conversion with the same default value, I give the system no clean way to separate low-intent inquiries from high-value prospects. The algorithm treats them the same. And because low-quality leads are often cheaper to acquire, it can quickly flood the account with them.

    The cost per lead may drop from $40 to $25, and the dashboard may make performance look more than 35% better. But behind that cleaner metric, the pipeline can dry up as genuinely qualified inquiries quietly fall by half.

    Dig deeper: Why better signals drive paid search performance

    3 ways bad data quietly wrecks delivery

    Bad data can show up in different ways, but I see three issues that are especially likely to derail campaign delivery.

    1. Wrong event

    If I optimize for a top-of-funnel action like a page view while the real conversion events happen further down the funnel, the algorithm learns to buy more of those cheap events. The problem is that the lower-funnel activity may never follow.

    2. Wrong value

    If I count every conversion equally, or assign every conversion the same placeholder value, I hide the real differences in business value. When actual value can vary by 10 times or more, the algorithm will often chase the easier, lower-value conversions because they are cheaper to acquire.

    3. No data

    This problem does not get discussed enough. A complete break in conversion data can damage a campaign faster than almost anything else.

    On Day 1, the algorithm starts wondering where the conversions went. By Day 2, it begins assuming they may not be coming back. By Day 3, it can start making serious bidding changes. Within a week, many campaigns can throttle themselves down to almost nothing.

    How I pick the right signal for Google

    So how do I fix this? I start by choosing the signal that best represents business value, not just the easiest action to count.

    Take a typical lead generation business. Some leads will never convert, while others may be worth 10 times as much as the rest.

    If the form asks the right qualifying questions, I may already know which leads are which. But if I optimize for every submitted lead using a target CPA, I am telling Google that all leads are equally valuable.

    Imagine an account spending $20,000 a month at a $40 target CPA and generating about 500 leads. Only 150 qualify, and maybe just 50 are genuinely high value. A basic lead may be worth $60, a qualified lead may be worth $200, and a high-value lead may be worth $600. That is a 10 times spread in value.

    In that situation, I have several ways to improve the optimization signal.

    Optimize for a qualified lead: I can create a new conversion action, such as “qualified lead,” and fire it only when a lead has real value. Then I can move the target CPA strategy to that conversion action, knowing the campaign will ignore leads with no value. The advantage is that I train the campaign on a more meaningful signal. The downside is that every qualified lead is still treated equally.

    Assign conversion values and use target ROAS: I can add a currency value to the qualified lead based on the potential revenue it could generate if it becomes a sale. Then I can switch the campaign to target ROAS, allowing Google to optimize for return instead of simply counting leads. The tradeoff is that it may still buy larger numbers of lower-value leads if it can acquire them at the right price.

    Optimize for a high-value lead: I can create a “high-value lead” conversion event that fires only for top-tier leads, with or without a conversion value. Then I can optimize with either target CPA or target ROAS, depending on whether I care more about acquisition cost or return. The advantage is stronger lead quality. The downside is that, depending on spend and volume, the data may be too limited to support this approach until the account scales.

    These are only a few possible optimization signals, and they do not even go deeper into the funnel. I can apply the same thinking to lower-funnel milestones by creating separate conversion actions for events such as contacted lead, qualified contact, or high-value contact.

    Targeting and measurement can be different

    This sounds simple, but the conversion event I optimize for and the one I report on are not always the same. In many cases, they should not be the same. One trains the algorithm. The other tells me how that training is performing.

    In the example above, a client or internal stakeholder may still want to see cost per lead. That is a valid metric. But the campaign may be optimizing for the Qualified Lead conversion, not the original lead submission.

    I can keep the original lead conversion running purely as a reporting metric, so stakeholders still get their cost-per-lead view while the campaign bids on the qualified lead signal that actually reflects business value.

    Same campaign. Two conversions. Two very different jobs.

    That brings me back to the question I started with: did I spend more time verifying the data than writing the ad? In an automated account, data is no longer just measurement. Data is strategy.


    Inspired by this post on Search Engine Land.


    crushpress.ai community screenshot
  • Google Demand Gen Gets Gemini Creative and Reporting Boost

    Google Demand Gen Gets Gemini Creative and Reporting Boost

    I’m seeing Google roll out a new set of Demand Gen updates designed to help advertisers improve creative performance, reach more potential customers across YouTube, and measure campaign results with more clarity.

    For me, the bigger story is that Demand Gen is becoming less about manually adapting assets and more about using AI-assisted tools to make creative work harder across Google’s most visual surfaces.

    Demand Gen campaigns are built to drive discovery and conversions across Google’s visual placements. With these latest updates, I see Google trying to reduce creative friction while giving advertisers better visibility into what is actually moving performance.

    Google says the enhancements arrive as YouTube continues to show value for customer acquisition. The company cited research from Measured showing that 72% of incremental conversions on YouTube come from new customers.

    What’s new. I’m watching Demand Gen add expanded video resizing capabilities, giving advertisers the ability to automatically transform creative into more aspect ratios, including vertical-to-square, vertical-to-landscape, and square-to-landscape formats.

    That matters because it should make it easier to adapt existing creative for different YouTube placements without having to produce every version manually from scratch.

    Why I care. Expanded video resizing can help existing assets fit more YouTube inventory, Gemini can provide AI-powered recommendations before launch, and new web-to-app measurement can give marketers a clearer view of how Demand Gen campaigns influence app installs and return on ad spend.

    Gemini joins the creative workflow. Google is also bringing Gemini-powered recommendations directly into the Demand Gen campaign creation process, which makes AI guidance part of the asset selection workflow instead of a separate optimization step.

    When advertisers choose image and video assets, Gemini will offer automated suggestions for optimizing creative for YouTube. I see this as a way for marketers to improve asset choices before campaigns go live, rather than waiting for performance data after launch.

    Better app measurement. Demand Gen now includes Web to App Acquisition Measurement, allowing advertisers to measure when web campaigns lead users to install an app.

    The new reporting gives me a more complete way to evaluate campaign performance because it attributes app installs generated through Demand Gen campaigns. That should help advertisers better understand the full impact of their media spend.

    The bottom line. I see Google’s latest Demand Gen updates as a practical combination of AI-powered creative guidance, more flexible video optimization, and broader measurement tools that can help advertisers improve performance while gaining clearer insight into customer acquisition.


    Inspired by this post on Search Engine Land.


    crushpress.ai community screenshot
  • Semantic PPC and SEO Tactics That Still Win With AI

    Semantic PPC and SEO Tactics That Still Win With AI

    Why advanced semantic techniques still matter in PPC and SEO

    Now that I can use AI to generate keywords and launch a paid search campaign in minutes, it is tempting to think the hardest part of PPC and SEO work has already been handled.

    But I still need more than fast keyword output if I want structured, scalable performance. I need to understand how search actually works, how people phrase intent, and how noisy search term data can distort a campaign if I do not organize it properly.

    That is where semantic techniques such as n-grams, Levenshtein distance, and Jaccard similarity continue to matter. I use them to interpret messy data, apply real client context, and build frameworks that AI alone cannot reliably produce.

    What I learn from n-grams in PPC and SEO analysis

    I think of n-grams as the “n” words that make up a keyword. In the search term “private caregiver nearby,” I can break the phrase into smaller pieces that are easier to analyze.

    • 3 unigrams (one word): “private,” “caregiver,” and “nearby”
    • 2 bigrams (two consecutive words): “private caregiver” and “caregiver nearby”
    • 1 trigram (three consecutive words): “private caregiver nearby”

    I use n-grams because they simplify large keyword lists without stripping away the patterns that matter.

    For example, I recently restructured several campaigns that had more than 100,000 search terms. By using n-grams, I reduced those lists into much more workable sets.

    • ~6,000 unigrams.
    • ~23,000 bigrams.
    • ~27,000 trigrams.

    Once I have those smaller sets, I can spot patterns quickly. If every keyword containing the “free” unigram performs poorly, I can exclude “free” as a broad match negative.

    On the other hand, if I see that “nearby” performs especially well, I may test more local variations, build location-specific landing pages, or adjust campaign structure around that intent.

    I still have to respect the limits of this method.

    • I need a large volume of search terms, so this approach usually works best for accounts with bigger budgets.
    • As “n” gets larger, the output becomes less useful because the data expands again. At that point, I usually need more advanced methods such as Levenshtein distance or Jaccard similarity.

    How I cluster keywords with n-grams

    When I analyze SEO and PPC data, I often deal with huge volumes of long-tail search terms. Many appear only once and carry very little standalone data.

    N-grams help me turn that chaotic long-tail data into clearer, more manageable intelligence.

    That intelligence helps me reduce wasted spend, find new opportunities, and build a structure that can scale.

    • I start by exporting search term data. In PPC, that includes cost, impressions, clicks, conversions, and conversion value by search term.
    • For each n-gram, I sum cost, impressions, clicks, conversions, and conversion value.
    • Then I calculate CPA, ROAS, CTR, CVR, and any other metrics that matter for the account.

    With a shorter and more digestible dataset, I can rank the top-spending n-grams that do not convert, which often become negatives, and the ones that do convert, which become positives.

    From there, I build ad groups around recurring n-grams that consistently drive performance.

    For example, I may find that emergency-related n-grams such as “24/7,” “same day,” or “urgent” deliver higher conversion rates. I would segment those terms so I can control budget, bidding, and messaging more precisely.

    Bottom line: I use n-grams to isolate themes that deserve special attention.

    Once I have identified those themes, it becomes much easier to build advanced paid search structures around high-impact n-grams and improve ROI.

    Dig deeper: How to uncover hidden gems in your paid search accounts

    How I use Levenshtein distance to improve keyword quality

    Levenshtein distance measures the minimum number of single-symbol edits, including insertions, deletions, or substitutions, needed to turn one string into another.

    That may sound complicated, but the idea is simple once I put it into practice.

    The Levenshtein distance between “cat” and “cats” is 1 because I only need to add the “s.” Between “cat” and “dog,” the distance is 3.

    One common PPC use case is finding brand and competitor misspellings inside search term reports.

    For example, “uber” and “uver” have a Levenshtein distance of 1, so I would feel confident excluding the misspelled version from non-brand campaigns.

    I can apply the same logic to keyword relevance.

    If the distance between a keyword and the search terms it matches is too high, such as 10 or more, those terms probably have very little in common with the keyword and deserve review.

    A low distance usually tells me those queries are close enough to be safe and do not need the same level of manual inspection.

    How I consolidate PPC keywords with Levenshtein distance

    After I use n-grams to create initial keyword clusters, I may still have thousands of search terms to organize into a practical campaign structure.

    Manually sorting through 6,000 unigrams is not realistic. This is where Levenshtein distance becomes especially useful.

    Venn diagram showing sets A and B with their overlapping intersection labeled A&B, illustrating Jaccard similarity for SEO and PPC keywords.
    A simple Venn diagram visualizes how Jaccard similarity measures the shared overlap between keyword sets A and B in semantic PPC and SEO analysis.

    My goal is to merge ad groups that target nearly identical keywords so I do not end up with an overly granular, SKAG-like structure.

    Too much granularity makes reporting and account management harder. It can also create inefficient bidding and wasted spend.

    Using the same dataset, I calculate the Levenshtein distance between queries across different ad groups.

    Then I identify the closest keyword and ad group using a predefined threshold. A threshold of 3, for example, gives me a high degree of accuracy.

    This helps me consolidate keywords and ad groups with confidence. If I use a looser threshold, such as 6, I can also group or name ad groups by broader similarity or intent.

    Here is a simple example showing why these three keywords can be grouped together:

    Levenshtein distance24/7 plumber24 7 plumber247 plumber
    24/7 plumber011
    24 7 plumber101
    247 plumber110

    Dig deeper: How to use negative keywords in PPC to maximize targeting and optimize ad spend

    How I go further with Jaccard similarity

    In PPC, I use Jaccard similarity as a practical proxy for understanding the overlap between two sets of n-grams.

    The calculation is straightforward: I divide the number of shared unigrams between two sets by the total number of unique unigrams across both sets.

    It sounds technical, but I visualize it simply:

    • Jaccard similarity = Red / Green
    A plus B - A and B

    Here are a couple of concrete examples I use to explain the concept:

    • “new york plumber” and “plumber new york” = 1 because all three unigrams appear in both sets, just in a different order.
    • “new york plumber” and “NYC plumber” = 0.25 because only “plumber” is shared, and there are four unigrams in total.

    Jaccard similarity is a helpful first step for deduplicating similar keywords. I see it as a bridge between old phrase match logic and broad match modified logic.

    But it has an important limitation: it does not understand meaning.

    In the example above, “new york” and “NYC” should be treated as equivalent, but the Jaccard calculation sees them as different.

    To handle that kind of nuance, I need more advanced techniques, which I would treat as the next layer of analysis.

    How I combine Jaccard similarity and Levenshtein distance

    Consider a cybersecurity course campaign with the following top 10 keywords:

    KeywordSemrush average monthly searches in the U.S.
    cybersecurity courses5,400
    cybersecurity online course1,900
    free cybersecurity courses1,300
    online cybersecurity courses1,300
    cybersecurity course1,000
    cybersecurity courses online880
    google cybersecurity course880
    cybersecurity courses free720
    cybersecurity free courses590
    cybersecurity online courses480

    By combining singular and plural versions, along with reordered versions of the same idea, I can reduce that top 10 into a more actionable top four.

    • “Cybersecurity courses.”
    • “Cybersecurity courses online.”
    • “Free cybersecurity courses.”
    • “Google cybersecurity course.”

    I could use n-grams to do this, but scaling n-gram analysis across thousands of keywords can quickly become overwhelming.

    A more efficient approach is to use both similarity metrics in sequence.

    • First, I apply Levenshtein distance to consolidate very similar queries.
    • Then I use Jaccard similarity to deduplicate reordered variants.
    • At each step, I sum the usual KPIs, including cost, conversions, and other performance metrics, so the analysis stays actionable.

    The result is a clear, compressed structure that can hold up even as search term volume grows.

    How I restructure paid search campaigns with semantic techniques

    With the right semantic techniques, I can restructure massive keyword sets quickly and still produce consistent, high-quality results.

    AI can absolutely help me create an initial summary, but I do not rely on it entirely.

    Otherwise, I run into the classic problem of “garbage in, garbage out.”

    Broad match can be powerful, but it also introduces more noise. These techniques help me verify that the queries I am matching stay aligned with campaign goals.

    I use n-grams, Levenshtein distance, and Jaccard similarity to apply client context to raw search data and build a stable structure around real intent.

    If the process feels overwhelming at first, I use this summary to decide which technique fits the job:

    ScenarioBest techniqueWhy
    Identify high-intent patterns in huge search-term exportsn-gramsSurfaces themes fast; reduces dimensionality
    Clean duplicate / near-duplicate keywords at scaleLevenshtein distanceCaptures spelling + structural similarity
    Deduplicate reordered or slightly varied keyword stringsJaccard similarityOrder-insensitive token-based comparison
    Create scalable clusters for campaign rebuildsCombo: Levenshtein → Jaccard → n-gramSequence gives accuracy + compression

    For me, the main lesson is simple: AI can accelerate PPC and SEO work, but semantic analysis gives that work structure, signal quality, and strategic control.


    Inspired by this post on Search Engine Land.


    crushpress.ai community screenshot
  • Don’t Be Fooled: The Truth About B2B PPC Metrics

    Don’t Be Fooled: The Truth About B2B PPC Metrics

    More conversions and higher ROAS are not always indicative of increased pipeline or revenue. I’ve discovered how to measure incremental value more accurately, and I’m excited to share it with you.

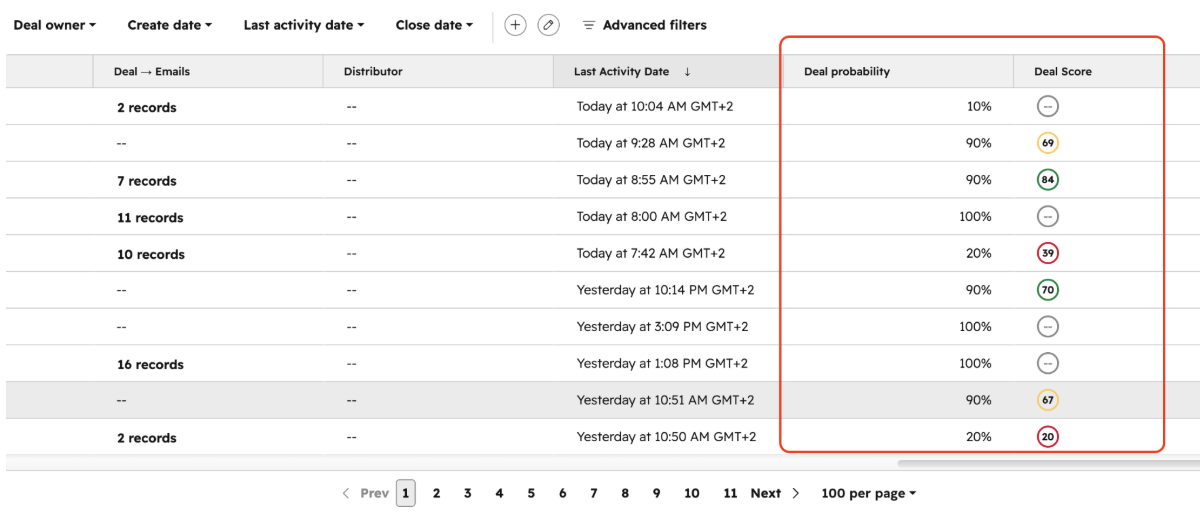
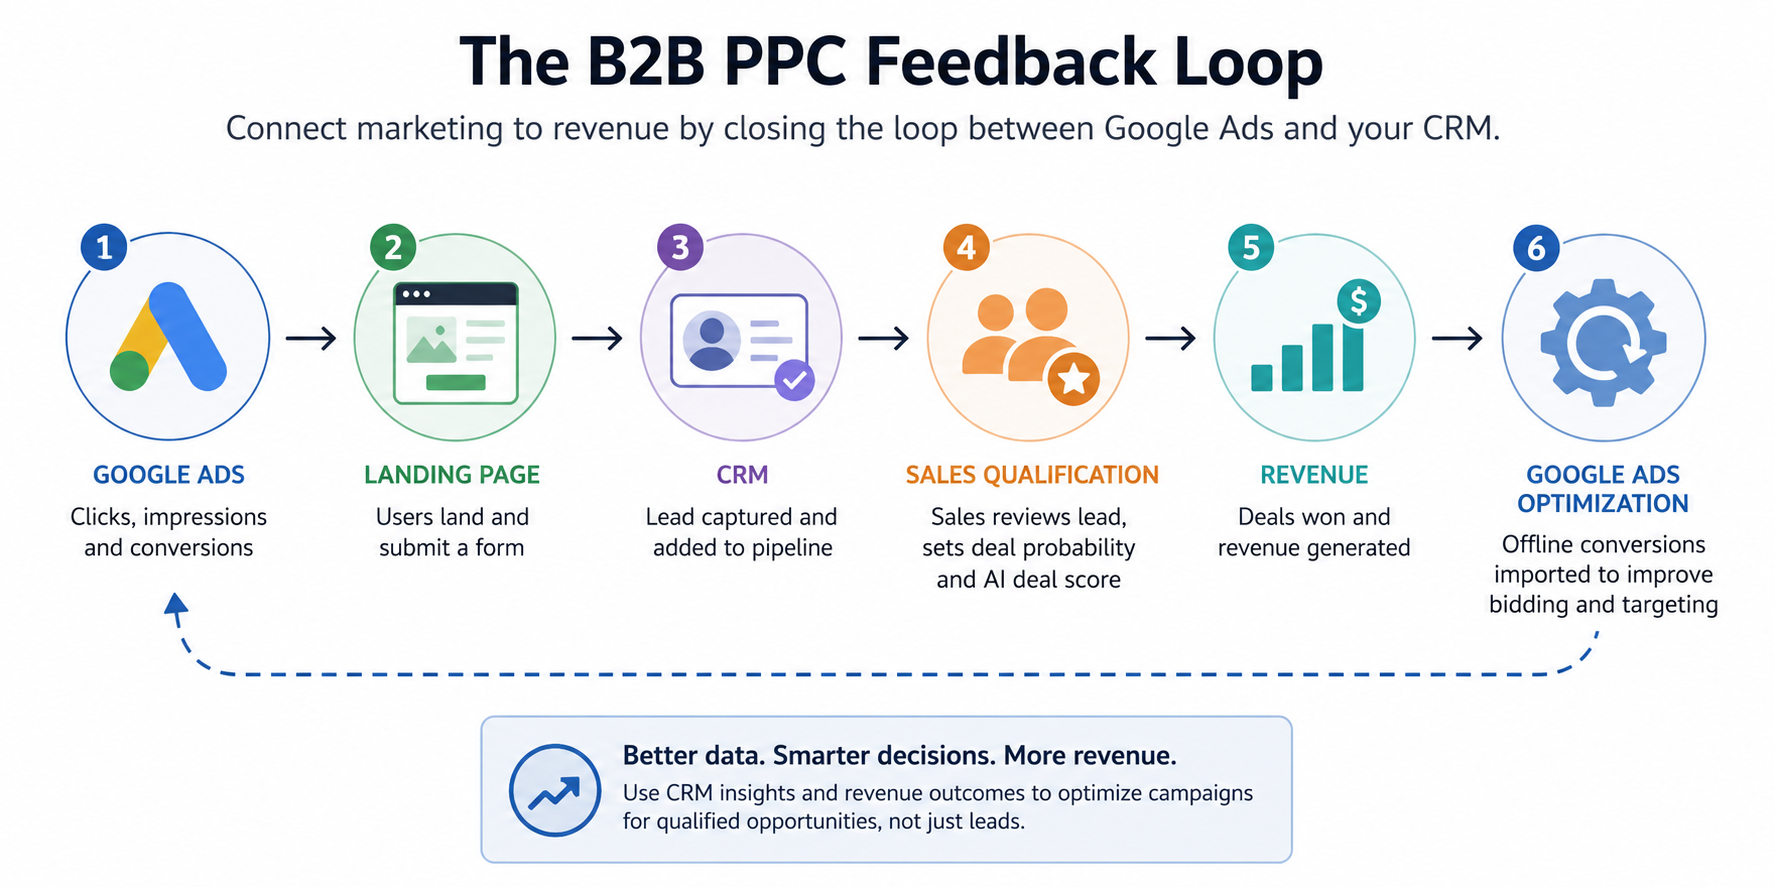
    As a B2B PPC advertiser, I now have more options than ever before to gauge success. Previously, all I had was form-fill data. Now, with offline conversion data, I can feed invaluable insights into Google Ads and Microsoft Ads.

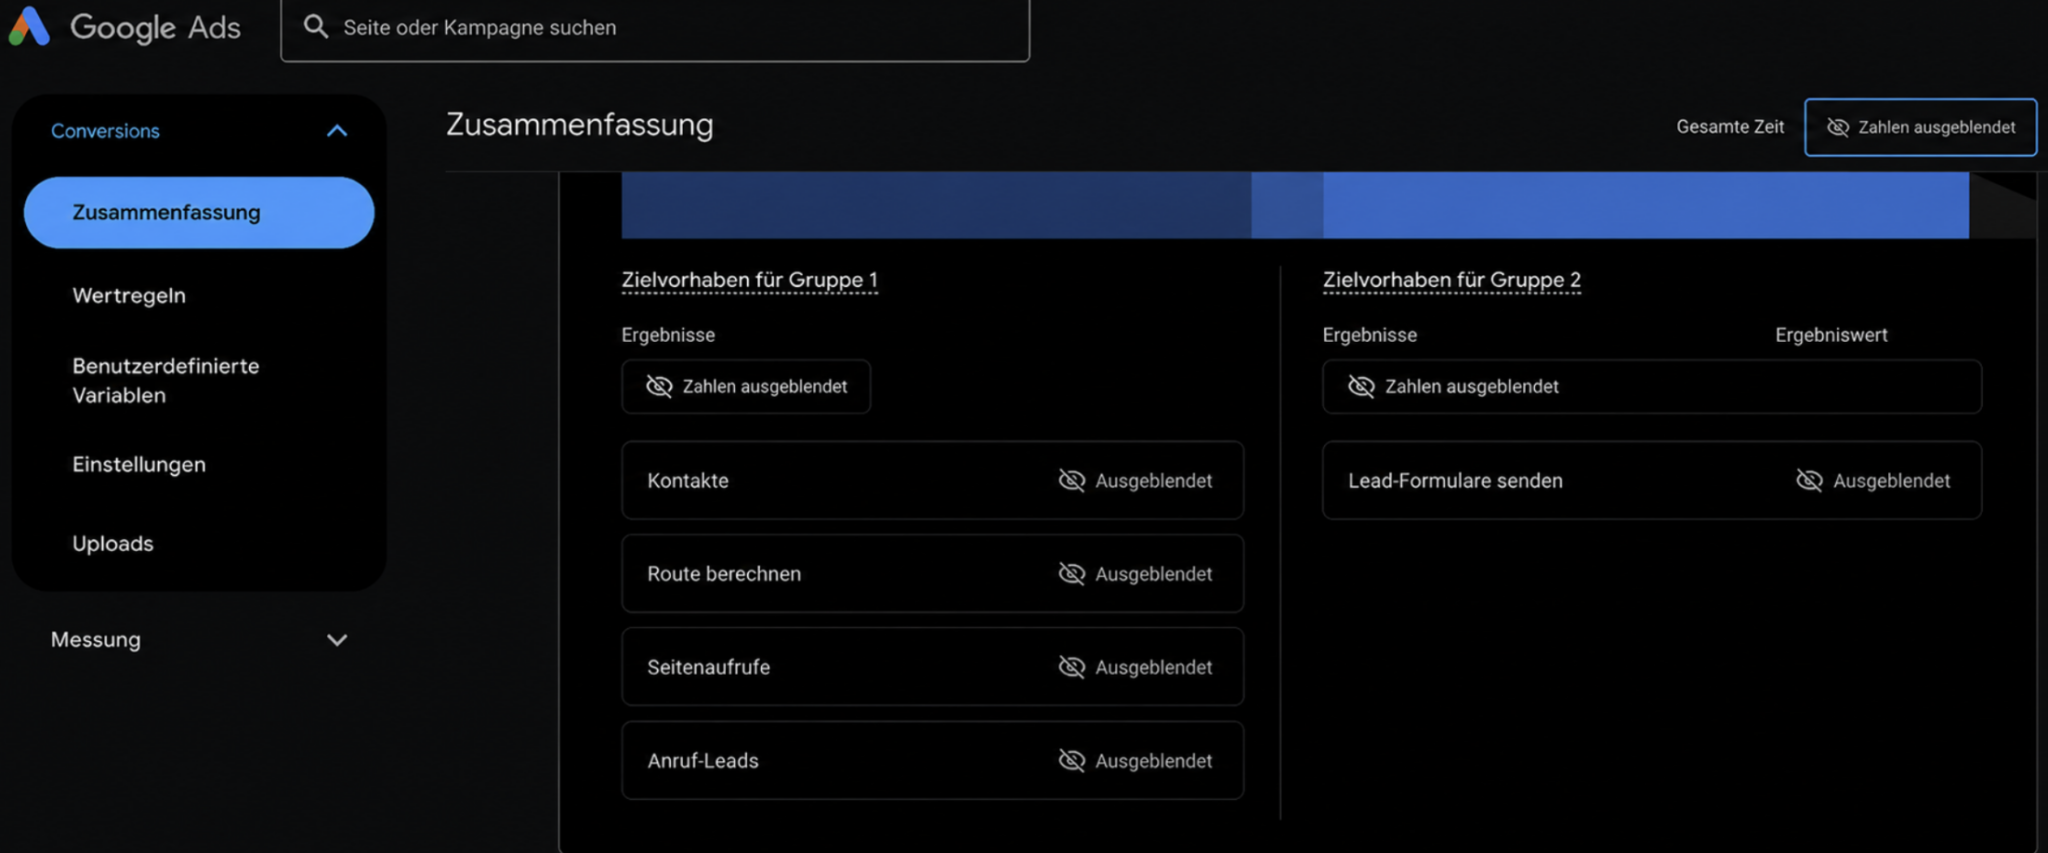
    I’ve realized that while it’s tempting to measure every possible metric, optimizing them all is impractical. If you chase everything, you might end up achieving nothing substantial.

    Determining if I’ve driven true incremental value and identifying the right success metrics for B2B PPC campaigns was crucial. Often, the metrics that truly matter aren’t the ones I initially focused on.

    ```json
{
  "alt": "The CapmatchOne logo with a gradient circle and bold text.",
  "caption": "Discover innovation with the CapmatchOne logo, featuring sleek typography and a modern gradient circle.",
  "description": "The CapmatchOne logo features bold, modern typography coupled with a gradient circle, symbolizing connection and innovation. The sleek design conveys a sense of progress and creativity. This image can be used for branding or promotional purposes, appealing to audiences interested in innovative solutions and forward-thinking designs."
}
```

    I’ve witnessed advertisers integrate offline conversions and get thrilled with a spike in total conversions, only to be hit with disappointment when there’s no boost in the bottom line.

    After incorporating numerous conversion actions and setting them all to primary, advertisers, including myself, saw conversion counts rise, but not their actual impact. We were essentially counting the same leads multiple times.

    This led to inflated platform-reported ROAS. Attaching conversion values to each action, which is advisable, also resulted in false increases. Both scenarios result from faulty calculations.

    ```json
{
  "alt": "Bar chart displaying microconversion values for video views, ungated asset downloads, form fills, and MQL.",
  "caption": "Visualizing microconversion values: a bar chart highlights the significant impact of MQL offline conversions over video views, asset downloads, and form fills.",
  "description": "This bar chart illustrates the relative values of different microconversion activities: video views (1), ungated asset downloads (10), form fills (100), and MQL with offline conversions (1000). The chart underscores the prominence of MQL in the conversion process, showcasing its tenfold and hundredfold value over form fills and downloads, respectively. Keywords: microconversion, MQL, form fill, video view, asset download."
}
```

    Solely focusing on average CPA proved misleading. It can mask the marginal CPA, the cost of acquiring an additional conversion as marketing expenditure increases, potentially leading to overspending as the account scales.

    Setting up conversion values is crucial for understanding offline conversions. But it’s easy to get stuck if the conversion value isn’t known until it processes further down the pipeline.

    Even if using actual conversion values is impossible, assigning relative values is still beneficial. I learned this through a simplistic example scenario.

    ```json
{
  "alt": "Dropdown menu for selecting conversion goals in a digital marketing interface.",
  "caption": "Choose between account-default or campaign-specific conversion goals to optimize your digital marketing strategy.",
  "description": "This image shows a dropdown menu interface in a digital marketing platform where users can select conversion goals, either 'Account-default' or 'Campaign-specific'. A cursor is pointing at 'Campaign-specific'. This selection affects bid optimization and reporting strategies. Keywords: conversion goals, bid optimization, digital marketing, dropdown menu, campaign management."
}
```

    Here, whenever I employed arbitrary values, I made sure to validate them against real data to ensure bidding algorithms responded accurately. This adjustment improved the relative perceived value of MQLs and SQLs for better alignment with true business goals.

    By doing this, within just a couple of weeks, we managed to significantly boost MQL and SQL volumes while keeping leads flat, ultimately delivering higher-quality leads at the same cost.

    Experimenting with campaign-specific goals allowed Smart Bidding to focus strictly on down-funnel actions, which fine-tuned our optimization efforts.

    ```json
{
  "alt": "Screenshot of campaign settings for conversion goals selection in an account.",
  "caption": "Optimize your campaign with tailored conversion goals. Choose default settings or customize for success.",
  "description": "This image shows the campaign settings interface focusing on conversion goals selection. It features a section labeled 'Conversions' where users can select conversion goals for the campaign. Options include using the account's existing 'Include in conversions' setting or choosing specific goals. This interface is crucial for tailoring campaign strategies and measuring campaign success effectively."
}
```

    However, if lower funnel actions yielded low volumes, I noted automation might struggle due to insufficient signals. Adjusting strategy with this understanding ensured clearer outcomes.

    To measure success effectively, beyond traditional CPA and ROAS, I focused on incremental conversions, evaluating them against baselines to understand the financial sensibility of further investments.

    The most reliable measure of incremental value was mapping CRM data back to actual paid search campaigns. This helped in identifying assets and campaigns that, while generating fewer leads, drove significant pipeline growth.

    Understanding this dynamic was critical in recognizing diminishing returns and preventing unfounded overspending on non-cost-effective channels.


    Inspired by this post on Search Engine Land.


    crushpress.ai community screenshot
  • Master Google Ads: Boost High-Value Customer Acquisition & Retention

    Master Google Ads: Boost High-Value Customer Acquisition & Retention

    I recently dove into Google Ads to explore their new customer acquisition goals. With fresh capabilities like high-value customer bidding and retention targeting, I was curious about how they could boost my marketing efforts.

    Many strategies still assume new customers are the most valuable, but this breaks down rapidly. Not every new customer is worthwhile, and ignoring existing ones can be a mistake. The crux is Google’s high-value customer and retention bidding goals.

    Google uses predictive bidding to pinpoint high-value customers, but the key is the customer match list I upload. To tweak settings, I venture into the customer lifecycle optimization section under Goals > Summary and select Edit Goal.

    ```json
{
  "alt": "Google Ads interface for setting new high value customer conversion.",
  "caption": "Optimize your ad campaigns by setting incremental conversion values for high-value new customers using Google Ads.",
  "description": "Screenshot of Google Ads interface for setting up high-value customer conversion optimization. It includes a section to add an incremental conversion value of $0.02 for new customers and a tool for adding audience segments with updates available in the Audience manager. The feature supports Performance Max & Search campaigns, requiring segments with at least 1,000 active members."
}
```
    Google Ads new customers (high value)

    Here, I set a higher new customer value to bid aggressively for high-value clients. Google usually suggests a value based on higher LTV, but I ensure it aligns with my strategy before making adjustments.

    Once adjusted, Google’s reports reflect the added conversion value alongside the actual sale or lead value. If using cost-per-conversion models, the discrepancy is less impactful. However, it can skew ROAS in a ROAS-based model. Luckily, Google introduced a column to separate true and additional values for clarity.

    ```json
{
  "alt": "The CapmatchOne logo with a gradient circle and bold text.",
  "caption": "Discover innovation with the CapmatchOne logo, featuring sleek typography and a modern gradient circle.",
  "description": "The CapmatchOne logo features bold, modern typography coupled with a gradient circle, symbolizing connection and innovation. The sleek design conveys a sense of progress and creativity. This image can be used for branding or promotional purposes, appealing to audiences interested in innovative solutions and forward-thinking designs."
}
```

    Dig deeper: Google Ads quietly rolls out a new conversion metric

    Building high-value customer audiences means adding an audience list of high-value customers. I think about what makes my customers valuable, whether due to high order values or interest in premium services.

    ```json
{
  "alt": "Settings page for adjusting bidding to acquire new customers with options and conversion values for customer types.",
  "caption": "Optimize your bidding strategy by focusing on acquiring new customers and see how conversion values vary for different types.",
  "description": "The image displays a settings interface for adjusting online advertising bid strategies to acquire new customers. It includes options to bid higher for new customers or only bid for new customers, with a section to calculate values using account settings. On the right, there's a comparison of conversion values for existing and new customers, showing how a purchase value of $240.39 differs slightly for each type. Useful for digital marketers aiming to optimize customer acquisition through targeted bidding strategies."
}
```

    Once I compile and upload the list, I need at least 1,000 active members on YouTube or Search networks to serve effectively. Including additional data like phone numbers and addresses improves my match rates.

    If I want a streamlined approach, tools like Klaviyo can integrate audiences directly into my Google Ads account, often yielding high match rates.

    ```json
{
  "alt": "Google Ads setting for lapsed customer retention in Performance Max campaigns.",
  "caption": "Boost your campaign effectiveness by focusing on lapsed customer retention using Google Ads' Performance Max settings.",
  "description": "This image shows a Google Ads interface for setting up customer retention targeting lapsed customers, available only in Performance Max campaigns. It includes options to add an incremental conversion value for lapsed customers with a suggested value of $489.10. Additionally, it suggests adding audience segments with over 1,000 active members to identify both lapsed and existing customers via the Audience Manager."
}
```

    With everything set in the customer lifecycle optimization section, it’s time to optimize my campaigns. I can’t apply both bidding goals to the same campaign, so I tailor my targeting and ad copy to different customer types.

    For campaigns focusing on high-value new customers, I expand the Customer Acquisition segment and choose a bidding option to target specifically new customers.

    ```json
{
  "alt": "Interface for managing lapsed high-value customer retention in Performance Max campaigns.",
  "caption": "Optimize your customer retention strategies by adding conversion values for lapsed high-value customers and creating audience segments.",
  "description": "This image displays a user interface for lapsed high-value customer management in Performance Max campaigns. It provides options to add an incremental conversion value and create audience segments for current high-value customers. The suggested value for conversion is $978.20. Customer retention is highlighted as a key feature of these campaigns. This tool aids marketers in enhancing customer engagement and retention efficiently."
}
```

    It’s critical that my ad content resonates whether I’m aiming for new clientele or re-engaging past customers.

    Google Ads customer acquisition

    When it comes to re-engaging lapsed customers, I set bidding parameters for retention back under Goals. There, I find lists for lapsed and high-value lapsed customers, if I have the data to support them.

    ```json
{
  "alt": "Customer retention settings with conversion value for lapsed customers highlighted.",
  "caption": "Optimize your bids: Engage lapsed customers effectively with tailored conversion values.",
  "description": "This image shows a customer retention panel within a marketing platform, illustrating settings for adjusting bids to re-engage lapsed customers. Incremental conversion values are listed alongside customer types. A warning box advises including an audience segment for identifying lapsed customers. On the right, a comparison of conversion values for different customer types based on a $648.78 purchase is shown. Keywords: customer retention, conversion value, marketing platform."
}
```
    Setting for customer retention

    Google suggests values or lists, but accuracy is key before saving adjustments. In Performance Max campaigns, lapsed customers may see a variety of ads, making it essential my messaging speaks to them effectively.

    Everything hinges on having reliable inputs like quality customer match lists and performance metrics. Used right, lifecycle bidding can prioritize valuable customers and revive lapsed ones, but careless usage just skews data without driving real results.


    Inspired by this post on Search Engine Land.


    crushpress.ai community screenshot
  • Is Your ROAS Truly Fueling Business Growth?

    Is Your ROAS Truly Fueling Business Growth?

    I’ve often marveled at high ROAS numbers during my campaigns, thinking they spell success. But, is this performance truly driving growth?

    High ROAS numbers can be misleading, often masking mere demand capture rather than creation. To accurately assess growth, I focus on incrementality and marginal ROAS to guide more effective spending strategies.

    An ecommerce company once collaborated with my PPC agency, eager to delve into the world of paid search. We crafted a robust plan that quickly led to impressive results: high conversion figures and a commendable ROAS.

    It seemed like a strategy success story at first glance. However, when I took a closer look, I noticed something crucial.

    Some conversions might have transpired naturally through direct or organic search channels, suggesting our campaigns perhaps weren’t spurring actual growth. This is a vital aspect that often remains unexamined. To gain genuine insight into performance, I examine incremental lift alongside marginal ROAS.

    The truth about ROAS

    I recall hearing about eBay’s paid search experiment. They heavily invested in brand PPC ads, only to later conduct controlled tests by pausing these ads for certain users, measuring their impact.

    Much of the conversion was absorbed by organic traffic, scarcely affecting revenue. Yet, intriguingly, eBay reactivated the branded ads. Whether this was driven by fear or wisdom, I ponder the implications.

    As automated search and multi-touchpoint customer journeys evolve, accurately attributing conversions to their channels becomes increasingly complex. Advert platforms often claim the credit, but adopting a skeptical view towards these reports is invaluable.

    I comprehend that what these platforms report as attributed return doesn’t necessarily equate to causal lift. While ROAS indicates platform-influenced revenue, it falls short in revealing how much revenue would have materialized regardless of the ads.

    With tools like Performance Max and Advantage+, platforms excel in optimizing conversion avenues, often not discovering new clientele but instead marking the costliest touchpoints in pre-determined conversion paths.

    In the absence of incrementality assessment, automation tends to amplify non-incremental signals: capturing existing demand through brand search campaigns, retargeting nearly-converting users, and creating falsely “safe” channel reports.

    Dig deeper: Paid media efficiency: How to cut waste and improve ROAS

    Incrementality tells you whether marketing created something extra

    By analyzing incrementality, I can determine how the campaign wrought changes it wouldn’t have caused otherwise, typically through comparisons of exposed groups with control groups. This reveals the actual organizational impact of the campaign.

    Recognizing this might feel uncomfortable, yet it serves as a more precise lens for budget allocations than superficial platform attributions.

    Sometimes, even a seemingly successful channel in-platform ROI might not equate to impactful incremental growth. Often, it merely realizes existing demand rather than inventing it.

    If I truly wish to ascertain if a campaign drives genuine growth, the incrementality factor must become my focal question.

    Despite being vital, incrementality only provides part of the picture. The necessity for marginal ROAS to chart subsequent steps can’t be overstated.

    Dig deeper: Why incrementality is the only metric that proves marketing’s real impact

    Marginal ROAS tells you what to do next

    An incremental channel alone doesn’t specify where the next budget investment should proceed. Understanding marginal ROAS is essential here.

    The marginal ROAS examines the revenue from an additional unit of spend, surpassing the average ROI across all expenses. Often, initial budget allocations perform well but subsequently deliver diminishing results.

    As investments continue, dollars spent towards the end become disproportionately less efficient. This principle also holds true for CPA metrics: a blended CPA might appear satisfactory while the terminal dollars spent demonstrate poor efficiency, luring advertisers beyond optimum bidding zones.

    I consider an example where an initial $10,000 budget generates $50,000 in revenue (500% ROAS). Deciding to expand, I then invest an additional $5,000, only to generate an incremental $5,000 revenue.

    • Your new average ROAS: 366% 
    • Your marginal ROAS: 100% (Essentially a $1-to-$1 trade.)

    In such instances, the final $5,000 expenditure was ineffective, despite overall acceptable “average” performance on dashboards.

    This highlights the folly of focusing solely on average ROAS. It can obscure the genuine scalability that might only be viable at lower spend levels, misleadingly disguising profitable demand capture as flawed incremental expansion.

    Informed decision-making requires peering deeper: platform ROAS aids in optimizing in-platform efforts, incrementality assesses campaign-generated value, while marginal ROAS indicates where the ensuing budgets should be directed.

    A robust ROAS can reflect true efficiency or merely illustrate a platform ensnaring already-converting demand. Hence, incrementality tests form the cornerstone of my analysis.

    My critical inquiry is not whether a channel is efficient per se, but whether subsequent dollars are sufficiently efficient. This understanding is essential for prudent scaling.

    Dig deeper: The marketing measurement flywheel: A 4-step framework for proving impact

    Options for incrementality testing

    Embarking on incrementality testing doesn’t require a flawless measurement lab. Utilizing geo tests, holdouts, audience exclusions, and controlled spending reduction can enhance understanding far beyond another month spent in attribution debates.

    • Geo-split testing: Organize markets into dual comparable geographic groups, maintaining ad runs in a “test” grouping while halting them in a “control” group. Revenue disparities between these regions unveil the genuine incremental lift of your ads.
    • Search lift tests (holdouts): Leverage platform tools to generate holdout groups, excluding a small user fraction from ad exposure. The behavioral contrasts between them and exposed groups unveil Search or YouTube campaign direct impacts.

    Furthermore, investigating remarketing, branding, awareness campaigns, or supplementary social channels can reveal additional insights.

    The real shift: From reporting performance to allocating capital

    For too long, marketing teams have restricted measurement to explaining past events. The optimal application lies in shaping future endeavors effectively.

    Incrementality helps me discern value creation within a channel, while marginal ROAS justifies additional investments. Together, they elevate marketing measurement from mere reporting to informed capital allocation.

    ROAS demonstrates credit allocation, incrementality pinpoints actual transactional changes, and marginal ROAS guides subsequent budgeting. It’s crucial to remember that incrementality differs from attribution. While attribution awards channel credit, incrementality evaluates whether this pursuit justified itself.

    Dig deeper: How to take your marketing measurement from crawl to sprint


    Inspired by this post on Search Engine Land.


    crushpress.ai community screenshot