Tag: Attribution Models

  • How to Build AI-Assisted Multi-Channel Marketing Operations

    How to Build AI-Assisted Multi-Channel Marketing Operations

    You probably don’t need another dashboard. You need a dependable way to turn one campaign brief into coordinated channel work, bring the results back into one operating view, and move from a useful signal to an approved action without reopening every platform.

    AI can shorten that loop, but only when it sits inside a clear operating system. Give it shared definitions, bounded permissions, review gates, and a record of every decision. Without those controls, AI simply produces inconsistent work faster.

    Find the delay between data and action

    When a campaign spans 12 channels, weekly reporting can become a chain of exports, spreadsheet repairs, naming lookups, metric reconciliation, screenshots, and explanations. The obvious cost is staff time. The more damaging cost is latency: a performance problem can continue consuming budget while the team is still assembling the evidence needed to discuss it.

    Start by tracking a full working week before choosing an AI tool. Record the work as it happens, including small tasks that disappear inside a reporting block. Use one row per task and capture:

    • Trigger: what caused the task, such as a scheduled report, a stakeholder question, or a performance alert.
    • Input: the dashboard, export, brief, message, or spreadsheet you had to open.
    • Transformation: what you changed, matched, calculated, reformatted, interpreted, or explained.
    • Output: the report, recommendation, platform change, approval request, or status update produced.
    • Manual handoffs: every person or system that had to receive, approve, correct, or re-enter the work.
    • Decision unlocked: the action that became possible after the task was complete. If there was no decision, note that too.
    • Elapsed time and waiting time: separate hands-on effort from delays caused by missing access, stale data, unclear ownership, or approvals.

    Then classify each task by the kind of work it contains. Retrieval moves information out of a channel. Reconciliation makes names and totals line up. Interpretation decides what the evidence means. Execution changes a live campaign. Explanation turns the decision into something another person can understand.

    This classification reveals where AI belongs. Repeated retrieval, formatting, matching, and first-draft explanation are strong candidates for assistance. Budget choices, attribution judgments, brand claims, audience exclusions, and live publishing require tighter human control. A task can contain both kinds of work, so automate the bounded transformation rather than handing over the entire task.

    Prioritize bottlenecks by their effect on the data-to-action cycle, not just by the hours they consume. Map the path as signal → review → decision → platform change → verification. A repetitive task near the beginning of that path can delay every decision downstream. Removing that delay is usually more valuable than automating a polished deliverable that nobody uses to make a decision.

    Build a shared campaign contract before adding automation

    Team members assemble channel components around a shared campaign blueprint while a small glowing AI mechanism works within predefined slots.

    Cross-channel automation needs a control plane: a small set of shared objects and rules that exist independently of any network. The central object should be a campaign contract. This is the approved record of what the campaign is trying to do and which elements must remain consistent when work moves between channels.

    A practical campaign contract should identify the business objective, intended audience, offer, message, conversion event, budget guardrails, geographic scope, active period, creative concept, required claims or disclaimers, asset identifiers, owner, approval state, and canonical campaign ID. It should also distinguish fixed elements from adaptable ones. The offer may be fixed while format, length, crop, placement, and channel-specific wording remain adaptable.

    The canonical campaign ID matters because network names are presentation labels, not reliable identity. Adopt a consistent naming convention across accounts, but keep a separate registry that maps every network campaign, ad group, creative, and tracking asset back to the shared campaign. This lets a shortened or platform-constrained name change without breaking the relationship.

    Build a metric dictionary beside that registry. For every metric used in a cross-channel view, record its business meaning, originating system, calculation, attribution basis, refresh expectation, exclusions, and owner. Networks can use different campaign structures and attribution logic, so identical labels do not guarantee identical measurements. Keep platform-reported conversions, analytics conversions, and modeled business outcomes visibly distinct unless you have an explicit reconciliation rule.

    Operating layerAuthoritative recordWhat AI may doWhat must be controlled
    IntentApproved campaign contractDraft channel adaptations and identify missing fieldsObjective, offer, audience, claims, and approval state
    IdentityCanonical campaign registrySuggest matches between network objects and shared IDsAmbiguous matches and changes to existing mappings
    EvidenceRaw channel data plus metric dictionaryNormalize formats, flag gaps, and prepare summariesDefinitions, attribution differences, and reconciliation rules
    DecisionRecommendation and approval ledgerGenerate hypotheses, summarize evidence, and draft actionsFinal judgment, accountable owner, and authorization
    ExecutionPlatform change historyPrepare or queue permitted changesSpend, publishing, targeting, deletion, and rollback

    This design prevents a common failure: forcing every channel into one flattened schema and calling the result unified. Unification should make relationships visible while preserving meaningful differences. Normalize identity, ownership, dates, currencies, and approved definitions. Do not erase attribution differences or channel-specific context merely to make the spreadsheet look tidy.

    Give AI bounded jobs, not vague authority

    An AI assistant performs better when each job has a defined input, transformation, output, and permission boundary. Telling it to optimize the campaign mixes analysis, judgment, execution, and accountability into one instruction. That makes errors harder to detect and leaves nobody certain about what the system changed.

    Write an AI work order for every automated workflow. Include:

    • Approved inputs: the exact campaign contract, data tables, assets, and prior decisions the job may use.
    • Requested transformation: the specific mapping, classification, adaptation, comparison, summary, or recommendation required.
    • Elements that must not change: such as the offer, conversion event, audience exclusions, brand claims, or legal language.
    • Output schema: the required fields and status values, including missing information and unresolved uncertainty.
    • Escalation rule: the conditions that should stop the workflow and send it to a named owner.
    • Write permissions: whether the system may only read, draft, queue for approval, or execute.
    • Verification step: how the team will confirm that the intended platform state matches the approved action.

    For example, a creative adaptation job could receive an approved campaign contract and master asset. It may adjust length, format, placement language, and crop guidance for each channel. It must preserve the offer, approved claims, audience, and call to action. Its output should contain draft variants, assumptions, missing assets, and a review status. It should have no publishing permission.

    Use deterministic rules where the answer must be exact. IDs, currencies, required fields, date formats, budget caps, and approval states should be validated by explicit logic. AI is useful when language or context is ambiguous: matching imperfect names, classifying creative themes, finding possible explanations, adapting a brief, and turning structured evidence into a readable draft. It should not quietly invent a value when an exact field is missing.

    A sensible permission ladder moves from read to draft, then recommendation, approval queue, and finally limited execution. Advance a workflow only after you can reconcile its inputs, inspect its logs, identify an accountable owner, detect failures, and reverse an incorrect change. For paid campaigns, unreviewed budget or targeting changes can waste money. For owned channels, an unreviewed publishing action can expose inaccurate claims. Keep those actions behind explicit approval until the controls have proved dependable.

    The goal is not to keep humans clicking every button forever. It is to reserve human attention for decisions that involve trade-offs, accountability, or material risk. The system can handle preparation and coordination while the owner approves the action and remains able to explain why it happened.

    Run the operation from exceptions and decisions

    Two marketing operators review three highlighted campaign exceptions routed by a transparent AI prism while routine signals continue in the background.

    A unified dashboard still leaves someone hunting for the important row. An effective operating view should instead tell you what changed, what needs attention, what decision is blocked, and whether an approved action reached the platform correctly.

    Organize the working queue around four kinds of exception:

    • Data exceptions: failed connections, stale refreshes, missing fields, duplicate records, unmatched campaign IDs, or totals that fail an agreed reconciliation rule.
    • Performance exceptions: a campaign crosses a threshold that the owner defined for its objective, budget, and stage. The AI may detect the condition, but it should not invent the threshold.
    • Decision exceptions: the evidence supports more than one plausible action, an assumption remains unresolved, or approval is overdue.
    • Execution exceptions: the live platform state does not match the approved change, verification failed, or the expected result cannot be observed.

    Check data health before discussing performance. A persuasive summary built from a stale connector or broken campaign mapping is still wrong. Surface the affected channels, the last successful refresh, the missing entities, and the decisions that should be paused until the evidence is repaired.

    Turn every recommendation into a decision record. Capture the campaign ID, evidence considered, attribution basis, proposed action, expected effect, uncertainty, reviewer, approval status, execution status, platform confirmation, and rollback instruction. If the recommendation changes during review, preserve both the original and approved versions. This gives you a traceable chain from evidence to action instead of a collection of chat messages and overwritten spreadsheet cells.

    Reporting should follow the same logic. Lead with business outcomes and material changes. Show what moved across channels, but label differences in attribution and data freshness. List actions completed, decisions required, owners, and unresolved data-quality issues. Put diagnostic detail in an appendix rather than forcing a stakeholder to infer the decision from a wall of metrics.

    Agencies can also automate branded reports assembled from multiple networks. The narrative still needs controls. Generate it from the approved metric dictionary and decision ledger, require links back to the underlying evidence, and prevent the report from presenting a hypothesis as a confirmed cause. Automation should remove assembly work without hiding uncertainty.

    Choose a pilot that tests the operating model

    Evaluate AI-native tools against your workflow, not their most polished demo. The useful promise is a shared brief that can coordinate work across channels and a unified view that shortens the route from evidence to action. Whether a product can support that promise depends on its connectors, identity model, controls, and failure behavior.

    Ask each vendor or internal team to demonstrate the following with a representative campaign:

    • Map network objects to your canonical campaign ID without discarding channel-specific structure.
    • Show the origin, refresh state, definition, and attribution basis of every reported metric.
    • Reconcile a channel view with its native platform under a written reconciliation rule.
    • Apply a change to the shared brief, preview the resulting channel adaptations, and route them through approval without publishing.
    • Expose every prompt, rule, recommendation, approval, and executed change in an audit trail.
    • Demonstrate what happens when a connector fails, a campaign is renamed, required data is missing, or two records appear to match.
    • Restrict permissions by role, channel, account, action type, and approval state.
    • Export the campaign registry, metric definitions, decision history, and reports in usable formats.
    • Show how a queued or completed change is stopped, corrected, or rolled back.

    Begin the pilot with a frequent, reversible workflow such as weekly data assembly, exception detection, recommendation drafting, and report generation. Connect data in read-only mode first. Establish the campaign mappings and metric definitions, reconcile the output, and then allow the system to draft recommendations. Keep execution behind approval while you test whether the evidence, reasoning, and logs are good enough to support a real decision.

    Measure the pilot against your own baseline. Track hands-on reporting time, waiting time, manual transfers, corrections, unmatched entities, stale-data incidents, recommendations accepted or materially changed, and elapsed time from signal to verified action. Do not substitute a vendor’s productivity claim for the bottleneck you observed in your own audit.

    Pause expansion if the system cannot reproduce agreed totals, preserve attribution context, identify the evidence behind a recommendation, enforce approval boundaries, or reveal what it changed. Those are operating requirements, not optional refinements. Adding more channels before they work will multiply ambiguity.

    Key takeaways

    • Optimize the delay from signal to verified action, not merely the time spent producing a report.
    • Create a shared campaign contract, canonical ID registry, and metric dictionary before automating cross-channel work.
    • Normalize identity and definitions while preserving genuine differences in channel structure and attribution.
    • Give AI bounded transformations, explicit inputs, structured outputs, escalation rules, and the minimum necessary permissions.
    • Run daily work from data, performance, decision, and execution exceptions rather than scanning every dashboard.
    • Test a read-only, approval-gated workflow against your own baseline before allowing broader execution.

    On your next reporting cycle, start the task log before opening the first platform. Use what it reveals to write the campaign contract and select one approval-gated workflow. Once that workflow can move from clean evidence to a verified action with a complete record, you have something worth extending to the next channel.

    References

  • AI-Powered Ads on Google and Microsoft: A Control Plan

    AI-Powered Ads on Google and Microsoft: A Control Plan

    If you run paid campaigns on Google and Microsoft, the important question is no longer whether AI will touch your advertising. It already influences ad creation, query interpretation, bidding, product discovery, campaign operations, and measurement. Your real decision is which tasks to delegate and which decisions must remain under human control.

    That distinction matters because the two platforms are automating different parts of the job. Google is moving ads deeper into conversational search, discovery, and commerce. Microsoft is reducing the friction of importing, bidding, and reporting across accounts. You need a control plan that reflects those differences, not one generic “AI advertising” switch.

    Decide what AI may decide before you activate it

    A campaign manager controls a transparent gate separating automated advertising tasks from protected human decisions, with several signals paused for review.

    AI-powered advertising is not a single feature. It is a stack of decisions. An AI system can generate an asset, select an audience, adjust a bid, explain a product, recommend an account change, or predict a future outcome. Those actions do not carry the same risk.

    Google’s stack now reaches from Conversational Discovery ads, Highlighted Answers, Shopping explainers, and lead-generation agents to creative production and predictive measurement. Microsoft’s stack emphasizes cross-platform imports, portfolio bidding, attribution, and more configurable reporting. Before adopting any of it, assign a human owner to the decision the system is helping make.

    AI layerPlatform examplesWhat you should control
    Customer interactionConversational Discovery ads, Highlighted Answers, Shopping explainers, and Business Agent for LeadsPermitted claims, qualification rules, escalation paths, and the point at which a person takes over
    Creative productionText, image, and video generation in Asset StudioApproved facts, brand rules, legal review, asset rights, and final publication approval
    Media deliveryDemand Gen optimization and Microsoft cross-account portfolio biddingBusiness objective, budget boundaries, conversion values, exclusions, and stop conditions
    Campaign operationsAsk Advisor and Microsoft Import CenterWhich recommendations become changes, who approves them, and how changes are recorded
    MeasurementMeridian, Qualified Future Conversions, data-driven attribution, and bid-strategy reportingThe definition of success, the quality of conversion data, and whether a result is predictive, attributed, or incremental

    This separation prevents a common mistake: allowing the platform to define the goal while it also optimizes toward that goal. Automation can pursue an objective efficiently, but it cannot decide whether the objective represents profitable growth, a useful lead, or merely an easy conversion.

    Write down the decision rights for every campaign before changing its automation. At minimum, answer these questions:

    • Which conversion should influence bidding, and which events are diagnostic only?
    • What business value is attached to each conversion?
    • Which claims, audiences, locations, products, or queries are outside the campaign’s scope?
    • Can AI-generated assets publish automatically, or must a named person approve them?
    • Which performance change would trigger investigation, a rollback, or a pause?

    If those answers are missing, the campaign is not ready for more autonomy. The problem is governance, not a lack of AI features.

    Fix the input layer before generating ads or answers

    Generative systems multiply whatever you give them. Clean facts become more usable assets. Contradictory facts become more contradictory assets, produced at greater speed.

    This is especially important in conversational advertising. Google’s Business Agent for Leads is designed to answer questions using information from the advertiser’s website. Its Shopping formats can add AI-generated explanations of why a product may fit a shopper’s needs. Merchant Center is also gaining Conversational Attributes and AI Performance Insights for shopping experiences across Search, Gemini, and AI Mode.

    Your website and product feed are therefore operational inputs, not just destinations after the click. If a landing page, product description, promotion, and campaign brief disagree, the model cannot know which version your business intends to honor.

    Prepare a compact campaign truth set before opening a generative tool:

    • Offer facts: the exact product or service, included features, exclusions, availability, eligibility, price conditions, and promotion terms.
    • Approved claims: statements the campaign may make, the evidence behind them, and wording that requires legal or compliance review.
    • Audience intent: the problem being solved, the questions a qualified buyer asks, and the signals that indicate poor fit.
    • Brand rules: tone, visual constraints, prohibited themes, required terminology, and examples of acceptable assets.
    • Product data: consistent titles, descriptions, attributes, images, categories, destinations, and offer details in Merchant Center.
    • Conversion rules: the event that counts, its value, the validation process, and the lag between an ad interaction and a confirmed business outcome.

    Google’s upgraded Asset Studio is designed to interpret marketing briefs, brand guidelines, website content, and campaign goals when generating text, images, videos, and creative themes. That can remove production bottlenecks, but only if those materials are current and internally consistent.

    Use generated creative as a controlled variation, not as automatically approved truth. Check every asset against the offer facts and claims list. Keep the prompt, input materials, output, reviewer, and final disposition together so that you can explain why an asset ran.

    For teams working on SEO, AEO, GEO, and advertising together, align visible page copy, product-feed information, and structured data. JSON-LD cannot repair an inaccurate feed or a vague landing page, and the available platform announcements do not establish schema markup as a direct bidding signal. Its practical role here is consistency: machines and people should encounter the same entity, offer, availability, and business facts wherever those facts appear.

    This becomes more consequential as commerce moves closer to the generated answer. Google has described AI-assisted checkout, Universal Cart, cross-retailer shopping, and buy-now-pay-later integrations, while its Direct Offers pilot includes AI-generated bundles and native checkout for Universal Commerce Protocol merchants. When discovery and transaction happen within the same assisted journey, inaccurate product data has fewer opportunities to be corrected later.

    Give Google and Microsoft different operating roles

    A split illustration contrasts an exploratory product discovery environment with a structured campaign operations room connected by a bridge.

    Running both platforms does not mean cloning one campaign and calling the job complete. Their AI capabilities solve different problems, and your testing plan should reflect that.

    Google is pushing further into the interaction itself. Gemini can interpret a conversational query, assemble an explanation, place a relevant offer within an AI-generated response, or support a lead conversation. Demand Gen can distribute creative and product experiences across YouTube, Discover, Maps, and Shopping. Its expanded tools include creator partnership videos, Merchant Center product videos, Maps inventory, and AI-assisted campaign setup.

    Use Google when you want to test how creative, product data, and assisted discovery work together. The useful question is not merely whether a new format gets more clicks. Ask whether it helps the right user understand the offer, advances that user to a valuable action, and produces a business outcome that survives validation.

    Availability should shape your plan. Conversational Discovery ads and Highlighted Answers were announced as U.S. tests on mobile and desktop. AI-powered Shopping ads and Business Agent for Leads were described for U.S. open beta, while many Demand Gen additions were expanding through open beta globally. Treat tests, pilots, and betas as learning opportunities, not guaranteed inventory in a forecast.

    Microsoft is concentrating more heavily on operational leverage. Its Import Center can search and filter imports from Google Ads and Meta Ads, pause or edit imported campaigns, surface troubleshooting help, and provide recommendations after import. Cross-account portfolio bidding extends automated strategies across Search and Shopping accounts, while new reporting fields make bid targets easier to inspect.

    Use Microsoft to reduce duplicated setup and coordinate related accounts, but do not confuse a successful import with an equivalent campaign. An imported structure can be technically valid while optimizing toward the wrong conversion or carrying assumptions that do not fit its new environment.

    Audit every import before it spends:

    • Confirm campaign status, budgets, bidding strategy, and portfolio membership.
    • Map conversion goals and values to the business outcome you intend to optimize.
    • Review location, audience, product, and inventory scope.
    • Test landing-page URLs and tracking parameters.
    • Recheck negative constraints, brand exclusions, and any setting that limits where an ad can appear.
    • Record differences between the originating campaign and the imported version.

    Cross-account portfolio bidding is most defensible when the participating accounts share compatible goals and value definitions. Pooling signals from unrelated outcomes can make the algorithm look busy without making the portfolio economically coherent.

    The same discipline applies to Google’s Ask Advisor, which connects Ads, Analytics, Merchant Center, and the Google Marketing Platform to help build campaigns, analyze performance, recommend changes, and automate operational tasks. A recommendation should enter your normal approval process. The fact that an assistant can execute a task faster does not change who is accountable for the result.

    Measure decisions, not just automated output

    AI advertising creates more observable activity: more assets, more variations, more bid adjustments, more recommendations, and more predictions. Activity is not evidence of incremental value.

    Build measurement at three levels:

    • Control quality: Did the system stay inside the approved offer, brand, audience, and budget boundaries?
    • Platform performance: What happened to conversions, conversion value, cost per acquisition, return on ad spend, impression share, and other campaign metrics?
    • Business impact: Did leads qualify, transactions hold, revenue materialize, and the campaign add outcomes that would not otherwise have occurred?

    Microsoft’s reporting expansion helps with the middle layer. Advertisers can inspect average Target ROAS, average Target CPA, average Target impression share, conversion metrics in custom columns, and reports segmented by goal name. Data-driven attribution is also available for automated strategies including Maximize Conversions, Maximize Conversion Value, and Enhanced CPC.

    Those fields can show how the platform allocated credit and pursued a target. They do not, by themselves, prove that advertising caused the reported outcome. Attribution distributes credit among observed interactions. Incrementality asks what changed because the campaign ran.

    Google is adding tools for that broader question. Demand Gen includes Uplift Experiments and Campaign Type Attribution. Meridian, Google’s open-source marketing mix model, is being integrated into Analytics 360 to combine first-party and cross-channel data, estimate incremental performance, forecast outcomes, and support media-mix decisions.

    Qualified Future Conversions add another type of evidence. The Gemini-powered metric links current advertising activity with possible future sales signals, including branded search behavior. It was announced as a restricted global pilot, with wider beta access anticipated later. A predictive future-conversion signal is useful for planning, but it is not realized revenue and should not be booked or reported as though it were.

    Use a measurement ladder that matches the maturity of the campaign:

    1. Define the validated business conversion and its value before changing bidding.
    2. Verify that Google and Microsoft receive comparable, correctly classified conversion signals.
    3. Inspect performance by goal so that a rise in easy secondary actions cannot hide a decline in valuable outcomes.
    4. Compare generated assets with your established creative process using the same campaign objective and review rules.
    5. Use controlled uplift testing where it is available to investigate causal impact.
    6. Use marketing mix modeling for cross-channel allocation questions that campaign attribution cannot answer alone.
    7. Treat predictive metrics as planning inputs until the predicted behavior becomes an observed business result.

    Do not optimize a campaign against a forecast and then cite the same forecast as proof that the optimization worked. Separate the signal used to make a decision from the evidence used to evaluate that decision.

    Key takeaways

    • AI-powered advertising is a stack of creative, interaction, delivery, operational, and measurement decisions. Assign human ownership at each layer.
    • Google’s strongest shift is toward conversational discovery, generated product explanations, integrated commerce, and creative distribution across its properties.
    • Microsoft’s strongest shift is toward easier cross-platform imports, coordinated portfolio bidding, attribution, and more transparent reporting.
    • Your website, product feed, campaign brief, brand rules, and conversion definitions must agree before you let generative systems use them.
    • An imported campaign needs a full settings and measurement audit; technical compatibility does not guarantee strategic equivalence.
    • Attributed conversions, incremental outcomes, and predicted future conversions answer different questions. Do not report them as interchangeable results.

    Your next move can be deliberately small. Choose a campaign with a clear conversion, document its approved facts and decision boundaries, and activate only the AI capability whose output you can inspect. Once the measurement holds, expand the system. If the measurement does not hold, more automation will only make the uncertainty harder to unwind.

    References

  • Paid Search in the AI Era: A Practical Operating Model

    Paid Search in the AI Era: A Practical Operating Model

    If your paid search account is hitting its platform targets but you cannot explain which customers are real, why automation moved spend, or whether the resulting leads create value, your problem is no longer bidding. It is control.

    AI has not removed human demand. It has inserted more software between a person’s intent and your business outcome. Marketing now operates among systems assessing intent, identity, risk, relevance, and value at the same time. To stay effective, you need an operating model that gives automation a clear objective, trustworthy signals, and firm boundaries.

    Key takeaways

    • Optimize around the customer’s goal and the business outcome, not the keyword or platform conversion in isolation.
    • Audit identity, deduplication, qualification, and revenue signals before giving automation more freedom.
    • Give every automated campaign an operating envelope: a budget boundary, an approved objective, monitoring rules, an owner, and a rollback condition.
    • Use longer, context-rich prompts to understand intent, but do not treat entire prompts as a new keyword list.
    • Let PPC, SEO, GEO, content, analytics, and CRM teams work from one shared record of customer problems, constraints, evidence needs, and outcomes.

    Rebuild paid search around the customer goal

    The durable advantage of paid search was never the keyword itself. It was the ability to reach expressed demand, test a message, and connect acquisition to measurable post-click activity. That combination made paid search accessible, testable, and accountable in a way that traditional advertising often was not.

    The keyword was simply the interface available at the time. It gave you a compressed clue about what someone wanted. A prompt or conversation can reveal much more: the underlying problem, the constraints, the desired output, the urgency, and the standard by which an answer will be judged. As discovery moves toward prompts, conversations, and AI assistants, that fuller context becomes more useful than an isolated phrase.

    This does not mean copying complete prompts into a campaign and calling them keywords. It means designing your acquisition strategy around the job the person is trying to complete.

    Create an intent brief before a campaign brief

    For each meaningful demand theme, write a short intent brief with these fields:

    • Customer goal: the outcome the person is trying to achieve.
    • Trigger: the situation that made the goal important now.
    • Constraints: budget, timing, compatibility, risk, internal approval, or another limiting condition.
    • Evidence required: the proof the person needs before moving forward.
    • Disqualifiers: conditions under which your offer is not suitable.
    • Next useful action: the smallest meaningful step the person can take with your business.

    Consider a hypothetical search for “best CRM.” The phrase is too broad to support a precise message. The actual job might be to replace a spreadsheet before a sales team expands, preserve existing contact history, and avoid a developer-led migration. A useful campaign speaks to that job and those constraints. A weak campaign repeats “best CRM” in the ad and sends every visitor to a generic product page.

    Turn the intent brief into campaign decisions in a fixed sequence:

    1. Choose the customer goal you are willing and able to serve.
    2. Group queries by that goal, not merely by shared words.
    3. Write the message around the desired outcome and the most important constraint.
    4. Make the landing page state who the offer is for, what it helps them do, and what evidence supports the claim.
    5. Include disqualifying information early enough to prevent low-fit clicks from becoming misleading conversions.
    6. Measure the next action that represents genuine progress toward business value.

    The same brief can guide paid ads, organic pages, answer-oriented content, and AI-search optimization. Each channel may need different formatting, but the underlying customer problem should not change when the channel changes.

    Fix signal integrity before expanding automation

    An analyst inspects a transparent pipeline that filters noisy and duplicate inputs into a clean stream of customer signals.

    A customer journey is no longer a neat line from impression to click to conversion. Multiple systems can evaluate the same person simultaneously. An ad platform may predict high purchase intent while a fraud model lowers trust, an identity service fails to join the session to a known account, a CRM labels the record as a duplicate, or a messaging system suppresses further contact. These decisions can all be internally reasonable and still produce a broken journey.

    More automation makes those contradictions move faster. It does not resolve them. When identity or conversion data is ambiguous, autonomous systems operationalize the ambiguity: they bid on it, suppress it, personalize around it, or feed it into the next model.

    Write a conversion contract

    A conversion contract is a shared definition of what each tracked event means. For every event used in reporting or optimization, record:

    • the exact user action that creates the event;
    • the system that first records it;
    • the identifier used to connect it to a person, account, order, or lead;
    • the rule used to prevent duplicate counting;
    • the timestamp and value passed downstream;
    • the conditions that make the event eligible for bidding;
    • the later business event that verifies its quality; and
    • the team responsible for investigating a mismatch.

    Do not allow labels such as “lead,” “qualified lead,” and “customer” to carry different meanings in the ad platform, analytics system, CRM, and finance records. If the definitions must differ, document the differences and prevent teams from comparing them as if they were identical.

    Then run a controlled quality-assurance journey through the whole path: ad click, landing-page action, analytics event, CRM record, qualification state, and final business outcome. Record where an identifier is created, transformed, lost, or replaced. If privacy or consent boundaries prevent a complete join, preserve that limitation in reporting. A documented blind spot is safer than invented precision.

    Build a ladder from activity to verified value

    Keep raw activity separate from increasingly reliable business outcomes:

    1. Delivery: an impression or other opportunity to be seen.
    2. Engagement: a click, visit, or interaction.
    3. Declared conversion: a submitted form, registration, call, or purchase event.
    4. Accepted outcome: a deduplicated event that passes your validity rules.
    5. Qualified outcome: a lead, order, or account that meets your business criteria.
    6. Verified value: the downstream result your organization actually wants.

    Only some of these levels should steer bidding. The rest can remain diagnostic. If a form submission is easy to generate but only qualified opportunities create value, optimizing solely for submissions teaches the system to find more submissions. It does not necessarily teach it to find more qualified opportunities.

    This distinction becomes critical when bot activity, fraud, or other synthetic behavior can imitate engagement. Automated systems tend to optimize what is measurable rather than determine what is true. Your measurement design must therefore separate a recorded action from a verified human or business outcome.

    Watch the movement between levels. If declared conversions rise while accepted and qualified outcomes remain flat, investigate event quality, duplication, traffic mix, and identity resolution before changing bids or creative. If the platform reports improvement but the verified-value layer moves in the opposite direction, the optimization target is not representing the business goal.

    Give automation an operating envelope

    A strategist supervises fast-moving automated agents traveling within a transparent corridor bounded by gates and safety rails.

    Effective automated bidding changes the human job. When a system can make auction-level decisions more quickly than a person, repeatedly adjusting individual bids is not a durable source of value. The higher-value work becomes monitoring automation, setting limits, and diagnosing failures.

    An operating envelope defines where an automated system may act without intervention and what forces a review. It should contain:

    • An outcome boundary: the one primary result the campaign is permitted to optimize toward.
    • A spend boundary: the budget and financial exposure the system may control.
    • A data boundary: the events, values, audiences, and exclusions considered reliable enough to use.
    • A message boundary: the claims, offers, and brand language that may appear.
    • A change record: the date, owner, reason, and expected effect of every material configuration or measurement change.
    • An intervention rule: the condition that triggers investigation, limits delivery, or rolls back a change.

    There is no universal threshold that fits every account. Set boundaries from your own economics, sales capacity, data quality, and risk tolerance. The important part is that the limits exist before the anomaly, not that they copy another advertiser’s settings.

    Use failure patterns to decide where to look

    Observed patternLikely control problemFirst check
    Spend rises while verified value stays flatThe system is finding a cheaper proxy rather than more business valueCompare platform conversions with accepted and qualified outcomes
    One system marks a person high value while another suppresses the same personIdentity, consent, fraud, duplication, or eligibility rules conflictTrace the identifier and suppression reason across systems
    Reported performance changes immediately after a tracking editThe measurement definition changedInspect the change record before treating the movement as customer behavior
    The platform reaches its target while sales quality deterioratesThe steering metric is too far from the business outcomeReview which event and value are eligible for optimization
    Teams report different totals for the same conversionDefinitions, timestamps, deduplication, or attribution rules differReconcile each system against the conversion contract

    Separate steering metrics from observation metrics

    A campaign should not have several competing definitions of success. Choose one primary steering outcome. Keep supporting metrics visible for diagnosis, but do not let every measurable action vote equally on where money goes.

    For example, clicks can explain delivery, form starts can expose landing-page friction, and submitted forms can show response volume. None of them has to be the bidding objective if qualified opportunities are the meaningful outcome. The platform dashboard is an operational view, not your business ledger. Reconcile it with downstream outcomes instead of asking it to serve both purposes.

    Change one important layer at a time when practical. If you replace the conversion definition, expand targeting, change the offer, and alter the landing page together, you may get a different result without learning which change caused it. When a bundled change is unavoidable, document every component and treat the result as a system change, not a clean test of one idea.

    Prepare for prompt-based journeys without guessing the ad format

    AI-assisted discovery is moving beyond retrieving information toward helping people produce an answer, solve a problem, or complete a task. That raises unresolved questions about how advertising, auctions, attribution, and agent-mediated actions will work. You do not need those questions settled before improving the durable parts of your strategy.

    The durable work is to understand the goal, capture its context, explain your value clearly, provide credible evidence, and measure whether the person reached a useful outcome. Those capabilities transfer across keyword search, conversational discovery, recommendations, and future agent interfaces.

    Maintain a shared intent ledger

    An intent ledger turns customer language into an operating asset shared by PPC, SEO, GEO, content, analytics, sales, and CRM teams. Give each intent theme a record containing:

    • the wording customers use;
    • the underlying goal behind that wording;
    • the trigger and constraints that shape the decision;
    • the questions and objections that must be resolved;
    • the evidence needed to establish relevance and trust;
    • the ad, page, or answer that serves the intent;
    • the next meaningful action; and
    • the verified business outcome associated with that action.

    Populate the ledger from the customer language you can legitimately observe: query data, site search, landing-page behavior, sales questions, support requests, and customer-supplied wording. Search-query visibility has historically moved between greater transparency and greater restriction, with privacy changes obscuring some of the detail advertisers once received. Treat visible query data as a partial observation of demand, not a complete census.

    Do not create separate, conflicting intent taxonomies for every channel. A person does not acquire a different underlying problem because one interaction happens in paid search and another happens in an AI assistant. Channel-specific teams can add the details they need while preserving the same customer goal, constraints, and outcome definition.

    Move one campaign through the new operating model

    1. Select one campaign with meaningful spend and a downstream outcome you can inspect.
    2. Write its intent brief and name one primary customer goal.
    3. Build a conversion contract for every event currently used in optimization or reporting.
    4. Trace controlled journeys through the ad platform, analytics, CRM, qualification, and final business record.
    5. Document contradictions between identity, fraud, suppression, audience, and value decisions.
    6. Set the campaign’s operating envelope, including ownership and intervention rules.
    7. Revise the message and landing page around the customer’s goal, constraints, proof needs, and next useful action.
    8. Compare platform-reported improvement with accepted, qualified, and verified outcomes before expanding the model to more campaigns.

    Start with the campaign whose reported success you trust least. Making its signals coherent and its automation legible will give you a reusable pattern for the rest of the account. That is the practical advantage in the AI era: not trying to control every machine decision, but building a system in which those decisions remain bounded, observable, and tied to real customer value.

    References

  • Build Google Commerce Infrastructure From Visibility to Revenue

    Build Google Commerce Infrastructure From Visibility to Revenue

    You can have thousands of products appearing on Google and still have two expensive blind spots. Shoppers may never see listings hidden behind a carousel scroll, while purchases or qualified leads completed elsewhere may never return to Google Ads.

    If you own ecommerce growth, you need two connected but distinct systems: one that measures whether products earn usable visibility, and one that returns offline outcomes to the advertising platform. Here is how to build both without confusing presence with exposure, activity with revenue, or shared reporting with attribution.

    Count the product placements shoppers can actually see

    Shopper viewing a product carousel where several items are visible and many more remain hidden beyond the screen edge.

    A product-pack appearance is not automatically an impression worth celebrating. Google can place products in horizontally scrollable carousels, so the first visible positions receive a very different opportunity from listings that require interaction before they appear.

    The scale makes this distinction material. A monitoring dataset covering more than 63,000 merchants from January 2025 through January 2026 found searches with as many as 60 individual organic product listings on one results page. A report that counts every one of those listings equally will overstate the practical reach of products buried deep in a carousel.

    Keyword coverage can be just as misleading. eBay appeared in product results for 874,621 keywords and generated about 3.2 million estimated visits, while Home Depot appeared for a slightly smaller 831,699 keywords but generated nearly 28.8 million estimated visits. The difference was associated with Home Depot securing more prominent, immediately visible positions. More appearances did not mean more useful exposure.

    Build your product-pack scorecard in layers. Keep each layer separate so an impressive top-line number cannot hide weak placement:

    • Eligible catalog: Products you expect Google to understand and consider for the category.
    • Total appearances: Every detected placement, including positions that require scrolling.
    • Visible appearances: Placements shown before a shopper scrolls the carousel.
    • Visible rate: Visible appearances divided by total appearances. Preserve the counts beside the percentage so a small sample does not look more important than it is.
    • Query quality: Segment high-demand category searches from low-volume long-tail queries. Raw keyword coverage otherwise rewards breadth whether or not that breadth produces meaningful traffic.
    • Observed visits and outcomes: Use analytics for measured sessions, transactions, leads, and revenue. Label third-party traffic estimates as estimates rather than blending them with observed data.

    Review the scorecard by category, not only by domain. A healthy total can conceal one category that wins visible positions and another that appears frequently but remains out of sight. That second category is where feed and merchandising work may create the largest gain.

    Fix commerce inputs before reaching for a blanket discount

    Discounting is easy to change and easy to report, which makes it an attractive explanation for product-pack performance. It is not a reliable standalone lever.

    Among large merchants in the monitored data, Amazon discounted 49% of its catalog and achieved a 72% visibility rate. eBay discounted only 8% and reached 81%. Walmart Seller reached the same 81% visibility rate with 24% of products discounted, while Walmart discounted 27% and recorded a lower 62% visibility rate. That irregular pattern does not establish a universal ranking formula, but it does show why discount depth should not be treated as the primary explanation for placement.

    Start with the inputs Google and shoppers need to evaluate the product: complete product data, clear category relevance, strong images, current pricing and availability, and credible reviews. Promotions can still support a commercial offer, but they cannot compensate for an unclear product identity or poor category fit.

    Turn low visibility into a product-level work queue

    1. Choose one commercially important category rather than auditing the whole catalog at once.
    2. Export products that appear for relevant queries but have a low visible rate.
    3. Compare those products with visible winners in the same category. Check data completeness, category alignment, image quality, review strength, price, and availability.
    4. Group repeated defects. Ten products with the same missing or weak input should become one system fix, not ten unrelated tickets.
    5. Correct one defect class, record the date, and remeasure the same category. Product-pack placement fluctuates, so a before-and-after comparison needs consistent queries and a sufficiently stable observation window.
    6. Escalate products that remain hidden despite clean inputs. They may face a relevance, competitiveness, or demand problem rather than a feed defect.

    This process will not prove that one field caused a ranking change. It will give you a disciplined way to improve controllable inputs without assuming that every movement came from price.

    Specialist retailers should be especially careful not to confuse smaller scale with weaker potential. Camp Chef appeared for 155,299 keywords yet generated about 2.6 million estimated visits through advantageous placements. Its footprint was much smaller than the largest marketplaces, but category focus and placement quality produced substantial estimated traffic. Depth in a category can be more commercially useful than millions of marginal appearances.

    Protect offline conversion measurement as the API route changes

    Offline checkout and sales outcomes flowing through a secure gateway into a newer cloud-based measurement connection.

    Product-pack optimization addresses organic commerce visibility. Offline conversion imports address Google Ads measurement and bidding. They belong in the same commerce operating model, but they are not the same channel and should never be presented as if one directly measures the other.

    Google is moving offline conversion imports, including enhanced conversions for leads, from the Google Ads API toward the Data Manager API. Under the communicated change, UploadClickConversions becomes nonfunctional after June 15 for affected accounts that have not used the feature during the preceding 180 days. The change applies to offline conversion imports for some developers, while other Google Ads API operations continue.

    Do not infer that your integration is safe merely because it still runs or because another Google Ads API operation succeeds. An application can keep managing campaigns while its offline conversion path quietly becomes obsolete. Missing imports can weaken reporting, attribution, and the conversion signals used by automated bidding.

    Use this migration checklist

    1. Find every dependency. Search application code, scheduled jobs, middleware, vendor integrations, and internal runbooks for UploadClickConversions. Include enhanced conversions for leads and any sales or lead events completed outside the immediate ad interaction.
    2. Map the affected accounts. Record which accounts use each workflow, when each last imported conversions, who owns the source system, and how frequently the job runs. The 180-day activity condition makes account-level evidence more useful than a platform-wide assumption.
    3. Define the event contract. Document what qualifies as a conversion, where it originates, how it is identified, which value is sent, and which system is authoritative. Migration is a poor time to preserve an event definition nobody can explain.
    4. Build the Data Manager API route. Keep unrelated Google Ads API operations in place unless they have a separate reason to move. The scope here is the conversion-ingestion workflow.
    5. Test a controlled slice. Confirm that source events are accepted, rejected events are visible to operators, and imported counts and values reconcile with the originating system.
    6. Prevent double counting. A temporary overlap can help validate a migration, but sending the same business event through two active routes without a deduplication plan can corrupt reporting. Document exactly when the old writer stops and the new writer becomes authoritative.
    7. Add failure monitoring. Alert on missing runs, unexpected volume changes, rejected events, and reconciliation gaps. A job that reports technical success but delivers no usable conversions is not healthy.

    Because the communicated cutoff applies selectively, treat the date as a prompt to verify your current environment rather than assuming every account failed at once. The decisive evidence is your dependency inventory, recent account activity, accepted-event reporting, and reconciliation with the source system.

    Join the systems without inventing cross-channel attribution

    A shared commerce data spine makes the two workstreams easier to operate. It does not make Google Ads conversion imports a measurement system for organic product packs. Preserve channel and attribution boundaries while standardizing the business entities used in both.

    At minimum, use consistent product and category identifiers across the commerce feed, landing pages, analytics, CRM or order system, and internal reporting. If you publish product structured data, align its product identity, price, and availability with the same source of truth. The immediate benefit is diagnostic: your team can trace a category from search visibility through site behavior and recorded outcomes without manually translating competing names.

    Product-pack visibilityOffline conversion pipelineWhat you can concludeNext action
    Strong and visibly placedHealthy and reconciledBoth discovery and advertising measurement are operational, but their results still require separate attribution.Compare category economics and prioritize the products with the strongest observed business outcomes.
    Strong and visibly placedBroken or uncertainOrganic discovery may be healthy, but Google Ads reporting and bidding signals are unreliable.Restore and reconcile the conversion pipeline before making bid or campaign conclusions.
    Weak or mostly hiddenHealthy and reconciledAdvertising measurement is usable; the organic product-pack problem sits upstream.Work the category-level product data, relevance, image, review, price, and availability queue.
    Weak or mostly hiddenBroken or uncertainYou have two separate failures, not one vague Google problem.Assign independent owners. Protect conversion ingestion because bidding can be affected, while product visibility remediation proceeds in parallel.

    Give each layer an operating cadence

    • Daily: Check whether offline conversion jobs ran, whether expected events arrived, and whether rejection or reconciliation thresholds were breached.
    • Weekly: Review visible versus non-visible product-pack appearances by category. Create a prioritized issue queue for products with meaningful query exposure but poor placement.
    • Monthly: Compare category-level visibility, measured site outcomes, advertising results, catalog changes, promotions, and resolved data defects. Keep estimated traffic in a separate column from observed sessions and revenue.
    • After a sudden change: Check availability, price, images, reviews, feed completeness, and category mix before concluding that discounting or a single platform update caused the movement.

    Expect movement. Nearly every merchant in the year-long monitoring dataset experienced product-pack visibility shifts, with some gaining during one period and receding later. Google can change how it weighs feed quality, availability, reviews, pricing, and images, so a previously strong visible rate is not a permanent asset.

    Key takeaways

    • Report visible product-pack appearances separately from placements hidden behind a carousel scroll.
    • Segment performance by category and query value; raw keyword coverage can conceal poor positioning and weak traffic.
    • Treat discounts as one commercial input, not a substitute for complete product data, category relevance, good images, reviews, current price, and availability.
    • Audit UploadClickConversions dependencies now and move affected offline conversion workflows to the Data Manager API with reconciliation and failure alerts.
    • Keep organic visibility and Google Ads attribution distinct, even when they share product identifiers and business reporting.

    Start with one important category and one conversion workflow. Establish the visible-placement baseline, clear the highest-frequency product-data defect, and verify that the corresponding offline conversion job reaches its destination. That gives you a working control loop you can extend across the catalog without scaling hidden measurement errors along with it.

    References
  • How to Measure, Test, and Forecast SEO Performance

    How to Measure, Test, and Forecast SEO Performance

    You have rankings moving, traffic shifting, AI citations appearing, and a backlog of SEO changes waiting to ship. The hard question is not what changed. It is whether your work caused the movement, whether the result mattered, and whether you can expect it to continue.

    You can answer those questions with a practical measurement system: define the decision first, preserve a credible baseline, compare the change with a counterfactual, and keep observed results separate from forecast assumptions. That structure turns SEO reporting into evidence you can use to decide what to scale, stop, or test next.

    Start with the decision your measurement must support

    Do not begin with the dashboard. Begin with the decision someone will make after seeing the result. A useful measurement question has this form: If we make a defined change to an eligible group of pages, will a named outcome improve relative to what would otherwise have happened, without damaging an important guardrail?

    That sentence forces you to specify the intervention, population, outcome, comparison, and downside. Compare it with a vague objective such as increasing SEO visibility. Visibility could mean impressions, rankings, citations, share of authority, clicks, or sessions. Those metrics describe different stages of performance and cannot substitute for one another.

    Measurement layerQuestion it answersUseful metricsWhat it cannot establish alone
    DeliveryDid the intended change reach the intended pages?Eligible URLs changed, crawl access, index status, template or component deploymentWhether the change improved performance
    Search exposureDid search or an AI system surface the content more often?Impressions, ranking distribution, page citations, share of authorityWhether people visited or completed a valuable action
    ResponseDid exposure produce a visit?Organic clicks, click-through rate, AI-referred sessionsWhether the additional visits were valuable
    Business outcomeDid the visits produce the result the organization needs?Conversions, qualified leads, subscriptions, or revenue when reliably trackedWhich SEO change caused the result without a comparison

    Choose one primary outcome for the decision. Use the remaining metrics as diagnostics or guardrails. If the decision is whether to expand a content update, organic clicks or qualified conversions may be primary while rankings explain how the result occurred. If the objective is inclusion in AI-generated answers, citations may be primary while referral sessions and conversions reveal the downstream value.

    Write a measurement contract before deployment

    A short measurement contract prevents the definition of success from changing after the numbers arrive. Record the following before implementation:

    • Hypothesis: the mechanism you expect the change to affect and the observable result that should follow.
    • Eligible population: the pages, query groups, markets, devices, or templates to which the conclusion may apply.
    • Intervention: the exact content, technical, linking, visual, or markup change being tested.
    • Primary metric: the outcome that determines the decision.
    • Diagnostics and guardrails: the metrics that explain the result or reveal an unacceptable tradeoff.
    • Comparison method: randomized pages, matched pages, a staged rollout, or a forecasted baseline.
    • Analysis window: when measurement starts, when it ends, and how delayed implementation or incomplete indexing will be handled.
    • Decision rule: the minimum result that would justify scaling, the conditions that would stop the rollout, and what will count as inconclusive.
    • Exclusions: rules for removing pages affected by outages, migrations, tracking failures, or unrelated changes.

    Define ratios as carefully as totals. A rising click-through rate can reflect more clicks, fewer impressions, or a change in query mix. An increasing AI referral share can reflect more AI sessions, fewer total sessions, or both. Always report the numerator and denominator beside an important rate.

    The unit of analysis matters too. A sitewide total may be dominated by a few large pages, while a per-page average can hide the total commercial impact. Report the aggregate effect and the distribution across eligible pages. That lets you see both the overall contribution and how consistently the intervention worked.

    Design SEO experiments around a believable counterfactual

    Two matched miniature website structures sit side by side, with one highlighted change on the test side.

    A before-and-after chart shows that performance changed after deployment. It does not show what would have happened without the deployment. Search demand, seasonality, competitors, search features, algorithmic changes, and the natural trajectory of the pages all continue moving while your test runs.

    The counterfactual is your estimate of that missing outcome. The more believable it is, the more confidently you can attribute the difference to your intervention.

    Use the strongest comparison your site can support

    • Randomized page split: use this when you have many comparable pages. Define the eligible set, then randomly assign pages to changed and unchanged groups. Randomization reduces systematic differences between the groups.
    • Matched pages: pair pages using pre-test traffic, trend, intent, template, topic, and other relevant characteristics. Apply the change to one member of each pair. Matching is weaker than randomization but stronger than choosing a convenient control after the result appears.
    • Staged rollout: release the intervention in waves. Pages scheduled for later waves can temporarily represent what would have happened without the change, provided the waves are genuinely comparable.
    • Interrupted time series: use this when a sitewide change leaves no parallel control. Model the pre-change trajectory, forecast the no-change baseline through the post-change period, and compare actual performance with that baseline. Treat the causal conclusion more cautiously because other events can coincide with deployment.

    Do not assign the strongest pages to the treatment group merely because they appear most likely to win. That creates a built-in difference between treatment and control. If page strength is important, divide the eligible pages into comparable strength bands first and randomize or match within each band.

    Prewrite the analysis, not just the hypothesis

    1. Freeze the eligible page list before looking at post-change performance.
    2. Save the pre-period data at the same grain you will analyze later, including page, query group, device, market, and outcome where relevant.
    3. Check whether treatment and comparison groups have similar pre-period levels and trends. If they do not, repair the design before deployment.
    4. Estimate whether the eligible population can distinguish a worthwhile effect from ordinary variation. If it cannot, combine appropriate pages, extend the observation window, or treat the test as exploratory.
    5. Deploy only the defined intervention. Log unavoidable concurrent changes instead of silently folding them into the result.
    6. Apply the predetermined inclusion, exclusion, and timing rules.
    7. Calculate the effect for the full eligible population before exploring subgroups.
    8. Report total impact, page-level variation, uncertainty, and any guardrail movement together.

    For a simple comparison of aggregated traffic, calculate each group’s relative change first: test change = test after / test before – 1, and control change = control after / control before – 1. The difference between those changes is an estimate of incremental lift. For rates such as click-through or conversion rate, retain the underlying counts and use a method appropriate to a rate rather than treating the percentages as independent totals.

    This calculation is not a substitute for checking pre-period trends, uncertainty, or contamination. It simply makes the causal question explicit: did the changed pages improve more than comparable unchanged pages over the same period?

    Match the intervention to the page’s actual bottleneck

    A six-month test across 47 new and existing articles evaluated featured images, infographics, and videos. Articles receiving infographics recorded a 110% average organic traffic increase, but the gains were associated with pages that were already performing well. The custom visuals did not reliably revive struggling content.

    That result is useful evidence for forming a hypothesis, not a universal forecast for every site. A visual asset can strengthen a page whose topic, search demand, and core content already work. It is unlikely to repair the wrong search intent, weak topic demand, poor indexability, or a page that does not answer the query.

    Segment visual tests by pre-period page strength before deployment. If strong and weak pages respond differently, you will know where production investment is likely to pay back. If you create those segments only after seeing the outcome, label the finding exploratory and confirm it in another test.

    Interpret movement without mistaking it for causation

    An SEO result becomes more credible when the movement follows the mechanism you predicted. If you improved titles to earn more clicks, you would expect the main change to appear in click-through rate among relevant impressions. If impressions rise because the page begins appearing for additional queries, query coverage is part of the mechanism. If conversions rise while search exposure and visits remain flat, the explanation probably sits elsewhere.

    Observed patternReasonable interpretationNext check
    Impressions rise while ranking distribution is stableDemand or query coverage may have expandedCompare query mix, branded versus non-branded exposure, markets, and devices
    Rankings improve while clicks remain flatThe improved positions may have little demand or may not be earning clicksInspect impressions, result-page features, snippets, and query-level click-through rate
    Organic clicks rise while conversions remain flatThe additional traffic may have different intent or the onsite path may be limiting valueCompare landing pages, query groups, conversion definitions, and the numerator and denominator of the conversion rate
    Citations rise while AI referrals remain flatAI exposure improved without producing measurable visitsCheck cited pages, grounding queries, referral tagging, and whether a visit was expected from the answer type
    AI referral share rises while AI session count is flatThe denominator may have fallenReport AI-referred sessions and total sessions separately
    Only a few large pages account for the gainThe intervention may be valuable but not broadly repeatableReport total contribution and the page-level distribution instead of one average

    Audit alternative explanations before declaring a win

    • Seasonality: did the topic normally rise during this part of the demand cycle?
    • Query mix: did exposure shift toward branded, navigational, or otherwise different searches?
    • Page mix: did new, removed, redirected, or newly indexed URLs change the population being measured?
    • Tracking: did consent behavior, channel classification, event definitions, or referral detection change?
    • Concurrent releases: did internal links, templates, site speed, navigation, paid promotion, or other content updates change at the same time?
    • External search changes: did competitors, result-page features, or the retrieval behavior of an AI platform change during the measurement window?
    • Contamination: could treatment pages affect control pages through internal linking, shared templates, or overlapping queries?

    A change ledger makes this audit possible. Record deployments, migrations, tracking changes, major content releases, and known incidents against the same timeline as the test. An unexplained spike is much harder to interpret months later, when the people reviewing it no longer remember what shipped.

    Separate positive, negative, and inconclusive results

    • Decision-useful positive: the estimated lift clears the minimum worthwhile effect, uncertainty is acceptable, guardrails are intact, and the causal chain is plausible.
    • Decision-useful negative: the result is precise enough to rule out a worthwhile gain or shows a meaningful downside. This can justify stopping or redesigning the intervention.
    • Inconclusive: the estimate is too uncertain, the groups were not comparable, implementation was incomplete, or confounding prevents a clear decision. Inconclusive does not mean the intervention had no effect.

    Define the minimum worthwhile effect from the decision, not from whichever result looks favorable. Include production cost, maintenance burden, the amount of eligible traffic, and the opportunity cost of delaying other work. Statistical evidence can tell you whether an effect is distinguishable from variation; it cannot decide whether the effect is worth implementing.

    Treat unplanned subgroup findings carefully. If a result appears only after repeatedly slicing by device, market, template, intent, or page type, it may be a useful lead. It is not yet a reliable scaling rule. Put the suspected interaction into the next measurement contract and test it deliberately.

    Forecast the no-change baseline before adding SEO upside

    A neutral path continues from a present-day checkpoint while a translucent forecast path rises above it with widening uncertainty bands.

    A useful SEO forecast begins with a less exciting question: what is likely to happen if the proposed work produces no incremental gain? That no-change baseline separates expected demand, existing momentum, and seasonality from the contribution you hope to create.

    Forecasting only the desired outcome bakes the business target into the model. A target tells you what the organization wants. A forecast estimates what the available evidence supports. Keep both, but never label one as the other.

    Build and validate the baseline in a fixed sequence

    1. Choose the target series. Forecast the metric that supports the decision, such as organic clicks, eligible-page sessions, AI-referred sessions, or qualified conversions. Do not forecast rankings and silently translate them into revenue.
    2. Choose a stable grain. Use a consistent time cadence and a page, query, template, or market grouping with enough signal to model. Group a noisy long tail by a defensible shared characteristic instead of pretending every URL has an independent, stable trajectory.
    3. Set the cutoff. Train the baseline only on information available before the forecast begins. Do not let post-launch observations leak into a supposedly independent no-change forecast.
    4. Model the existing pattern. Account for trend and recurring seasonality that are visible in the historical series. Add known events only when they are defined independently of the result you are trying to explain.
    5. Backtest at the decision horizon. Move the cutoff backward, generate forecasts for periods whose actual outcomes are already known, and measure the errors. Compare the model with a simple benchmark such as the most relevant prior pattern.
    6. Produce an interval. Show a plausible range around the baseline, not only a point estimate. The interval should generally reflect the larger uncertainty that accompanies a longer horizon.
    7. Add scenarios outside the baseline. Apply tested lift only to the pages, queries, or markets eligible for the intervention. Keep unvalidated assumptions visibly separate.
    8. Reconcile and monitor. Make sure cohort forecasts add up to the site-level view, then compare actuals with the frozen baseline and its interval as data arrives.

    When the series has non-linear trends or recurring seasonal structure, a model such as Prophet can support non-linear SEO forecasting. The model name is not the quality test. Use it only if backtesting shows that it handles your series better than a simpler benchmark at the horizon you need.

    A sophisticated model cannot automatically understand a migration, tracking break, search-feature change, one-off campaign, or abrupt shift in content supply. Annotate structural breaks, test their effect on forecast error, and explain any manual treatment. Otherwise, the model may faithfully project a historical artifact that no longer applies.

    Keep baseline, committed work, and upside hypotheses separate

    Forecast layerWhat belongs in itHow to use it
    BaselineExpected performance from existing trajectory, recurring seasonality, and independently known conditionsRepresents the no-incremental-lift comparison
    Committed scenarioBaseline plus changes already approved or deployed, using effects supported by relevant evidenceSupports operational planning while preserving the assumptions
    Upside scenarioBaseline plus interventions whose lift is plausible but not yet validated for the eligible populationShows opportunity without presenting aspiration as evidence

    A transparent scenario calculation can be simple: incremental outcome = eligible baseline volume x validated lift x rollout coverage. Each term must refer to the same population and period. If a test covered high-performing educational pages, do not apply its lift to product pages, weak pages, or the entire domain without new evidence.

    Forecast traffic and business outcomes as connected but separate stages. If you forecast conversions, state how forecast visits become forecast conversions and whether conversion rates differ by landing-page type, query intent, market, or device. A sitewide conversion rate can overstate the outcome when the forecast changes the traffic mix.

    When actual performance leaves the forecast interval, investigate before rewriting the baseline. The deviation may be genuine incremental lift, but it may also be a demand shock, tracking failure, structural break, or model miss. Preserve the original forecast so the organization can learn how accurate its assumptions were.

    Measure AI visibility as a funnel, not a composite score

    AI visibility adds useful observations to SEO measurement, but it does not collapse the measurement chain. A citation is exposure. An AI-referred session is a visit. An onsite conversion is an outcome. Combining them into one score conceals where performance actually changed.

    Microsoft Clarity’s generally available Citations dashboard reports page citations, share of authority, AI referral traffic, grounding queries, cited pages, and citation trendlines. Google Analytics also provides AI assistant traffic reporting. These measurements help you connect AI-generated answers with site activity, provided you preserve the distinctions between them.

    AI measurementWhat it tells youCommon misreadingBetter reporting practice
    Page citationsHow often pages from your domain were referenced in AI-generated answers during the selected period, including multiple citations within one answerTreating citation count as unique answers, users, or visitsReport citations by cited URL and grounding query, and keep referral sessions separate
    Share of authorityYour domain’s citations relative to other domains for the same query setReading the share as coverage of the entire marketPreserve the query set and report your citation count beside the competitive share
    AI referral trafficAI-referred sessions divided by total sessions during the selected periodAssuming a rising percentage always means more AI visitsShow AI-referred sessions, total sessions, and the resulting percentage together
    Grounding queriesThe queries associated with how AI systems evaluated or retrieved cited contentTreating every grounding query as a conventional search query typed by a userUse the queries to analyze interpreted intent and retrieval coverage
    Cited pagesWhich URLs receive citations and the queries associated with those citationsAssuming an uncited page is weak without considering whether it is eligible for the observed queriesCompare cited and uncited pages within the same intended query and content cohort
    TrendlinesHow citation activity changes over timeAttributing every change to the latest content releaseCompare the trend with a fixed query set, matched pages, release annotations, and referral outcomes

    Use an AI-search experiment loop

    1. Define the question or grounding-query set, platform coverage, eligible pages, and business objective before changing content.
    2. Capture baseline citations, cited URLs, competing domains, AI-referred sessions, and onsite outcomes. Use repeated observations when answers and retrieved sources vary between runs.
    3. Create a treatment and comparison cohort using pages that serve comparable intents. If page-level comparison is impossible, stage the rollout or freeze a forecasted baseline.
    4. Make one defined intervention, such as a content clarification, structural improvement, visual addition, internal-link change, or markup update. Verify that it reached every treatment page.
    5. Compare citation counts and share of authority within the same query set. Then check whether any exposure change produced additional AI-referred sessions and valuable onsite actions.
    6. Inspect conventional organic metrics as guardrails. An AI-focused update should not be declared successful if it creates an unacceptable loss elsewhere.
    7. Classify the result as decision-useful positive, decision-useful negative, or inconclusive. Feed validated effects into the relevant forecast cohort rather than the whole domain.

    The objective determines where the funnel ends. If the goal is brand representation in AI answers, a citation can be a meaningful outcome even without a click. If the goal is lead generation or sales, citations are a leading signal and referral or conversion performance must carry the decision. State that distinction before reporting the result.

    AI metrics also require stable denominators. Share of authority can rise because your citations increased or because competing citations fell. AI referral percentage can rise while AI sessions remain flat if total sessions decline. Retain the component counts so a favorable rate cannot hide an unfavorable underlying movement.

    Key takeaways

    • Define the intervention, eligible population, primary outcome, counterfactual, guardrails, and decision rule before deployment.
    • Use randomized, matched, staged, or forecast-based comparisons to estimate incremental lift. A before-and-after chart alone does not establish causation.
    • Report total impact, page-level variation, metric components, uncertainty, and alternative explanations together.
    • Forecast the no-change baseline first. Add committed and upside scenarios separately, and apply tested lift only to populations the evidence covers.
    • Keep AI citations, competitive citation share, AI referrals, and onsite outcomes as distinct stages of one measurement chain.
    • Call weak or confounded evidence inconclusive. Do not turn it into a positive or negative verdict merely to complete a report.

    Your next measurement cycle does not need to cover the entire site. Start with one consequential decision and one coherent page cohort. Write the measurement contract, preserve the pre-period data, hold back a valid comparison where possible, ship the defined change, and judge it using the rule you set before seeing the outcome.

    If a control is impossible, publish and freeze the no-change forecast before launch. Compare actual performance with its range, investigate deviations, and update future assumptions only after the evidence survives that comparison. That is how SEO reporting becomes a repeatable system for deciding what deserves the next unit of time and budget.

    References

  • How to Measure AI Discovery Traffic for B2B Pipeline Growth

    How to Measure AI Discovery Traffic for B2B Pipeline Growth

    You can see buyers using ChatGPT, Claude and Gemini to research vendors, yet your pipeline report may still reduce the result to organic, referral or direct traffic. If you cannot connect that activity to qualified demand, you cannot tell whether AI discovery deserves more investment or merely produces interesting charts.

    The practical answer is not a single AI metric. Build an evidence chain from visibility, to an identifiable site visit, to an onsite action, to an opportunity. Google Analytics can now cover the middle of that chain more cleanly. Your CRM, LinkedIn activity and measurement rules must cover the rest.

    Measure three layers instead of one AI traffic number

    Three connected translucent layers depict AI visibility signals, a website session and a conversion path leading to business account and opportunity nodes.

    AI discovery is not the same thing as AI referral traffic. A buyer can encounter your brand in an assistant without clicking, visit through an identifiable assistant link, or return later through another channel. Those behaviors create different evidence and should not be combined under one label.

    Measurement layerEvidence you can recordDecision it supports
    Discovery visibilityYour company, product or page appears for a controlled set of buyer questionsWhether assistants associate your brand with the right problem and category
    Identifiable trafficA supported assistant sends a visit that Google Analytics recognizesWhich assistants and cited pages generate site demand
    Business outcomeThe visitor completes a qualified action and the lead or account advancesWhether AI discovery contributes to pipeline, not just sessions

    For visibility, maintain a fixed set of questions that reflect how a buyer researches your category. Record the assistant, exact prompt, date, brands mentioned, cited URLs and whether your brand appears in the answer or only in a citation. Keep the prompt wording and access conditions consistent when you repeat the check. The result is an observation, not a universal ranking, because assistant outputs can vary.

    For traffic, use the native AI classification in Google Analytics. For business outcomes, use your existing definitions of a qualified action, lead, opportunity and revenue. This division prevents a common reporting error: treating a mention, a visit and a sale as interchangeable proof of success.

    Build a GA4 view your revenue team can trust

    Google Analytics now identifies supported assistant referrals automatically. Recognized visits can use the medium ai-assistant, the channel group AI Assistant and the campaign value (ai-assistant). This removes much of the custom filtering previously needed to isolate traffic from supported tools.

    1. Confirm that AI Assistant appears in your acquisition reporting. If it does not, check the date range and whether you have any identifiable assistant referrals before changing channel definitions.
    2. Break the channel down by source and landing page. The channel total tells you the size of the stream; the source shows which supported assistant sent it; the landing page reveals which answers or resources earned the click.
    3. Compare AI Assistant and organic search over the same date range. Use the same qualified actions and conversion definitions for both channels. Otherwise, the comparison answers a reporting question rather than a business question.
    4. Show counts beside rates. A high conversion rate based on a very small number of sessions is useful as an early signal, but it is not yet a dependable forecast.
    5. Keep unidentified traffic unidentified. Do not relabel direct visits as AI traffic merely because AI visibility increased during the same period.

    Your recurring report should include identifiable AI sessions, source, landing page, qualified action count, qualified action rate and any matched opportunities. Add the number of leads that explicitly named an AI assistant even when analytics did not record an AI referral. That last field exposes influence the channel report cannot see without pretending the attribution is certain.

    The pattern matters more than the channel total. If AI traffic is small but converts well, protect the pages earning those visits and expand the buyer questions they answer. If traffic grows while qualified actions remain flat, inspect the landing page promise, offer and next step. More assistant visibility will not repair a page that attracts one intent and presents a call to action for another.

    The AI Assistant channel is a measurement improvement, not complete AI attribution. It covers identifiable referrals from supported assistants. It cannot count an answer that satisfies the buyer without a click, and it cannot automatically recover an AI touch when the buyer returns later through direct traffic, branded search or a different device.

    Connect assistant referrals to leads, accounts and opportunities

    Anonymous referral streams pass through a website gateway and connect in sequence to a lead, a company account and a qualified opportunity.

    B2B attribution becomes difficult after the click because evaluation often continues across sessions and people. Solve that problem with explicit evidence labels rather than a more aggressive attribution claim.

    • Observed AI referral: Google Analytics placed the session in the AI Assistant channel.
    • Self-reported AI discovery: A lead named an assistant when asked how they found the company.
    • AI-influenced opportunity: the account has either form of documented AI evidence before opportunity creation.
    • AI-sourced opportunity: AI discovery met your narrower, written rule for the first known acquisition touch.

    Do not merge these labels. An observed referral has stronger click evidence than an inferred influence, while a self-reported answer can reveal discovery that analytics missed. Both are useful as long as the dashboard preserves the distinction.

    1. Choose the onsite action that represents meaningful intent for your sales motion. It might be a demo request, contact submission, trial start, pricing interaction or another event your team already treats as qualified.
    2. When a visitor becomes a lead, carry permitted acquisition fields into the CRM: original source, current source, landing page, campaign and the date of the qualifying action. Retain the original values rather than overwriting them on every return visit.
    3. Add a short, optional discovery question to the form or sales qualification process. Allow the buyer to name ChatGPT, Claude, Gemini or another route in their own words instead of forcing every answer into a fixed channel list.
    4. Join the evidence at the lead and account levels where your consent and data practices allow it. Account-level reporting matters when one person researches and another submits the form.
    5. Write the attribution rule directly in the dashboard. State which touch qualifies an opportunity as sourced, which touches count only as influenced, and whether the evidence must occur before lead or opportunity creation.

    Track progression as counts and rates: identifiable AI sessions, qualified actions, leads, opportunities and closed revenue. Keep pipeline value beside opportunity count because one large deal can otherwise make a small channel look predictably scalable. For the same reason, do not forecast from conversion rate alone while the denominator remains small.

    This model also gives sales a useful feedback role. When a prospect mentions an assistant, record the assistant, the question they were trying to answer and any page or claim they remember seeing. That information can reveal buyer language, missing content and attribution gaps without turning an anecdote into a performance benchmark.

    Turn LinkedIn activity into a measurable discovery loop

    LinkedIn can strengthen the public evidence around a B2B company, but activity alone is not a growth result. Treat the company page, employee expertise, long-form content and distribution as inputs. Measure assistant visibility, referral traffic and pipeline separately as outputs.

    Remove ambiguity from your company and expert profiles

    Start with factual consistency. Keep the business address, contact details and product descriptions accurate on your website. Update the LinkedIn company page’s About section and services, including relevant industry language. Treat the profiles of executives and active subject-matter experts as extensions of the same entity, with current roles and clear areas of expertise. These are core surfaces for B2B AI discovery work.

    Assign an owner to each surface and update all of them when the company changes a product name, category, service or positioning statement. If your site publishes corresponding organization or product structured data, include it in the same update. Consistency does not guarantee an assistant mention, but it removes avoidable uncertainty about what the company does and who represents it.

    Publish one complete answer for each valuable buyer question

    Use LinkedIn articles and newsletters for questions that require more than a short update. The 800-1,200-word range associated with stronger AEO mentions is a useful starting hypothesis, not a universal ranking requirement. A complete 700-word answer is more useful than 1,000 words padded to satisfy a target.

    Give each long-form asset a specific job:

    • Use the buyer’s question or decision in the headline.
    • Answer it directly near the beginning.
    • Name the product category, intended user and relevant constraints plainly.
    • Explain criteria and tradeoffs that help the buyer make a decision.
    • Link to the corresponding website resource when the reader needs evidence, implementation detail or a next step.
    • Connect the content to an identifiable expert whose profile supports the subject.

    Add campaign parameters to links you control from LinkedIn so you can measure LinkedIn visits accurately. Keep those visits classified as LinkedIn traffic. A tracked LinkedIn click is not an AI referral, even when the content was also designed to improve AI discovery.

    Use engagement thresholds as experiments, not ranking factors

    If your team needs an initial promotion checkpoint, start with at least 10 substantive comments or 60 reactions. These figures can guide a campaign test, but they are not verified causal ranking factors for every LLM. Record them as engagement outcomes, then look independently for changes in assistant mentions, AI Assistant referrals and qualified demand.

    Count comments that contribute a question, example, objection or informed response. A pile of generic replies may increase the visible total without improving the information around the topic. Employee participation, expert partnerships, boosted company updates, Thought Leader Ads and follower ads can expand distribution, but paid and organic exposure should remain separate in your campaign log.

    Test one topic cluster from publication to pipeline

    1. Choose one buyer question tied to a product or service that can create qualified demand.
    2. Record the current website answer, LinkedIn coverage, controlled prompt observations and identifiable AI traffic.
    3. Correct company and expert profile details before publishing, so entity changes and content changes happen in a documented sequence.
    4. Publish the complete website resource and its LinkedIn treatment. Record the URL, author, publication date, distribution method, paid support and engagement.
    5. Watch all three measurement layers through a reporting period appropriate to your traffic volume and sales cycle.
    6. Compare the result with a similar topic cluster you did not change. Treat the difference as directional evidence unless your test design supports a stronger causal conclusion.

    Read breaks in the chain literally. More LinkedIn engagement without more assistant visibility proves distribution, not AI discovery. More assistant visibility without referral growth may mean the answer resolves the question without a click or does not present a useful next step. More AI referrals without qualified actions points to the landing page or intent match. More qualified leads without opportunities points to qualification, offer fit or the sales handoff.

    Key takeaways

    • Measure AI discovery as visibility, identifiable traffic and business outcomes. No single metric covers all three.
    • Use GA4’s AI Assistant channel for recognized referrals from supported assistants, but do not relabel direct traffic to fill attribution gaps.
    • Preserve observed referrals, self-reported discovery, influenced opportunities and sourced opportunities as separate evidence classes.
    • Keep website facts, LinkedIn company details and expert profiles current before trying to scale content distribution.
    • Treat the 800-1,200-word content range and engagement thresholds as test inputs, not universal LLM ranking rules.
    • Scale a topic only after you can follow its path from buyer question to content, assistant visibility, qualified action and pipeline.

    Start with one revenue-relevant buyer question. Establish the baseline, publish a complete answer, track the assistant referral and carry the evidence into your CRM. The first broken link in that chain tells you what to fix next. Repair it before increasing content volume or promotion spend.

    References

  • How to Build Marketing Data Your Team Can Actually Trust

    How to Build Marketing Data Your Team Can Actually Trust

    You know you have a marketing data trust problem when a budget meeting turns into a forensic audit. Marketing opens an ad dashboard, Sales opens the CRM, Finance opens the revenue report, and everyone spends the next hour explaining why the totals do not match.

    The goal is not to force every system to display one perfect number. It is to make each number traceable, label its uncertainty, reconcile legitimate differences, and limit the decisions it is allowed to drive. That confidence layer removes the hidden cost of repeatedly cleaning, defending, and second-guessing marketing data.

    Give every important metric a trust contract

    A measurement sphere sits in a transparent frame connected to a source container, timing mechanism, indicator lights, and a locked lever.

    Two reports can use the same metric name while answering different questions. An ad platform may count a conversion when it receives a signal. Your CRM may count a lead only after deduplication and qualification. Finance may recognize revenue after another business event entirely. Calling all three values “conversions” creates an argument that no dashboard redesign can resolve.

    Start with the decision in front of you. Are you deciding whether to increase spend, change targeting, forecast pipeline, or report recognized revenue? Then write a metric contract for every number that can influence that decision.

    • Name: Use a precise label such as form submissions, accepted leads, closed customers, or collected revenue. Avoid an unqualified label such as conversions.
    • Business question: State what the metric is intended to answer and what it cannot answer.
    • Definition: Specify the qualifying event, numerator, denominator, and any status rules.
    • Grain: Declare whether one row represents an event, person, account, opportunity, order, or reporting period.
    • System of record: Identify the system that owns the relevant event or status. Do not use “the dashboard” as the source.
    • Time rule: Record the time zone, reporting window, attribution window where applicable, and whether the metric uses event time or the time a status was updated.
    • Inclusions and exclusions: Name the treatment of test records, duplicates, invalid leads, cancellations, refunds, internal traffic, and unmatched records.
    • Join rule: Document the identifiers used to connect marketing activity with people, accounts, opportunities, and revenue.
    • Owner and approval: Assign someone to maintain the definition and name the teams that must approve a change.

    Put the contract beside the dashboard, not in a forgotten documentation folder. When a metric changes, update the definition and mark the effective date. Otherwise, a chart can appear continuous while its meaning changes underneath it.

    Be especially careful with ratios. A conversion rate is not defined until both the numerator and denominator are defined at compatible grains. Dividing qualified leads by ad-platform clicks may be useful, but it is not interchangeable with qualified leads divided by unique sessions. The label must reveal which calculation you chose.

    Build one journey spine without erasing useful differences

    You do not need one database to replace every marketing, sales, and finance system. You need a shared journey spine that connects their records and preserves the meaning of each stage.

    For a typical demand journey, that spine might connect an impression or click to a session, form submission, lead, qualified lead, opportunity, customer, and revenue event. Adapt the stages to your business, but give each stage a stable identifier, an event timestamp, a status, a source record, and a documented connection to the preceding stage.

    • Preserve raw campaign values alongside normalized channel values. If someone changes the channel taxonomy, you should still be able to reconstruct the original record.
    • Carry both the time an event occurred and the time it entered or changed in a system. This makes reporting-window differences visible.
    • Keep source record identifiers through every transformation so an analyst can trace a dashboard row back to the underlying event.
    • Represent missing campaign information as unknown or unmapped. Do not silently turn it into organic traffic merely because a downstream rule needs a bucket.
    • Keep unmatched records in an exception table. Dropping them makes totals look cleaner while hiding the actual identity and instrumentation problem.

    Reconciliation should explain differences rather than force them to zero. For example, form submissions can be separated into accepted leads, duplicates, invalid records, and records awaiting review. If every submission lands in a named outcome, Marketing and Sales can disagree about policy without disagreeing about what happened.

    The same discipline belongs between the CRM and the finance system. A closed customer record and a revenue event may represent different stages. Keep both, connect them, and state which one a report uses. A holistic reporting spine prevents Marketing, Sales, and Finance from treating separate views as the entire customer journey.

    Use a small, stable exception taxonomy across reports: duplicate, invalid, unmatched identity, missing campaign data, status mismatch, time-window mismatch, test or internal record, and unresolved. Assign an owner to each class. The exception count then becomes an operational queue instead of a recurring surprise in an executive meeting.

    Treat confidence as metadata, not a feeling

    A number is not simply trustworthy or untrustworthy. It can have a strong identity match but poor freshness, direct customer input but incomplete coverage, or clean attribution without causal evidence. Store those dimensions separately so a polished chart cannot conceal a weak assumption.

    Confidence dimensionLabels to preserveDecision rule
    Identity certaintyDeterministic, probabilistic, unmatchedDo not merge an inferred identity into a verified profile without retaining the inference and its confidence.
    Data originZero-party, first-party, third-partyDistinguish information a person deliberately supplied from behavior you observed and information obtained elsewhere.
    Data qualityValidated, exception, incomplete, staleQuarantine or disclose failed records instead of silently repairing them.
    Measurement strengthDescriptive, attributed, incrementality-testedDo not let an attribution rule masquerade as proof that marketing caused the result.

    Deterministic and probabilistic describe identity certainty. A verified login, account identifier, or transaction key can provide a deterministic connection. Device, location, network, and behavioral signals may support only an inferred connection. Both can be useful, but they should not be blended under one unlabeled customer ID.

    Zero-party, first-party, and third-party describe origin, which is a different question. Zero-party data is information a person intentionally gives you, such as a stated preference or purchase intention. First-party data comes from behavior observed in your own interactions. Third-party data arrives from outside that direct relationship. Directly supplied and directly observed information generally provides a firmer foundation than outside speculation, but origin alone does not guarantee correctness.

    Do not collapse these dimensions into one confidence score. A self-declared preference may be attached to a probabilistically matched profile. A deterministic account can contain an old preference. Keeping the dimensions separate tells you whether to verify the identity, refresh the field, or limit the intended use.

    Put a release gate in front of dashboards and models

    Create a defined path from raw records to approved decision data. The gate should run in the same order each time:

    1. Validate structure. Confirm that required fields exist, expected types have not changed, and controlled values remain valid.
    2. Deduplicate. Use stable record identifiers and a documented survivor rule. Never delete a duplicate without retaining enough information to audit the decision.
    3. Resolve identity. Apply deterministic joins first. Route probabilistic matches and unmatched records into explicitly labeled paths.
    4. Apply business rules. Enforce the metric contract’s qualification, exclusion, and status logic.
    5. Reconcile stages. Make sure differences between journey stages are accounted for by named outcomes or exception classes.
    6. Stamp the release. Record the included time range, source snapshots, transformation version, refresh time, exclusions, known limitations, and owner.

    This process favors correct, explainable data over maximum volume. A larger dataset does not rescue duplicate identities, broken joins, stale fields, or inconsistent definitions. Feeding those records into an AI system can make the problem harder to notice because a fluent output can still be confidently wrong when its inputs are unreliable.

    Give AI systems the confidence labels too

    If an AI system summarizes performance, recommends budget changes, prioritizes audiences, or drafts an executive explanation, pass the confidence metadata with the marketing records. Do not give the model a flattened export in which verified purchases, inferred identities, and unmatched sessions all look equally certain.

    A useful instruction is: use deterministic records for customer-level conclusions; summarize probabilistic records separately; disclose unmatched coverage; identify stale or incomplete fields; and do not describe attributed outcomes as incremental outcomes. Require the response to name its data snapshot, exclusions, and measurement status.

    Keep model-generated classifications in a separate field from observed or customer-supplied facts. Record the model or workflow version and the input snapshot that produced them. If a later result changes, you will be able to determine whether the data changed, the rules changed, or the model changed.

    Ask what marketing changed, not only what received credit

    Two matched rows of greenhouse plants grow under the same conditions, with only one row receiving an additional colored light treatment.

    Attribution and causation answer different questions. Attribution assigns credit according to a rule. Incrementality asks how many outcomes would not have happened without the marketing intervention.

    Branded search exposes the difference. Someone who already intends to buy may search for your brand immediately before converting. The search ad can record the final touch even when another channel, prior experience, or existing intent created the demand. A checkout scanner records the purchase, but it did not necessarily cause the shopping trip.

    Use a holdout test when a material budget decision depends on whether a paid campaign caused additional outcomes:

    1. Define the eligible audience, intervention, primary outcome, and measurement window before examining results.
    2. Create comparable exposed and holdout groups. Keep the holdout from receiving the intervention being tested.
    3. Measure both groups with the same identity rules, exclusions, time boundaries, and outcome definition.
    4. Compare conversion rates rather than attributed totals alone. The difference is the starting point for estimating incremental effect.
    5. Check whether delivery failures, audience overlap, identity gaps, or other execution problems compromised the comparison.
    6. Report the test design and limitations beside the result so a directional estimate is not presented as certainty.

    If the exposed and holdout groups convert at similar rates, the campaign may be collecting credit for demand rather than creating much additional demand. That does not make the attribution report useless. It makes its purpose narrower.

    Keep attributed and incremental views side by side. Attribution helps you inspect journeys, operate campaigns, and diagnose tracking. Credible incrementality testing provides stronger evidence for budget allocation. When you do not have a valid causal test, label the budget case as a hypothesis and favor a smaller, reversible change.

    This distinction matters when AI answer engines, recommendations, content, paid media, and branded search all touch the journey. A customer may first encounter your business through one channel and convert through another. Add an optional zero-party question such as “How did you first hear about us?” to reveal candidate discovery paths, but keep that response separate from click attribution and do not treat either one as causal proof.

    Key takeaways

    • Define a metric by the decision it supports, its qualifying event, its grain, its time rule, and its exclusions.
    • Connect marketing, sales, and revenue events through a shared journey spine while preserving raw records and system-specific meanings.
    • Explain every difference with a named outcome or exception class instead of hiding unmatched records.
    • Label identity certainty, data origin, data quality, and causal strength as separate confidence dimensions.
    • Give AI systems those labels and require them to disclose snapshots, exclusions, and unsupported conclusions.
    • Use attribution to assign and inspect credit; use a well-designed holdout when you need evidence that marketing caused additional outcomes.

    Before your next budget review, choose the one KPI that causes the most debate. Write its trust contract, trace it through the journey spine, label its confidence, and account for its exceptions. Then decide whether attribution is sufficient for the decision or whether you need an incrementality test. If the number cannot survive those steps, it has not earned the right to move the budget yet.

    References
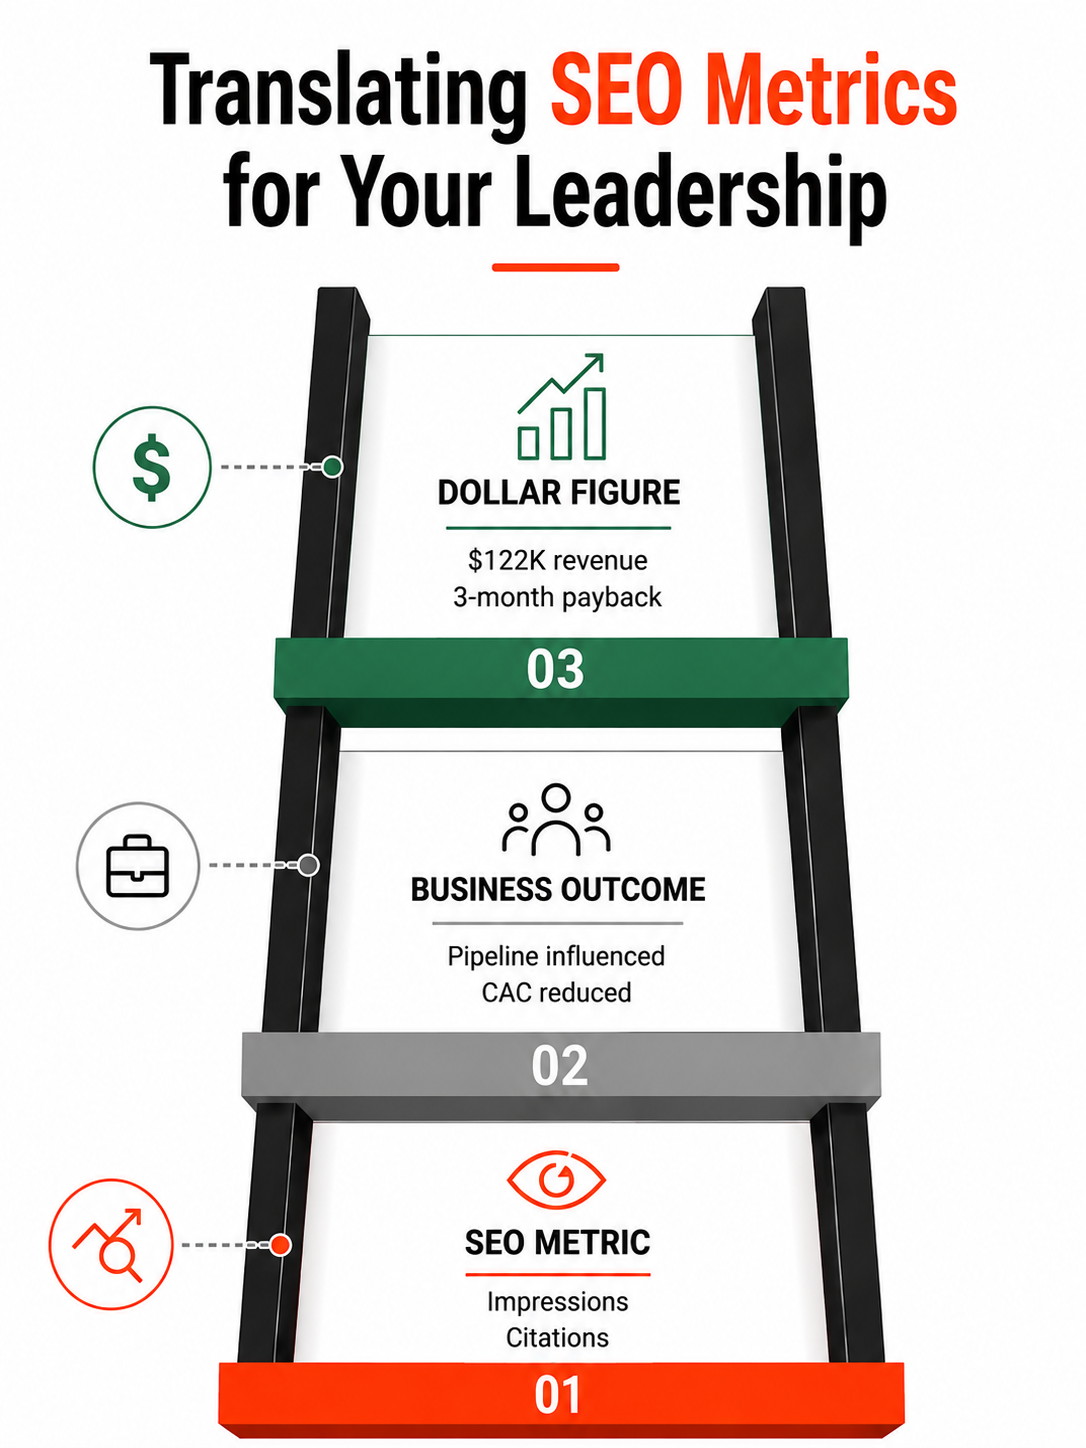
  • Google Discover Controls and Reporting: A Publisher Playbook

    Google Discover Controls and Reporting: A Publisher Playbook

    Your Google Discover chart drops sharply, a stakeholder wants an explanation, and someone points to a recent publisher-profile change. Before you change the editorial calendar or undo the profile work, separate what Google displayed from what Search Console recorded.

    Discover profile controls, feed distribution, and performance reporting are connected surfaces, but they are not the same system. You need a different measurement plan for each one. This playbook shows you how to audit the controls you have, make profile links measurable, and keep unreliable reporting days out of consequential decisions.

    Key takeaways

    • Treat a Discover publisher profile as a brand and navigation surface, not as a proven ranking control.
    • Most profiles are still generated automatically. A monitored set of 46,926 profiles contained only 54 U.S.-based, English-language publishers with enhanced controls.
    • If you can add profile links, give every destination a stable UTM convention before publishing it. Otherwise, you won’t be able to separate profile visits from other Google traffic.
    • Search Console Discover clicks and impressions for May 7–8, 2026 are unreliable because of a confirmed logging error. Mark those dates as invalid data rather than treating the reported decline as lost visibility.
    • Preserve raw Search Console data, add a validity flag, and use first-party site analytics only as corroborating evidence. Different tools do not measure the same thing.

    Separate profile presentation, distribution, and reporting

    A publisher profile can influence how someone understands and navigates your brand after encountering it. Search Console reports what its logging system captured. Discover distribution determines whether and where content appears in the feed. A change in one layer does not automatically prove a change in either of the others.

    LayerQuestion it answersEvidence to useWhat it does not prove
    Publisher profileWhat can a user see or select after interacting with your publisher identity?Profile screenshots, available controls, tagged profile-link visits, and landing-page actionsThat a banner, link, or pinned post improved Discover ranking
    Discover distributionWas your content shown and selected in the feed?Valid Discover impressions, clicks, click-through rate, content-level patterns, and corroborating site outcomesThat every reported movement reflects an editorial or algorithmic change
    Search Console reportingWhat Discover activity did Google’s reporting pipeline log?Search Console data with incident annotations and validity flagsThat a logging gap represents a real loss of placement or audience

    This distinction changes how you investigate. If a profile link receives fewer tagged visits, inspect the link, label, destination, and profile exposure. If Search Console falls on dates affected by a known reporting incident, quarantine those dates first. If valid Discover data and independent site outcomes decline beyond the incident window, then you have grounds for a broader distribution, content, or technical investigation.

    Do not use correlation as a shortcut. Pinning a post shortly before a Discover increase does not demonstrate that the pin raised feed visibility. The pin may have changed profile engagement, while a separate distribution change affected the feed. Measure the outcome each control can plausibly produce.

    Audit the Discover profile you actually have

    A publishing specialist reviews a generic profile interface alongside image, link, mobile preview, and verification symbols.

    Google’s publisher profiles live at profile.google.com/cp/ and can appear when a user interacts with the publisher name on a Discover card. The profiles have existed since August 2025, but enhanced editing has not been made broadly available.

    Run the audit from the profile itself rather than from an internal assumption about what your organization should have. Save the date of the audit because access and profile presentation can change.

    1. Open your publisher profile and record its exact URL.
    2. Capture a full-page screenshot so you have a dated record of the banner, identity, links, social accounts, and visible posts.
    3. Look for the label “Profile generated by Google.” Its presence indicates the standard, automatically generated profile rather than the enhanced publisher-controlled version.
    4. Check separately for a customizable banner, a link shelf, pinned-post controls, and editable social links. Do not mark the profile as enhanced based on appearance alone.
    5. Record who in your organization can access the controls. Profile availability is not operational control if nobody owns the account or publishing process.
    6. Add the audit result to a simple register with four fields: profile URL, profile type, last checked date, and internal owner.

    The enhanced program remains highly selective. Monitoring across 46,926 publisher profiles found 54 U.S.-based, English-language publishers with advanced controls. Nearly half of that group consisted of regional newspapers and local television stations.

    That pattern describes Google’s selected cohort; it is not a public eligibility rule. There is no documented public application process for the enhanced capabilities. If your profile has no claim or editing option, do not treat the absence as a technical failure, and do not build a business case around an assumed rollout date.

    If you have a standard profile, verify what users see and retain evidence of any identity problem. Keep your publication name, visual identity, social destinations, and public site information internally consistent so the team can identify discrepancies without improvising a new brand treatment for Google alone.

    If you have enhanced controls, assign a job to each element:

    • Banner: communicate recognizable brand identity. Use a production-ready asset and review it on the live profile rather than approving it only from the design file.
    • Link shelf: route users to a small set of intentional destinations. Choose pages that answer a clear next-step need, such as current coverage, a section hub, a newsletter, or a subscription page.
    • Pinned posts: prioritize content for profile visitors. Log the start date, end date, and reason for every pin so later analysis has a usable timeline.
    • Social links: verify account ownership and destination accuracy. A visible link to an abandoned or incorrect account creates a brand problem even if it has no effect on Discover distribution.

    Professional banner treatments were common among the enhanced profiles, but link-shelf behavior differed by publisher type. Local television publishers frequently used links for site navigation, while national publishers used the feature less actively. Copying either pattern without considering your visitor’s next action misses the point. Your shelf should reflect the paths your audience actually needs.

    Make profile traffic identifiable before you optimize it

    A profile link without campaign tagging leaves you with an attribution problem. You may see traffic to the destination, but you cannot reliably distinguish a click from the profile shelf from another Google visit. Many publishers in the initial enhanced cohort did not add UTM parameters to their profile links.

    Set one naming convention before the first link goes live. A practical pattern is:

    • utm_source: google
    • utm_medium: discover_profile
    • utm_campaign: publisher_profile
    • utm_content: a stable identifier for the shelf position or destination, such as latest, local, newsletter, or subscribe

    A newsletter destination could therefore use: https://example.com/newsletter?utm_source=google&utm_medium=discover_profile&utm_campaign=publisher_profile&utm_content=newsletter.

    This is a recommended internal convention, not a Google requirement. Its value comes from consistency. Keep the medium specific to the profile so you do not merge link-shelf traffic with referrals that may come from the Discover feed itself.

    1. Create the final URL in your campaign register before entering it in the profile.
    2. Use lowercase values and fixed separators. Newsletter, NewsLetter, and news_letter become separate values in many analytics workflows.
    3. Open the live profile on a user-facing device and click the link. Confirm that it reaches the intended canonical destination without losing the UTM parameters during a redirect.
    4. Verify the visit in your analytics debugging or near-real-time view. Do not assume that a correctly formed URL is being collected correctly.
    5. Record the visible link label, destination, UTM values, publication date, retirement date, and owner.
    6. When replacing a destination, create a new utm_content value if the user promise changes. Reusing one identifier for unrelated links corrupts the history.

    Measure link-shelf work with profile-attributed sessions and the actions those visitors take on the landing page. Measure a pinned post with the same profile-specific evidence and its active dates. Do not use a change in overall Discover impressions as the success metric for either control unless Google establishes a ranking relationship that is not currently supported here.

    The banner needs a different standard. It is primarily a brand asset, so review visual clarity, publication identity, and suitability within the live crop. Do not manufacture a performance claim merely because the asset cannot be tied neatly to a conversion.

    Keep unreliable Discover data out of editorial decisions

    Editors separate a fragmented analytics tile from stable data tiles before using the reliable set for newsroom planning.

    Google confirmed that a data-logging error reduced reported Discover clicks and impressions for May 7–8, 2026. The problem affected reporting only; Google said it did not affect actual positioning in Discover.

    Those two dates should be treated as invalid observations, not as zero-performance days and not as evidence of an editorial failure. The distinction matters because a monthly total that includes understated days is incomplete even when the rest of the month is accurate.

    1. Preserve the raw values. Do not overwrite the export or dashboard table with an estimate. You may need the original record for auditability.
    2. Add a data-status field. Mark May 7 and May 8, 2026 as invalid because of the Discover logging error. A blank status should mean no known incident, not that someone forgot to review the date.
    3. Render the dates as a gap. On a trend chart, a gap communicates missing or unreliable information more accurately than a plotted zero.
    4. Label every affected total. If a weekly or monthly number includes the two dates, describe it as incomplete. Do not publish a clean percentage change as though both periods had full data.
    5. Avoid backfilling a guessed value. An interpolation may make the chart look continuous, but it converts an unknown measurement into invented performance.
    6. Check corroborating signals. Review site sessions, relevant landing-page activity, and business outcomes for the same dates. Use them to judge whether a separate traffic change may also have occurred, not to recreate exact Search Console clicks or impressions.
    7. Reopen the investigation when the pattern extends beyond the incident. A decline continuing on valid reporting days, especially when site outcomes also weaken, deserves content, distribution, and technical analysis.

    Your stakeholder annotation can be direct: “Google Search Console Discover clicks and impressions for May 7–8, 2026 are understated because of a logging error. Google said the incident did not affect Discover positioning. Totals containing these dates are incomplete.”

    Keep this note beside the chart, not in a separate document that viewers may never open. An anomaly ledger should also record the affected product, dates, metrics, stated impact, supporting link, dashboard owner, and decisions that must not rely on the compromised data.

    For recurring reporting, maintain two views. The raw view preserves exactly what Search Console returned. The decision view carries the same values plus incident flags and excludes invalid dates from calculations that require complete observations. This gives analysts an audit trail while keeping executives from acting on a known measurement failure.

    Do not let the reporting incident become a blanket explanation for every decline. If tagged profile visits fell because a shelf link broke, that is a profile implementation problem. If Discover performance weakens after May 8 on valid days, the logging incident does not explain the later movement. If only the two affected dates look abnormal, the responsible action is to annotate them and leave the editorial plan alone.

    Start with three concrete changes: capture your current profile state, establish a profile-specific UTM convention, and flag May 7–8, 2026 in every Discover report that includes them. The next time a chart moves, you will know whether to inspect the profile, the feed, or the measurement layer before anyone turns an unreliable signal into a strategy change.

    References
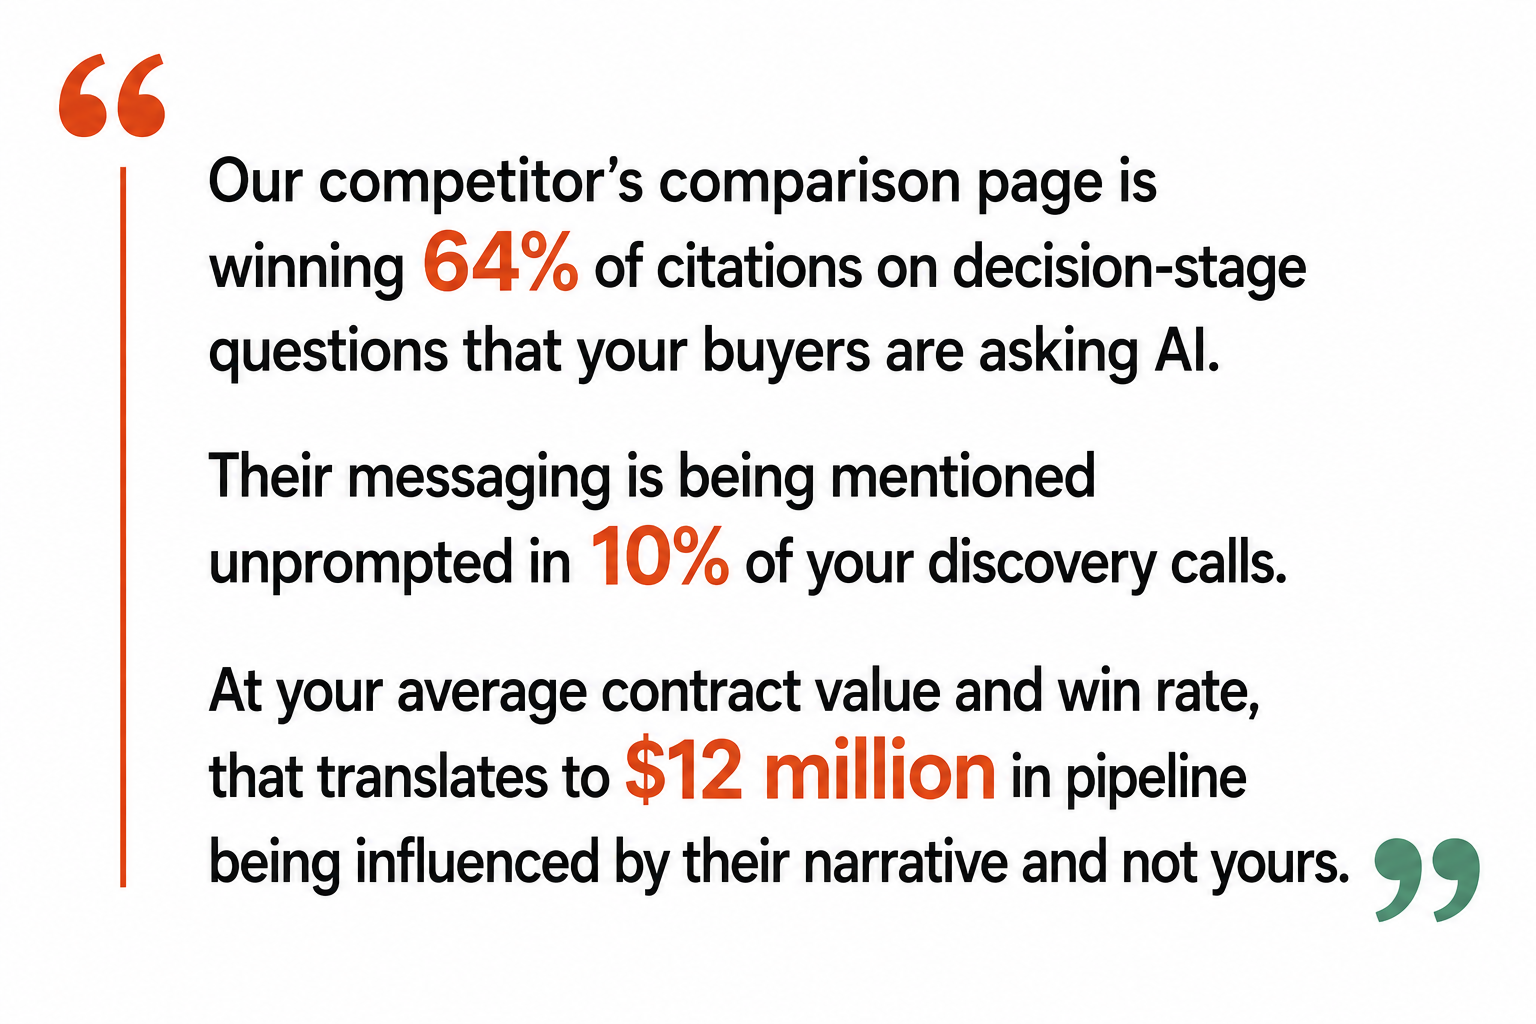
  • How to Measure Brand Visibility in AI-Mediated Journeys

    How to Measure Brand Visibility in AI-Mediated Journeys

    You may already be appearing inside AI answers while your organic dashboard says little has changed. Or AI bots may be crawling your site without your brand ever making the shortlist. If you count only clicks, both situations become an attribution mystery.

    You need to separate machine access, brand selection, human handoff, and business outcome. That gives you a measurement system that can locate the weak point in an AI-mediated journey and tell you what to test next.

    Decide what brand visibility means before scoring it

    A visit is no longer the only useful sign that a brand won. Depending on how much of the journey a person delegates, a win can be a click, an AI recommendation, or an action completed by an agent. A single traffic metric cannot represent all three.

    Start by classifying the journey into search, assistive, and agentic modes. These modes can coexist within the same purchase. Someone might discover a category through search, ask an assistant to compare the options, and then let an agent find a qualifying seller. Your measurement should follow that movement instead of assigning the whole journey to its last observable click.

    Journey modeWhat visibility looks likePrimary evidenceCommon misreading
    SearchYour page or brand is presented as an option the user can inspect.Search impressions, result position, clicks, landing sessions, and subsequent actions.Treating a high position as proof that the result influenced a decision.
    AssistiveAn AI answer names, explains, compares, cites, or recommends your brand.Observed mentions, recommendation role, cited URLs, claim accuracy, and answer-engine referrals.Counting an incidental mention as a recommendation.
    AgenticAn agent recruits your brand as an eligible option, selects it, or completes an action through it.Selection records where available, agent referrals, API or commerce events, and confirmed business outcomes.Assuming a bot request means the agent selected your brand.

    Define a qualifying visibility event before collecting data. At minimum, the brand must be correctly identified and relevant to the prompt. Record whether it was merely named, used as supporting evidence, included in a shortlist, explicitly recommended, or selected for action. Those roles have different commercial meaning.

    Set an eligibility rule for the denominator as well. A prompt belongs in your visibility rate only if your brand could reasonably satisfy the stated need, market, audience, and constraints. Including irrelevant prompts depresses the score. Excluding difficult but commercially important prompts inflates it.

    Measure each layer from machine access to business outcome

    Four connected transparent chambers depict machine access, AI selection, human handoff, and a business outcome, with observation points between them.

    AI visibility is a sequence, not an isolated mention. A useful diagnostic model follows ten gates: discovered, selected, crawled, rendered, indexed, annotated, recruited, grounded, displayed, and won. The early gates make your information available to machines. The later gates determine whether the system can understand, use, present, and act on it.

    You will not observe every gate directly. Server logs can show that a crawler requested a URL, but they cannot prove that the page was indexed, understood correctly, or used in a response. A citation can show that a URL supported an answer, but it does not reveal every internal retrieval or ranking decision. Label each measurement as observed or inferred so your dashboard does not manufacture certainty.

    Measurement layerQuestion it answersUseful measuresWhat it does not prove
    Machine accessCan qualifying bots reach and process the pages that matter?Priority URLs requested, response status, rendered content availability, repeat access, and crawler identity confidence.That the information was indexed, trusted, or selected.
    Entity understandingDoes the answer associate your brand with the correct category, products, locations, capabilities, and constraints?Entity accuracy, attribute accuracy, category association, and contradiction frequency.That the brand will be recruited for a particular decision.
    Recruitment and groundingDoes the system use your brand or content when constructing an answer?Qualifying mention rate, citation rate, cited-page coverage, claim usage, and competitor co-mentions.That the user saw a meaningful recommendation.
    PresentationHow is the brand shown to the user?Recommendation rate, shortlist inclusion, order when a genuine ranking exists, description, caveats, and next action offered.That the user followed the recommendation.
    Handoff and outcomeDid the journey reach your property or produce a business event?Answer-engine referrals, engaged sessions, leads, account creation, purchases, bookings, and other confirmed outcomes.That one observed AI answer caused the outcome.

    Keep these layers separate before creating any composite score. A blended score can rise because crawler activity increased even while recommendation visibility fell. That looks like progress until you inspect the components.

    Use a small metric dictionary so everyone calculates the same thing:

    • Qualifying mention rate: eligible prompt runs containing a valid brand mention divided by all eligible prompt runs.
    • Recommendation rate: eligible prompt runs in which the brand is positively recruited as an option divided by all eligible prompt runs.
    • Citation rate: eligible prompt runs citing an owned or controlled page divided by all eligible prompt runs. Report third-party citations separately.
    • Claim accuracy rate: checked brand claims that are materially correct divided by all checked brand claims.
    • Priority-page bot coverage: priority URLs receiving a qualifying bot request divided by all URLs in the defined priority set.
    • AI referral engagement rate: qualifying answer-engine sessions that complete your chosen engagement event divided by all qualifying answer-engine sessions.
    • AI-attributed outcome rate: confirmed outcomes with an observable AI referral or another declared attribution signal divided by the applicable set of outcomes.

    Always display the numerator and denominator next to each rate. A clean percentage built from a tiny or changing prompt set is less informative than a modest rate calculated from a stable, representative panel.

    Build a prompt panel around real decisions

    A prompt tracker is useful only when its prompts resemble the decisions your audience delegates. A list of branded questions will tell you whether an engine can repeat known facts about you. It will not tell you whether the brand is discoverable when the user has not chosen it yet.

    Build the panel from intent and constraints:

    1. Map the decisions. Include discovery, comparison, validation, troubleshooting, and action-oriented needs. Connect each need to a product line, audience, market, or journey stage.
    2. Add realistic constraints. Use the factors that can change eligibility, such as use case, compatibility, location, availability, delivery requirement, organizational size, or risk tolerance. Do not add a constraint merely to make the prompt longer.
    3. Balance non-branded and branded prompts. Non-branded prompts measure discovery and recruitment. Branded prompts measure entity understanding, accuracy, and competitive positioning.
    4. Define matching rules. List the canonical brand name, legitimate variants, product names, and exclusions that could create false positives. Decide how acquisitions, resellers, and similarly named entities will be handled before scoring begins.
    5. Fix the test conditions. Preserve the prompt wording, engine, model label, account state, location, language, and personalization state when those variables are available. Record any condition you cannot control.
    6. Review the full answer. A string match cannot tell whether the brand was recommended, dismissed, confused with another entity, or mentioned only inside a citation title.

    Useful prompt templates include:

    • What are suitable ways to solve [problem] for [audience or situation]?
    • Which providers meet [requirement] and [constraint]?
    • Compare options for [use case], especially [decision factor].
    • Is [brand or product] suitable for [specific scenario]?
    • Find an option for [need] that can satisfy [action constraint].

    Do not average every prompt into one headline number. Segment results by intent, journey mode, market, product, and engine. A brand can be highly visible in informational answers yet absent when the prompt moves to comparison or action. That boundary is where the commercial problem usually becomes diagnosable.

    For every run, capture the prompt ID, intent cluster, test conditions, brand presence, mention role, recommendation strength, cited domains, cited URLs, claims made, claim accuracy, competitors named, caveats, and proposed next action. Preserve the answer itself when your governance rules permit it. Otherwise, retain a structured review and enough metadata to reproduce the test.

    Model outputs can vary with wording, context, model changes, and personalization. Treat an individual answer as an observation, not a stable market fact. Repeated runs and a fixed protocol help you distinguish a persistent visibility pattern from an isolated output. When an engine or model changes, mark the break in the time series instead of presenting the new results as a clean continuation.

    Join prompt observations, bot visits, referrals, and outcomes

    Four colored streams of prompt observations, bot activity, referral paths, and outcome signals converge in a transparent measurement hub.

    No single analytics system sees the entire AI-mediated journey. Prompt monitoring observes the answer. Server logs observe requests to your site. Web analytics observes some human handoffs. Product, commerce, and customer systems observe downstream outcomes. Your job is to connect those views without pretending they form a deterministic user-level trail.

    Some agent analytics workflows now make bot visits and human referrals available as separate inputs. Keep that separation in your own model. Bot activity is evidence of machine access. Human referral activity is evidence of a visible handoff. Neither is a substitute for the other.

    Evidence streamMinimum fields to retainBest useImportant limitation
    Prompt observationsTimestamp, engine and model label, prompt ID, intent, market, mention role, citation, recommendation, claims, and competitors.Measuring whether and how the brand appears in AI responses.The observed answer cannot reveal every internal retrieval step or every answer shown to other users.
    Server and edge logsTimestamp, requested URL, response status, user agent, verified bot classification where possible, and rendering outcome.Diagnosing whether relevant machines can access priority content.User-agent labels can be spoofed, and a request does not establish indexing or use.
    Referral analyticsReferral class, referring domain when exposed, landing URL, session ID, campaign parameters, and engagement events.Measuring observable human handoffs from answer engines.Not every app or handoff exposes a usable referrer, so measured referrals are not the whole audience.
    On-site behaviorLanding page, content path, engagement event, lead event, account event, and transaction event.Finding friction after an AI-mediated arrival.On-site behavior alone does not establish which answer or prompt influenced the visit.
    Business outcomesOutcome type, timestamp, product or service, market, value where appropriate, and declared acquisition signal.Connecting visibility work to decisions the organization values.Self-reported and last-touch signals are useful but incomplete attribution evidence.

    Join these streams at an aggregate level using the safest shared dimensions: time period, landing URL, product, market, intent cluster, and engine class. For example, you can compare a change in citation coverage for a product cluster with bot access to its priority pages, referrals landing on those pages, and relevant conversions. That creates a defensible sequence of evidence without claiming that an anonymous conversion came from a particular monitored prompt.

    Use explicit evidence labels in every analysis:

    • Observed: a monitored answer named the brand, a known bot requested a page, a referrer identified an answer engine, or a tracked session completed an event.
    • Inferred: a page probably contributed to an answer, a referral may have followed a particular prompt, or an AI mention may have influenced a later direct visit.
    • Unknown: the platform did not expose enough information to connect the events responsibly.

    This distinction matters most when direct traffic or branded search rises after AI visibility improves. That movement may support an influence hypothesis, but it does not identify the original answer or prove causation. A post-conversion question about how the person found you can add directional evidence, provided you keep self-reported responses separate from observed referrals.

    Use the dashboard to choose the next intervention

    Your dashboard should help someone decide what to change. Organize it by the measurement layers rather than by whichever tool supplied the data:

    • Access: priority-page bot coverage, response failures, blocked resources, and rendering problems.
    • Understanding: entity confusion, missing attributes, inaccurate claims, and contradictory descriptions.
    • Selection: qualifying mention rate, recommendation rate, citation rate, cited-page distribution, and competitor overlap.
    • Handoff: answer-engine referrals, landing-page distribution, engaged sessions, and return behavior.
    • Outcome: leads, registrations, purchases, bookings, and other confirmed business events by relevant cohort.

    Read combinations of signals rather than reacting to one chart:

    Observed patternLikely failure areaNext test
    Priority pages receive qualifying bot visits, but the brand is rarely mentioned.Entity understanding, recruitment, or grounding rather than basic access.Clarify who the brand serves, what it offers, where it operates, and the constraints it satisfies. Align structured data with visible page claims, then rerun the same prompt cluster.
    The brand is mentioned, but descriptions are inaccurate or inconsistent.Entity reconciliation and claim clarity.Consolidate canonical facts, remove contradictory copy, make relationships between the organization and its products explicit, and track the disputed claims individually.
    The brand is mentioned but seldom recommended for high-intent prompts.Weak evidence for the decision criteria used in comparison.Add verifiable information about fit, limitations, availability, compatibility, or policies on the most relevant pages. Do not present unsupported superiority claims.
    Owned pages are cited, but referrals remain low.The answer may satisfy the need without a click, or the brand may be functioning as evidence rather than the chosen option.Inspect the mention role and next action before treating this as failure. Strengthen the path to a useful next step where the user genuinely needs one.
    Answer-engine referrals rise, but conversions do not.Landing-page intent mismatch or on-site friction.Compare the answer’s promise and constraints with the landing page. Preserve context, answer the next likely question, and test the relevant conversion path.
    Conversions rise without identifiable AI referrals.An attribution gap rather than confirmed absence of AI influence.Improve referral classification, retain landing context, add a carefully worded self-report field, and analyze direct and branded-search cohorts without relabeling them as AI traffic.

    Run improvement work as a controlled diagnostic. Choose one intent cluster and one suspected failure layer. Preserve the prompt panel and test conditions. Record a baseline, make the narrowest relevant change, and then observe the nearest layer as well as downstream effects. If you changed entity and product facts, claim accuracy and recruitment should move before you expect a clean conversion effect.

    Possible interventions include correcting crawl barriers, consolidating entity information, adding decision-critical details, improving citation-worthy evidence, aligning JSON-LD with visible content, or repairing an AI referral landing path. Structured data can make explicit facts easier to interpret, but it does not guarantee retrieval, citation, recommendation, or display. Measure the relevant output after implementation.

    Record platform and model changes beside your experiments. If the engine changes during the test, you have a confound, not a clean before-and-after result. Keep the observation, mark the limitation, and repeat under the new condition rather than forcing the numbers into an unsupported success claim.

    Key takeaways

    • AI visibility has distinct access, understanding, selection, presentation, handoff, and outcome layers.
    • A brand mention, an owned citation, a recommendation, a referral, and a completed action are separate events.
    • A stable, decision-based prompt panel is the foundation of comparable visibility measurement.
    • Bot visits show machine access, not brand preference or human demand.
    • Aggregate evidence can support a journey hypothesis, but anonymous events should not be turned into deterministic user-level attribution.
    • The best next optimization is the one aimed at the first layer where the evidence weakens.

    Start with one commercially important journey and map its evidence from prompt to outcome. You do not need perfect attribution before acting. You need a clear boundary between what you observed, what you inferred, and which failure point your next change is designed to address.

    References

  • How to Build the Data Foundation for AI-Powered Ads

    How to Build the Data Foundation for AI-Powered Ads

    You’ve connected your ad accounts to an AI system, and it can see every impression, click, conversion and campaign change. That may look like a strong data foundation. It isn’t. The system still can’t tell whether a lead became a customer, whether an order was profitable or whether operations can fulfill the demand it creates.

    Before you let AI move budget or restructure campaigns, you need a business outcome layer between the advertising platforms and the agent. Build that layer well, and automation can pursue results your company actually values. Skip it, and the agent will optimize the numbers it can see – even when those numbers point away from profit.

    Give the AI an optimization contract before giving it data

    An ad platform knows what happened inside its own boundary. It can report delivery, interactions and the conversions attributed to its ads. It usually doesn’t know the quality of a sales lead, the margin on a product, the value of a renewed account or the amount of work your team can fulfill. An agent using only those platform signals operates inside a closed optimization loop.

    More integrations won’t fix that problem until you define what the agent is supposed to optimize. Write an optimization contract that answers six questions:

    1. What is the business outcome? Name the final result, such as closed-won revenue, a completed order or contribution margin. Don’t use a platform conversion label as the definition.
    2. Which outcomes are eligible? State whether cancellations, invalid leads, duplicate orders, returning customers or other disqualified records should count.
    3. How is an outcome valued? Identify the field that carries realized revenue, margin or an approved stage value. Document its currency and whether the value is gross, net or estimated.
    4. When is the result mature enough to use? A form submission arrives quickly; a qualified opportunity or completed sale may arrive later. Define the lifecycle point at which the business accepts the result.
    5. What constraints outrank performance? Inventory, sales capacity, service availability, geographic coverage and fulfillment limits can all make additional conversions undesirable.
    6. What may the AI change? Separate analysis, recommendations and account changes. Specify allowed actions, approval requirements, financial limits and rollback conditions.

    This contract prevents a proxy from quietly becoming the objective. In lead generation, a form submission is an early signal, not proof of revenue. Map the progression from submission to qualification, opportunity and closed business. If only the submission reaches the ad platform, call it a proxy in reporting and keep the later CRM result on the business scorecard.

    For ecommerce, order revenue is still incomplete when products have different margins or fulfillment constraints. A campaign can improve reported return on ad spend by selling more of a low-margin product or promoting something the business cannot readily fulfill. That is why CRM outcomes, product economics and operational signals belong in the decision model.

    Do not ask the model to invent missing business values. If sales has not agreed on what a qualified opportunity is, or finance cannot identify the value field to use, the agent should expose the gap rather than manufacture a score. In that state, it can still draft creative, summarize performance and recommend investigations. It is not ready to control spend autonomously.

    Build a business outcome layer across five data domains

    Five symbolic data domains for customers, advertising, sales, transactions, and operations connect to one central business outcome hub.

    A useful advertising data model keeps different kinds of evidence separate. Platform delivery data, customer outcomes and operational constraints answer different questions. Flattening them into a single conversion column destroys the distinctions the agent needs.

    Data domainWhat it tells the AIRecords and fields to connectHow it should affect decisions
    Advertising platformsWhat was delivered and what the platform attributedCampaign, ad, creative, audience, click, conversion, timestamp and platform-reported valueDiagnose delivery and compare tactics inside the platform
    Web or app analyticsWhat happened during observable visitsSession, landing page, traffic source, on-site events and consent stateExplain journeys and identify experience or measurement problems
    CRM or order systemWhat became a valid lead, customer, order or realized revenueLead, customer or order ID; lifecycle status; outcome value; new or returning status; cancellation or invalidation stateAnchor business reporting and train toward genuine downstream outcomes
    Product economicsWhich sales create business valueProduct or SKU, margin measure and the date for which that value appliesPrefer valuable demand rather than revenue alone
    OperationsWhat the business can sell and fulfillAvailability, capacity, service area and fulfillment constraintSuppress or limit spend when additional demand would create an operational problem

    Competitive intelligence can sit beside these five domains, but it should not become the outcome label. Adthena says its ChatGPT advertising product monitors more than 300,000 daily prompts to surface brands, placements, messages and share of voice. That kind of market visibility can help you form targeting and creative hypotheses. It cannot tell you whether your own acquired customer was profitable or incremental.

    The next job is making the records joinable. Your data contract should specify:

    • A stable lead, customer or order identifier in the business system.
    • Platform click, campaign, ad and creative identifiers where collection and use are permitted.
    • Separate timestamps for the interaction, conversion, lifecycle update and data ingestion.
    • A controlled vocabulary for statuses such as qualified, won, cancelled and invalid.
    • The owner, currency, unit and calculation method for every monetary field.
    • The system that originated each field and the last time it was refreshed.
    • Identity-matching rules, including what the pipeline does when it cannot safely match a person or order.
    • Retention, access and consent rules appropriate to the data you are permitted to use.

    Those details are not housekeeping. They determine whether the same customer becomes one outcome or several apparent outcomes, whether last month’s campaign receives credit for this month’s sale and whether a stale margin value drives a current budget decision.

    Time deserves special treatment because the systems do not necessarily place the same conversion in the same period. Ad platforms may credit a conversion to the day of the ad interaction, while analytics and CRM reporting commonly place it on the day the conversion occurred. This difference in attribution dates can make two accurate reports disagree at a daily or monthly boundary. Preserve both the event date and the platform credit date instead of overwriting one with the other.

    Build the pipeline from the business result backward. First identify the accepted outcome in the CRM or order system. Then attach identity and campaign metadata, enrich the outcome with product and operational values, and only then send an approved signal back to the ad platform through offline conversion tracking or a direct connection. Keep the unmodified business record as well. You will need it when you reconcile totals or change the value logic later.

    Reconcile the systems without forcing their numbers to match

    Google Ads, Meta Ads, analytics and a CRM can all be working as designed while showing different conversion totals. They observe different parts of the journey, use different attribution rules and handle identity, privacy gaps and modeled conversions differently. Treating disagreement as proof that one tool is broken sends teams into endless tracking rebuilds.

    Consider a buyer who clicks a Meta ad, encounters YouTube retargeting, searches for the brand and then buys within a week. Meta and Google may each report a conversion because neither platform has the complete cross-platform path. Analytics and the CRM may record one sale and credit the final paid-search visit. The platform conversions are not two additional customers; they are different claims on the same customer journey.

    Your reporting model should therefore preserve three views:

    • Business outcomes: valid customers, orders, deals and revenue recorded by the CRM, commerce platform or finance system.
    • Attributed outcomes: conversions and value claimed by each advertising platform under its own rules.
    • Journey evidence: observable sessions, touchpoints and on-site behavior captured by analytics.

    Never add attributed outcomes across platforms and present the sum as company revenue. Use the business system to answer how much happened. Use platform and analytics data to explain which interactions were observed and where performance changed.

    A practical reconciliation process looks like this:

    1. Choose the CRM, order system or finance record that defines the total business outcome. Document why it is authoritative and which statuses it includes.
    2. Align time zones, currencies, conversion definitions and reporting dates before comparing systems.
    3. Break the comparison down by outcome type, campaign group, new versus returning customer and lifecycle stage where those fields are available.
    4. Compare platform-attributed results with business outcomes, but do not demand equality. Record the ratio between them for each stable reporting segment.
    5. Investigate abrupt ratio changes. A jump can indicate a tagging failure, a changed attribution setting, a new sales lag, missing offline imports or a real shift in the customer journey.
    6. Annotate known changes to schemas, consent behavior, campaigns and operational availability so the AI does not interpret a measurement change as a performance change.

    Ratios are especially useful because the normal gap between systems can be more informative than an impossible attempt at perfect agreement. If a platform usually reports more attributed orders than the order system and that relationship remains stable, you have a usable baseline. If the relationship suddenly changes, investigate before the agent moves budget.

    Attribution still cannot answer the causal question: would the customer have converted without the ad? Attribution allocates credit after a conversion exists. Incrementality estimates the conversions that would not have happened without the campaign. Keep those jobs separate in your data model.

    When the budget and data volume can support a meaningful control group, you can test incrementality through geographic holdouts, audience holdouts or carefully designed pauses. Time-based pauses are vulnerable to seasonality and other concurrent changes, while any test with an indistinct control group can produce an inconclusive result. These methods are different from attribution reporting; do not let an agent treat an attributed conversion as proof of incremental impact.

    The decision hierarchy is simple: business records tell you how much happened, attribution tools describe the credit assigned to observed interactions, and controlled experiments provide evidence about what caused additional outcomes. Your AI should preserve that hierarchy rather than collapse it into one synthetic score.

    Expand the agent’s permissions only after the data proves reliable

    A glowing AI core passes through sequential security gates as validated data signals unlock access to advertising controls.

    Generating headlines or summarizing a dashboard is not the same as running an advertising account. A true agent can adjust budgets, bids, targeting or campaign structure. That power also accelerates mistakes when business data is missing or misaligned. Because those actions spend real money, enforce limits in the surrounding system rather than relying on a prompt to remember them.

    Stage 1: Observe in read-only mode

    Let the agent read platform, CRM, product and operational data without changing an account. Run this stage through a period long enough to include the normal delay between an ad interaction and the business outcome you care about.

    Review whether it joins the correct records, respects lifecycle updates and explains discrepancies without summing incompatible numbers. Every conclusion should identify the metric definition, originating system and data timestamp it used. If the agent cannot show that lineage, you cannot reliably audit its reasoning.

    Stage 2: Produce structured recommendations

    Require each recommendation to contain the proposed action, business objective, evidence, applicable constraint, estimated exposure and rollback condition. A person should approve the action while you compare recommendations with actual downstream outcomes.

    This stage exposes a common failure early: the model may recommend scaling a campaign because platform return improved even though CRM quality, product margin or capacity deteriorated. Rejecting that proposal is not a prompt-tuning exercise. It means the optimization contract, data mapping or decision rule still needs work.

    Stage 3: Allow bounded execution

    Once recommendations are consistently traceable to accepted business outcomes, allow only a narrow set of reversible actions. Put the following controls outside the model:

    • An allowlist of accounts, campaigns and action types the agent may touch.
    • Per-action and cumulative financial limits over a defined period.
    • A freshness gate that blocks changes when CRM, margin or operational data is late.
    • A completeness gate that blocks optimization when essential outcome fields are missing.
    • A cooldown that prevents repeated changes before delayed results can arrive.
    • A before-and-after audit record containing the input data version, decision, approver and resulting account state.
    • A rollback procedure and kill switch that do not depend on the agent remaining available.

    Fail closed when the business context disappears. If the inventory feed stops updating, the CRM import fails or a margin table changes schema, the safe response is to pause autonomous changes and alert an operator. Continuing with platform-only data recreates the closed loop you built the foundation to avoid.

    Keep experimentation separate from routine optimization as well. Mark campaigns, regions or audiences participating in a holdout so the agent cannot erase the control group in pursuit of short-term attributed performance. An autonomous optimizer should execute the experiment design, not silently rewrite it.

    Key takeaways: your AI advertising readiness check

    Your foundation is ready for controlled automation when you can answer yes to every item below:

    • The optimization objective maps to an accepted CRM, order or finance outcome rather than a platform conversion label alone.

    • Early proxies such as clicks, form submissions and attributed conversions are clearly distinguished from realized business results.
    • Outcome values have documented owners, currencies, units, calculation methods and validity dates.
    • Campaign, customer and order records can be joined without counting one business outcome as several customers.
    • Interaction, conversion, attribution and ingestion timestamps remain separate.
    • Product margin and operational constraints reach the decision layer before the agent allocates budget.
    • CRM totals, analytics journeys and platform attribution remain separate views, with normal discrepancies monitored rather than erased.
    • Incrementality evidence is labeled separately from attribution evidence.
    • Missing or stale business data automatically blocks account changes.
    • Every permitted action has an enforced limit, audit trail, rollback path and independent kill switch.

    If any essential item fails, keep the system in read-only or recommendation mode. That is still useful automation. It becomes unsafe automation only when the authority to spend grows faster than the quality of the data underneath it.

    Start with one campaign group and one downstream outcome that sales, finance or commerce operations already recognizes. Connect that result, reconcile it against platform reporting and let the AI recommend changes before it executes them. Expand to more campaigns and wider permissions only after the outcome remains traceable from ad interaction to business record.

    References