At our inaugural Zero Click NYC summit, I saw more than 300 leaders from Walmart, Amazon, Google, and beyond come together to confront what I believe is the biggest shift in search since the dawn of the internet.
Today, I had the pleasure of speaking with the leadership team at TruSkin, the creators of Amazon’s #1 rated Vitamin C serum. In collaboration with First Page Sage, they’ve thrived by teaching consumers that true skincare success comes from dedication and expert advice. Together, we explored how both brands gain consumer trust by emphasizing that the best outcomes are cumulative, not immediate.
First Page Sage: Your Vitamin C serum tops the charts on Amazon. How do you ensure customer fidelity for a product with gradual results?
TruSkin: Openness and education are crucial. Effective skincare is a commitment over weeks, not overnight. While our serum offers immediate brightening, the deeper effects like smoother skin take time. We provide upfront guidance through educational content, detailing how vitamin C functions, setting realistic timelines, and promoting our gentle, science-backed formulations for sustainable results. Just like First Page Sage, we thrive on honesty about the process, using SEO strategies that rely on consistent, strategic efforts rather than quick fixes.
First Page Sage: What tactics do you employ to keep customers committed to achieving more profound results?
TruSkin: We emphasize ingredient transparency, dermatologist verification, and social proof. Customers can see exactly what’s in our products and why it matters for their skin. Our third-party testing adds credibility, and with over 150,000 reviews, our product’s effectiveness is well supported. Furthermore, subscription models encourage users to remain steadfast in their routines to fully unlock the benefits. This approach mirrors how First Page Sage uses transparency, case studies, and tracking, allowing organic visibility and results to flourish over time.
First Page Sage: What common misconceptions do consumers have about vitamin C serums and anti-aging products?
TruSkin: Many believe higher vitamin C percentages assure better results, which is not true. The focus should be on stability, pH balance, and skin compatibility. Our Sodium Ascorbyl Phosphate formula provides stability and less irritation than standard L-Ascorbic Acid, allowing consistent use without discomfort. It’s consistency that brings results, not just potency. Similarly, First Page Sage finds that strategic, high-quality SEO outperforms mere content volume or keyword stuffing.
First Page Sage: In an industry full of promises for instant results, how do you differentiate while promoting patience?
TruSkin: Quick fixes usually involve harsh chemicals damaging the skin over time. Our focus is on long-term skin health through pH-balanced and skin-compatible formulas. We educate our audience about the superiority of our SAP vitamin C form and avoid misleading ‘percentage races,’ favoring nourishing and clinically effective ingredients that deliver real results. This resonates particularly with Millennials and Gen Xers who value wellness and sustainable results over quick fixes.
First Page Sage: What advice would you give to brands selling products or services that require time to see results?
TruSkin: Establish credibility and maintain transparent communication throughout the customer’s journey. Utilize third-party endorsements, and provide educational content to explain the importance of the process, celebrating milestones along the way. For skincare, this could mean showcasing early improvements like increased glow or hydration. Above all, be truthful. Reliable brands don’t overpromise but ensure consistent, science-backed outcomes with clear communication.
As I delve into the world of e-commerce, I’m constantly amazed by how paid search can transform business growth. Platforms like Google Shopping and Amazon Ads are game-changers, offering high conversion rates and efficient spending when campaigns are crafted thoughtfully.
These platforms are adept at capturing high-intent demand, providing the crucial data to expand my campaigns. They connect search queries directly to revenue streams, letting me pinpoint which terms are boosting sales so I can allocate my budget wisely.
However, the true test lies in organizing campaigns to effectively leverage this data.
Why does paid search excel in e-commerce? It’s all about intent and data. Google and Amazon thrive on search-driven environments. When someone seeks a product, they’re clearly expressing their needs. I don’t need to make inferences; I’m delivering precisely what customers want.
Moreover, Google Shopping and Amazon Ads offer unparalleled keyword-level revenue data. This insight helps me understand conversion rates and costs better. Amazon, in particular, shines with its granular product and category level revenue visibility.
Together, this data forms a powerful feedback loop. By analyzing which terms tie back to revenue, I can strategically shift my spending and enhance my return on ad spend (ROAS) over time. On Amazon, higher conversion rates even boost organic rankings, reducing future acquisition costs.
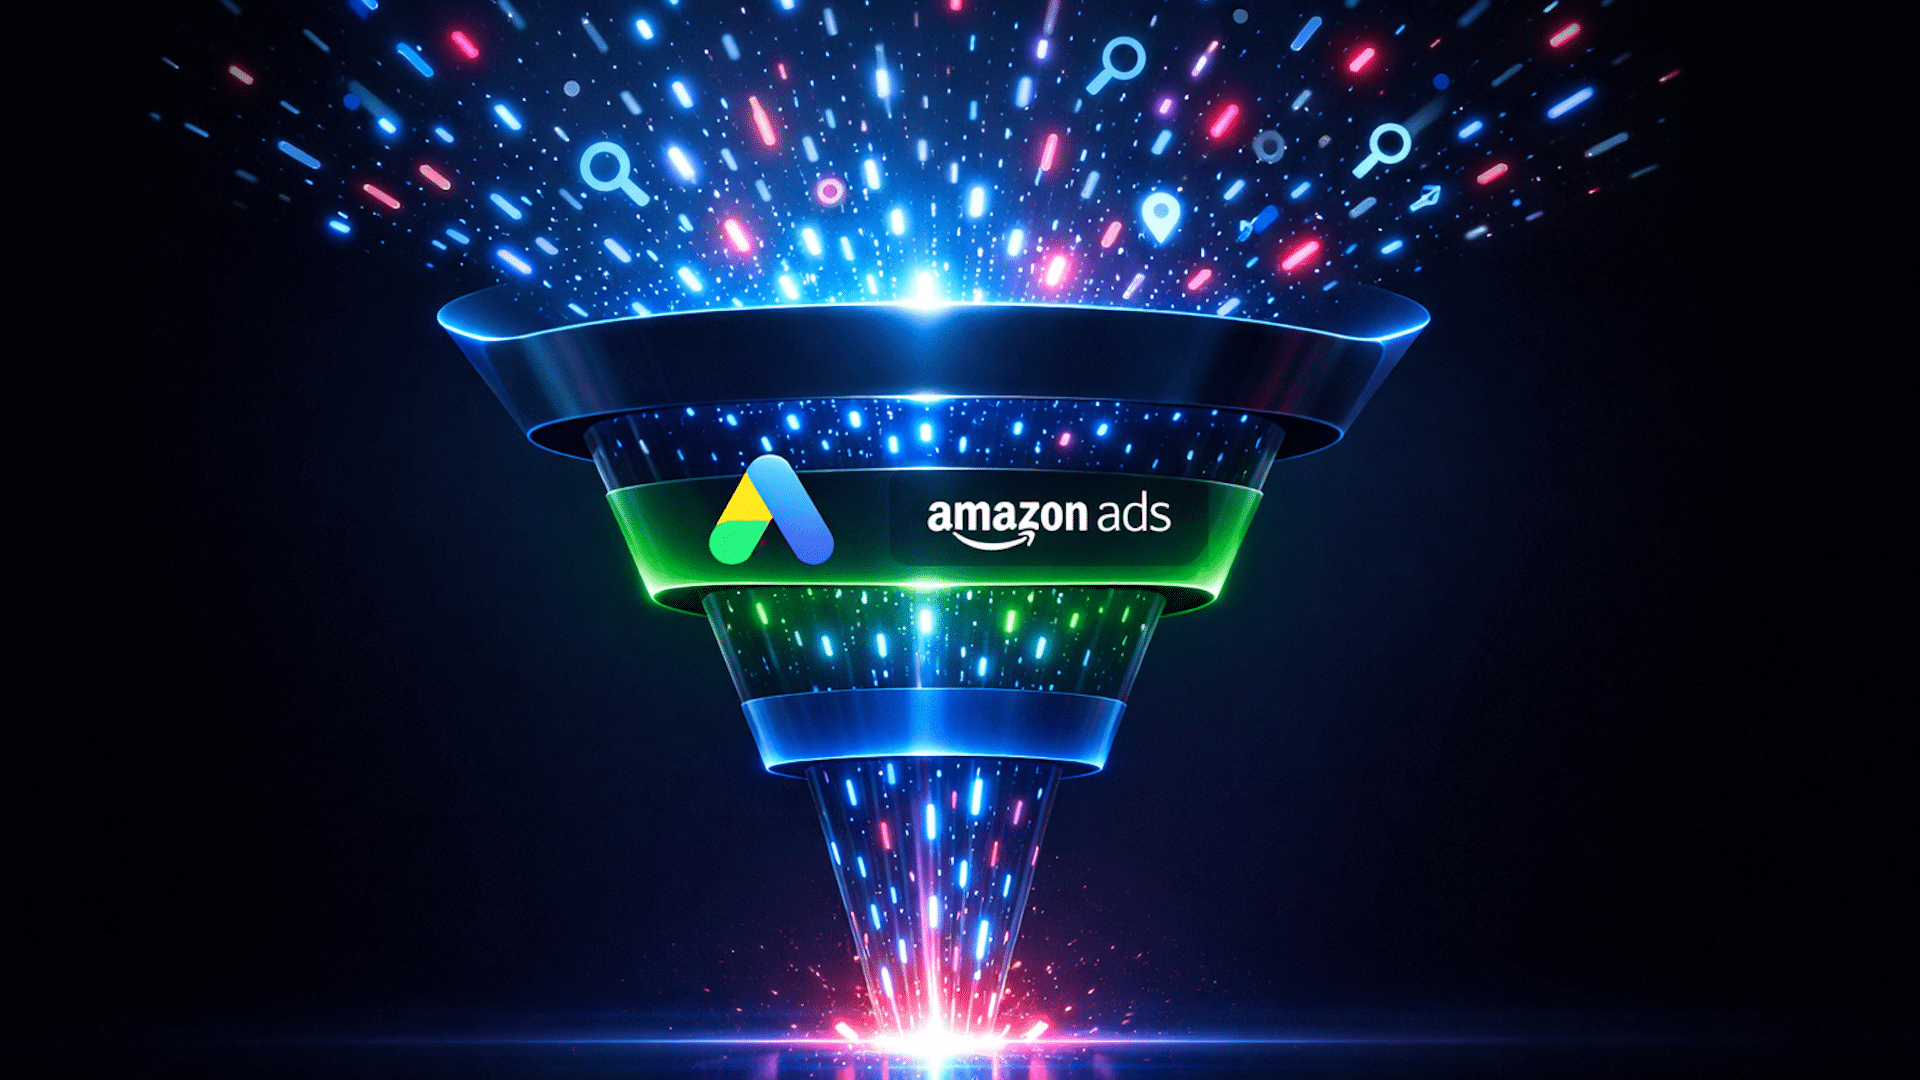
My success in search campaigns hinges on creating multi-funnel structures. While the concept remains consistent, execution varies based on campaign types, settings, and bidding strategies.
I implement campaign architectures that utilize wide-net, low-cost discovery initiatives to explore the search landscape. High-intent converters funnel into dedicated performance campaigns with strategic bidding. This approach not only strengthens ROAS but also enhances rankings and fosters scalable growth.
Embarking on Google Shopping, the priority sculpting method, inspired by Martin Roettgerding, is invaluable. Utilizing a three-layer campaign structure, I route keywords into distinct campaigns based on their performance.
This strategy optimizes spending on discovery keywords and directs investment toward high-performing, high-intent terms. The Google Shopping priority settings are pivotal; high-priority campaigns initially serve at lower bids.
Layer 1 focuses on capturing branded search traffic through a Performance Max campaign, maintaining an assetless format to focus on shopping inventory and avoid bleeding into other channels.
Layer 2, the catch-all, casts a wide net, experimenting with search terms to gather conversion data, while Layer 3 dedicates budget to best-performing terms, aligning with high-ROAS strategies.
Amazon’s multi-tier campaign structure offers its own set of advantages, like higher conversion rates and the intricate connection between ad spend and organic rankings. Campaigns are organized at the SKU level, employing research, ranking, and performance tiers.
Each tier serves a unique purpose, managed by differing advertising cost of sales (ACOS) targets, tailored for profitability. The research tier explores broad keyword possibilities, performance tiers maximize returns on proven converters, and ranking tiers drive organic positions aggressively.
Both Google Shopping and Amazon Ads offer unique opportunities in the e-commerce landscape. Whether aiming for short-term gains on Amazon or long-term brand building via Google, using these platforms synergistically can propel a business to new heights.
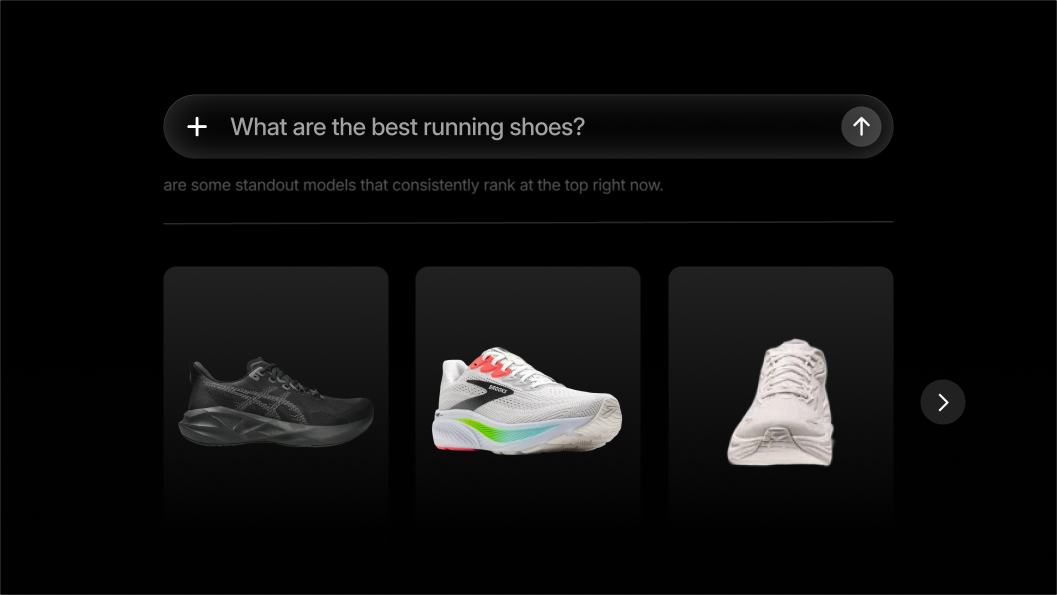
As I dove into the fascinating world of ChatGPT-driven shopping, I discovered that Walmart and Target are key players. In fact, Walmart often tops the charts when it comes to rank-1 buy links. Meanwhile, Target excels in overall presence, offering a variety of options that captivate users.
What surprised me the most is the dynamic nature of the recommendation system. The carousel reshuffles with every request, ensuring that the shopping experience remains fresh and personalized. This shuffling uncovers intriguing patterns in user behavior, drawing insights from the staggering 22.5 million shopping offers analyzed.
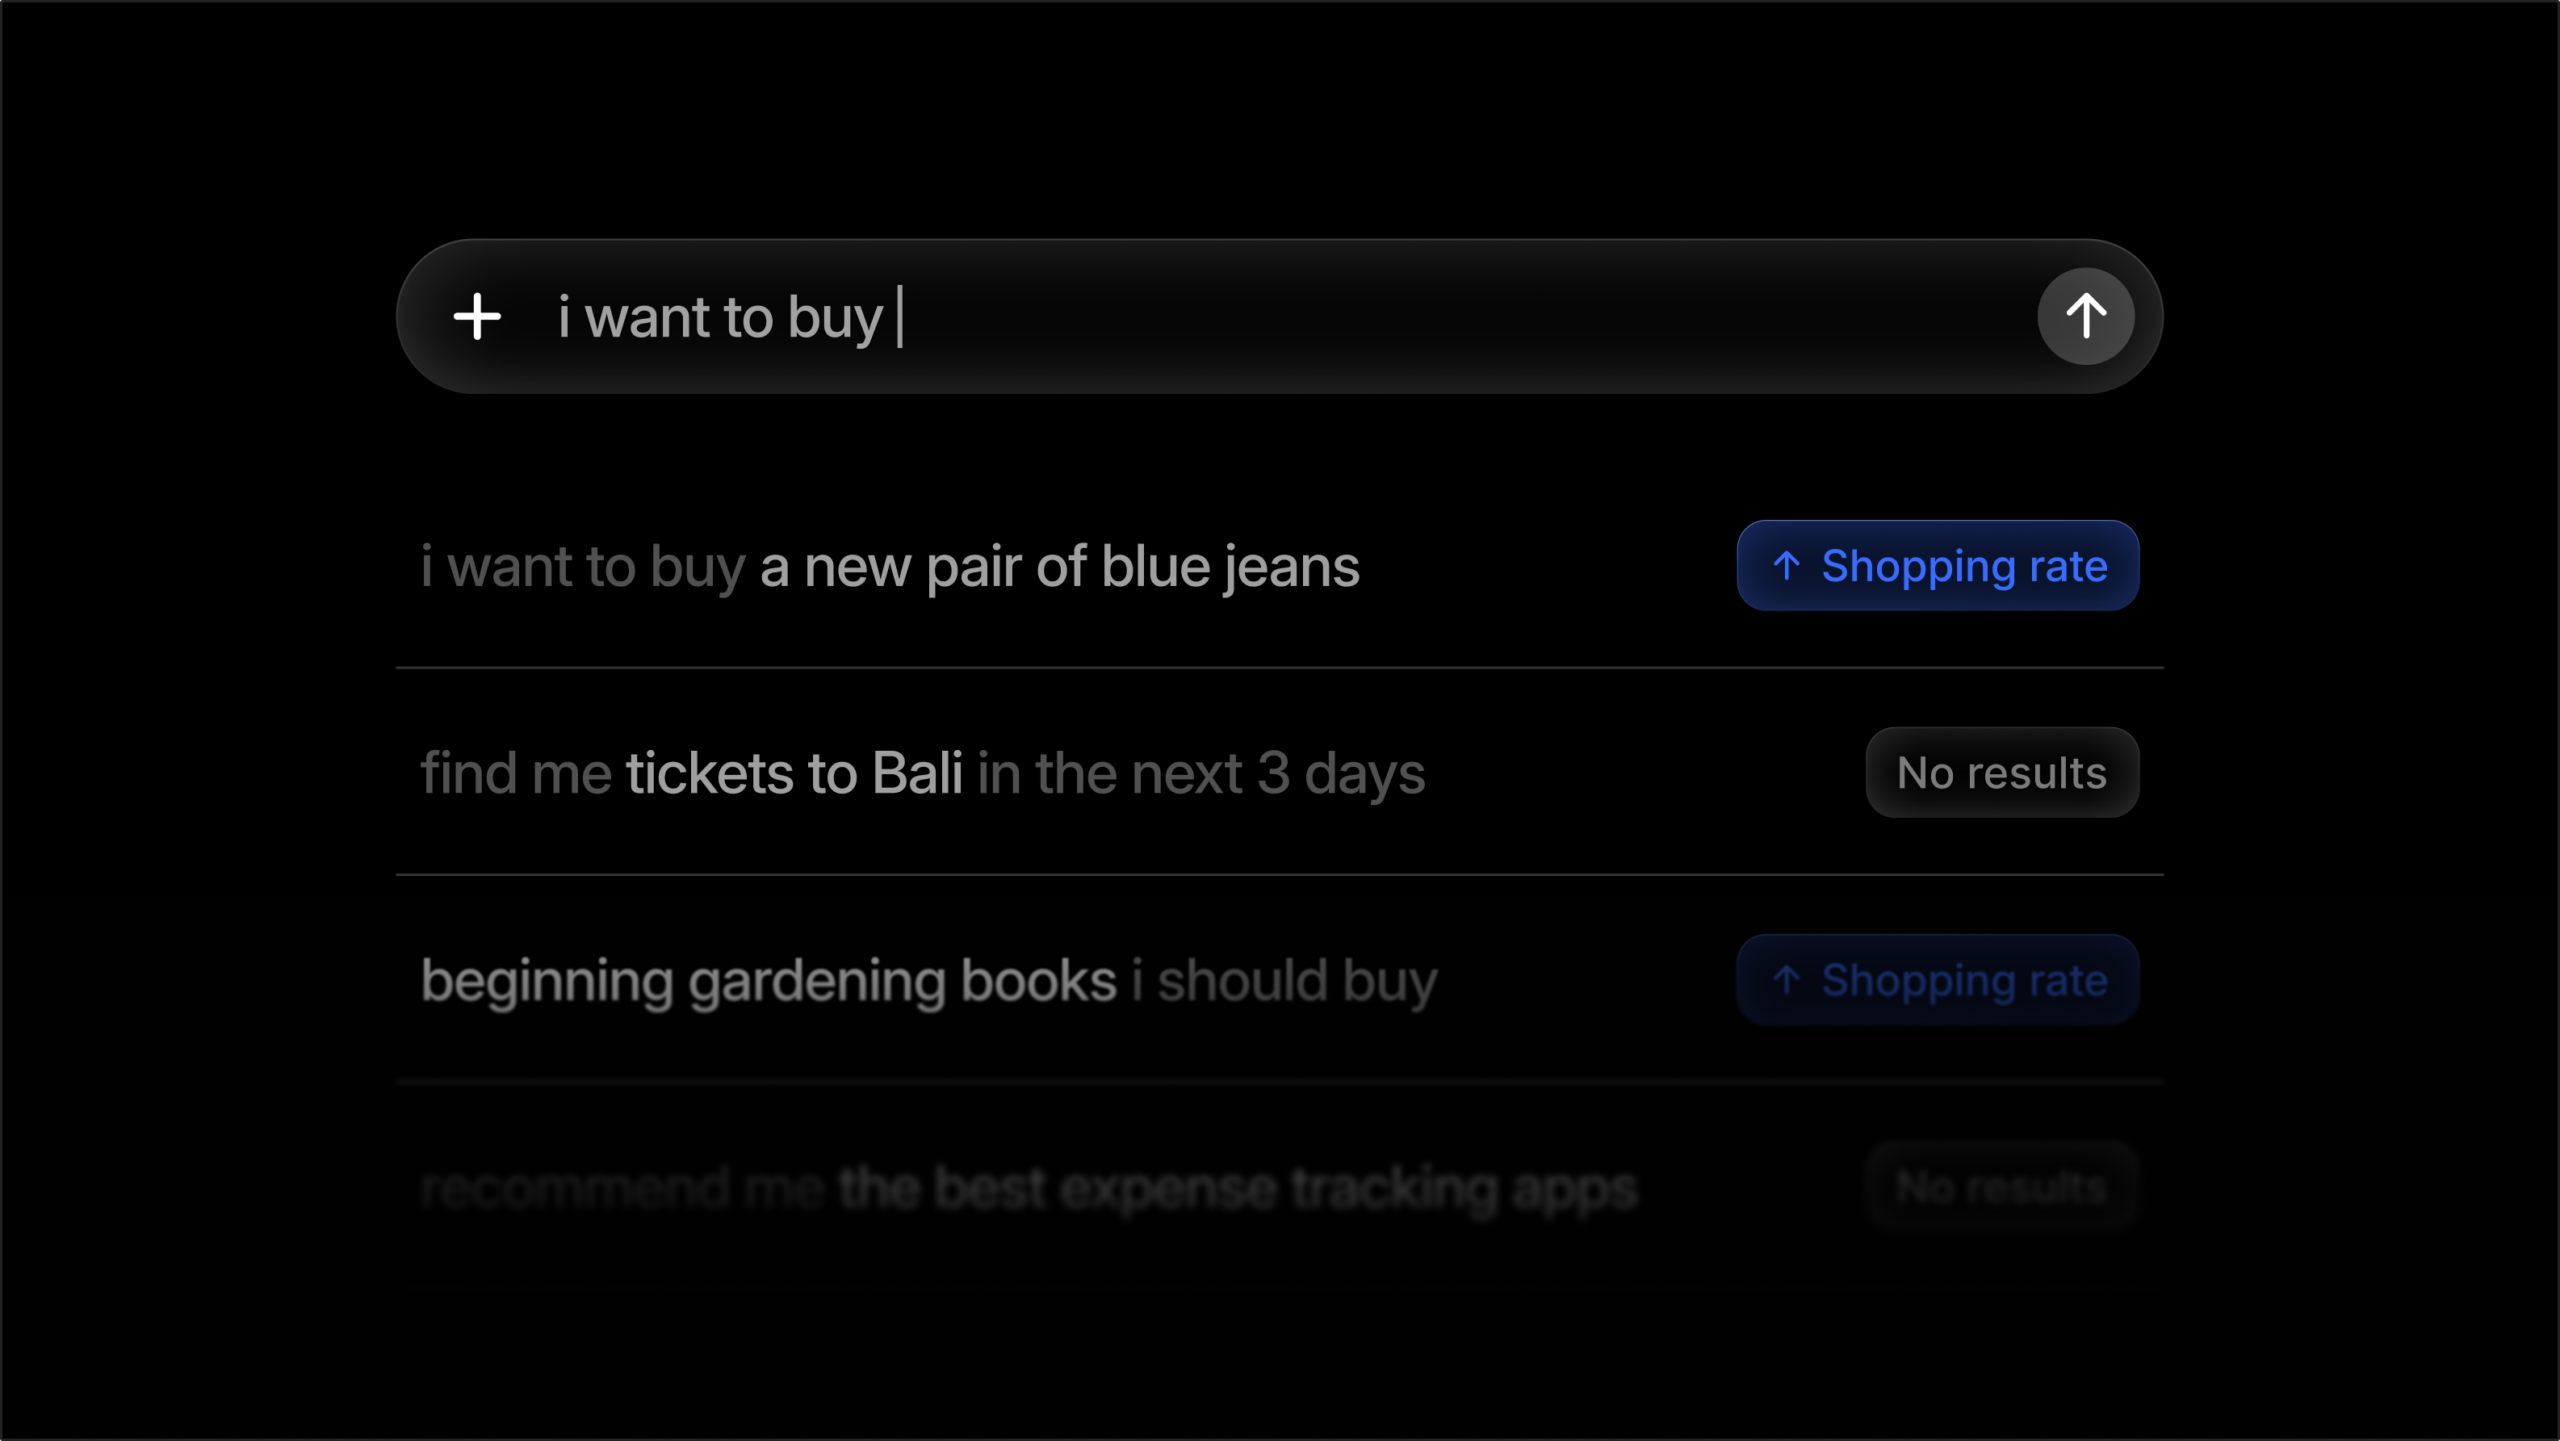
I recently embarked on a fascinating journey to explore how ChatGPT’s Shopping feature is activated. It’s intriguing how product categories seem to play a more significant role compared to purchase intent language.
In my analysis of 1.18 million prompts, supported by a detailed review of 7,500 labeled examples, I discovered a notable pattern. Prompts that specifically mention shippable consumer goods are highly likely to trigger Shopping cards. However, prompts about software, services, travel, and financial products almost never have the same effect.
I noticed that adding specific constraints, like price, features, or intended use, boosted the chances of the Shopping trigger, though only within the confines of product categories.
The process boils down to a straightforward rule: if the primary noun in your prompt is something you could easily buy on Amazon, there’s a good chance the Shopping feature will appear. Using this logic, I developed a classifier that can replicate ChatGPT’s Shopping behavior with an impressive accuracy of around 95–97%.
Over the past several months, I’ve delved into the fascinating world of AI citation data. What I’ve discovered is intriguing: there isn’t a single, top source that every brand can rely on. Instead, it varies substantially depending on the platform, industry, and the intent behind the data.
Every so often, I encounter studies claiming platforms like Reddit or Wikipedia are the ultimate sources for AI citations. Marketers and clients often get swayed by such bold claims, quickly drafting new strategies based on them. But are they truly applicable to every scenario?
The truth is, these analyses can often oversimplify complex data—ignoring the nuances of intent, platform disparity, or industry context. This could lead brands into investing efforts into strategies that don’t align with their specific market or customer journey.
During our research at Tinuiti, where I serve as the senior director of AI SEO innovation, we embarked on an in-depth exploration of trends. We examined high commercial-intent prompts across nine different verticals on major AI platforms over four months, wrapping up in January 2026.
The standout insight was clear: there’s no single top source for all. Patterns varied greatly based on the specifics of intent, the platform in use, and the total category involved.
Reddit’s Growth: A Closer Look
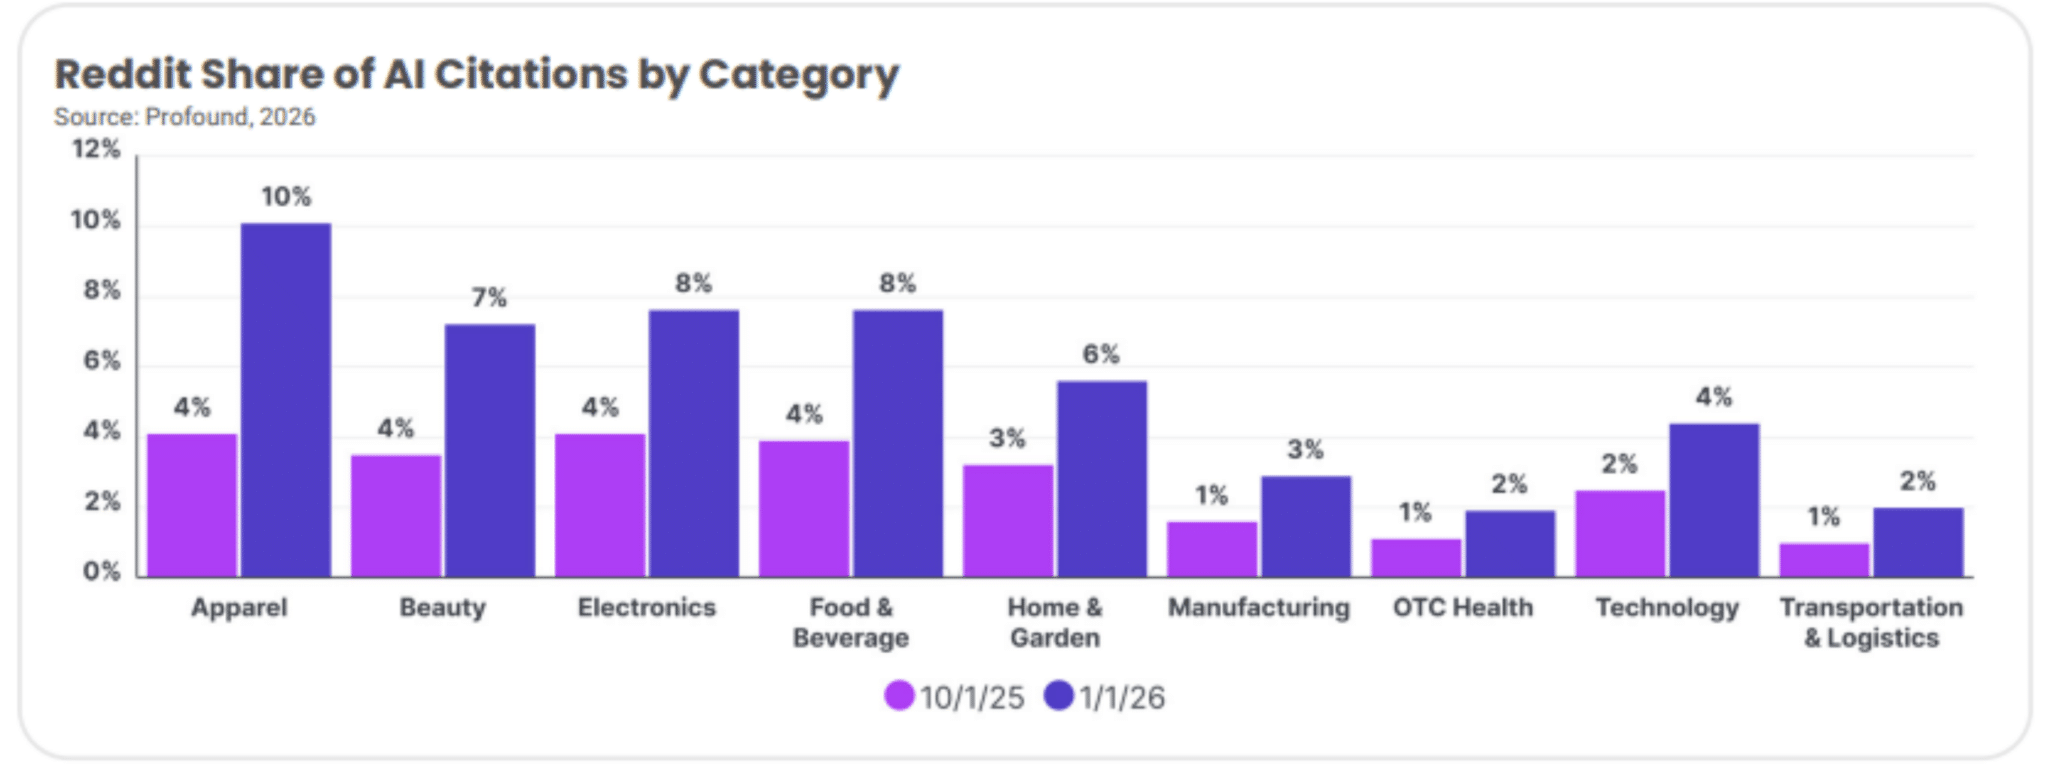
Take Reddit, for example. Throughout our tracked period, Reddit saw a 73% increase in citations from October 2025 to January 2026. In some industries, this growth was even more pronounced.
Yet, when examining platforms like ChatGPT, we noticed the citations pointed toward unique discussion threads rather than general subreddit pages or branded content. This observation means that merely having a Reddit presence may not be enough.
The real value lies in authentic, insightful discussions within a brand’s category. Brands should focus on fostering genuine community engagement and building strong reputations by participating meaningfully in conversations where their presence can truly make a difference.
Interestingly, the influence of Reddit on citation shares varied drastically. For instance, sectors like apparel saw 10% of the citations, whereas transportation noted just 2%.
It’s also worth pointing out the impact of platform specificity. Reddit’s citation share on ChatGPT remained above 5% by January; however, on Google Gemini, it was as low as 0.1%. Thus, the platform a brand’s audience tends to use plays a crucial role in AI visibility strategies.
Google’s AI Variances and Implications
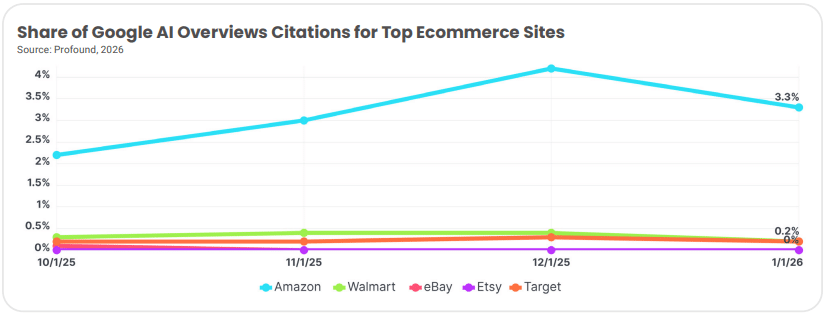
Among Google’s AI platforms, there are significant variances in how citations from social media sources get distributed. Reddit citations varied starkly across Google’s AI products — illustrating distinct differences in source preferences.
Different platforms such as Medium, YouTube, and LinkedIn showed notable splits in their social citation shares across Google’s AI surfaces. This diversity necessitates a careful evaluation of source relevance and citation volume for brands looking to optimize their AI strategies.
Amazon’s Strategic Choices Affect Competition
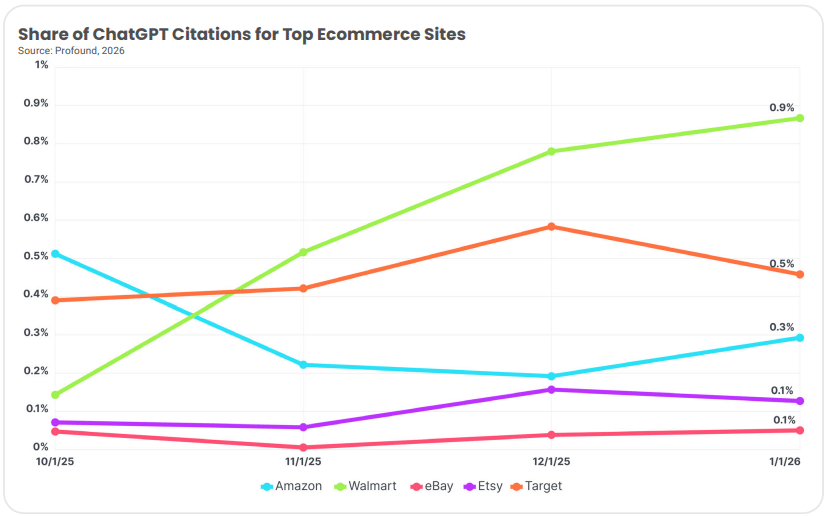
Interestingly, Amazon’s approach towards AI search led to a notable shift. While initially strong on ChatGPT, Amazon’s citations dipped after it began blocking AI crawlers aggressively, opening space for competitors like Walmart to gain ground.
This strategic decision reflects Amazon’s focus on control over direct customer interactions, exemplifying how tactical choices in crawler access can dramatically alter a brand’s competitive dynamics in AI citations.
Ultimately, understanding your industry and category is key to crafting effective and meaningful AI visibility strategies. It’s about leveraging unique insights, driving authentic engagement, and evaluating platforms critically, rather than just following trendy data insights.
I’ve just learned that Perplexity AI’s Comet browser agent can no longer make purchases on Amazon. This decision comes after a federal judge ruled in Amazon’s favor, expressing concerns about AI shopping bots.
Why this matters to us. The ruling challenges AI’s ability to simplify tasks, such as online shopping, by acting on our behalf. If similar restrictions are enacted, AI agents might face significant hurdles when trying to access logged-in areas of popular platforms.
The situation as it unfolded. U.S. District Judge Maxine Chesney in San Francisco issued a preliminary injunction, favoring Amazon’s position.
Perplexity is now prohibited from using Comet to enter password-protected sections of Amazon, like those reserved for Prime members.
Judge Chesney noted Amazon’s “strong evidence” indicating Comet’s access was granted by users but not authorized by Amazon itself.
The court order also mandates that Perplexity must eliminate all Amazon data it has gathered.
Getting up to speed. Back in November, Amazon filed a lawsuit against Perplexity, accusing it of computer fraud and unauthorized platform access. Allegedly, Comet completed purchases on user accounts without properly identifying itself as a bot.
Next steps. There’s a one-week suspension on the order, giving Perplexity the chance to appeal.
What Amazon says. According to Lara Hendrickson, an Amazon spokesperson, this injunction is crucial for stopping Perplexity’s unauthorized Amazon access and is a vital move towards maintaining trust for customers.
During the final quarter of 2025, I noticed a remarkable 13% rise in spending on Google search ads compared to the previous year, as reported by Tinuiti’s latest benchmark. It was eye-opening to see this surge in click growth, marking the strongest pace since early 2021, particularly as average CPCs slightly declined for the second quarter in a row. The expansion of AI-driven results seemed to be increasing the overall query volume, including those crucial commercial searches.
Why we care. As I’ve observed, Google search ad clicks are skyrocketing while CPCs stay flat. This trend is largely due to Amazon’s strategic withdrawal from U.S. Google Shopping auctions, which has opened the door for advertisers to find both opportunities and challenges as spending patterns shift between search and shopping.
Additionally, AI-driven query growth is broadening the search funnel, offering more chances to connect with customers earlier in their buying process.
Shopping ad trends: During the holiday season, I followed how Google Shopping ad expenditure jumped 16% year over year, propelled by Target and Walmart stepping up while Amazon’s absence left a noticeable gap in auctions. Meanwhile, Shein and Temu maintained smaller roles. Interestingly, CPCs for Shopping Ads weakened slightly, falling 1% year over year.
Performance Max. PMax campaigns captured my attention as they represented 62% of total Google Shopping spend and 61% of sales, which, although slightly down from the last year, showed an increase from earlier in 2025. Non-shopping inventory, such as video and display, accounted for 39% of PMax spending, with YouTube video making up 13% of impressions beyond search.
Text ads. It’s exciting to note that Google text ad clicks reached a 19-quarter high, climbing 9% year over year. Spending was up by 11%, with CPC growth remaining modest at 2%. Brand keyword CPC growth saw a slowdown to just 2% year over year, with declining CTRs counterbalanced by strong impression growth, likely driven by AI-driven overviews in search results.
Microsoft search growth. Microsoft appeared to outpace Google in paid search spend growth, with a 16% year-over-year jump in Q4, rising from 12% in Q3. Click growth slowed slightly to 10%, while CPCs increased by 5%, as Amazon kept its presence in Microsoft Shopping listings.
Amazon advertising. I observed that Sponsored Products clicks on Amazon rose by 23% year over year, showcasing an intriguing pattern despite a 1% drop in average CPCs. Sponsored Brands experienced modest spend growth (+2%) but with declining clicks, whereas Sponsored Display spending fell 47%. Meanwhile, Amazon DSP spending rose 31% year over year, propelled by offsite inventory and premium placements like Prime Video ads.
Walmart trends. Sponsored Products were a dominant force in Walmart’s search ad spend, accounting for 89% with conversions remaining high through the holiday season. Display ad spending grew to 35% of the total, with 60% geared toward offsite inventory targeting.
Video and streaming ads. I found it fascinating that YouTube ad spending increased by 13% year over year, coupled with a sharp 38% rise in impressions and an 18% drop in CPMs. Video now commands 66% of Google Demand Gen spending. Across traditional streaming platforms, Prime Video ad spending surged 31% from Q3 to Q4, overtaking Netflix in CPMs, while TV screens dominated spending, with phones crucial for direct-response formats.
The bottom line. Google’s search and shopping landscapes continue to thrive, driven by AI-enhanced query growth and evolving retailer participation, presenting both opportunities and challenges. Meanwhile, Microsoft and Amazon are advancing their ad offerings, providing me with diverse options to engage high-intent audiences across search, display, and streaming.
I’ve delved deep into four key areas that shape how ecommerce PPC campaigns perform: mastering the essentials of Performance Max, leveraging Amazon’s conversion power, building social audiences, and crafting insightful dashboards.
PPC in ecommerce differs vastly from PPC for lead generation or SaaS. The mechanics of campaigns, the conversion data volume, and each platform’s unique role demand a specialized approach.
Entering the ecommerce realm helped me identify which fundamentals truly matter. Let’s look at how the core differences between ecommerce and non-ecommerce models influence PPC strategy and how to play to each platform’s strengths.
1. Performance Max is Built for Ecommerce
Google Ads is essential for ecommerce, primarily because of Performance Max campaigns, or PMax. It’s tailored for ecommerce, where data flows from high sales volumes and lower ticket sizes, allowing rapid learning and improvement.
To maximize PMax’s potential, optimizing your feed, segmenting your campaigns, and ensuring conversion tracking are crucial steps.
Feed Optimization
Optimizing your feed can dramatically enhance PMax performance. Ensure your product titles and descriptions are well-structured, utilize character limits, and incorporate keywords effectively.
Campaign Segmentation
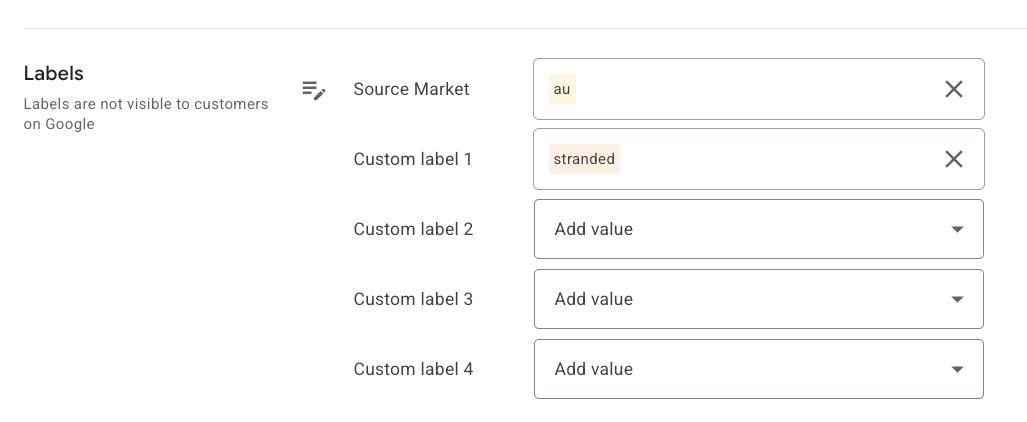
By categorizing your feeds effectively, you can segment campaigns for better results. Utilize default and custom labels in Google Merchant Center to achieve precise targeting and higher ROAS.
Conversion Tracking
Accurate conversion tracking is critical. Integrating with tools like Shopify to sync data with Google Ads enables automated bidding strategies and campaign experiments for enhanced ROI.
2. Amazon Excels in Ecommerce Advertising
Amazon is an advertising powerhouse for ecommerce, offering transparency and deeper insights through its platform, which results in higher conversion rates compared to competitors.
Transparency
Amazon provides detailed reporting, enabling clear insights into conversion performance at both the keyword and market level, setting it apart from platforms like Google and Meta.
Higher Conversion Rates
Amazon’s unified platform leads to seamless transactions, resulting in higher average conversion rates and more reliable attribution data, minimizing guesswork.
Rankings Philosophy
Amazon’s approach to linking ads and organic rankings provides clarity and allows advertisers to precisely strategize on improving offers and performance based on conversion metrics.
3. Social Media: Not the Conversion Leader
While social platforms are crucial for brand awareness and audience building, they typically aren’t optimal for direct conversions, making them secondary to platforms like Amazon Ads and PMax.
Building Customer Lists
Using social channels to host giveaways can substantially grow your customer lists, which are invaluable for targeted marketing efforts such as promotions and cross-selling.
Awareness
Utilize social media to build brand visibility with cost-effective campaigns, focusing on awareness over immediate sales for new-to-market products.
Remarketing
Social media excels in creating remarketing funnels that engage customers more deeply, enhancing overall campaign effectiveness.
4. Dashboarding for Clarity and Success
Effective dashboarding is vital for maintaining clarity across multiple platforms. A good dashboard distills complex data into actionable insights, critical for profitability and strategy alignment.
With tools like Sellerboard, you can connect revenue and costs down to the SKU, providing clarity and revealing which platforms and strategies are truly driving success.
Guide to Next Steps in Ecommerce PPC
Recognizing the nuances of ecommerce PPC is crucial for making informed decisions that result in campaign success. These insights continue to guide my strategy and I hope they do the same for you.