Have you ever wondered how AI manages to stay grounded in reality? As I delve into the fascinating world of LLM grounding, I uncover how AI models maintain their accuracy, and why this is crucial for your brand’s visibility and success across platforms like ChatGPT and Gemini.
Understanding how AI functions in this way is not just about technical curiosity; it’s about knowing how to leverage these tools to enhance your brand’s presence and credibility online. Join me as I explore the role of LLM grounding in shaping AI’s effectiveness and reliability.
When I think about brand visibility today, it’s clear that being chosen by AI systems is crucial. Authority, unique insights, and consistent signals now determine if my brand makes the cut.
I’ve realized that AI isn’t just reshaping search; it’s deciding which brands are seen and which are ignored.
I learned from Andrew Warden, CMO of Semrush, at the Adobe Summit that visibility is evolving fundamentally, and our brands risk being systematically filtered out by AI systems.
“The idea of standing out is no longer optional. There’s a real risk of sameness,” he pointed out.
With AI systems deciding what to highlight and what to ignore, I know I must compete more fiercely for visibility in AI-generated answers.
AI is Changing How Discovery Works
The change is evident in the data: 60% of Google searches now end without a click to a website. People are still seeking information but aren’t always visiting websites. They’re getting their answers directly from AI systems like Google AI Overviews and ChatGPT.
These AI systems have become, as Warden described, the “new gatekeepers.”
This shift ushers us into the agentic era, where AI systems act as intermediaries, guiding users from inquiry to decision in one seamless interface.
Meanwhile, user behavior is evolving. People engage more in conversational environments, posing follow-up questions, refining queries, and surveying options within the interface, all resulting in fewer clicks but often attracting higher-intent users.
Warden noted that consumers using LLMs convert at least four times higher than those relying solely on search.
SEO is the Foundation
Despite some claims that AI could replace search, Warden reassured us that SEO is not dead.
SEO has become more foundational than ever. It’s essential to ensure my brand exists in the data layer AI systems rely on.
Warden emphasized, “SEO isn’t just for humans anymore. This is a training manual for AI right now.”
This involves ensuring:
Crawlability
Indexability
Structured data
Authority signals
Without these, my brand won’t appear at all.
Research backs this up: 94% of Google AI Overviews cite at least one top organic result, reaffirming that traditional search signals still support AI outcomes.
The Rise of the ‘Bland Tax’
One striking concept from the session was what Warden dubbed the “bland tax.”
AI conditions itself to overlook blandness, causing generic or repetitive content to vanish.
If I’m generic, Warden warned I’m perceived as average, and if I’m bland, I’m effectively invisible.
AI systems don’t reward sameness. Rather than highlighting my brand, they often condense similar content into a single, attribution-lacking response.
“This is an invisible penalty,” Warden noted.
The consequences manifest in several ways:
My brand identity gets erased in AI-generated summaries
My content is filtered out as low-value
My work becomes training data for AI without offering visibility to my brand
“You also become a free training ground for LLMs,” he said.
What Visibility Depends On
Warden redefined brand visibility as a blend of:
Discoverability: Can LLMs easily find me?
Authority: Do they trust my brand enough to include it?
“You absolutely need both,” Warden asserted.
SEO ensures I’m discoverable. Authority determines whether my brand shows up in AI-generated responses.
Without authority, I risk turning into a “commodity that isn’t worth being mentioned.”
How to Win: Three Key Signals
Warden outlined three crucial areas determining whether my brand appears or gets filtered out:
1. Entity Authority
AI systems map entities and relationships, and they must recognize my brand as an authority on a topic.
One key signal is brand demand. If people aren’t seeking out my brand, neither will AI.
Strong brands emphasize their authority across various platforms—owned content, media exposure, and community discussions—demonstrating their niche.
2. Information Density and Originality
AI systems prioritize content that offers new insights. It’s vital to not just publish content but contribute something meaningful.
They emphasize new facts with proprietary data, original research, unique perspectives, and expert insights.
According to Warden, original insights can enhance visibility by 30 to 40%.
3. Signal Alignment
AI evaluates not just what I convey but also what others say about my brand.
This includes reviews, discussions on platforms like Reddit and YouTube, media mentions, and customer conversations.
Warden warned that conflicting signals could prompt AI to flag my brand as unreliable.
Consistency across these channels creates what he called a “consensus signal” that AI systems can trust.
Why Most Organizations Aren’t Ready
One of our biggest challenges is organizational, as visibility isn’t just a channel issue; it’s an organizational one.
Currently, responsibilities are fragmented. SEO teams focus solely on rankings, PR and brand teams manage messaging, and growth teams conduct experiments. This leaves no one clearly owning AI visibility.
This fragmentation leads to inconsistent signals and missed opportunities for us.
To truly compete, we need alignment across teams, working on a shared strategy about how my brand appears wherever LLMs gather data.
The Measurement Problem
Meanwhile, traditional performance metrics are unraveling.
Many marketers, including myself, notice a gap where rankings hold steady, but traffic declines. Meanwhile, leads might increase, yet attribution remains murky.
Warden explained that demand remains, but traffic no longer serves as its proxy. Our content is utilized, but not in ways directing users back to us.
This creates a growing disparity between impact and the ability to measure that impact accurately.
From Rankings to Relevance
The nature of competition has evolved. I’m no longer vying for a mere position; instead, I’m competing to be featured in a synthesized AI answer.
Authority, once easier to influence, now hinges on external validation—emphasizing what others say over what I publish.
Algorithms have shifted from being my allies to arbiters of meaning, marking a significant change in search dynamics since Google itself emerged.
The New Rules of Brand Visibility
AI has not altered what makes a brand strong but has transformed how that strength is measured and rewarded. The brands that win today will build real authority in a focused niche, publish original and high-value content, and ensure consistent messaging across every platform.
The need for consistent third-party validation across an ecosystem is paramount.
As Warden urged, I must make it impossible for LLMs to ignore my brand.
Have you ever wondered about the performance of your YouTube videos? With the time and resources invested in creating content, it’s crucial to track its success.
While YouTube Studio offers robust analytics, accessing the data can be tricky, especially for sharing with others. Here’s where Google Data Studio (previously Looker Studio) comes in handy, offering an easier way to analyze and share YouTube data.
With Data Studio, I can seamlessly integrate YouTube data, schedule updates for stakeholders, customize dashboards, and monitor performance without needing direct access to the backend.
Let me guide you on integrating YouTube analytics into a Data Studio report.
Using a template or starting from scratch
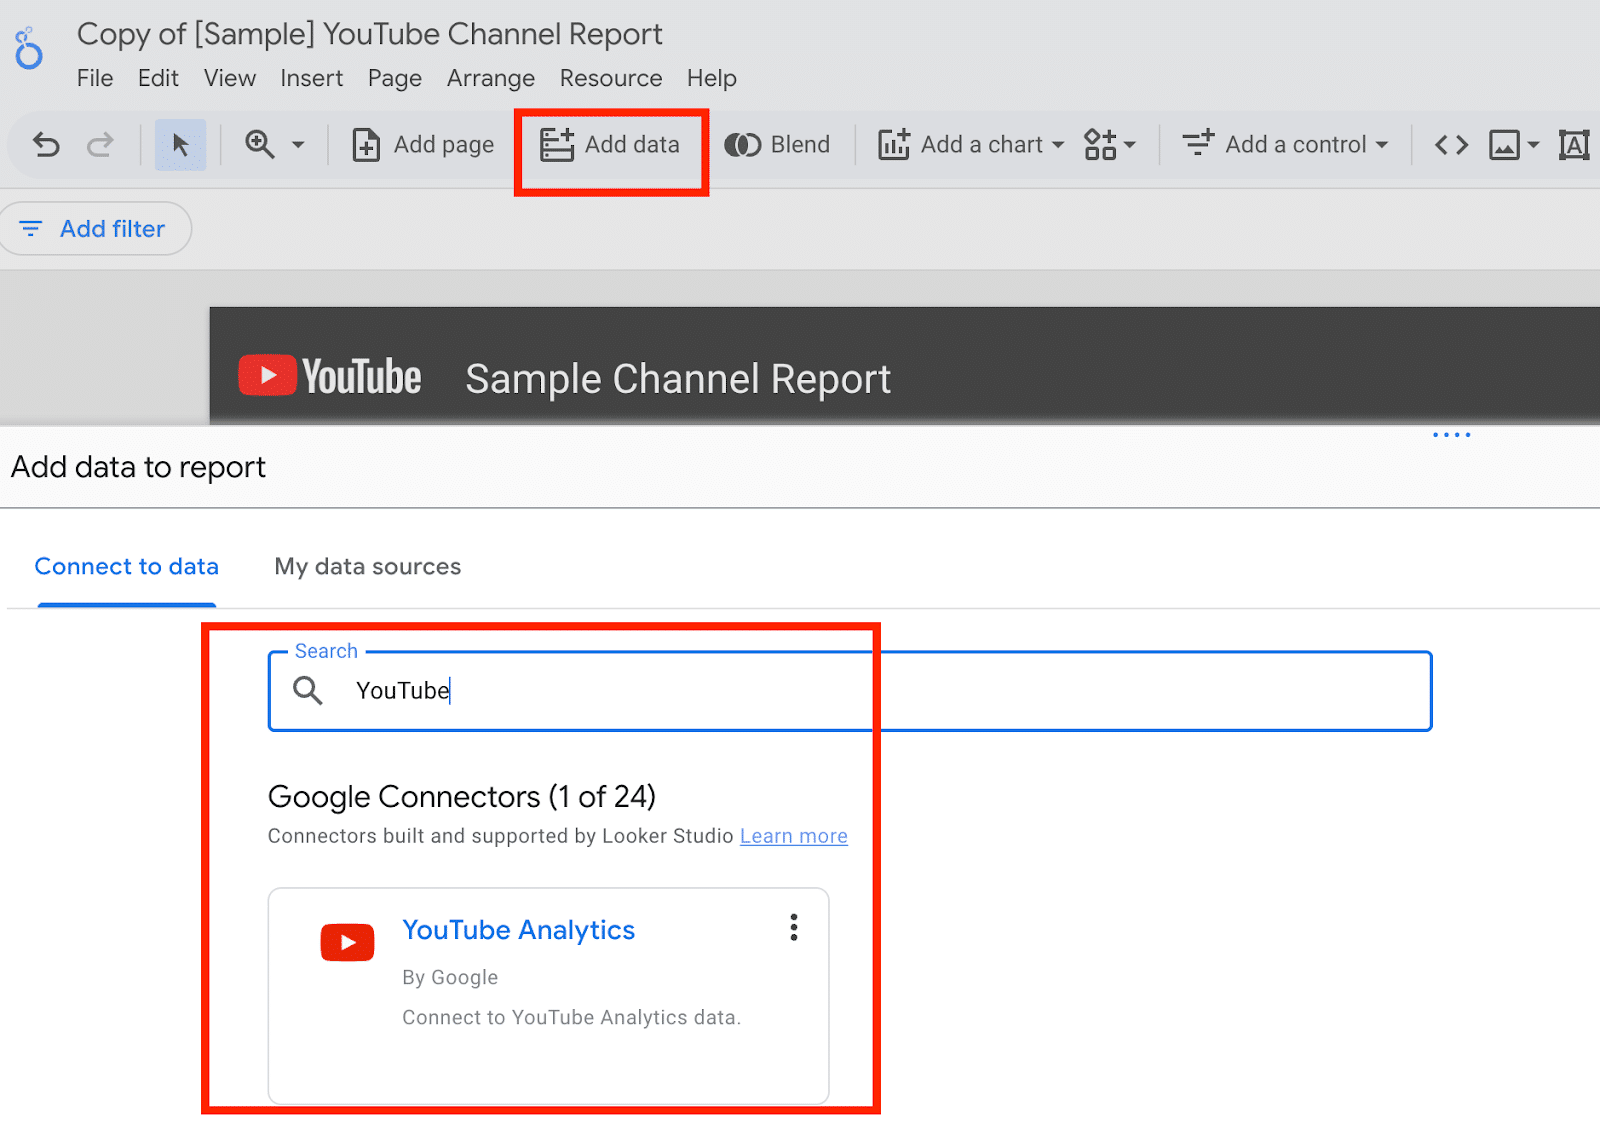
Setting up a report in Data Studio offers two paths. Google’s YouTube Analytics template is a quick start, presenting a clean report with foundational metrics. But be prepared to fix some common issues, which I’ll help you navigate. Alternatively, if you’re up for a challenge, creating a report from scratch can deepen your understanding of Data Studio.
This guide covers both options.
If you’re not the YouTube account owner
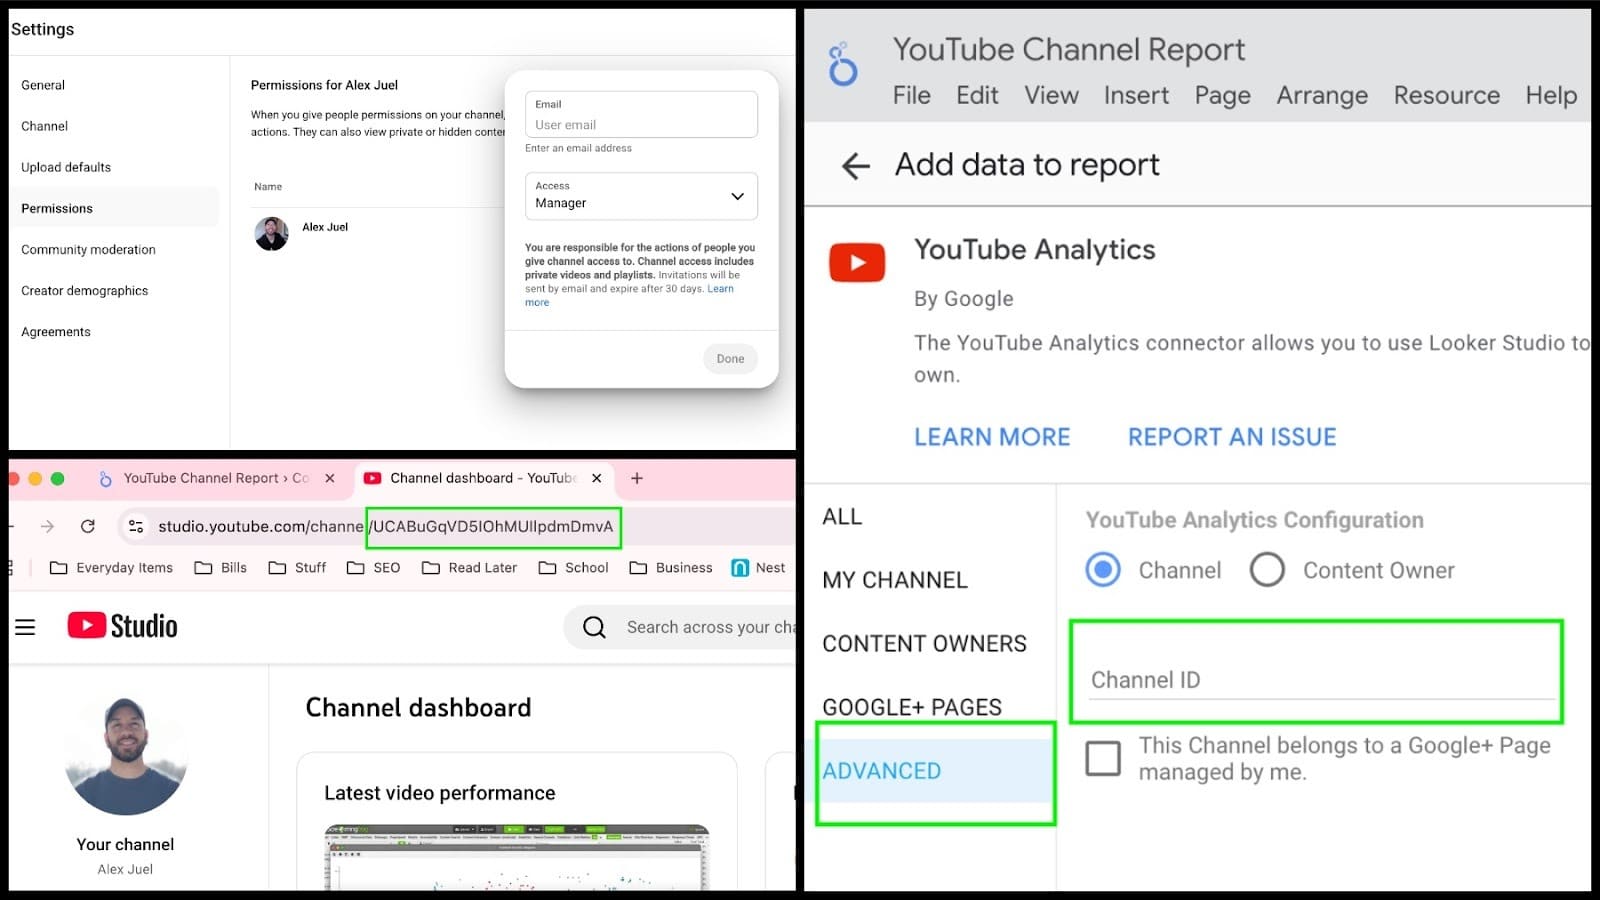
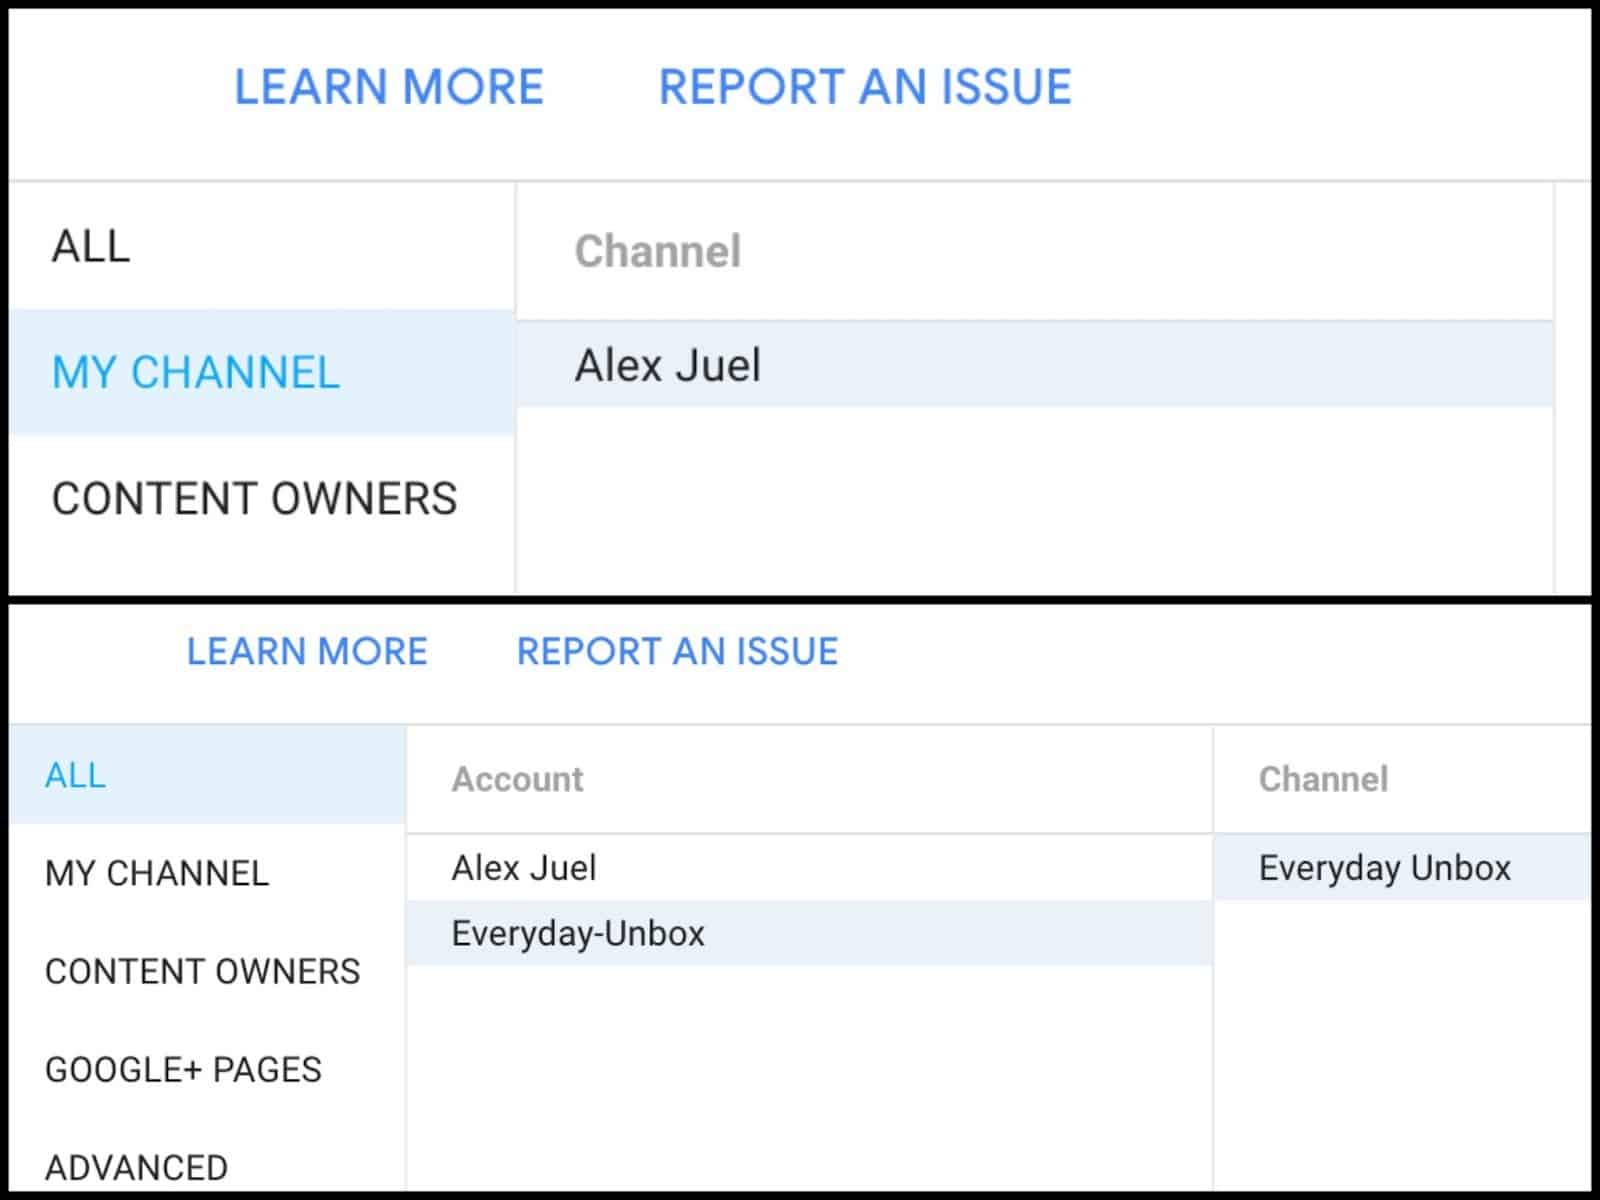
For those creating a report without owning the YouTube account, you may find the account isn’t showing as a source in Data Studio. Don’t worry; there’s a workaround. First, access YouTube Studio settings, navigate to Permissions, and grant Manager permissions to the email associated with your Data Studio. Then, obtain the Channel ID from the YouTube URL, add a YouTube connector in Data Studio, and paste the Channel ID under Advanced settings to access the account.
Using the Data Studio YouTube Analytics template
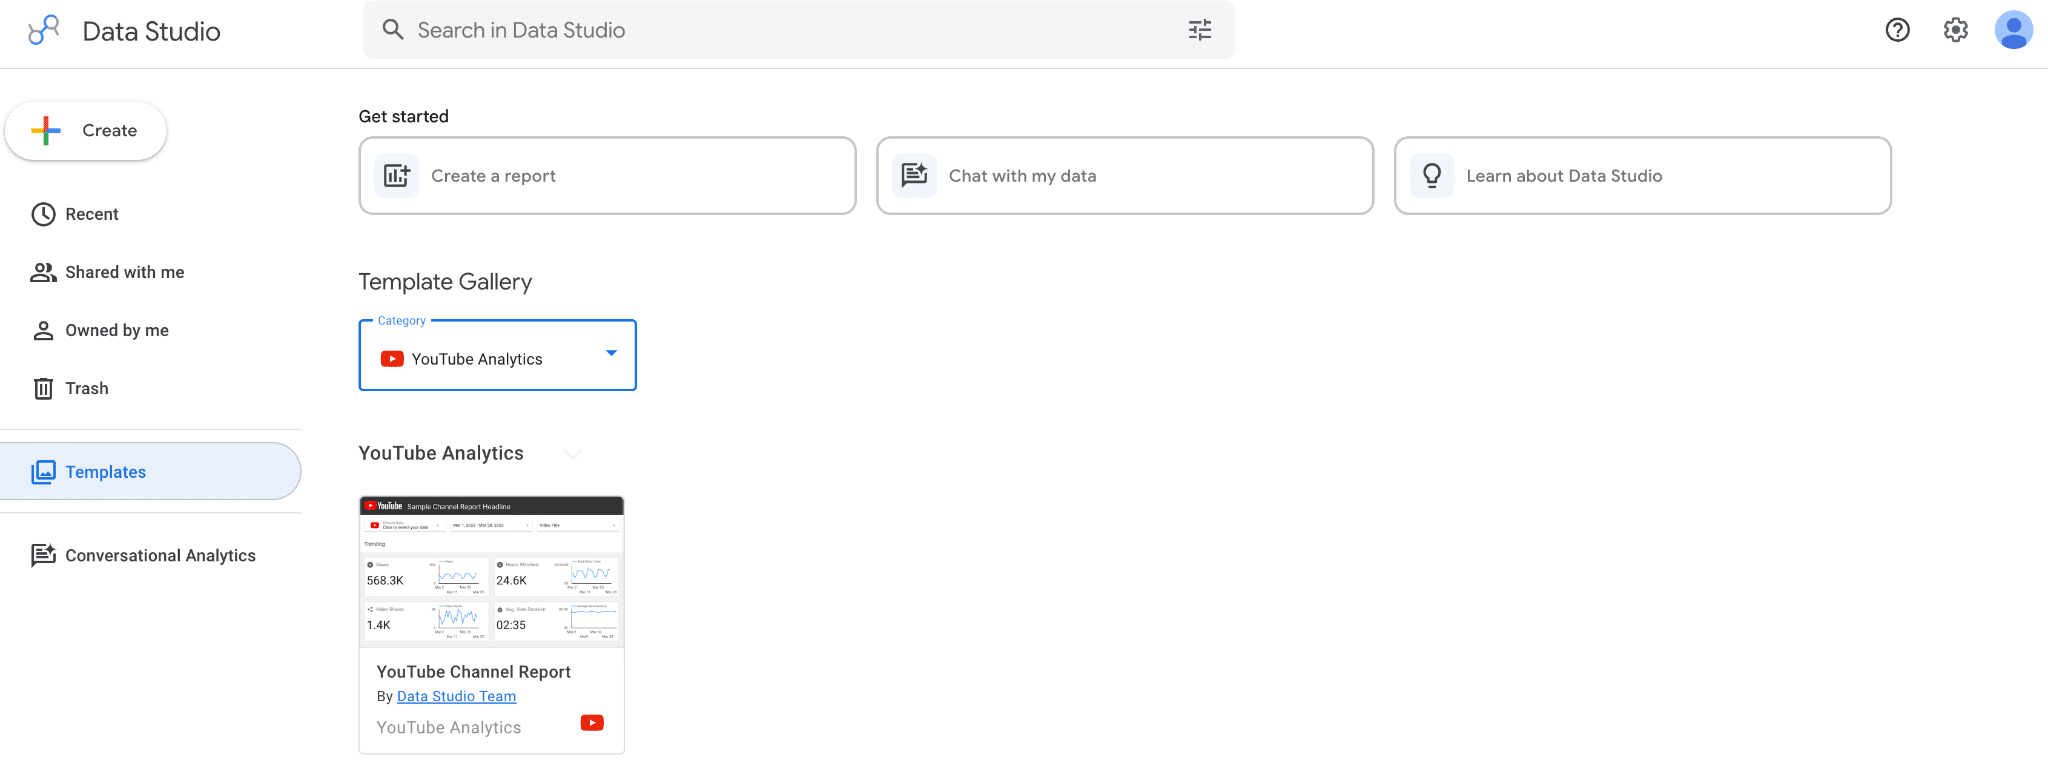
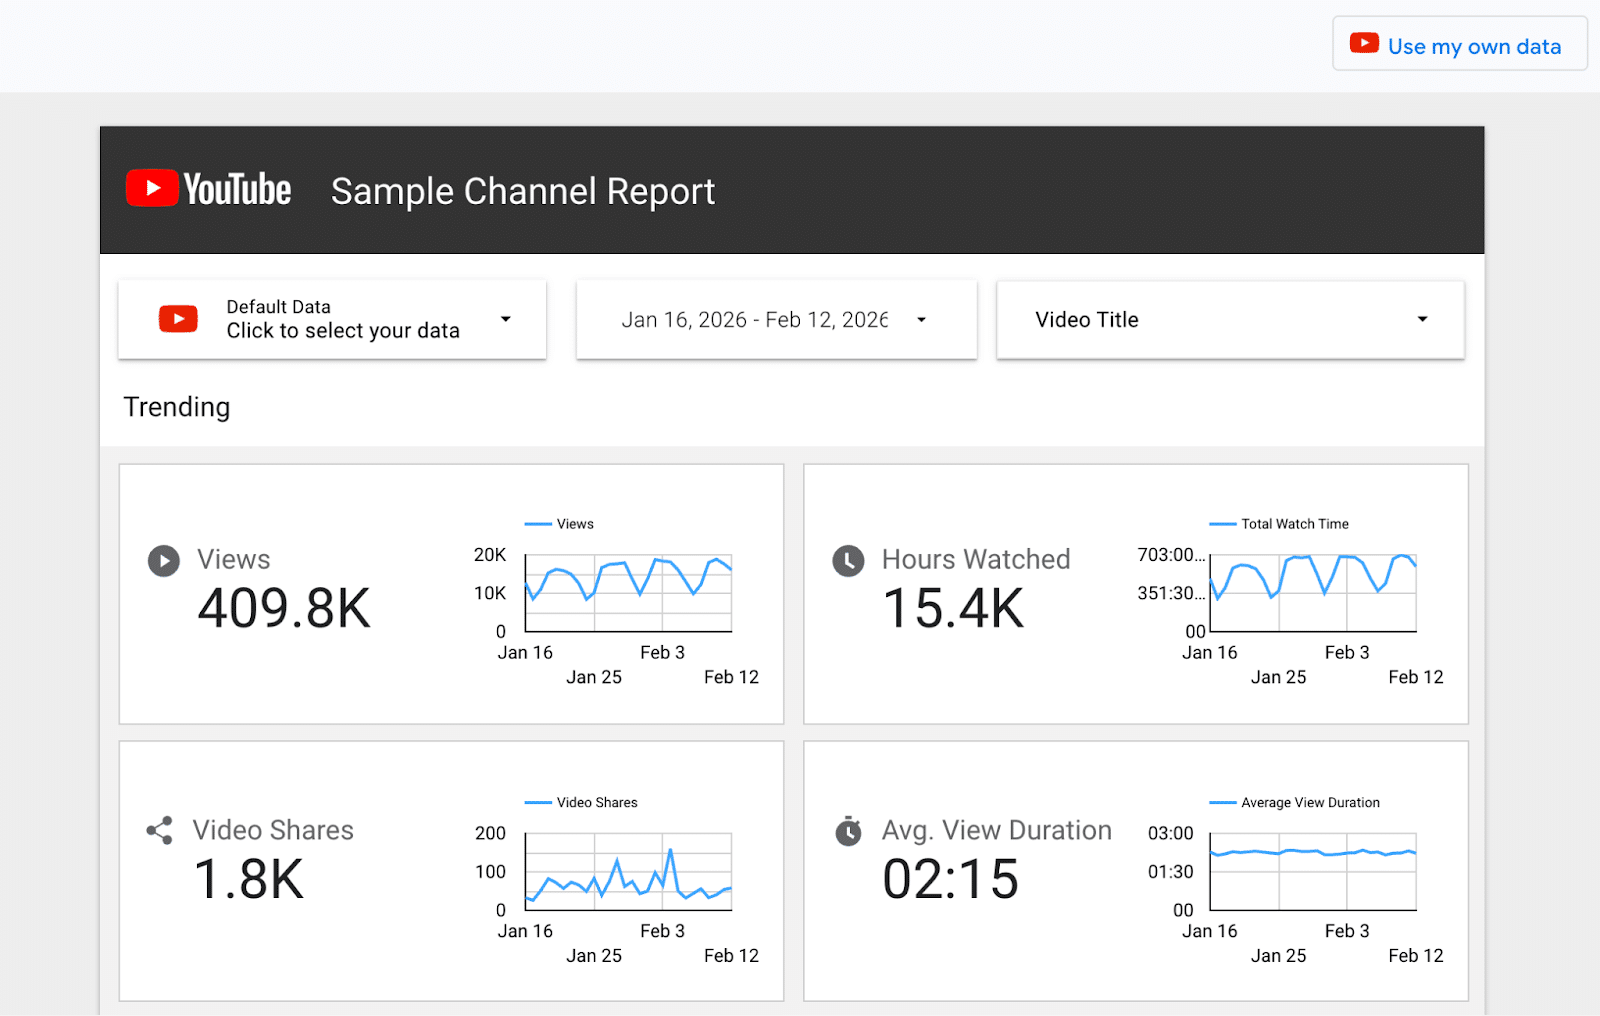
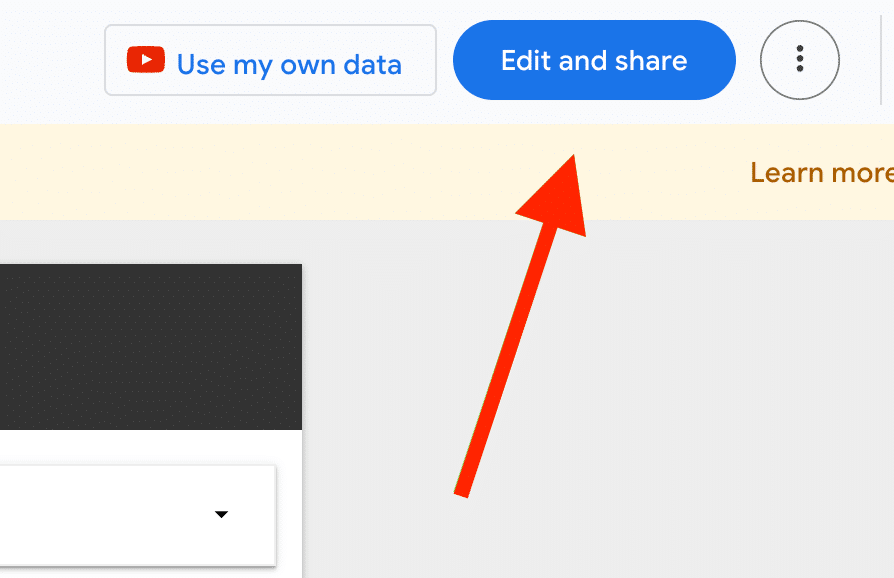
Getting started is simple. On the Data Studio home page, click on Templates followed by Template Gallery. Select YouTube Analytics from the dropdown menu. This template comes preloaded with sample data, which you can replace with your own by clicking “Use my own data.”
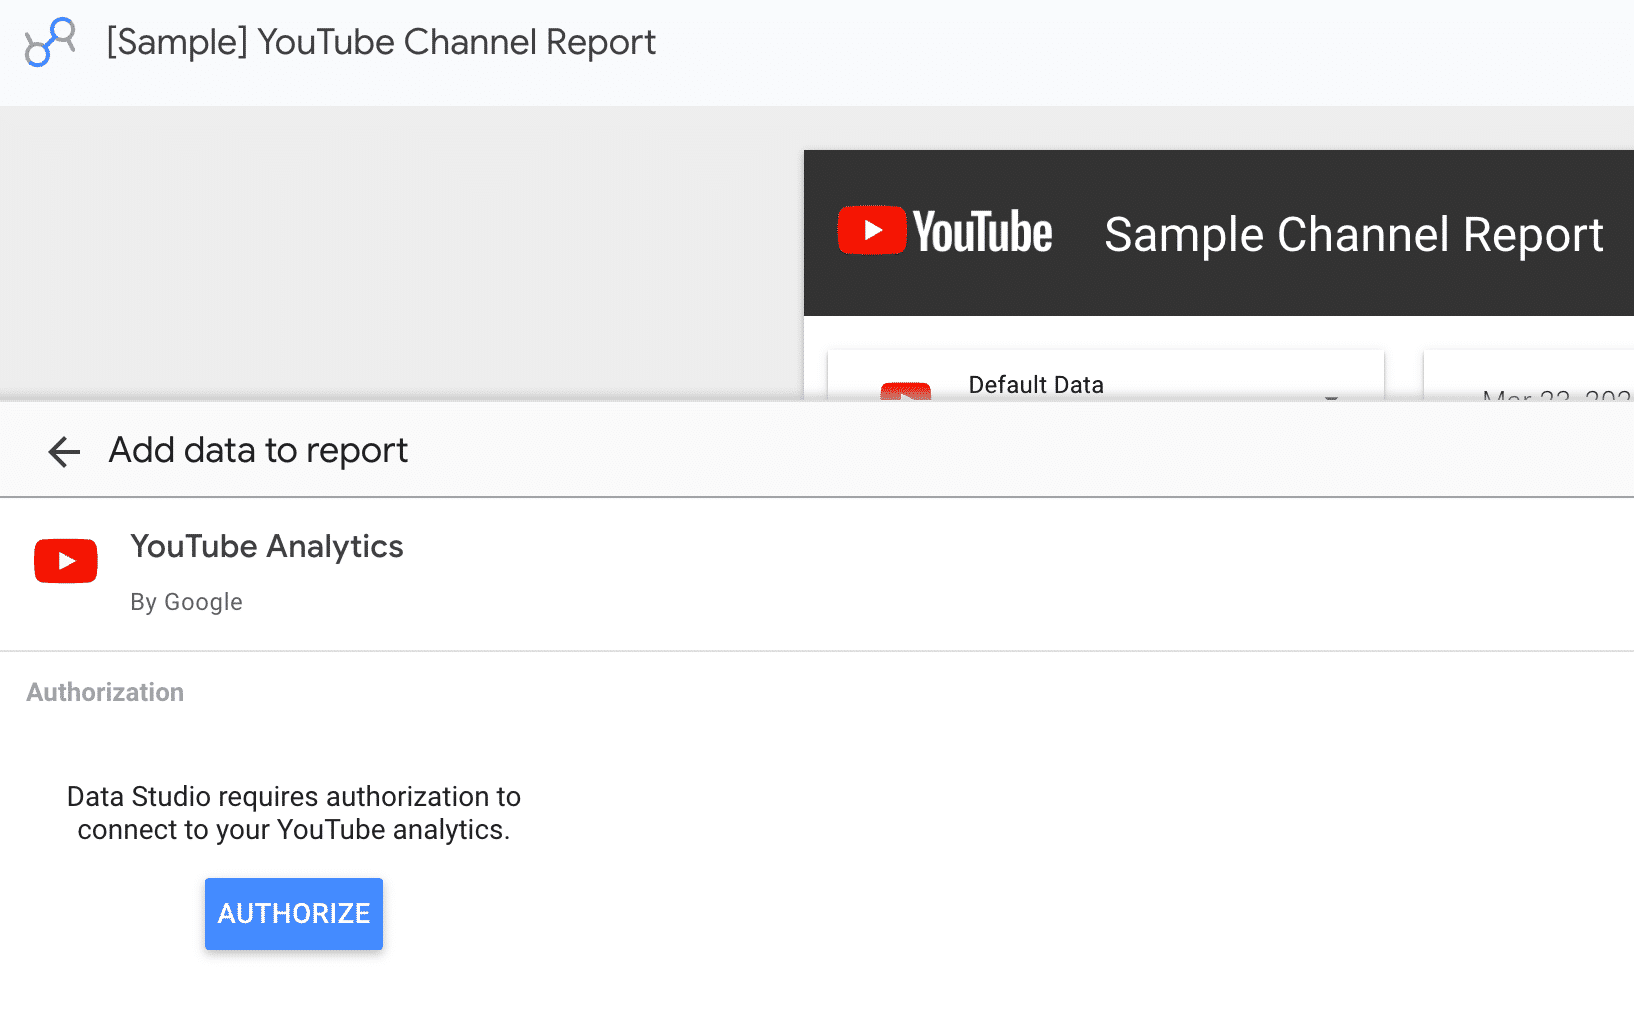
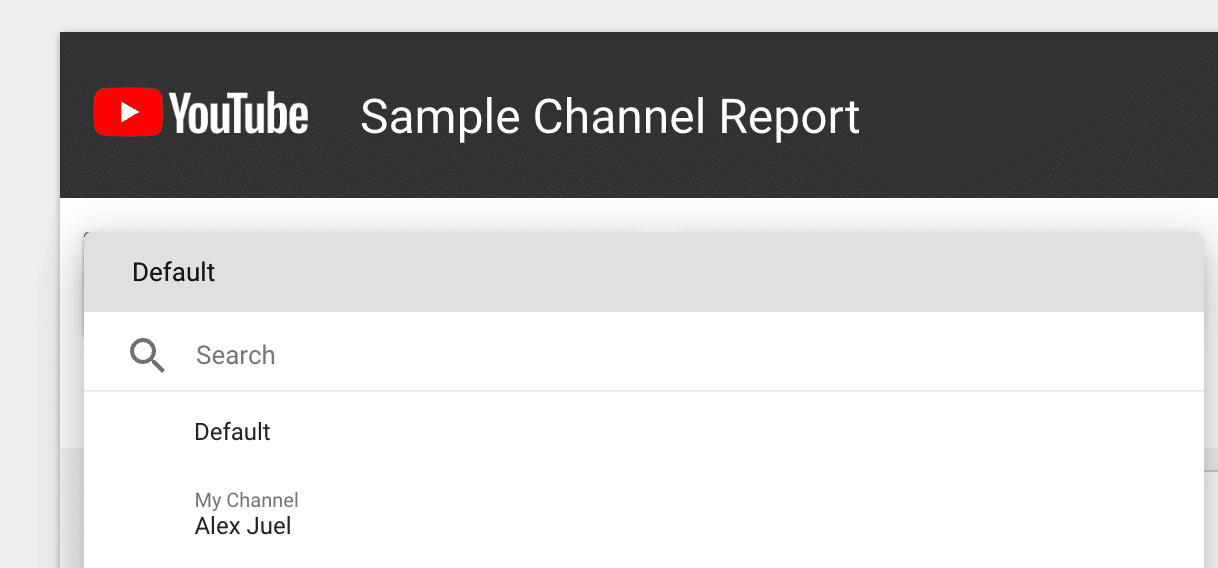
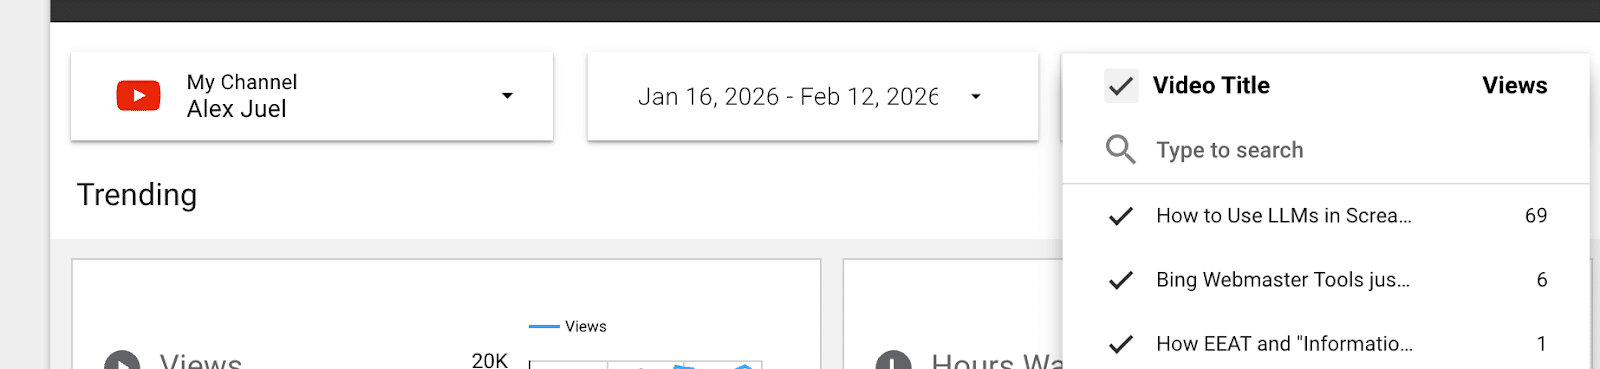
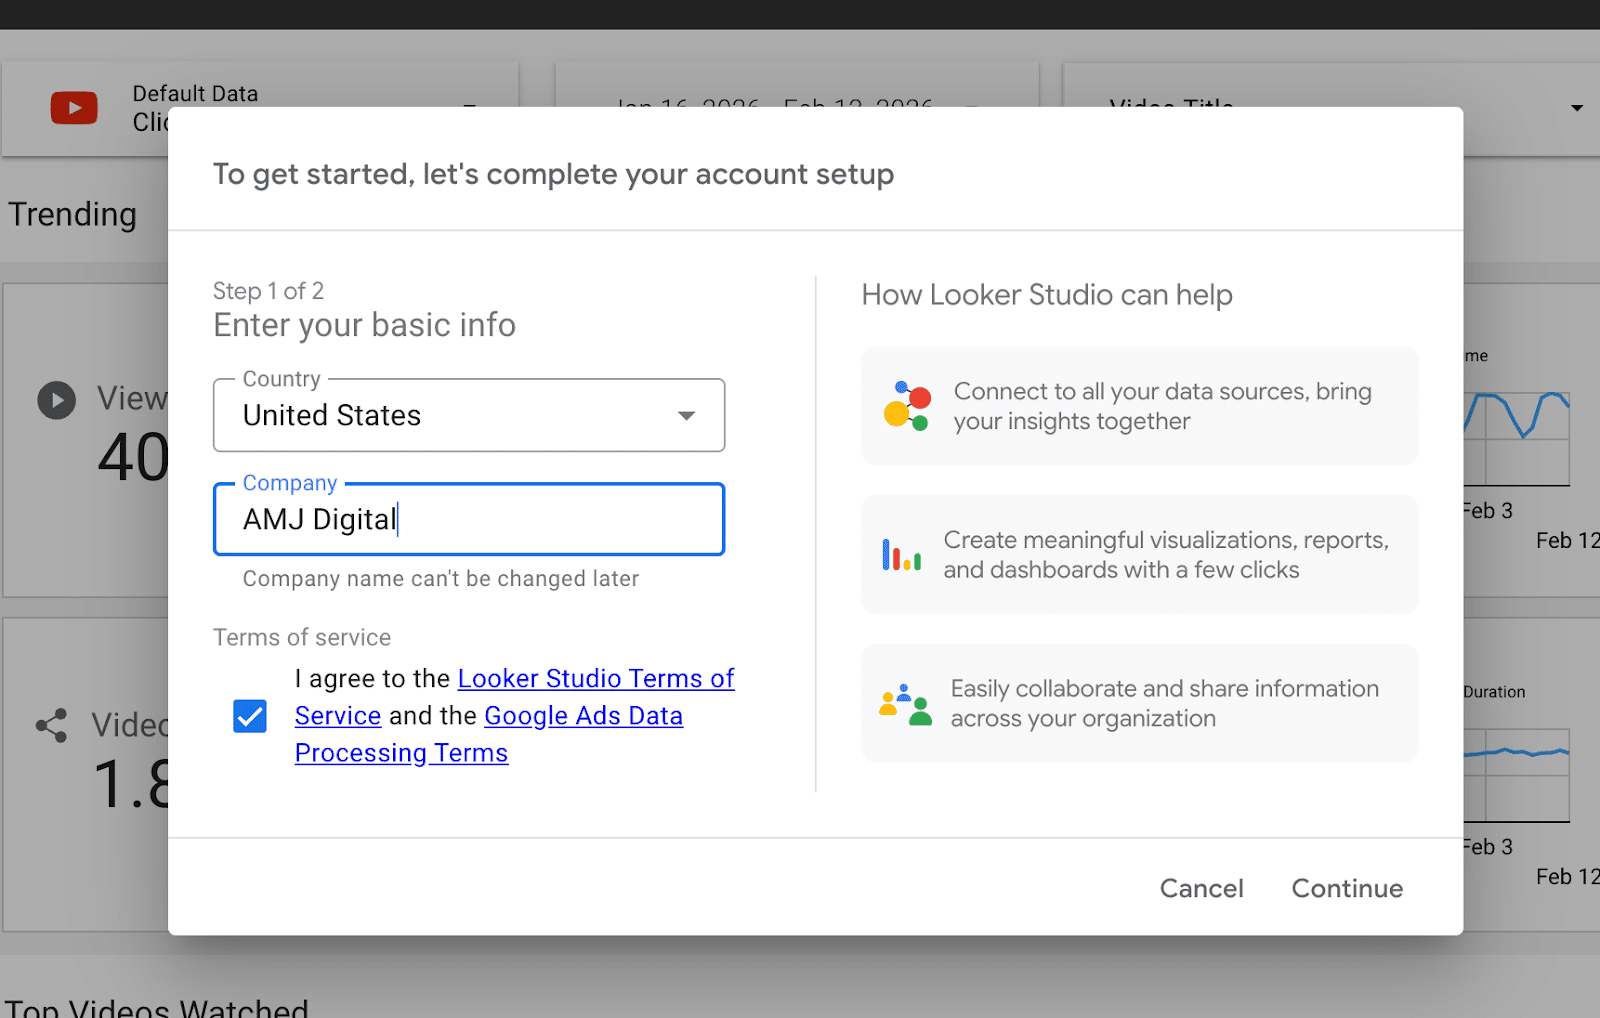
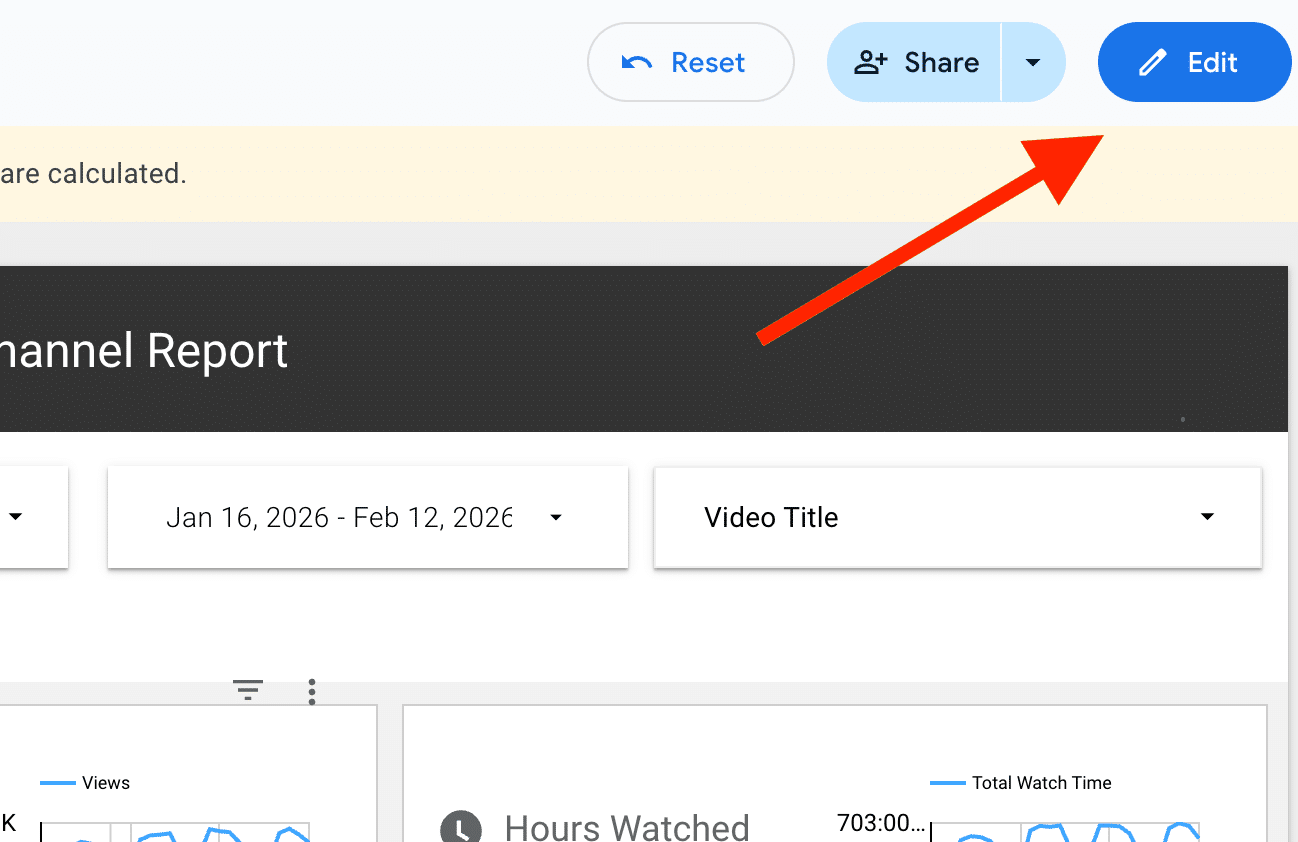
During setup, you’ll need to authorize your data by choosing the connected Google Account. Your YouTube channels will then be selectable from a dropdown menu. Note: the dropdown controls settings, not the charts. To update the charts, use the Edit and Share button, which allows you to adjust data sources and metrics.
Copying a template into an existing report
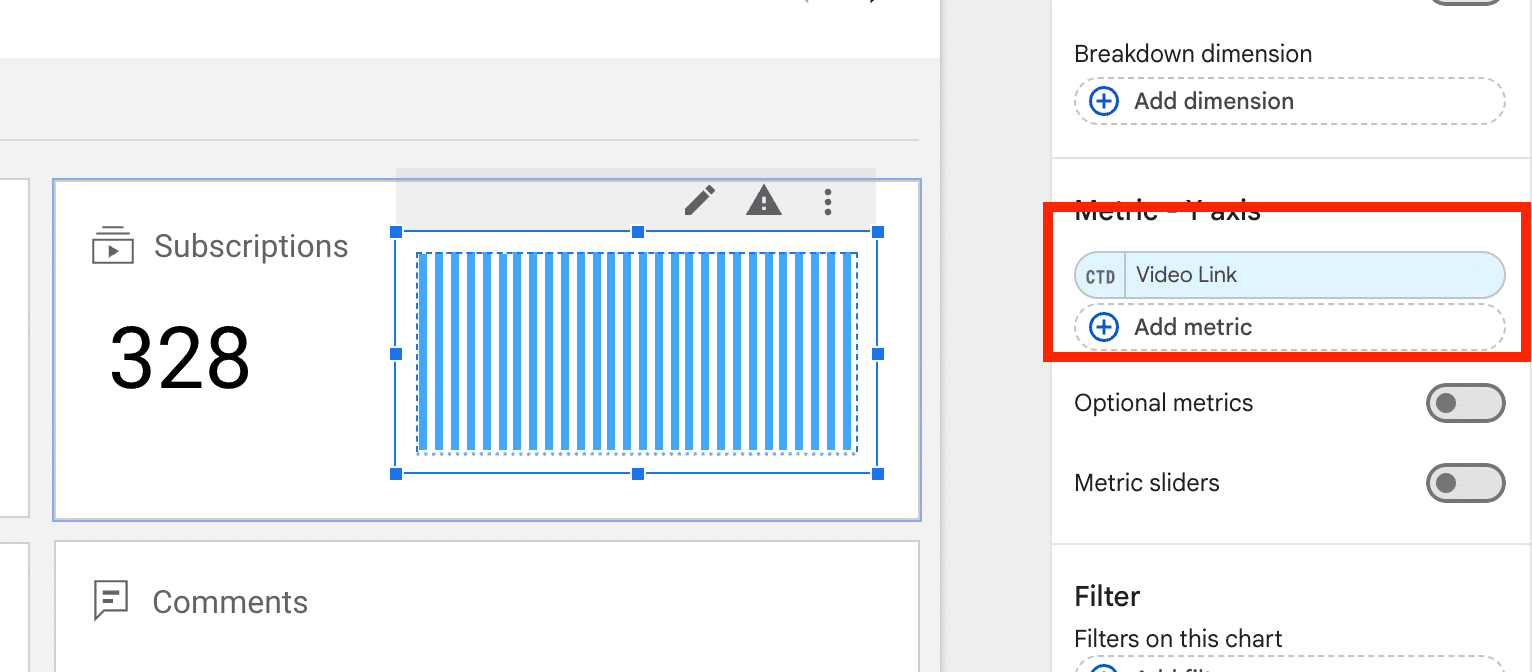
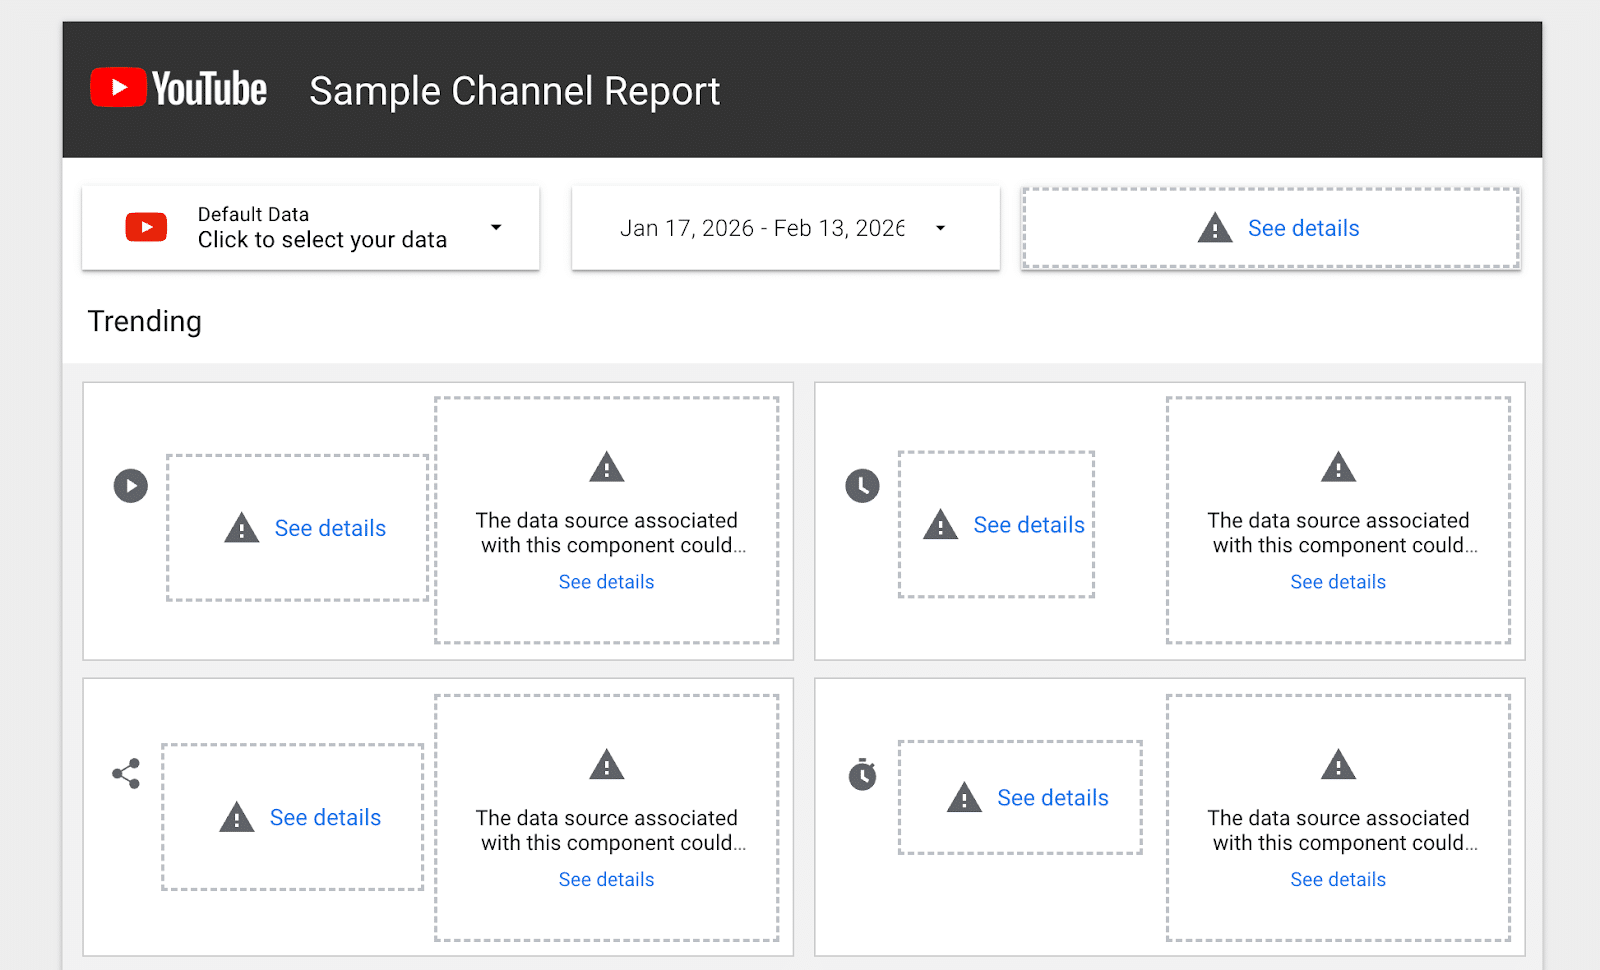
While Data Studio doesn’t directly support importing templates into existing reports, copying a page is an option. After setting up a report with the template, you can transfer it by selecting everything, copying, and then pasting into an existing report’s new page. Although the initial imported charts might show errors, you can reassign the correct data sources using the Properties sidebar.
Customizing your report
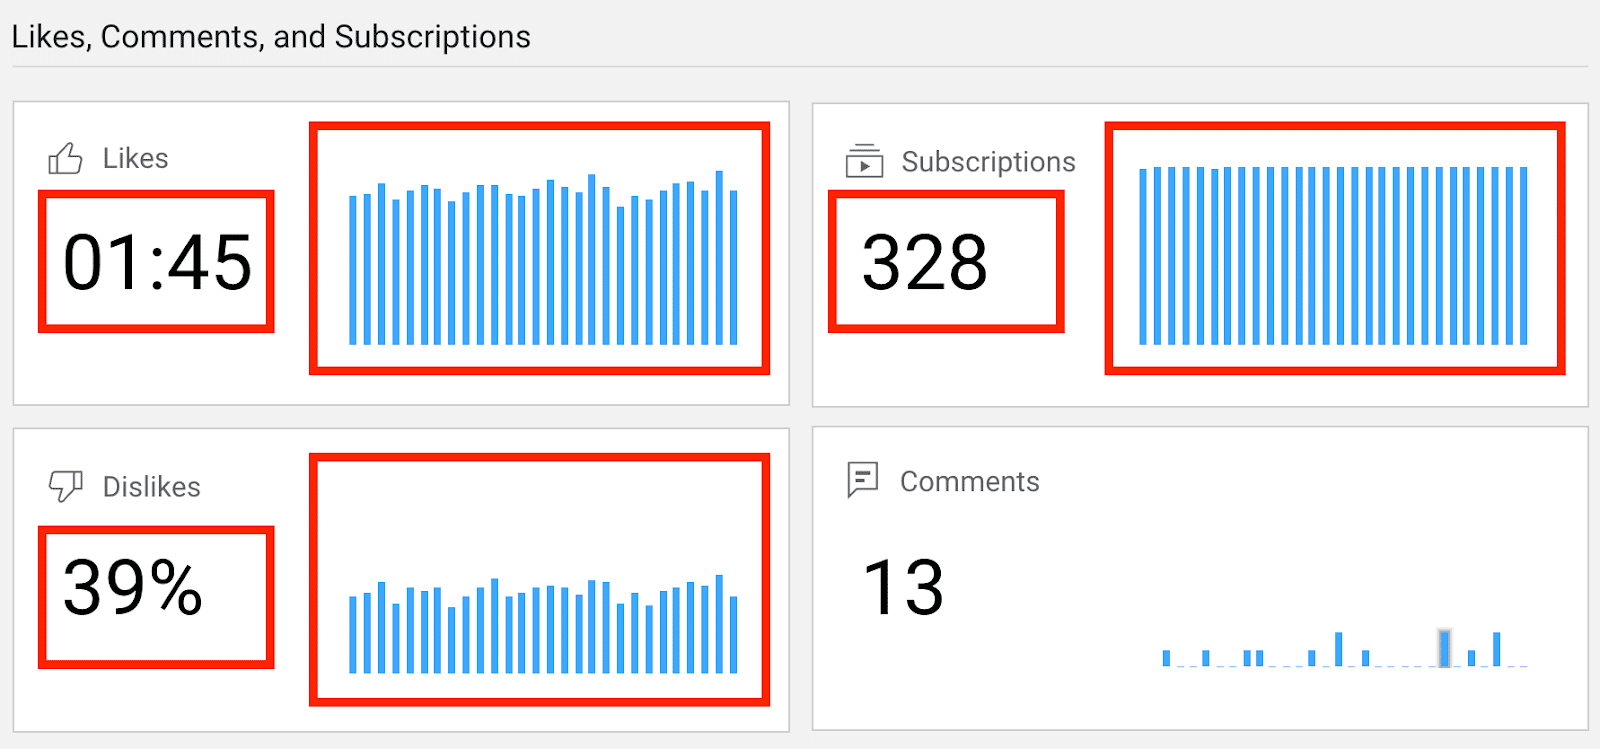
The YouTube template offers a solid starting point, but Data Studio allows for extensive customization. While some metrics like revenue and specific audience insights aren’t available, there’s plenty to explore. Adding new charts involves expanding the canvas and leveraging a variety of metrics and dimensions to tailor reports to specific needs.
By following these steps, we’ve crafted a report that’s both functional and informative, ready for sharing performance insights. Automating report exports as PDFs ensures easy distribution, facilitating informed decisions for all stakeholders.
As I delve into the world of SEO reporting, I realize just how much we’ve outgrown platforms like Data Studio. Let me share what I’ve discovered and the exciting changes on the horizon that promise more efficient workflows powered by AI and APIs.
Imagine this scenario: Our team depends on Data Studio for delivering SEO reports. Just as we’re gearing up for a crucial meeting, Data Studio unexpectedly crashes, leaving us with nothing to showcase. It’s frustratingly common and incredibly embarrassing.
Just last year, I was praising Looker Studio (now Data Studio) for its advantages in SEO reporting. Fast forward, and it seems outdated compared to the dynamic coding tools I’m now utilizing. Here’s why rigid dashboards are holding us back and why transitioning to code-driven SEO reporting is essential.
Data Studio once reigned supreme for customizing SEO reports, but technology advanced, revealing its limitations. From dataset crashes to tedious manual interfaces, let me take you through some challenges I’ve faced with Data Studio.
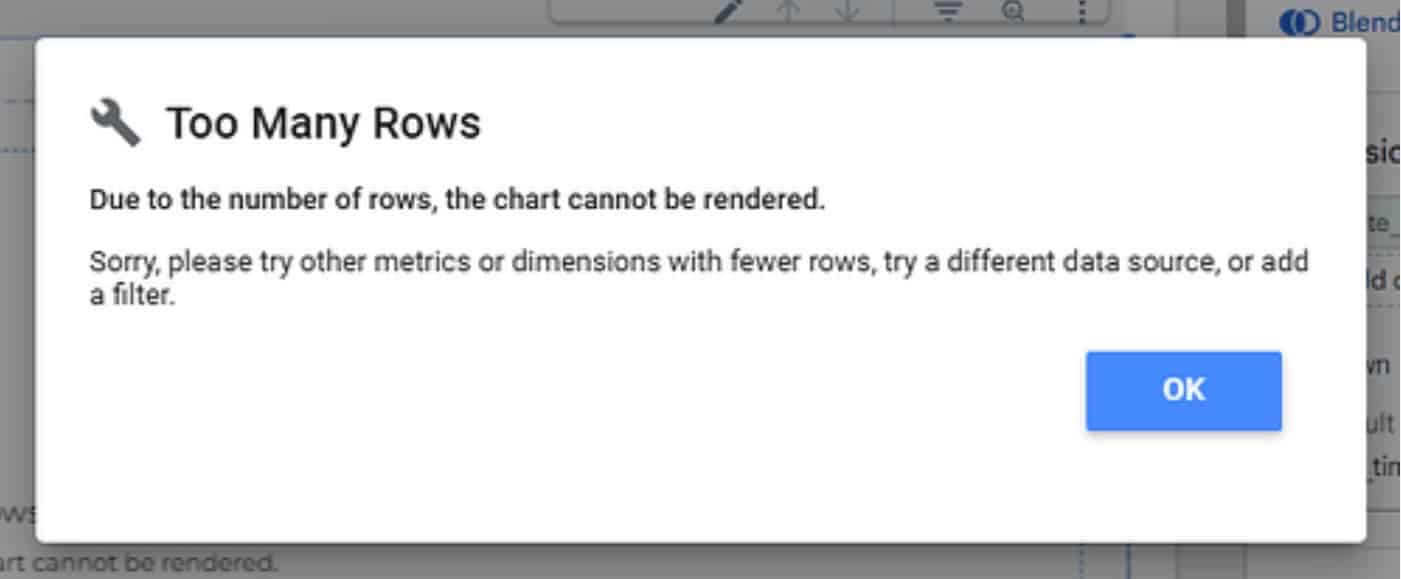
We’re all familiar with the struggle: vast datasets in Data Studio are prone to breaking, often due to the low limits on rows and fields. Hasn’t it been just one too many times when a minor data addition causes everything to crash?
Manual updates in a slow interface make any iteration seem endless. Even the introduction of AI features addresses only a fraction of report-building issues.
Debugging Data Studio reports feels like a never-ending click maze. Unlike code-based systems where agents breeze through files, I’m often left clicking mindlessly within the interface.
Data Studio’s weak API is another stumbling block. It’s representative of Google’s missed opportunities for API-centric platforms. This flaw severely limits external management capabilities.
Despite recent rebranding efforts, these platforms lag behind modern SEO reporting technologies. Let me show you how everything is shifting with AI, APIs, and coding.
The evolution we’re witnessing is astounding. AI-driven coding tools like Claude Code and OpenAI Codex have changed the game. I describe my SEO reporting needs, and these tools take over, executing multi-step workflows efficiently.
Without needing deep coding expertise, I’m able to set up programmatic report workflows from beginning to end. Tools generate code that directly connects to data sources, eliminating reliance on cumbersome dashboard connectors.
Within minutes, comprehensive reports appear as I get accustomed to these tools. Each offers unique advantages, from reasoning to integration speed, transforming manual, rigid processes into infinitely flexible options.
AI coding tools usher in new possibilities for SEO teams by removing barriers between data management and reporting.
Speed is an unmistakable upside. Coding assistants enable SEOs to achieve in hours what once took days, and what took hours, now takes minutes.
Interacting with data directly through coding instead of dashboard interfaces drastically cuts down wait times for refreshes and modifications.
I’m no longer bound by rigid templates. Alongside on-demand data plotting and diverse frameworks, I can tailor reports to perfectly match needs and provide insightful visualizations.
Setting up these tools requires some initial effort but soon transforms the team’s efficiency, offering clearer data constraints and enhanced process transparency.
I’ve discovered how agentic coding assistants can revolutionize real-world SEO applications, from pre-meeting reports to ad hoc stakeholder requests, reducing late-night work and ensuring quick, reliable data access.
AI is reshaping the landscape for all professionals, not just us in SEO. As we adopt this technology, especially in SEO reporting, studies from Stanford and MIT show increased productivity. The shift isn’t optional; it’s imperative.
Teams leveraging AI tools in SEO witness faster iterations and can tackle complex issues more robustly, transforming analysts into strategists with unprecedented capabilities.
Begin this transformation with a small, repeatable project, connect data sources, and slowly expand your use of code-driven reporting. Early adopters are set to lead in SEO efficiency and results.
Traditional SEO reporting tools no longer meet the fast-paced demands of today’s analytics and strategic needs. Through AI and coding, we can leap ahead in reporting accuracy and timeliness, securing a competitive edge.
I recently came across a fascinating discussion at the Adobe Summit, where Alexis Zamkow and Sandhya Ranganathan Iyer from IBM highlighted the urgent need for brands to modify their approach to SEO. As AI revolutionizes the way brands are discovered, IBM has developed a 12-part GEO playbook that every brand should consider to remain visible in AI-generated decisions.
The evolution of search is something I’m experiencing firsthand. AI tools now answer questions, compare products, and recommend brands without users even needing to visit a website. This means that if my brand isn’t included in this AI-generated narrative, I’m potentially out of the picture when decisions are made.
To stay relevant, merely updating tactics won’t suffice. A holistic system, namely a GEO (Generative Engine Optimization) playbook, is key. During their presentation, aptly named ‘Adapt or Disappear: How Brands Win with AI-Powered Search,’ Zamkow and Iyer emphasized this shift.
Embracing the AI Shift: Marketing to Machines
I’ve realized that AI agents now mediate the interaction between me and my customers. They simplify complex markets and often represent my brand to potential customers.
As Zamkow aptly put it, “These machines are disintermediating the brand experience.”
In this new landscape, consumers heavily rely on AI for research and decision-making, businesses are quick to adopt AI solutions, and many searches conclude without any clicks.
Zamkow estimates that in the next couple of years, AI agents could account for 75% of search visibility, highlighting the importance of being included in the AI-generated answers themselves.
The GEO Playbook: 12 Essential Components
To navigate this shift, the speakers unveiled a 12-part playbook focusing on content, technology, and operations. It starts with creating a strategic content foundation which ensures that my messaging is clear and consistent across all platforms, building trust for both users and machines.
Ensuring my content meets retrieval-grade passage standards is crucial. Since AI extracts answers rather than ranking webpages, content clarity is key. I need to present information in concise, easy-to-understand sections.
Technical foundations can’t be ignored. It’s essential that my content is machine-readable with clean HTML, structured data, and pages that load content directly to maximize AI extraction.
I started by optimizing my on-site search to align with GenAI, making sure it can easily find relevant answers — a foundation for external AI search visibility.
Equally important is the AI search citation qualification model. Not just being mentioned, but cited by AI, boosts trust and credibility through consistent messaging and recognized expertise.
Through extraction optimization, I ensure my content is structured and rich in context to be easily pulled by AI tools.
Understanding that 85% of mentions come from external domains, I focus on a third-party strategy involving content mentioned across platforms like Reddit and social media, recognizing that PR and social teams are critical for search success.
Tracking new KPIs, such as AI mention frequency and citation locations, becomes essential, shifting my focus from mere traffic to AI recommendations.
I implement SOPs to maintain consistency in how my content is written, structured, and published, preventing confusion for AI systems.
With searches becoming conversational, I adopt prompting best practices, crafting content that aligns with users describing their queries in a more natural way.
Managing change across the entire organization involves training, goal alignment, and breaking down silos, emphasizing that this evolution is more than a marketing update; it’s transformational.
Continuous governance and versioning are critical. AI and competitor content change rapidly, making it vital to monitor, update, and maintain ownership of content changes.
From SEO Tactics to Comprehensive GEO Systems
We’re moving beyond traditional SEO, transitioning from keywords to prompts, links to citations, and from traffic-based metrics to validating our presence in AI answers. Importantly, it’s about building a system to continuously supply AI with accurate information.
A Leadership Issue
This transformation is rapidly becoming a leadership concern. As shared by Zamkow, this is no longer solely a matter for the SEO team; it’s a priority for CEOs, who need to recognize the importance of brand visibility in AI-based recommendations.
Adapt or Disappear
The AI-driven world is reshaping brand discovery. It’s trusted by consumers, utilized by businesses, and expanding quickly. Brands prepared with a comprehensive GEO playbook are poised to maintain visibility, while others risk being invisible in the digital landscape.
As someone deeply immersed in the world of SEO and content creation, I’ve seen firsthand how the landscape has shifted in 2026. It’s no longer just about racking up page views and clicks; brand awareness has become the star of the show. The game has evolved with the rise of multimodal search, and I’m excited to share how we can adapt to meet audiences wherever they are.
AI platforms are now a crucial traffic source that publishers like us must embrace. If we’re to stay relevant, we must engage with Google’s AI Overviews, chatbots, and other emerging technologies. Thankfully, utility news content still plays an essential role in connecting with audience needs.
So, what exactly is utility news content? It’s service journalism designed to provide simple, straightforward answers to top-line questions. Answer engine optimization (AEO) is a similar concept that’s gainign traction, encouraging readers to reflect on what a topic means and how it applies to their lives.
We must remember, simplicity is not stupidity. It’s about listening to the audience and crafting content that resonates. Gone are the days of setting evergreen content and forgetting it. Today’s strategies require more engagement.
To harness the full potential of utility news content, it’s vital to plan for evergreen targets with trend forecasting, track news closely, refresh explainers, create new content where gaps exist, and recirculate resources appropriately. Tracking performance and consolidating articles into libraries for review is also key.
Examples of traditional utility news content include checklists, FAQs, and “Everything to know about” guides. These formats prove that simple, straightforward content serves readers well by addressing their needs during critical windows.
During my time as SEO Director at ESPN, I led initiatives that put fan-forward queries at the forefront. This taught me valuable lessons in making utility content shine in a newsroom environment.
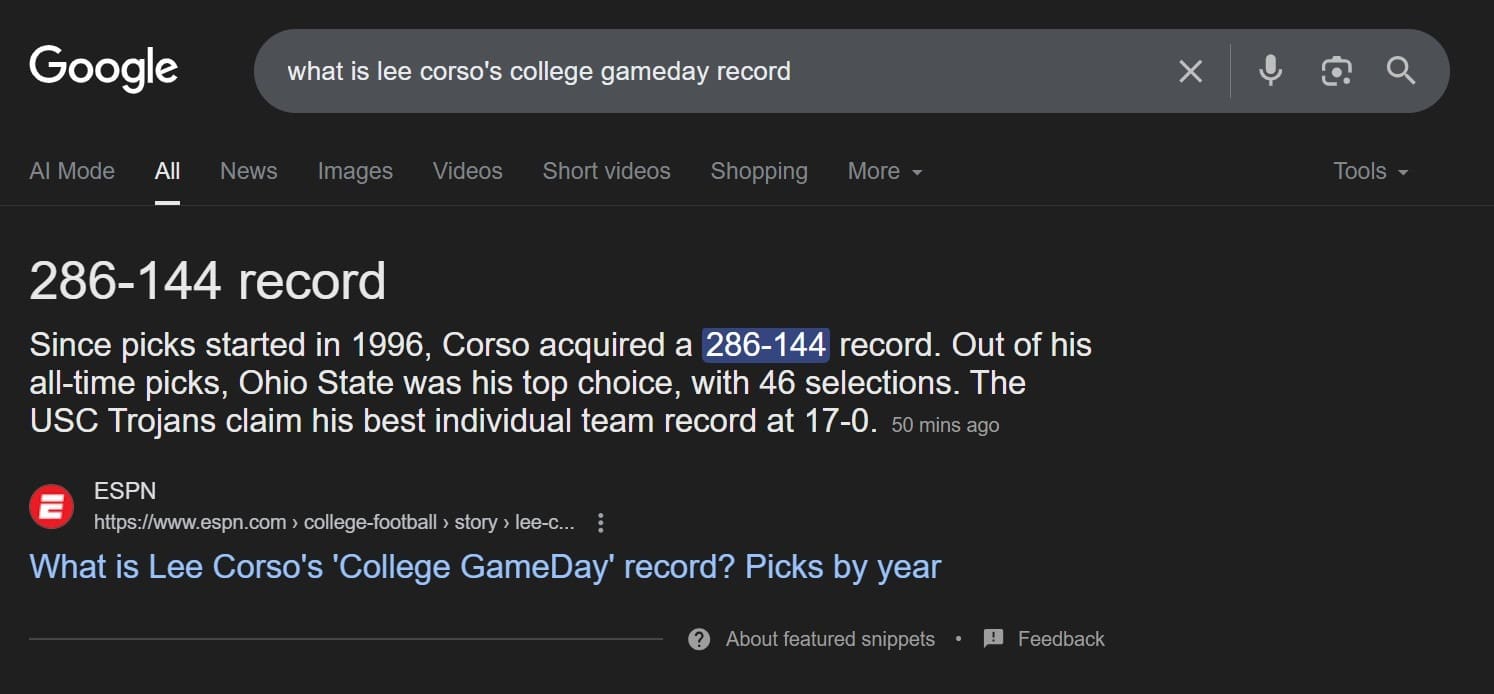
Lee Corso's impressive College GameDay record stands at 286-144, highlighting his expertise in game predictions since 1996.
In today’s world of zero-click search, some worry that service journalism may not seem as valuable. However, it’s not just about traffic—our responsibility is to provide accurate, credible information.
Performance metrics have shifted to emphasize overall brand visibility alongside page views and clicks. In 2026, search strategists need to focus on AI Overview placements, featured snippets, and other forms of visibility to ensure success.
Personalization features are becoming more prominent, and they offer publishers an opportunity to strengthen brand loyalty. By guiding readers to select your brand as a preferred source, you can enhance your visibility and engagement.
In summary, utility news content still wins by prioritizing audience needs and evolving in step with technological advancements. Let’s stay committed to delivering accurate and engaging information as the future unfolds.
I first got into SEO not because I had a crystal ball, but because I had no other choice. Back in the early 2000s, I was part of a small web business with my mom in Seattle. We once hired another company for SEO work, but when we couldn’t afford to continue, I found myself diving into search marketing.
Fast forward more than 20 years, and here I am, one of the loudest voices in SEO, and admittedly, one of Google’s fiercest critics. In a recent interview, I took a deep dive into how search has evolved, what’s gone astray, and what the future might hold.
Early SEO was a wild ride. The digital landscape today may seem convoluted, but nothing beats the chaos of the early days. It was a time ruled by forums like WebmasterWorld and Search Engine Watch, where people shared tactics rather openly. Risky as it was, buying links was common and effective—myself included. However, a public reprimand from Google’s Matt Cutts was a turning point for me, steering my focus towards ‘white hat’ practices aligned with Google’s guidelines.
Over time, I’ve begun to question if following those guidelines perhaps went too far, given Google’s own evolving practices. Yet, what continues to stand out from the early industry days are not just the tactics but the relationships I’ve built.
Many attribute AI as the seismic shift in search, but I beg to differ. It all started around 2011 when ‘zero-click search’ emerged—Google began answering queries directly on the results page. Initial features were simple, like weather boxes, but the concept expanded significantly with time.
Indeed, by around 2016–2017, nearly half of all searches ended without a click, growing to more than two-thirds today. This trend didn’t just appear out of nowhere with AI; it’s been brewing for over a decade.
I reckon publishers had a missed chance to take action long ago. At that time, media conglomerates could have united to challenge Google’s growing dominance, perhaps by demanding compensation or limiting usage of their content. Instead, they let Google expand its reach unhindered.
The publishing industry missed a window, but adaptation is key now. It’s time to pivot towards creating subscription businesses and monetizing attention rather than just traffic, as demonstrated by companies like The New York Times.
As for Google, I don’t believe its search services have worsened for users, though it’s become increasingly tough for publishers and creators. As Google grew and went public, priorities shifted, succumbing to growth and revenue pressures, thus becoming aligned with investor expectations.
When it comes to AI, I see a common misconception. People often mistake AI’s outputs as solid and consistent, akin to search results, but that’s rarely the case. Answers can vary widely. I recommend not relying on a single response; instead, ask multiple times and look for consistencies.
Reflecting on the early days of SEO, I don’t yearn for any specific tactic, but I do miss the opportunities for smaller creators and independent sites. Back then, traffic wasn’t just for the giants—it was more democratically distributed.
As I look forward, I imagine the media and search landscape might mirror the past: A few powerful platforms dictating the flow of information while individuals continue to create content within their domains. And yet, I’m hopeful the web will continue to evolve.
I recently discovered that back in December, Google introduced read more links for certain search result snippets on Google Search. Now, Google has shared some best practices to help us utilize these ‘Read More’ links effectively.
Digging into the Best Practices: To find these new insights, you can check out the documentation posted here. It outlines three essential tips:
Ensure the content is instantly visible to human visitors, not tucked away behind tabs or expandable sections.
Avoid using JavaScript that governs the user’s scroll position as the page loads. Let your users control their browsing experience.
If you’re calling history API functions or modifying window.location.hash on page load, don’t strip away the hash fragment. This could lead to issues with deep linking.
Visualizing the Concept: Google provided an image illustrating these links. Here’s a glimpse of how they appear:
Let me show you an example of these snippets in action:
Why It Matters to Us: The introduction of read more links adds an alluring touch to search result snippets. The potential for increased website clicks can be significant. Therefore, reviewing these best practices becomes essential for attracting even more visitors to our site.
Ultimately, driving more traffic is always a win, so optimizing your site with these tips could prove beneficial.
When I first analyzed my client’s website, I collected all performance data, pinpointed the successes, identified areas for improvement, and laid out my recommendations. However, transitioning this data into a compelling and trustworthy presentation required more than just numbers—it needed a narrative.
Storytelling proved to be the key. It is not solely for entertainment but is a fundamental tool for making sense of data, making it indispensable for effectively presenting insights.
One framework I found remarkably effective is the classic three-act structure, famously applied in everything from Aristotle’s Poetics to modern blockbusters like Star Wars.
This three-act structure allows me to guide my client’s journey from initial insights to actionable conclusions, positioning them as the story’s hero who overcomes challenges.
It’s similar to a narrative arc, but segregated neatly into three parts: the setup, the confrontation, and the resolution.
Act 1 sets the stage, spotlighting the status quo and the emerging challenge—the antagonist to our protagonist, the client.
Act 2 introduces rising action as conflicts and obstacles emerge, demanding strategies to navigate them.
Act 3 brings the climax and resolution, depicting how the applied strategies overcome obstacles and pave the path for future success.
This method offers a deeper understanding of data and transforms mere analysis into a strategic journey that places the client at its heart.
In essence, embracing the three-act structure for data storytelling fosters transparency and cooperation, aligning our goals with those of our clients for mutual success.
Step 1 involves revisiting past strategies and successes to establish the baseline of Act 1.
Step 2 follows suit by dissecting current challenges, mirroring the conflict escalation of Act 2.
Finally, Step 3 proposes solutions that serve as the resolution in Act 3, captaining the client’s progression towards their goals.
Imagine carving the path of this narrative like charting a hero’s journey. With every data set unfolds a chapter where I play the guide, bridging insights with impactful actions.
But just as with any story, reaching our conclusion doesn’t signify the end. It marks the dawn of new strategies, fresh collaborations, and continued growth.
This is how I not only deliver insights but foster trust and clarity in my partnerships, ensuring that both the successes and challenges of data transform into a compelling narrative.
Traffic from Google searches is declining, and I know it firsthand because I’ve invested years in organic strategies. Seeing this shift in real-time is unsettling but also enlightening.
I’ve observed this change particularly in my SaaS clients. The educational, top-of-funnel (TOFU) content that once consistently drew traffic is losing steam. This isn’t due to declining quality; users simply don’t need to click anymore. AI Overviews are handling their queries.
This led me to a crucial choice: defend the old strategy or adapt to the new landscape. I decided to adapt.
Surprisingly, while informational content is getting fewer clicks, bottom-of-funnel (BOFU) content is not only steady but often driving more qualified leads.
This shift signifies a new understanding of value creation through search.
The pivot: Making BOFU the priority
My new approach focuses 60% to 80% of my efforts on bottom- and mid-funnel content. The rest fills in gaps with TOFU topics, supporting content clusters and timely industry discussions.
When I proposed this change to clients, I put it plainly:
“You can choose between traffic and leads. If leads are your goal, here’s our path, though it may mean less traffic.”
I was transparent that traffic might dip, but conversions would likely increase. Clients saw the appeal of a qualified pipeline over mere traffic.
Comprehensive comparison guides and listicles aimed at high-intent queries are highly effective BOFU content.
Take, for example, a guide on the best time-tracking software for construction. I created a reusable review methodology for the client, addressing pros and cons transparently, including their product. This honesty builds trust with evaluating readers.
The guide was factual, precise, and targeted at decision-makers in the purchasing phase, not casual browsers.
In weeks, it became our most referenced article in LLM responses. Now a cornerstone piece, it often appears in conversion pathways, driving qualified leads.
That single piece outperformed a dozen previous informational posts in pipeline impact because it directly answers a buyer’s question.
Many SEOs see this as a binary choice. But I haven’t abandoned TOFU content; I’ve simply repositioned it.
TOFU now builds topical authority, supporting the ranking of BOFU pages. It’s the structure beneath the main act. Guides and educational content should:
Support content clusters.
Establish expertise in Google’s eyes.
Pass link equity to BOFU pages.
We’ve revised top-performing TOFU pieces to connect directly to clients’ products, supported by screenshots and expert insights.
Calls to action were redesigned for context and strategically placed throughout the content, not just at the end.
These changes significantly increased visitor engagement with demo request pages, without altering the informational purpose.
The key is still producing valuable TOFU content but ensuring it has a unique perspective—something fresh and insightful.
Specificity in a sea of AI-generated content sets us apart.
Why this strategy excels in AI-driven search
Visitors from AI platforms arrive informed and ready to weigh options. This aligns with how AI Overviews serve search results.
AI Overviews are more frequent for informational than commercial queries. E-commerce searches trigger them less, safeguarding BOFU content for now, though commercial coverage is growing.
This change in behavior modifies what content performs well. As informational value diminishes with upfront answers, decision-stage content gains importance, aiding users in comparison and validation.
That’s why BOFU content thrives; it matches users’ decision-making phase, not just their search.
The time tracking software comparison piece is a prime example. It often appears in discussions on construction time tracking tools. While it might not always convert instantly, its impact is evident in branded searches and lead generation.
The attribution challenge to embrace
Here’s the dilemma: BOFU content’s true value often isn’t reflected in traditional analytics.
When someone discovers your solution via an AI response, then proceeds via direct or branded search to convert, it often appears as direct traffic in GA4, masking SEO’s role.
Therefore, I’ve guided clients to emphasize broader performance metrics, including:
Trends in brand search volume.
Citation frequency in LLM platforms.
Increases in direct traffic post-publication.
Conversions even with stable traffic levels.
The ROI of BOFU and LLM-focused content exceeds dashboard insights. Relying solely on immediate click metrics misses SEO’s true value creation.
Your playbook for transitioning to BOFU
Here’s a practical guide to capitalizing on this shift:
Audit for BOFU gaps: Identify purchase-stage queries lacking coverage. These high-intent gaps offer quick opportunities.
Create comparison content: Use a consistent review framework, openly address pros and cons for credibility and citations.
Enhance leading TOFU articles: Incorporate product links, contextual CTAs, and expert testimony for dual-purpose content.
Set up LLM tracking in GA4: Use regex segments to track AI referrer traffic and gain insights often overlooked.
Refocus client metrics dialogue: Shift focus from traffic to lead quality and conversion rates, reflecting modern SEO’s impact.
AI Overviews have reshaped informational content economics.
This disruption opens strategic doors. BOFU content traditionally converts better, and AI highlights the need to focus on content that drives revenue rather than mere site visits.
The opportunity for strategic realignment is here, but it won’t last indefinitely.





![```json
{
"alt": "Menu options in a [Sample] YouTube Channel Report interface, highlighting 'Current page settings'.",
"caption": "Navigating through a [Sample] YouTube Channel Report, the 'Page' menu option is highlighted, focusing on 'Current page settings'.",
"description": "This image shows a dropdown menu within a [Sample] YouTube Channel Report interface. The 'Page' menu is opened, highlighting 'Current page settings' in red, indicating it as a selected option. Options like 'New page', 'Duplicate page', and others are visible. The interface appears to be part of a reporting tool for YouTube channels, used for managing and customizing report pages."
}
```](https://crushpress.ai/wp-content/uploads/2026/04/gap-69e792797170b.png)