Month: February 2026

  • How to Measure SEO Performance in AI-Driven Discovery

    How to Measure SEO Performance in AI-Driven Discovery

    Your organic sessions are down, AI-generated answers are absorbing more of the discovery journey, and your dashboard still expects traffic to explain whether SEO is working. If you answer with average position or a sitewide traffic total, you can make a healthy program look weak—or celebrate visibility that never becomes demand.

    The answer isn’t to replace one vanity metric with a count of AI mentions. You need a measurement chain that connects search visibility, AI citations, brand recommendations and commercial outcomes. That chain reveals influence that can occur without a click while keeping pipeline and revenue at the center of the scorecard.

    Key takeaways

    • Keep traffic, impressions and rankings, but segment them by topic, intent and business value before using them to judge performance.
    • Measure AI visibility across prompt variations, platforms and collection windows. A favorable answer from one prompt is an observation, not a trend.
    • Track citations, mentions and recommendations separately. They represent different levels of influence.
    • Pair recommendation rate with recommendation share: one measures how often you are recommended, while the other measures how much competitive recommendation space you occupy.
    • Connect the same topic taxonomy to landing pages, conversions and CRM outcomes so the AI visibility report can support an actual decision.

    Measure five links between retrieval and revenue

    Five connected visual stages show web visibility, retrieval, AI citations, brand consideration, and a commercial outcome.

    Traditional SEO reporting often jumps from ranking to traffic and then to conversion. AI-driven discovery adds several decisions between those stages. A system may have access to your page, use it as evidence, mention your brand, or actively recommend you. Those events are not interchangeable: being available, being cited and being recommended are distinct levels of visibility.

    Measurement stageQuestion it answersUseful measuresCommon misreading
    AvailabilityCan search and AI systems find a relevant page?Indexation, topic-level organic visibility, impressions and SERP coverageAssuming an indexed or highly ranked page must appear in an AI answer
    CitationIs your domain selected as evidence?Domain citation rate and citation consistency by topicTreating every citation as a brand endorsement
    MentionDoes the response include your brand?Brand mention rate, context and accuracyCounting neutral or negative mentions as recommendations
    RecommendationIs your brand presented as a suitable choice?Recommendation rate, recommendation share and consistencyCelebrating one favorable response as durable visibility
    OutcomeDoes discovery contribute to valuable demand?Qualified conversions, customers, pipeline and revenue by topic or landing pageUsing last-click attribution as the complete customer journey

    This framework prevents a particularly costly reporting error. If an answer cites your page but recommends a competitor, your content won the evidence-selection step while your brand lost the choice step. More citations alone won’t tell you why.

    Use a response cell as the basic unit of measurement: one prompt variant, on one platform, in one recorded run. Store failed or incomplete runs separately rather than coding them as brand absences. From those cells, calculate:

    • Mention rate: response cells that mention your brand divided by all valid response cells.
    • Citation rate: response cells that cite your domain divided by all valid response cells.
    • Recommendation rate: response cells that recommend your brand divided by all valid response cells.
    • Recommendation share: your brand’s recommendation instances divided by all named-brand recommendation instances in the tracked category. Count a brand no more than once per response so repetition within the prose doesn’t inflate its share.
    • Consistency: the recurrence of your mentions or recommendations across prompt variants, platforms and collection windows. Report each dimension separately so strength on one interface cannot conceal absence elsewhere.

    Recommendation rate and recommendation share answer different questions. A category may produce few brand recommendations overall, giving one brand a large share of a small space. Conversely, your brand may appear frequently while losing relative share because competitors appear even more often. Put both measures beside each other.

    LLM consistency and recommendation share, often grouped as LCRS, provide a repeatable way to examine presence across prompts, platforms and time. Keep the components visible instead of manufacturing a blended score with arbitrary weights. A composite is useful only when its weighting rules are documented and tied to a real business decision.

    Build a repeatable AI discovery sample

    A prompt tracker should represent buyer decisions, not a bag of interesting questions. Isolated keyword tracking already struggles to represent semantic search and intent; copying that model into an AI visibility tool preserves the same flaw. Organize prompts into topic-and-intent families that correspond to the decisions your audience makes.

    Construct prompt families around decisions

    Start with commercially meaningful topic clusters, then cover the different ways a person could approach each one:

    • Category discovery: solutions for a defined problem or goal.
    • Comparison: alternatives, trade-offs or differences between approaches.
    • Shortlisting: suitable providers or products for a particular use case.
    • Constraint: choices shaped by industry, organization size, compatibility, location or another relevant requirement.
    • Validation: questions about trust, fit, limitations or reasons to choose one option over another.

    Create wording variants within each family, but preserve the underlying intent. If you change the audience, constraint and requested output at the same time, you have created a different decision rather than a controlled variation. Keep a permanent identifier for the family and a separate identifier for each variant.

    Track the category, not only your brand name. Brand-prompt performance can show whether a system knows you, but category prompts reveal whether it chooses you before the user has supplied your name. That is the competitive question recommendation share is meant to answer.

    Freeze the protocol before collecting answers

    1. Define the scope. Record the topic clusters, intent classes, markets and AI interfaces the scorecard is supposed to represent. Keep an initial competitor set for reporting, but capture unlisted brands so the tracker can detect new entrants.
    2. Lock a prompt version. Preserve the exact text and variant identifier. Add new prompts as a new version instead of silently editing the historical set.
    3. Record the conditions. Save the platform, interface, collection time, exposed model label, relevant account or location context, and any settings that could affect the response.
    4. Repeat collection. Run the same portfolio on a fixed cadence and retain every raw response. Because LLM output is non-deterministic, directional trends are more useful than one-shot results.
    5. Code observable events. Use separate fields for domain citation, brand mention, explicit recommendation, competitor recommendation, negative context and factual inaccuracy. A response can satisfy several fields at once.
    6. Review ambiguous cases. Automated parsing can handle volume, but human review should resolve implied recommendations, misspelled brands, parent-subsidiary relationships and passages where a brand is mentioned only as a warning.

    The coding rule for a recommendation should be written before anyone sees the results. A practical definition is an explicit suggestion, shortlist placement or statement that the brand is suitable for the requested use case. Incidental examples, citations, navigation instructions and negative comparisons do not qualify.

    Keep the raw answer beside the coded fields. If recommendation share moves, you need to know whether the market changed, the model phrased the same judgment differently, or the parser made a classification error. A dashboard without retrievable evidence is difficult to audit and easy to overinterpret.

    Give executives and practitioners different dashboard views

    An executive scorecard should explain commercial performance. A working SEO view should explain what caused it. Combining both into one page usually leaves leaders staring at diagnostic noise while practitioners lose the detail needed to act.

    The executive view

    • Qualified organic outcomes: leads that become sales-qualified opportunities or customers, not unfiltered form fills.
    • Pipeline and revenue contribution: shown by product category, service line or another useful business unit.
    • Conversion-weighted search visibility: visibility across topic clusters adjusted by documented business value.
    • AI recommendation performance: recommendation rate, recommendation share and consistency for the same high-value clusters.
    • Supporting demand indicators: branded search, direct visits and returning visitors, interpreted alongside campaigns and other factors that can move them.

    To calculate conversion-weighted visibility, assign each topic cluster a business-value weight grounded in qualified conversion or customer data. Multiply the cluster’s visibility by that weight, add the weighted values, and divide by the total weight. Retain the unweighted result beside it. This makes the judgment transparent and prevents a large set of low-intent impressions from overpowering a smaller commercial opportunity.

    Do not let search volume alone determine those weights. A high-volume informational cluster may be useful for awareness, but it should not receive the same commercial importance as a lower-volume cluster that repeatedly produces customers. Traffic and impressions without intent or revenue context can point a strategy in the wrong direction.

    The working SEO view

    • Search impressions, clicks and landing-page conversions segmented by topic cluster and intent.
    • SERP coverage across organic results, snippets, local results and other relevant search features.
    • AI citations, mentions and recommendations by prompt family, platform and collection window.
    • Competitor recommendation share and the prompts where competitors displace your brand.
    • Response accuracy, negative context and unsupported claims that require reputation or content work.
    • Indexation, page eligibility and conversion-path issues that can explain a break in the measurement chain.

    Traffic, impressions and rankings remain useful diagnostics. They become misleading when reported as context-free outcomes. Average position treats queries of unequal value as though they matter equally, and a share-of-top-10 metric can be dominated by low-intent terms. Segment both before using them to allocate work.

    Move proprietary authority scores, total backlink counts and unqualified bounce rate out of the executive scorecard. They may support audits, but they don’t establish business performance. A visitor who gets a complete answer and leaves can produce a high bounce rate despite a successful visit; extra page views from a pricing page can reflect confusion rather than engagement. Engagement measures need page purpose and conversion context.

    Join AI visibility to customer outcomes

    Use the same topic-cluster names in the prompt tracker, content inventory, analytics reporting and CRM. That shared key lets you compare recommendation changes with the landing pages, qualified conversions and opportunities associated with the same need. Without it, AI visibility and revenue remain two charts that happen to sit beside each other.

    Show first-touch, assisted and last-touch views rather than forcing one attribution model to tell the entire story. Where appropriate, add AI assistants as an option in buyer-discovery fields and preserve a free-text answer. Treat self-reported discovery, branded search and direct traffic as supporting evidence, not proof that one AI response caused a sale. Their value is corroboration across signals.

    Interpret combinations of signals, then make a decision

    An analyst watches search, citation, brand, engagement, and purchase signals converge into a glowing path toward one selected action.

    No single movement establishes success or failure. The useful diagnosis comes from the relationship among visibility, recommendation and outcome measures.

    Observed patternLikely measurement implicationWhat to do next
    Citations rise while recommendation rate stays flatYour pages are useful evidence, but the brand is not being selected as a solution.Review whether the content clearly connects the named entity, offer, use case, differentiators and supporting proof. Do not diagnose this as an indexation problem.
    Recommendation share rises while site traffic stays flatZero-click influence is plausible, but the commercial effect is still unconfirmed.Check branded demand, direct and returning visits, qualified conversions and pipeline for the same topic clusters.
    Organic traffic falls while qualified conversions or revenue riseThe lost visits may be concentrated in low-intent queries.Segment the decline by intent, landing page and topic before attempting to restore the old total.
    Traditional rankings are strong while AI citations and mentions are weakRanking availability is not translating into selection within generated answers.Audit whether the relevant pages answer the prompt directly and express entities, claims and supporting evidence clearly.
    Visibility improves on one platform but not across prompt variants or timeThe gain is platform-specific or unstable rather than consistent.Keep collecting under the fixed protocol before changing strategy or claiming category-wide growth.
    AI visibility rises while qualified outcomes remain flatThe tracked prompts may not represent valuable demand, or the break may occur after discovery.Revalidate prompt intent, then inspect the offer, landing-page journey and lead qualification before pursuing more mentions.
    Results swing sharply between runsSampling volatility may be larger than the underlying change.Inspect raw responses and wait for the direction to recur across variants, platforms or collection windows.

    Predefine the decision attached to each pattern. If citation consistency is high but recommendation rate is low, work on brand-to-solution clarity and comparative evidence. If both AI visibility and commercial outcomes are weak for a high-value cluster, revisit the intent, content and conversion path. If recommendation performance and qualified outcomes improve together across a stable sample, expand the approach to the next closely related cluster.

    When you make a substantial change, annotate it in the measurement record. Where feasible, update one topic cluster while leaving a comparable cluster unchanged. Continue using the same prompt version and coding rules. This won’t turn observational data into perfect causal proof, but it gives you a much stronger comparison than a before-and-after screenshot taken from changing prompts.

    Begin with one commercially important topic cluster. Build its prompt families, collect the raw responses, code citations and recommendations, and connect the cluster to qualified conversions. Once that baseline is stable, the next report can answer the question that matters: whether your brand is merely available, repeatedly chosen, or contributing to demand.

    References

  • Unlocking SEO Success: AI’s Role in Authority Building

    Unlocking SEO Success: AI’s Role in Authority Building

    In an AI-driven search world, authority outweighs optimization

    As someone deeply immersed in the world of SEO, I’ve witnessed a fascinating evolution. In the early 2000s, if you were like me, you probably focused on gaming PageRank with enough links and keywords to achieve visibility. It was a mechanical process, and frankly, relatively simple to exploit.

    Fast forward two decades, and the search landscape has radically transformed. Algorithms have become sophisticated, mirroring Google’s deeper understanding of brands, individuals, and reputations. This transformation, driven by AI-powered discovery, means authority is now the cornerstone of search rankings. The journey culminates in an era where brand legitimacy is sustained through genuine visibility.

    ```json
{
  "alt": "Google Hotel Finder review snippet on Hallam Internet by Susan Hallam.",
  "caption": "Discover Susan Hallam's insights on Google Hotel Finder's UK launch. Her verdict? A thumbs up! Dive into the detailed review.",
  "description": "This image displays a snippet from Hallam Internet featuring a review of Google Hotel Finder by Susan Hallam. The service has recently launched in the UK, and the review is positive, with a recommendation to try it. The snippet includes the website link, author photo, and mentions Google+ circles."
}
```

    I witnessed Google’s first significant stand against manipulation with the Penguin update, prompting many of us to rethink our link-building strategies. “Digital PR” began to replace traditional notions, while Google’s experiments with entity-based understanding introduced innovations like author photos in search results and knowledge panels.

    Although Google eventually phased out some features like authorship, the message was clear: authority assessment was being redefined. Instead of asking, “Who links to this page?” Google’s algorithms started considering “Who authored this content, and how is this author recognized?” This shift, propelled by AI-driven search enhancements over the past year, is now impossible to ignore.

    ```json
{
  "alt": "The CapmatchOne logo with a gradient circle and bold text.",
  "caption": "Discover innovation with the CapmatchOne logo, featuring sleek typography and a modern gradient circle.",
  "description": "The CapmatchOne logo features bold, modern typography coupled with a gradient circle, symbolizing connection and innovation. The sleek design conveys a sense of progress and creativity. This image can be used for branding or promotional purposes, appealing to audiences interested in innovative solutions and forward-thinking designs."
}
```

    Helpful content and the end of synthetic authority

    When Google integrated the helpful content system into its core algorithm, it marked a turning point for us in SEO. Sites that once thrived on over-optimization saw their performance crumble. In contrast, brands demonstrating authentic expertise and brand authority began to rise.

    It’s now vital that search systems accurately evaluate whether content reflects true expertise. As someone who’s navigated the core updates, I’ve seen larger brands with robust reputations consistently outperform technically proficient but less well-known sites. Authority has evolved from being a differentiator to a necessity.

    ```json
{
  "alt": "Line graph showing top cited domains in ChatGPT with Wikipedia and Reddit as leading sources.",
  "caption": "A visual dive into ChatGPT's source preferences reveals Wikipedia and Reddit as predominant domains before a notable mid-September drop.",
  "description": "This line graph illustrates the percentage of times specific domains were cited as sources in ChatGPT responses from July to September 2025. Wikipedia.org and Reddit.com show initial dominance with citation rates over 40%, followed by a significant decline around mid-September. Other domains like Medium, Forbes, and LinkedIn remain low. Based on a Semrush study of 230K prompts in October 2025, sourced from semrush.com."
}
```

    Authority in an AI‑mediated search world

    In diving into resources about large language models (LLMs), I’ve learned that they source their information from diverse platforms—journalism, forums, reviews, and video transcripts. It’s through these platforms that reputation is built, highlighting the power of consistent, positive mention of your brand.

    This revelation has profound implications for our SEO strategies. Platforms like Reddit, Quora, LinkedIn, YouTube, and trusted review platforms such as G2 are regularly cited in AI search responses. These platforms organically reflect what people genuinely think about brands, rather than what we aim to claim.

    ```json
{
  "alt": "Bar chart comparing factors correlating with AI mentions among ChatGPT, AI Mode, and AI Overviews.",
  "caption": "Explore how ChatGPT, AI Mode, and AI Overviews differ in correlation factors related to AI mentions, based on a study of 75,000 brands by Ahrefs.",
  "description": "This image features a bar chart that compares correlation factors with AI mentions among ChatGPT, AI Mode, and AI Overviews. The data includes metrics such as YouTube mentions, branded web mentions, and URL rating, derived from a study of approximately 75,000 brands by Ahrefs Brand Radar and Site Explorer. The chart reveals varying correlation levels, providing insights into digital presence and AI-related discussions."
}
```

    This doesn’t mean the end of Google

    Despite AI’s growing integration, Google continues to dominate with over 90% of global search usage. Even among frequent AI platform users, reliance on Google persists. Google’s interfaces now absorb AI-style answers, meaning users experience AI directly within Google platforms. This hybrid presence offers an exciting opportunity for building cross-platform authority.

    Brand building is the new SEO multiplier

    As someone who bridges the gap between paid and organic strategy, I’ve seen that effective authority signals often emerge from outside traditional search channels. Digital PR, brand advertising, events, and offline activities increasingly shape organic performance. This sphere where paid and organic strategies converge enhances your brand’s legitimacy.

    ```json
{
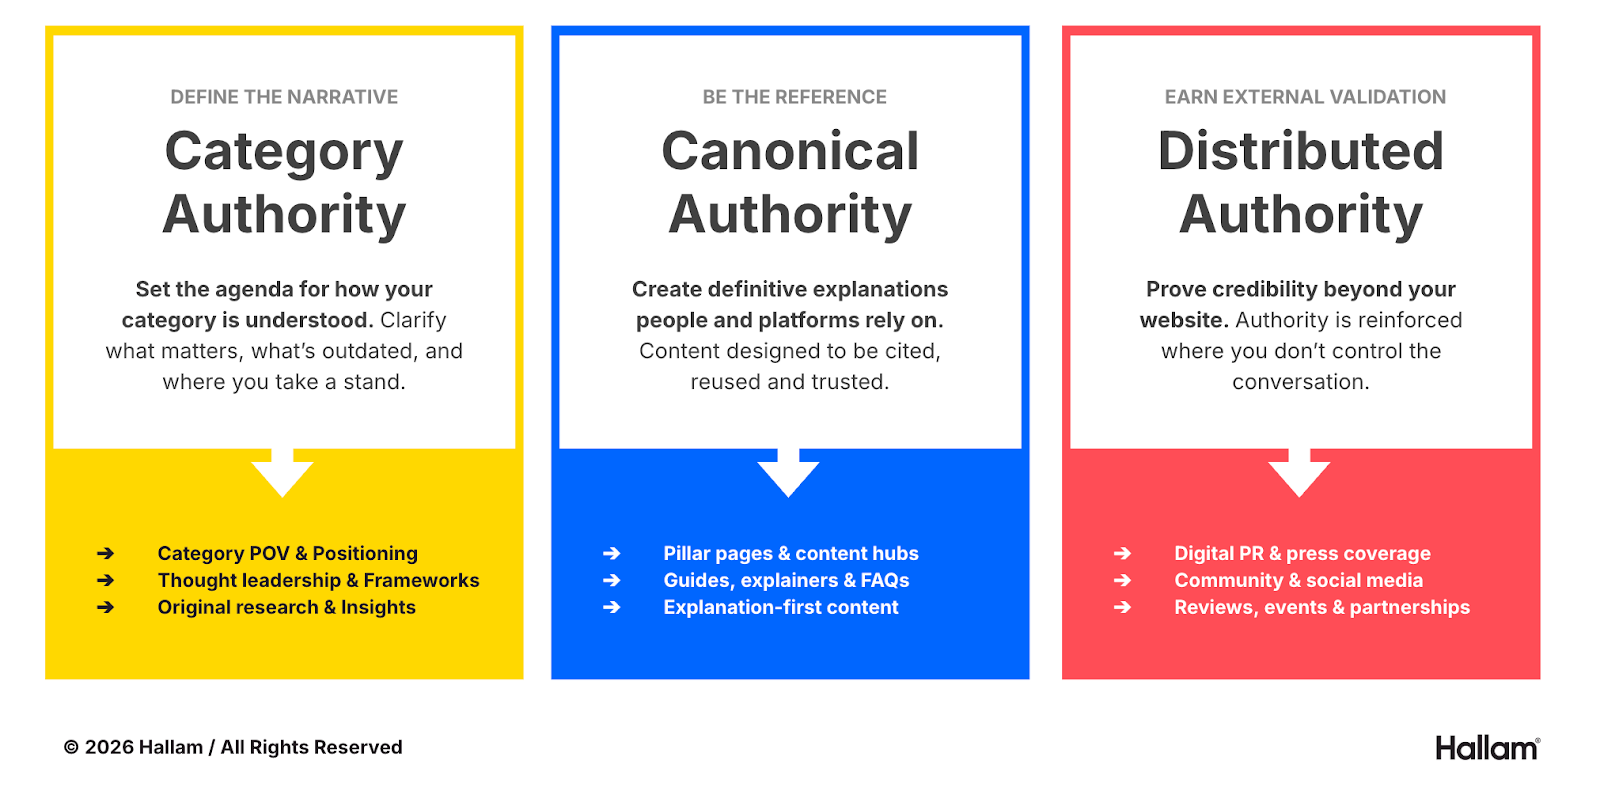
  "alt": "Graphic showing three types of authority: Category, Canonical, and Distributed, with descriptions and examples.",
  "caption": "Exploring the pillars of authority: Learn how Category, Canonical, and Distributed Authority help shape perceptions and build credibility across various platforms.",
  "description": "This graphic illustrates three essential types of authority: Category Authority, Canonical Authority, and Distributed Authority. Each type offers unique methods to build credibility. Category Authority involves defining the narrative with POV, thought leadership, and research. Canonical Authority focuses on creating trusted, reusable content like pillar pages and guides. Distributed Authority emphasizes credibility through external channels like PR, social media, and partnerships. © 2026 Hallam."
}
```

    Brand awareness significantly boosts click-through rates, with familiar names drawing references across various media. I’ve noticed mentions in YouTube videos or long-form journalism reinforcing topical authority that simple links cannot. The digital ecosystem now validates authority externally, and this multiplication effect is constantly evident in the results I oversee.

    A practical framework: The three pillars of authority

    Building enduring authority requires an integrated approach. Drawing from my experience, I’ve devised a framework focusing on three core areas: Category, Canonical, and Distributed authority. Each pillar strengthens your position as an industry leader, beyond mere SEO tactics.

    1. Category authority: Owning the truth, not just the traffic

    It begins with shaping how the category is defined. Instead of chasing keywords, the focus is on establishing your brand as the reference point others turn to for clarity. This strategy cultivates an authentic authority that search engines and AI increasingly reward.

    2. Canonical authority: Creating the definitive explanations

    This involves crafting explanation-focused content that thoroughly answers queries, becoming the go-to resource cited across various platforms. The content serves as the backbone across the digital landscape, ensuring enduring visibility through AI and future technologies.

    3. Distributed authority: Proving legitimacy beyond your website

    Genuine authority thrives through widespread credibility on platforms outside your control, including PR coverage, social media mentions, and product experiences. These elements amplify your brand’s presence and solidify trustworthiness.

    Ultimately, focusing on brand authority ensures durability amidst evolving algorithms. It’s about becoming the undisputed leader in your niche, where authority extends beyond traditional SEO into the realm of comprehensive digital engagement.


    Inspired by this post on Search Engine Land.


    crushpress.ai community screenshot
  • How to Grow Paid Search Without Losing Campaign Visibility

    How to Grow Paid Search Without Losing Campaign Visibility

    If organic clicks are slipping while search demand appears intact, raising every paid budget is the fastest way to hide the real problem. You have two visibility questions to answer: whether your brand still appears where searchers click, and whether you can see where your campaigns are actually delivering.

    The right response is not to replace SEO with paid search. It is to identify where valuable clicks have moved, assign each campaign a specific recovery job, and make budget decisions using both customer visibility and account-level evidence.

    Confirm that demand moved before you buy it back

    An organic decline does not automatically mean lower rankings, weaker demand, or an AI Overview taking every click. The search results page can redistribute the same pool of attention among classic organic listings, text ads, Product Listing Ads, AI features, and zero-click activity.

    That redistribution has become large enough to affect channel planning. Between January 2025 and January 2026, classic organic click share fell by 11 to 23 percentage points across four U.S. product and entertainment categories, while text ads gained 7 to 13 points.

    Within the same data, text-ad click share moved as follows:

    Query categoryJanuary 2025January 2026Change
    Headphones3%16%+13 percentage points
    Online games3%13%+10 percentage points
    Jeans7%16%+9 percentage points
    Greeting cards9%16%+7 percentage points

    Those figures are directional rather than universal. They cover the top 5,000 U.S. queries in headphones, jeans, and online games, plus 956 greeting-card queries. You should not apply their percentages to your account as a forecast. You should use them as a reason to test whether your own lost organic traffic has been captured by paid inventory.

    Do not diagnose that movement from AI Overview presence alone. For headphones, AI Overview presence rose from 2.28% to 32.76%, yet the zero-click rate remained at 63%. For jeans, AI Overview presence increased from 2.28% to 12.06% while the zero-click rate fell from 65% to 61%. AI features expanded, but zero-click behavior did not move in one consistent direction. Paid-result expansion therefore deserves its own place in your diagnosis.

    Build the diagnosis at the query-cluster level, not from an account-wide traffic total:

    1. Group queries by intent. Separate branded navigation, product or service searches, problem-aware searches, comparisons, and informational questions. A lost click on a purchase-ready query is not equivalent to a lost visit to a definition page.
    2. Align the periods. Compare organic impressions and clicks, paid impressions and clicks, conversions, and business value for the same query cluster and date range.
    3. Classify the pattern. Falling visibility across both organic and paid channels points toward weaker demand or broader coverage loss. Stable demand with falling organic clicks and rising paid capture is more consistent with SERP redistribution. Stable traffic with weaker conversion points you toward the offer, landing page, audience quality, or measurement.
    4. Prioritize recoverable value. Move a cluster into paid testing only when it has meaningful commercial intent, a credible landing page, and unit economics that can support the acquisition cost.

    These patterns are diagnostic clues, not proof of causation. If the budget decision is material, validate it with a controlled campaign change rather than assuming that two simultaneous trends are connected.

    Give each paid campaign one recovery job

    Three separate campaign modules connect to different gaps in an abstract search visibility landscape.

    Paid search cannot recover an aggregate SEO shortfall. It can buy coverage for particular intents and placements. A campaign becomes easier to manage when its name, targeting, budget, landing pages, and success metric all describe the same job.

    • Nonbrand text search: capture explicit commercial intent where classic organic listings have lost click share. Keep this separate from branded demand so an efficient brand campaign cannot conceal expensive acquisition traffic.
    • Shopping or Product Listing Ads: cover product-led discovery with a feed-based format. PLA click share rose from 16% to 36% for headphones, 18% to 34% for jeans, and 10% to 19% for greeting cards, making this a distinct visibility layer for ecommerce rather than an optional extension of text search.
    • Brand search: protect navigational demand where paid competition or a crowded results page creates a genuine coverage risk. Report it separately and test incrementality where practical, because a branded paid click is not automatically a newly acquired customer.
    • Performance Max: extend delivery across Google’s inventory when the broader reach fits your objective. Use its placement reporting to audit where that reach came from instead of treating PMax as an unexplained block of traffic.

    Competitor expansion can make the auction pressure self-reinforcing. As organic clicks fell in the tracked categories, Amazon increased paid headphone clicks by 35%, Walmart increased them nearly sixfold, Gap increased paid jeans clicks by 137%, and CrazyGames quadrupled paid clicks. Those shifts show brands buying more coverage as organic share contracts. They do not prove that every additional click was profitable.

    That distinction matters when you set a budget. Do not copy a competitor’s apparent response or multiply spend by the percentage of organic traffic you lost. Set the ceiling from your own gross profit, lead value, conversion quality, and acceptable acquisition cost. If those economics are uncertain, use an amount you can afford to lose while learning and write the stop condition before launch.

    A simple recovery brief should name the query cluster, the suspected click displacement, the campaign responsible for recovering it, the landing page, the primary business outcome, the budget ceiling, and the condition that would cause you to hold, scale, or reverse the change. If one brief needs several campaign types, split it. That keeps the eventual result interpretable.

    Turn PMax placement visibility into decisions

    A transparent prism reveals varied digital ad placements while a lens routes selected placements toward a business outcome.

    The Google Ads Where ads showed report gives you a clearer delivery view for Performance Max. It can surface placements, placement types, networks, and impression data across areas that include Google Search Partners and display inventory.

    This closes part of the visibility gap, but it does not turn every reported impression into placement-level profit evidence. An impression tells you where delivery occurred. It does not, by itself, tell you whether that placement created an incremental sale, a qualified lead, or wasted spend.

    1. Use matching date ranges. Pull the placement view for the same period as your cost, conversion, revenue, or qualified-lead results.
    2. Group delivery before judging it. Summarize reported impressions by network and placement type. Calculate each group’s proportion of reported impressions, but call it the reported impression mix rather than Google’s technical impression-share metric.
    3. Mark changes and surprises. Look for a sudden shift in network mix, a concentration of impressions in an unexpected placement type, or delivery that conflicts with the campaign’s intended market and brand-suitability rules.
    4. Compare the shift with business outcomes. If the mix changed while cost per qualified result, conversion value, or lead quality remained stable, the placement change alone does not justify intervention. If reach moved at the same time that business performance weakened, you have a candidate for investigation, not a final verdict.
    5. Change one controllable element. Verify targeting, campaign settings, assets, feeds, suitability controls, and any available exclusions. Make one supported change where the platform allows it, then record the reason so the next review can distinguish cause from coincidence.

    The most common mistake is to rank placements by impressions and label the largest one wasteful. High impression volume can mean broad delivery, low-cost inventory, or simply the way PMax assembled reach. Without matching outcome evidence, removing or constraining it can reduce useful coverage along with the unwanted inventory.

    What you seeWhat you can concludeWhat to do next
    Network mix changed; business outcomes stayed stableDelivery changed, but harm is not establishedRecord the shift and continue monitoring comparable periods
    Unexpected placement concentration; outcomes weakenedThe placement mix may be involved, but correlation is not causationCheck settings and suitability, then isolate one controlled change
    Unexpected placement; only impression data is availableYou know where delivery occurred, not what that placement returnedValidate suitability and seek matching performance evidence before changing spend
    Search Partner delivery increased; lead quality remained acceptableThe network label alone is not evidence of wasteKeep the decision tied to business quality and marginal cost

    Connect SERP loss, campaign reach, and business value

    A paid-search dashboard should make the chain from demand to value visible. If it shows only spend and conversions, you cannot tell whether growth came from recovering displaced clicks, harvesting brand demand, or expanding into new inventory. If it shows only placement impressions, you cannot tell whether the added visibility helped the business.

    Use one review sheet with a row for each intent cluster and these fields:

    • Demand signal: the direction of relevant search impressions or another consistent demand measure.
    • Organic capture: organic impressions, clicks, click-through rate, and classic organic share where reliable third-party data is available.
    • Paid capture: text-ad clicks, Shopping or PLA clicks, cost, and the campaign responsible for the cluster.
    • PMax delivery: reported impressions by network and placement type, plus any meaningful change in the mix.
    • Business result: purchases, qualified leads, revenue or conversion value, acquisition cost, and the quality measure that matters after the form fill or transaction.
    • Decision record: what changed, why it changed, the expected result, and whether the next action is to hold, expand, investigate, or reverse it.

    Review the sheet in that order. First ask whether demand changed. Then identify where clicks were lost or gained. Only after that should you judge whether paid coverage produced additional business at an acceptable marginal cost.

    Keep five analytical traps out of the review:

    • Do not blame AI Overviews from presence alone. Check paid-result growth and zero-click behavior before assigning the loss to an AI feature.
    • Do not blend brand and nonbrand performance. A strong branded return can make weak acquisition activity look efficient.
    • Do not treat the PMax placement report as a conversion report. Use it to understand delivery, then connect delivery changes to campaign outcomes.
    • Do not copy a competitor’s budget response. Their organic exposure, margins, customer value, and measurement may be different from yours.
    • Do not change bids, budget, targeting, assets, feeds, and landing pages together. You may increase volume, but you will not know which intervention caused it or which one should be repeated.

    Trend lines can establish that events happened together; they cannot establish incrementality by themselves. When the financial consequence is meaningful, use a controlled test that holds other material variables stable. Otherwise, a paid campaign may receive credit for demand that would have converted through organic, direct, or branded traffic anyway.

    Key takeaways

    • An organic click decline can reflect demand loss, ranking loss, paid-result expansion, AI features, zero-click behavior, or a combination. Diagnose the query cluster before adding budget.
    • Text ads and Product Listing Ads gained substantial click share in the tracked U.S. categories, so paid coverage belongs in a modern search-visibility plan without becoming a substitute for SEO.
    • Assign separate jobs and reporting to nonbrand text search, Shopping, brand campaigns, and Performance Max.
    • Use PMax placement data to see where impressions were delivered, but do not infer placement-level profitability from impressions alone.
    • Scale only when added coverage produces acceptable marginal business value, not merely more clicks or a larger reported reach.

    Start with one commercially important query cluster where organic clicks fell but demand still appears healthy. Map its current paid coverage, set a ceiling from your unit economics, inspect where PMax is delivering, and change one lever. That gives you an answer you can use: whether you recovered valuable demand or simply paid for more visibility.

    References

  • How to Build a Paid Search Optimization System That Learns

    How to Build a Paid Search Optimization System That Learns

    Your paid search account is probably not short of prompts to act. The harder problem is deciding which recommendation deserves budget, whether an automated result represents added business value, and how to preserve what your team learned after the interface changes.

    You need more than a collection of campaign tools. You need an operating system that connects operator skill, controlled execution, and credible measurement. That system lets you move quickly without treating every platform suggestion as an instruction.

    Key takeaways

    • Give every tool one clear job: build capability, execute a change, or verify its effect.
    • Record the hypothesis, baseline, spending limit, success metric, and rollback condition before applying a recommendation.
    • Treat platform-reported incremental lift as decision support. Compare it with the marginal cost and the business value of the added outcomes.
    • Turn Performance Max training into reusable launch and troubleshooting checklists instead of leaving the knowledge inside a course.
    • Manage additional Shopping images as structured feed data and test them against a defined commercial outcome.

    Build your optimization stack around decisions, not features

    A paid search tool earns its place when it helps you make a specific decision. A new dashboard, recommendation, feed field, or course is not automatically useful just because the platform makes it available.

    Separate your stack into capability, execution, and evidence. The separation matters because no single platform surface should be expected to train the operator, make the change, and deliver the final commercial verdict.

    LayerTools and resourcesDecision it should support
    CapabilityApplied Performance Max courses, scenarios, checklists, and reference materialCan the operator configure, review, and troubleshoot the campaign reliably?
    ExecutionCampaign controls, recommendation workflows, and product-feed image fieldsWhat exactly will change in the account, and which campaigns or products will be exposed?
    EvidenceRecommendation impact reporting, change records, and business performance dataDid the change create enough additional value to justify its cost?

    This model exposes gaps that a tool inventory can hide. A credential can support operator development, but it cannot establish campaign profitability. A recommendation can identify an opportunity, but it cannot decide how much financial exposure your business will accept. A results view can estimate added conversions, but it cannot repair an incorrect conversion action or an inflated conversion value.

    For each tool, write down its owner, required inputs, output, and resulting decision. If nobody can name the decision, the tool is adding interface activity rather than optimization capacity. If the same platform proposes a change, applies it, and scores it, add an independent business guardrail such as allowable acquisition cost, margin, qualified-lead rate, or incremental return on ad spend.

    Put every automated recommendation through an evidence gate

    An analyst operates a transparent inspection gate that tests glowing recommendation tiles before a few are allowed to reach a regulated budget reservoir.

    Automated recommendations are hypotheses generated from the platform’s view of the account. They may be useful hypotheses, but accepting one still changes real bids, targets, or budget. A projected improvement is not the same thing as measured incremental value.

    Google Ads is testing a Results area that adds a useful verification layer. For an applied bid or budget recommendation, the system analyzes performance one week later and compares the outcome with a baseline estimate. Its reporting uses a seven-day rolling average measured over the 28 days after the recommendation, organizes results around Budget and Target changes, and focuses on the campaign’s primary bidding objective: clicks, conversions, or conversion value.

    Availability should not be assumed because the Results area is an early pilot. The operating principle still applies in accounts without it: define the expected effect before the change, preserve the starting state, and return after a declared observation window.

    Before you apply a recommendation, add this record to your campaign log:

    • Recommendation: The exact budget, bid, or target change and every campaign it affects.
    • Hypothesis: The outcome expected to increase and the mechanism that should produce it.
    • Baseline: Current spend, the primary bidding objective, and the business metric used to judge quality.
    • Exposure limit: The maximum additional spend or efficiency deterioration you have approved.
    • Observation window: When you will evaluate the change and why that period is suitable for the available reporting.
    • Rollback condition: The result that will cause you to reverse or revise the change.
    • Confounders: Promotions, tracking changes, feed edits, landing-page releases, or other campaign changes that could affect the comparison.

    The exposure limit is not paperwork. Raising a budget can spend more money without producing proportionate business value. Set the limit before approval so a promising platform forecast cannot become open-ended authority to spend.

    When results arrive, separate volume from efficiency. Additional conversions can be valuable even if average campaign efficiency changes, but only when their marginal economics work. Calculate incremental cost per acquisition as additional cost divided by additional conversions. Calculate incremental return on ad spend as additional conversion value divided by additional cost. If clicks are the bidding objective, do not treat extra clicks as revenue; follow them through to the business outcome that justified buying the traffic.

    The baseline in the Results area is an estimate, not direct observation of what the same campaign would have done without the change. Seasonality, promotions, competitor activity, measurement changes, and delayed conversions can still complicate interpretation. Use the reported lift as evidence, then ask whether the direction appears in your business data and whether any concurrent change offers a better explanation.

    Turn Performance Max training into campaign infrastructure

    Performance Max optimization often becomes account folklore: one person knows how the setup was built, another remembers why a target changed, and nobody has a stable troubleshooting sequence. Training is most valuable when it removes that dependence on memory.

    Microsoft Advertising’s applied learning path provides a useful progression: foundations, guided hands-on setup, and advanced scenario-based implementation and optimization. The advanced course includes checklists, videos, reusable reference material, and contextual support through Help me understand during an assessment. Completion can also lead to a shareable Performance Max badge through Credly.

    Use that progression to create internal operating assets:

    • From foundations, create a shared glossary. Define each objective, target, status, input, and output in the language your team uses when approving spend.
    • From setup training, create a launch checklist. Require the campaign objective, conversion action, budget authority, target, product or asset inputs, owner, and first review point to be documented before launch.
    • From advanced scenarios, create a troubleshooting tree. Start with the observed symptom, list the measurement and input checks that could explain it, and identify the smallest reversible action for each branch.
    • From reference material, create account notes. Link each live setting to the reason it was chosen so the next operator does not have to infer strategy from configuration alone.

    Do not measure training only by course completion. Ask the operator to review a live configuration, identify one defensible change, explain the evidence required to keep it, and state the rollback condition. That exercise connects knowledge to account control without pretending that a credential proves commercial performance.

    Reusable artifacts also make optimization safer when ownership changes. The campaign retains its operating history, and a new manager can distinguish a deliberate constraint from an overlooked default.

    Treat multi-image Shopping ads as a feed experiment

    Shopping creative is partly a feed-management problem. If you treat additional images as an informal upload task, you lose control over image purpose, product coverage, and measurement.

    Microsoft Advertising’s multi-image Shopping format uses the optional additional_image_link attribute for as many as 10 comma-separated images. Those images can appear with the product’s price and retailer information, giving shoppers more visual context before the click.

    The existence of 10 available image slots does not mean every product needs 10 images. Each image should resolve a meaningful pre-click uncertainty. An alternate angle can clarify shape. A detail view can reveal construction or a feature. A variation image can help a shopper understand an option that the primary image cannot show clearly. Repetitive images consume feed space without adding equivalent information.

    Use this rollout sequence:

    1. Select a coherent product group. Start with items for which extra views communicate material information, not an arbitrary mix of the catalog.
    2. Assign every image a role. Record whether it shows an alternate angle, close detail, style, color, or another useful distinction.
    3. Validate the feed. Check that image links resolve, remain attached to the correct product, follow the intended order, and agree with the corresponding landing page.
    4. Declare the commercial outcome. Choose the metric that would justify expansion, such as qualified click-through, purchase rate, conversion value, or revenue per click.
    5. Protect the comparison. Avoid changing the same products’ bids, titles, prices, landing pages, and image sets at once. If your account structure permits it, compare a defined rollout group with a similar unchanged group.
    6. Expand only after the whole path improves. A higher click-through rate is not sufficient when the added visits convert poorly or produce weak value.

    This turns a creative feature into a testable merchandising decision. It also gives your feed team a clear rule for future images: add visual information that helps a shopper decide, then keep it only when the downstream result supports the added complexity.

    Use one repeatable loop for every campaign change

    A campaign specialist moves a glowing token around a circular workbench with stations for observation, testing, controlled change, comparison, and archiving.

    Your review process should remain stable even when platforms introduce new controls. A durable optimization loop looks like this:

    1. Start with the business decision. State whether you are trying to acquire more acceptable customers, recover efficiency, improve lead quality, or increase valuable product sales.
    2. Verify the measurement input. Confirm that the campaign’s primary objective represents the outcome you intend to optimize and that the business can interpret it consistently.
    3. Select one intervention class. Choose a budget change, target change, campaign setup correction, or creative-feed change. Separating change types makes the result easier to interpret.
    4. Write the hypothesis and guardrails. Define the expected movement, allowable spending exposure, observation window, and rollback condition.
    5. Apply the change and preserve context. Save the previous setting, implementation date, affected scope, owner, and any concurrent activity. Where Google’s pilot reporting is available, account for its 28-day measurement design rather than forcing an earlier conclusion from incomplete reporting.
    6. Evaluate platform lift and business economics separately. First determine whether the platform’s primary outcome moved. Then determine whether the additional cost produced acceptable downstream value.
    7. Turn the result into a reusable rule. Keep, revise, or reverse the change, and record what future operators should do when the same conditions appear again.

    A compact decision record needs only the campaign, owner, date, starting state, changed setting, hypothesis, spending limit, primary platform objective, business metric, observation window, result, and next action. Keep that record outside any temporary recommendation card so it remains available after the interface or account ownership changes.

    At your next account review, open the decision log before the recommendations queue. Pick one constrained problem, choose the tool that fits its layer, and define the evidence required to close the decision. That is how optimization becomes cumulative learning instead of a sequence of disconnected clicks.

    References

  • How to Build an AI Search Visibility Content Strategy

    How to Build an AI Search Visibility Content Strategy

    You can rank well in conventional search and still disappear when a buyer asks ChatGPT or Google’s AI Mode to recommend an option. You can also appear in the answer and lose the opportunity because the system describes your business vaguely, assigns it to the wrong category, or repeats an outdated limitation.

    A useful AI search content strategy therefore has three jobs: place your brand in the buyer’s consideration set, make the right description easy to retrieve, and support that description with evidence an AI system can cite. Here is how to build that strategy around real buyer decisions rather than an unstable idea of “ranking first” in a generated answer.

    Optimize for consideration and representation, not one position

    A generated recommendation is not a fixed search results page. The order can change when the wording, context, platform, or response changes. Treating the first brand mentioned as the AI equivalent of Google’s first organic result gives you a fragile target and hides a more consequential question: does the answer present your brand as a credible fit?

    Observed sessions in ChatGPT and Google’s AI Mode found that users considered an average of 3.7 businesses. In the same dataset, 75% examined businesses shown in positions 2 through 8, and approximately 60% completed their decisions from the AI response without visiting a business website or returning to Google. Those figures come from one body of observational work, so they are not universal benchmarks. They do show why inclusion and message quality deserve more attention than mention order alone.

    Before you plan more content, write the description you want a qualified buyer to receive. A practical template is: [Brand] is a [specific category] for [specific audience] that needs [job or outcome]. It is strongest when [fit condition] and is not the right choice when [meaningful limitation]. If your team cannot agree on that statement, an AI system will have to reconcile inconsistent language scattered across your website and third-party pages.

    Key takeaways

    • Seek eligible inclusion: measure whether your brand appears when it genuinely fits the buyer’s request, not whether it always appears first.
    • Control the description: publish explicit category, audience, use-case, price, fit, and limitation information instead of expecting the system to infer your positioning.
    • Support the claim: combine a clear first-party fact base with accurate, legitimate third-party corroboration.
    • Measure the decision: track inclusion, message accuracy, citations, and commercial outcomes by buyer intent.

    This changes the content brief. “Rank for AI SEO agency” is a keyword objective. “Help a multi-location marketing team determine whether this service fits its reporting and governance needs” is an answer objective. The second version tells the writer which audience, decision, conditions, and tradeoffs must be explicit.

    Build your content map from the questions buyers use to decide

    A hand arranges blank cards, geometric icons, and colored connections into a branching map from a problem to a shortlist of options.

    Broad educational traffic can introduce a category, but recommendation prompts are often built from decision questions: What will this cost? What can go wrong? Which option suits my situation? How does one provider differ from another? Which choices are credible? If those answers are absent, vague, or hidden behind a sales form, the model must rely on whatever else it can find.

    Start with evidence of the language your buyers already use. Search Google Search Console queries, Google Business Profile activity, semantic question maps from tools such as AnswerThePublic, and competitive gaps found with Semrush or Ahrefs. Then add the higher-value material that keyword tools often miss: sales-call notes, live-chat transcripts, prospect emails, objections, support questions, customer feedback, and reasons a buyer rejected an option.

    Sort the questions into five decision categories. This answer-first framework is useful because each category resolves a different kind of buyer uncertainty:

    • Pricing and cost: Give a price, range, or pricing model when you can. Explain what changes the cost, what is included, what is excluded, and which buyer conditions produce a materially different quote. “Contact us” is not an answer.
    • Problems and limitations: Name the situations in which the product, service, or approach becomes difficult, expensive, slow, or unsuitable. Explain the cause, the consequence, and any available workaround. Acknowledging a real limitation makes the surrounding claims easier to trust.
    • Versus and comparisons: Compare options on criteria that affect the decision. State which option is better for which use case, where each creates a tradeoff, and what information the buyer should verify. Avoid declaring a universal winner when fit depends on context.
    • Reviews and evaluation: Help the buyer judge evidence rather than publishing unsupported praise. Describe the evaluation method, the relevant use case, what was observed, and what remains uncertain. Distinguish first-hand evidence from information collected elsewhere.
    • Best-in-class choices: Define the criteria before naming candidates. Include other businesses when they genuinely meet those criteria, explain the scenarios each suits, and disclose where your own offering does not win. The goal is to become a useful evaluator, not to turn every list into an advertisement.

    Prioritize a question when it is close to a purchase decision, repeatedly causes confusion, or exposes a material gap between your intended positioning and what AI answers currently say. Defer a question when you cannot support an answer with facts or when your business is not reasonably eligible for the recommendation. Publishing a confident page does not make an unsupported claim true.

    Give every planned page an answer brief with these fields: the exact buyer question, intended audience, direct answer, decision criteria, named entities, evidence, limitations, desired brand description, related questions, and external information that may confirm or contradict the answer. This keeps a content calendar from becoming a list of loosely related keywords.

    Write each page as a briefing that can stand on its own

    Do not make the reader or retrieval system cross an autobiographical introduction before reaching the answer. Open with the conclusion, identify the entity and context, and then supply the evidence and qualifications needed to use it correctly.

    A large citation analysis covering 1.2 million AI responses and 18,012 verified citations found that 44.2% of citations came from the opening 30% of the content. The middle portion supplied 31.1%, while the final portion supplied 24.7%. This does not mean the rest of a page is disposable. It means a conclusion saved for the final section has a weaker chance of framing how the page is interpreted and used.

    Use this sequence for an answer page:

    1. Answer the question immediately. Name the product, service, method, or category and state the conclusion in plain language.
    2. Qualify the answer. Identify the audience, conditions, version, location, plan, or use case that changes the conclusion.
    3. Expose the decision factors. Explain cost drivers, capabilities, limitations, dependencies, and meaningful alternatives.
    4. Support the important claims. Use first-party facts, transparent criteria, documented examples, and legitimate external corroboration. Remove claims you cannot substantiate.
    5. Resolve the next question. Link to the comparison, pricing, problem, review, or implementation answer the buyer will need next.

    A reusable opening can follow this pattern: [Offering] is best suited to [audience] when [condition]. It is a poor fit when [limitation]. The decision usually turns on [named criteria], so compare options using [evidence the buyer can verify]. Replace every bracket with a concrete fact. If the result still works for almost any competitor, the positioning is not specific enough.

    At paragraph level, the same citation analysis attributed 53% of matched citations to middle sentences, compared with 24.5% to opening sentences and 22.5% to closing sentences. Do not game that distribution by hiding every useful fact in sentence two. Page location and sentence location are different signals. The practical lesson is that the whole paragraph must carry meaning: lead with the claim, develop it with the condition or mechanism, and finish with the consequence instead of adding filler around one quotable sentence.

    Content that earned citations tended to use definitive language, question-and-answer organization, dense entity information, balanced sentiment, and business-grade clarity. Definitive does not mean absolute. “This platform is the best” is unsupported certainty. “This platform fits distributed teams that require these named controls, but it is unsuitable when these constraints apply” is a clear, bounded claim.

    Entity-rich writing is also different from keyword repetition. Name the company, product, category, audience, location, compatible systems, pricing model, and relevant alternatives where they affect the answer. Then keep those facts consistent across service pages, comparison pages, author information, policies, and structured data. If you use schema, align it with visible page content; do not ask markup to carry positioning or review claims that the reader cannot verify on the page.

    Connect your first-party facts to third-party trust

    A transparent bridge of evidence blocks connects a blue information hub with independent publication, laboratory, community, and library structures.

    Your website is the canonical place to explain what you sell, who it serves, how it is priced, and where it does not fit. It is not the only place an AI system may use to evaluate those facts. In wearable-technology queries, trusted third-party domains appeared more often than brand websites. That is a vertical-specific pattern, not proof that every market behaves identically, but it exposes a risk: a strong first-party explanation may still be outweighed by a better-established external account.

    Information layerIts jobWhat to inspect
    First-party websiteEstablish canonical facts and answer buyer questionsCategory, audience, capabilities, pricing, limitations, policies, authorship, and visible evidence
    Third-party ecosystemCorroborate, compare, review, or contextualize the brandAccuracy, recency, editorial independence, criteria, and conflicting descriptions
    AI responseSynthesize a recommendation for the buyerInclusion, message, omissions, errors, alternatives, and cited domains

    Audit these layers as one information system. Ask representative buyer questions, record the domains cited, and inspect what those pages say about your category and fit. Correct inaccurate pages you control. When a legitimate third-party page contains a material error, use its normal correction process and provide verifiable information. Do not manufacture reviews, disguised placements, or repetitive mentions; they do not create the independent trust you are trying to earn.

    Then look for honest gaps in external coverage. A reputable comparison may lack your category. A directory may use an obsolete description. An industry explainer may need a qualified expert contribution. A customer may be willing to document a real use case. Pursue only opportunities where your information improves the resource for its audience. The useful question is not “Where can we place our brand name?” but “Which independent pages help a buyer verify this claim?”

    Keep the facts synchronized. If your homepage calls the business an AI SEO platform, a service page calls it a content agency, and third-party profiles call it a WordPress plugin, the system has several plausible categories to choose from. Decide whether those are distinct offerings or inconsistent labels, then state the relationship explicitly on the relevant pages.

    Measure inclusion, message quality, citations, and outcomes

    A single screenshot showing your brand first for a favorable prompt is not a visibility report. Build the measurement set from the same buyer-question inventory that drives your content. Include prompts for cost, problems, comparisons, reviews, best-fit recommendations, and disqualifying conditions. Mark whether your brand is genuinely eligible for each prompt before judging the answer.

    For every check, record the platform, exact prompt, buyer intent, eligibility, whether the brand appeared, how it was described, any material error or omission, the alternatives mentioned, and the cited domains. Preserve the prompt wording because a response to a broad category request should not be compared casually with a response constrained by industry, budget, geography, or technical requirements.

    Use the resulting record to calculate and interpret these working KPIs:

    • Eligible inclusion rate: the share of prompts where the brand appeared among prompts for which it was a defensible recommendation.
    • Message accuracy rate: the share of appearances that contained no material category, audience, capability, price, or limitation error.
    • Positioning alignment: whether the response expressed the differentiators and fit conditions in your approved brand description.
    • Citation coverage: whether important claims were connected to accurate first-party or independent evidence rather than left unsupported.
    • Commercial contribution: qualified inquiries, assisted conversions, or customer-reported discovery connected to AI interactions. Add AI assistants as a selectable discovery path where you collect attribution, while allowing the buyer to describe the path in their own words.

    Keep mention position as a diagnostic field, not the primary success metric. If the brand is absent from eligible prompts, investigate answer coverage, entity clarity, discoverability, and external corroboration. If it appears with the wrong description, reconcile positioning and factual inconsistencies. If it appears accurately but buyers do not progress, inspect the offer, fit, proof, and next step rather than producing more visibility content by default.

    Review results by decision category. A healthy inclusion rate for broad educational prompts can conceal an absence from high-intent comparisons. Likewise, a citation win can conceal damaging language about price or suitability. The unit of analysis is the buyer decision, not the total number of mentions.

    Start with the high-intent question that has the weakest current answer. Rewrite its opening, add the missing fit and limitation facts, connect it to credible evidence, and check how the exact buyer question is answered. Record the first discrepancy and fix it at the layer where it originates. Expanding that disciplined pattern across your question map will do more for durable AI visibility than producing another collection of interchangeable keyword pages.

    References

  • What Perplexity’s Ad Retreat Means for AI Search Strategy

    What Perplexity’s Ad Retreat Means for AI Search Strategy

    If Perplexity appears in your paid AI media plan, change the plan, not the audience strategy. The company has phased out its sponsored-placement experiment and has no current intention of bringing it back. Brands can still pursue visibility across Perplexity’s answers, but they cannot currently treat that visibility as inventory they can buy.

    The practical shift is from placement control to evidence quality. You need content that an answer engine can understand, claims it can support, a brand it can identify consistently, and measurement that distinguishes citations from mentions, referrals, and actual business results.

    Perplexity is treating trust as part of the product

    Perplexity began testing sponsored placements in 2024. Sponsored answers appeared beneath chatbot responses, were labeled as advertising, and were presented as separate from the system’s answer selection. The experiment still created a deeper problem: disclosure can identify a commercial relationship, but it cannot force a user to believe that the surrounding answer is free from commercial influence.

    That distinction matters in an answer engine. A conventional results page visibly separates advertisements from organic links and leaves the user to choose among them. An AI interface synthesizes information into a direct response. If an advertisement sits close to that response, the user may wonder whether payment affected the conclusion, even when the company says it did not. Perplexity decided that protecting the belief that users receive the best available answer was more valuable than continuing the test.

    This is not simply an anti-advertising position. It is a choice about which revenue model creates the least damaging perceived conflict. Perplexity is relying primarily on subscriptions, with paid plans reported between $20 and $200 per month, more than 100 million users, and approximately $200 million in annual revenue. Those are reported company-scale figures, not proof that subscriptions will fund every future ambition, but they explain why Perplexity can give trust more weight in the trade-off.

    The same boundary appears in commerce. Perplexity has introduced shopping features but does not take a cut of the transaction. That keeps the platform from earning more merely because it recommends one purchasable result over another. Subscriptions still create business incentives, but the revenue connection is more direct: users pay for access rather than brands paying for proximity to an answer.

    Do not turn the current decision into a permanent promise. A platform strategy can change as costs, competition, and user behavior change. Treat Perplexity as ad-free for planning purposes while maintaining a watchlist for any documented relaunch, rather than building a forecast around an assumed future product.

    Remove paid Perplexity inventory from forecasts, not Perplexity from the plan

    Perplexity reportedly handles 780 million queries per month. That signals substantial usage, but it is not an advertising forecast. Query volume does not tell you how many impressions a brand could buy, which audiences would be reachable, what targeting would exist, or whether exposure would produce qualified visits. Without an active ad product, it cannot be converted into CPMs, clicks, or revenue projections.

    If you own a media plan, make four operational changes:

    1. Move Perplexity advertising out of committed spend. Do not promise inventory, delivery, or launch dates based on the discontinued test. That creates a budget gap and a client commitment you cannot fulfill.

    2. Keep Perplexity in the discovery strategy. Assign ownership to the SEO, AEO, GEO, content, or digital PR workstream responsible for earned visibility.

    3. Preserve relevant creative and audience hypotheses. If ads return, the messaging lessons may remain useful even if the eventual format, targeting, and reporting differ.

    4. Define relaunch evidence in advance. Require an official product announcement, access terms, placement rules, pricing, labeling, targeting, measurement, and brand-safety controls before moving money back into the forecast.

    Do not create one universal policy for all AI products. At the time Perplexity ended its experiment, OpenAI was testing ads for free ChatGPT users, Google was placing ads in AI Mode but not Gemini, and Anthropic was keeping Claude ad-free. Monetization can differ between companies and between products owned by the same company.

    Your channel sheet should therefore use the product surface as the unit of planning. For each surface, record the current ad status, who can access it, where sponsorship appears, how it is labeled, what can be targeted, which reports are available, and when the status was last verified. A row labeled only “AI advertising” is too broad to support a real budget decision.

    Build the visibility that sponsored answers can no longer provide

    A bridge assembled from documents, evidence blocks, and verification seals leads toward a glowing abstract answer engine.

    You cannot choose where Perplexity mentions or cites you in the way you choose an ad placement. You can improve the inputs that make your organization useful as an answer source. The goal is eligibility and clarity, not a guaranteed citation.

    1. Map the questions that precede a decision. Include problem-identification queries, category questions, comparisons, brand-verification questions, objections, risks, and action-oriented queries. Use the language customers use, not only the terms in your navigation.

    2. Give each important page a clear answer job. State the useful answer near the top, then support it with definitions, evidence, limitations, examples, and next steps. A page that hides its conclusion behind a long preamble makes the core claim harder for both people and machines to isolate.

    3. Make claims attributable. Identify who produced the information, when it was updated, what the claim covers, and where its limits begin. If you publish original data, explain the method and scope. If you make a comparison, name the criteria instead of declaring a vague winner.

    4. Keep entity facts consistent. Your company name, product names, author names, service descriptions, locations, and ownership relationships should agree across the site. Conflicting facts create an identification problem before they create a ranking problem.

    5. Use structured data to clarify, not decorate. Organization and Person markup can express publisher and author identity; Article can describe editorial content; Product belongs on genuine product pages; and FAQPage should represent questions and answers visitors can actually see. JSON-LD can make relationships explicit, but it cannot rescue unsupported claims or guarantee inclusion in Perplexity.

    6. Close evidence gaps outside your site. If competing brands are repeatedly supported by independent explanations, reviews, or industry references and yours is not, publishing more self-description may not solve the gap. Give credible third parties something verifiable to reference: transparent data, a useful tool, clear documentation, expert commentary, or a defensible point of view.

    7. Maintain the pages that carry important facts. Correct obsolete details, preserve useful URLs, show meaningful update information, and avoid leaving contradictory versions live. An answer engine cannot reliably resolve a disagreement your own site has not resolved.

    This work should not imitate an advertisement. Promotional adjectives, unsupported superlatives, and repeated brand mentions add little evidence. A strong answer asset lets the underlying facts do the selling: it answers the question, shows why the answer is credible, states who the answer is for, and acknowledges conditions where a different choice may be better.

    Trust is also part of your own publishing system. Label sponsorships, disclose affiliate relationships, separate editorial conclusions from commercial arrangements, and make corrections visible. Perplexity’s decision shows why technical disclosure alone is not enough. Readers also judge whether the surrounding incentives could have shaped the answer.

    Measure answer visibility without pretending it is a fixed ranking

    Multiple translucent lenses show different arrangements of source cards and pathways around a spherical answer engine.

    A generative answer is an observation made under particular conditions, not a permanent search position. Record enough context to reproduce the check: the exact prompt, date and time, account state, answer text, brand mentions, cited URLs, linked pages, competitor mentions, and whether each statement about your brand is accurate.

    Repeat the same query set on a fixed cadence and preserve the results. If you change prompts continually, you cannot tell whether the platform changed or the question changed. If you check only once, you cannot distinguish a durable pattern from normal answer variation.

    Observed stateWhat it meansWhat to do next
    Cited and described accuratelyYour page is functioning as supporting evidence for that query.Preserve the useful URL, keep its facts current, and examine which passage appears to support the answer.
    Mentioned without a citationThe brand is present, but the answer does not visibly attribute the claim to your page.Identify the claim being made and strengthen the page that can support it with explicit, attributable evidence.
    Cited but described inaccuratelyVisibility is creating a reputation or conversion risk.Publish the correct fact prominently, remove contradictions, verify canonical pages, and monitor whether the answer changes.
    Absent while relevant competitors appearThe gap may involve content coverage, entity clarity, evidence quality, or independent corroboration.Compare the cited pages by question answered, evidence supplied, freshness, specificity, and source authority. Fix the missing component instead of copying their wording.
    Results vary across repeated checksThe evidence is not stable enough for a strategic conclusion.Expand the observation history and avoid reporting a gain or loss until a pattern emerges.

    Separate visibility metrics from outcome metrics. Useful visibility measures include brand inclusion rate, citation coverage, citation accuracy, and share of observed answers relative to named competitors. Outcome measures include referral sessions, engaged visits, assisted conversions, leads, and revenue from identifiable Perplexity traffic. A citation can be strategically valuable without generating a click, but that does not justify presenting it as traffic or sales.

    When a result changes, diagnose it at the query-and-page level. Ask which claim disappeared, which URL replaced yours, whether your linked page changed, and whether the competing evidence is more direct. A single sitewide “AI visibility score” can be useful for reporting direction, but it cannot tell an editor which paragraph, fact, entity relationship, or evidence gap needs attention.

    Key takeaways

    • Perplexity’s discontinued ad test removes a direct paid route to its audience; it does not remove the audience from your search strategy.

    • Labeled advertising can satisfy disclosure requirements while still weakening perceived answer independence. Trust depends on incentives as well as interface labels.

    • Do not convert monthly query volume into an advertising forecast when no active inventory, targeting, pricing, or reporting product exists.

    • Treat Perplexity visibility as earned. Improve answer coverage, attributable evidence, entity consistency, structured data, independent corroboration, and factual maintenance.

    • Measure citations, uncited mentions, accuracy, competitor inclusion, referrals, and conversions separately. They answer different business questions.

    • Track advertising status by product surface. ChatGPT, Google AI Mode, Gemini, Claude, and Perplexity do not share one monetization policy.

    Start by moving Perplexity from the paid-inventory line of your plan into an owned-and-earned AI visibility workstream. Establish a repeatable query set, capture the current baseline, and assign each meaningful gap to a specific page, fact, schema relationship, or authority-building task. If advertising returns, evaluate the actual product then. Until it does, the durable advantage is being useful enough to earn a place in the answer.

    References

  • Boost Your SEO Team’s AI Confidence: A Step-by-Step Guide

    Boost Your SEO Team’s AI Confidence: A Step-by-Step Guide

    With over twenty years in SEO, I’ve experienced every major industry disruption—from the days of keyword stuffing on AltaVista to the era of Google’s search algorithms, mobile-first indexing, and now the rise of AI.

    What’s striking today is the rapid pace of change and the emotional challenges it brings. I notice mounting pressure among teams, even those who have navigated previous shifts successfully.

    The common apprehension is valid: If AI improves speed, where does that leave me? This isn’t just a technical question—it’s deeply personal.

    This uncertainty can lower morale and slow adoption. Productivity can wane, and experimentation might stall, leading teams to either over-rely on AI or completely avoid it.

    The real leadership challenge is building confidence, capability, and trust in AI-assisted teams.

    4 Ways to Boost AI Confidence in SEO Teams

    Instilling genuine AI confidence within an SEO team goes beyond just adopting the latest tools—it’s a cultural shift.

    The most effective SEO teams don’t just accumulate tools; they use AI purposefully and with discipline—automating data pulls, summarizing research, and clustering keywords—to devote more time to strategy, storytelling, and aligning with stakeholders.

    As noted by Harvard Business School, technology adoption is largely cultural. Tools themselves don’t drive change—trust does. This insight is crucial for SEO teams navigating AI today.

    Below are four strategies for enhancing AI confidence in your teams through clarity, participation, and shared ownership, instead of pressure or hype.

    1. Earn Trust by Involving the Team in AI Tool Selection and Workflow Design

    Strengthening trust can effectively be achieved by transitioning from a top-down approach to shared ownership. People generally trust what they help create.

    When AI tools are imposed, resistance can increase. Inviting team members to participate in evaluation and workflow design makes AI seem less daunting and more empowering. Involving teams early provides real-world insights into where AI can reduce friction or introduce new challenges.

    Effective leaders:

    • Invite teams to test tools and share feedback.
    • Run small experiments before scaling adoption.
    • Communicate clearly about what you’re adopting, what you’re rejecting, and why.

    When teams feel included, they are more willing to experiment, and growth and innovation are fueled.

    Dig deeper: Why SEO teams need to ask ‘should we use AI?’ not just ‘can we?’

    2. Meet People Where They Are—Not Where You Want Them to Be

    AI capability varies widely across SEO teams. Some members might experiment daily, while others feel inundated or skeptical, influenced by past automation trends that have come and gone.

    Leaders who boost confidence know that capability develops at different speeds. They cultivate environments where curiosity is encouraged, uncertainty is acceptable, and learning is continuous rather than mandated.

    This means:

    • Normalizing different comfort levels.
    • Creating psychological safety around “I don’t know yet.”
    • Avoiding the shaming or over-celebration of early adopters.
    • Offering multiple learning paths.

    Acknowledging different starting points makes growth seem attainable rather than intimidating.

    @media (max-width: 768px) {.headline-responsive {font-size: 30px !important; line-height: 1.3 !important;}}

    3. Celebrate Wins and Highlight Champions

    Confidence builds with visible success.

    When a team member uses AI to reduce a task from hours to minutes, it’s a moment worth recognizing. It demonstrates AI’s potential to support meaningful work without sidelining human insight.

    Successful teams:

    • Share clear examples of AI improving quality and efficiency.
    • Highlight internal champions who can mentor others.
    • Create opportunities for demos and knowledge sharing.
    • Foster a culture of exploration, not criticism.

    My agency created AI focus groups with members from various departments. One group worked on integrating AI into project management, including representatives from SEO, operations, and leadership.

    This collaborative ownership resulted in more successful implementation. Teams were not just introducing AI; they were defining how it fit within real-world workflows. This approach led to enhanced buy-in, improved collaboration, and increased confidence.

    ```json
{
  "alt": "The CapmatchOne logo with a gradient circle and bold text.",
  "caption": "Discover innovation with the CapmatchOne logo, featuring sleek typography and a modern gradient circle.",
  "description": "The CapmatchOne logo features bold, modern typography coupled with a gradient circle, symbolizing connection and innovation. The sleek design conveys a sense of progress and creativity. This image can be used for branding or promotional purposes, appealing to audiences interested in innovative solutions and forward-thinking designs."
}
```

    Each group shared its achievements and lessons learned, building awareness of what succeeded and the reasons behind that success. When teams observe their peers embracing AI effectively, momentum flourishes.

    Dig deeper: The future of SEO teams is human-led and agent-powered

    4. Frame AI as a Collaborative Partner, Not a Replacement

    The fear of being replaced by AI is genuine. Ignoring this concern won’t make it disappear. It’s vital for teams to understand where human expertise remains indispensable.

    Reframing AI as a partner involves highlighting:

    • AI handles volume. Humans handle nuance.
    • AI accelerates analysis. Humans interpret meaning.
    • AI drafts. Humans validate, refine, and contextualize.
    • AI scales output. Humans build trust and influence.

    While AI aids execution, it cannot replace strategic instincts, contextual judgment, or cross-functional leadership—skills that ultimately drive performance.

    Why Experience Still Matters in AI-Driven SEO

    AI has lowered the entry barrier for many SEO tasks. With effective prompts, nearly anyone can produce keyword lists, outlines, or summaries. However, this accessibility often results in fleeting tactics and recycled quick fixes. 

    Anyone with a lengthy tenure in SEO recognizes this cycle. Tactics evolve. Fundamentals remain. Experience is the key differentiator here.

    AI Can Generate Outputs, Not Accountability

    AI can create content and analyze data, but it doesn’t bear responsibility for outcomes. It doesn’t uphold brand reputation, compliance, or long-term performance.

    SEO professionals remain responsible for:

    • Deciding what to exclude from publication.
    • Assessing technical, reputational, and compliance risks.
    • Weighing long-term consequences against short-term gains.

    AI executes. Humans decide. That distinction matters more than ever.

    Pattern Recognition Is Learned, Not Automated

    AI excels at identifying patterns but struggles to explain their significance or relevance in specific contexts.

    Experienced SEOs bring a depth of understanding AI can’t replicate. Their historical insights help them identify true shifts instead of simply reacting to industry noise. 

    Few industries witness as many tactic fluctuations as SEO. Experience fosters strategic thinking beyond previously successful approaches and avoids repeating tactics that later failed.

    AI suggests possibilities. Experience evaluates relevance.

    Professional Integrity Remains a Differentiator

    In high-visibility search environments, mistakes scale quickly. AI may produce inaccuracies, risking brand trust and compliance dangers.

    Teams with strong professional SEO foundations:

    • Validate AI output instead of assuming correctness.
    • Prioritize accuracy over speed.
    • Maintain ethical SEO standards.
    • Protect brand voice and credibility.

    Integrity isn’t automated. It’s a practiced discipline. In a fast-paced AI environment, it holds increasing importance.

    Dig deeper: How to build and lead a successful remote SEO team

    Growing the SEO Profession in an AI Era

    AI is accelerating SEO execution.

    As routine tasks become automated, the role of an SEO professional shifts to strategic oversight. Time previously spent on manual analysis can now focus on interpreting user intent, shaping search strategy, guiding stakeholders, and assessing risks.

    This evolution makes fundamentals even more critical. Teams still need sound judgment, technical expertise, and accountability. While AI supports execution, professionals remain responsible for decisions, quality, and long-term performance.

    Developing future SEOs necessitates more than tool proficiency; it requires teaching:

    • When to rely on AI.
    • When to question AI outputs.
    • How to apply experience and context to its output.

    Inspired by this post on Search Engine Land.


    crushpress.ai community screenshot
  • Google AI Overview Interactive Links: An SEO Action Plan

    Google AI Overview Interactive Links: An SEO Action Plan

    If your page appears in Google’s generated answers, earning the citation is only the first part of the job. A searcher still has to notice your link, understand what it offers and choose it from the other available sources.

    Google’s interactive link treatment gives that choice more visual weight. It may create a better route from an AI answer to your site, but it does not guarantee more traffic. Your practical response is to improve the pages behind likely citations and establish a measurement process that does not confuse correlation with proof.

    The click path now has a visible choice layer

    Google has made groups of links in AI Overviews and AI Mode open in a pop-up when a desktop user hovers over them. These cards provide more context about the linked websites, giving the user a clearer opportunity to leave the generated response and investigate a source.

    The behavior is different on mobile because there is no hover action. Google is instead using more descriptive and prominent link icons across desktop and mobile. That distinction matters when you audit visibility: a desktop screenshot of an open link group and a mobile screenshot of a link icon are observations of two related but different interfaces.

    This creates an additional choice point in the search journey:

    • Your page first has to be selected as a supporting source.
    • The searcher then has to notice and choose it within the link interface.
    • The landing page has to confirm quickly that the click was worthwhile.

    That middle step is the important change. A citation can now be exposed through a richer, more noticeable interaction, but greater visibility is not the same as a visit. The other links in the group remain alternatives, and the user may decide that the generated answer is already sufficient.

    Google says its testing found the interface more engaging and made web content easier to reach. Treat that as a directional product finding, not a traffic forecast for your site. The result depends on whether you are cited, how your option is presented, what else appears beside it and whether the searcher still needs more information.

    Optimize for citation, choice and landing-page confirmation

    A structured webpage connects to a highlighted source card and then to a visually matching landing page.

    Do not infer a new markup requirement from the interface. A new visual treatment is not evidence of a special interactive-link schema or a new ranking signal. Keep valid structured data where it accurately describes the page, but do not invent properties or rename schema solely to chase the pop-up.

    Instead, audit the whole path from the question to the page. Start with URLs that directly answer the questions your audience asks and that already receive impressions for relevant queries. Then review each candidate against the following criteria:

    • Question alignment: The page should address the searcher’s actual problem, not merely mention the same entity or keyword. If the relevant answer is a minor aside, give it a focused section or use a better page.
    • Immediate answer: State the useful answer near the beginning of the relevant section. A reader arriving from an AI response should not have to reconstruct it from a long introduction.
    • Descriptive headings: Use section headings that identify the decision, process or distinction being explained. Generic headings make both scanning and passage-level understanding harder.
    • Clear page promise: Make the title specific enough to distinguish your page from adjacent sources. The wording should describe what the visitor will learn without promising evidence, scope or freshness the page does not provide.
    • Visible substantiation: Put definitions, qualifications and supporting evidence close to the claims they support. Add authorship and update information when those details genuinely help a reader judge the material.
    • Landing-page continuity: The heading and opening visible after the click should confirm that the visitor reached the expected answer. If the title promises a procedure but the page begins with a broad industry essay, the click has created friction.
    • Useful next step: Once the immediate question is answered, provide a relevant route to a deeper explanation, tool, product category or decision page. Do not force that continuation before delivering the answer that earned the visit.
    • Mobile usability: Check the page on a narrow screen. A prominent mobile link is of little value if overlays, slow media, crowded navigation or an unclear opening block the answer.

    Keep these improvements honest. Rewriting every heading as a question, repeating the same answer in several sections or adding unsupported claims may make a page look optimized while making it less useful. The goal is not to imitate an AI response. It is to make the underlying page the clearest place to verify, understand and act on the answer.

    You should also separate interface optimization from eligibility. Better titles, openings and page structure can improve the experience when your page is shown, but they do not guarantee inclusion in an AI Overview or AI Mode response. Record inclusion and post-click performance as separate outcomes so a content change is not credited for something it did not cause.

    Measure impact without inventing attribution

    Glowing visitor paths pass through a transparent observation frame between an abstract search panel and a website panel.

    The rollout does not provide a dedicated way to isolate the impact of interactive links in Google Search Console. Existing search metrics can show that a page’s performance changed, but they cannot by themselves prove that a hover card or a more prominent icon caused the change.

    Use two connected records: a manual visibility log for the interface and your normal performance data for outcomes.

    1. Create a fixed watchlist of commercially or editorially important questions. Avoid changing the query set whenever you see an interesting result, because that makes comparisons inconsistent.
    2. For every observation, record the query, date, device type and whether you checked AI Overviews or AI Mode. Note whether your URL appeared, what context was visible and which other sites shared the link group.
    3. Save a screenshot when the interface or citation changes. The screenshot preserves evidence that aggregate analytics cannot supply later.
    4. Before editing a candidate page, export its Search Console impressions, clicks and click-through rate by page, query and device. Preserve that baseline rather than relying on memory.
    5. Annotate the date and substance of every material content change. Changing the title, answer, structure and conversion path simultaneously will make the result difficult to interpret.
    6. Review on-site sessions and meaningful outcomes for the same landing pages. Choose outcomes that fit the page, such as a completed signup, a qualified inquiry, a product-view continuation or another defined conversion.
    7. Compare the edited pages with relevant pages you did not change. This does not create perfect causal proof, but it can help you notice whether a movement is page-specific or widespread.

    Interpret the patterns carefully. More observed citations with flat clicks can mean that visibility improved without winning the user’s choice. Higher visits with weak engagement can reveal a mismatch between the visible promise and the landing page. Stronger engagement or conversions without a clear Search Console shift can still justify improving the post-click journey, but it does not prove the interactive links supplied the visitors.

    Seasonality, ranking changes, query demand, competing results and your own edits can move the same metrics. Use language such as associated with or observed after when reporting the result internally. Reserve caused by for evidence that can actually isolate the interface.

    Key takeaways

    • Desktop users can reveal grouped links in AI Overviews and AI Mode by hovering, while both desktop and mobile receive more prominent, descriptive link icons.
    • The interface increases the visibility of source choices; it does not guarantee that a citation will produce a click.
    • There is no basis here for adding a special interactive-link schema. Concentrate on accurate structured data and a page that clearly fulfills the cited question.
    • Audit three separate stages: citation inclusion, selection from the link group and post-click performance.
    • Search Console cannot isolate the feature’s impact, so combine a manual query log with page-, query- and device-level performance data.
    • Report changes as directional unless you can separate the interface from rankings, demand, competing results and content edits.

    Start with a small, stable watchlist and capture the baseline before changing anything. Improve the pages where a clearer answer and a better landing experience would help regardless of how Google’s interface evolves. That gives you useful content now and credible evidence when the link treatment changes again.

    References

  • ChatGPT Conversion Rates by Industry: 2026 Benchmarks

    ChatGPT Conversion Rates by Industry: 2026 Benchmarks

    If ChatGPT has started appearing in your referral report, the hard question isn’t whether the traffic exists. It’s whether your conversion rate is healthy enough to justify more investment or weak enough to expose a broken landing path.

    Industry context helps, but only when you use it as a diagnostic. Reported 2026 rates run from 1.4% to 7.0%. That spread reflects more than differences in demand: participating companies defined their own conversion actions, and most had already invested in generative engine optimization and ChatGPT-focused funnels. Match the definitions before you match the percentages.

    Key takeaways for evaluating ChatGPT conversions

    • The 2026 industry range is 1.4% to 7.0%, with hotels and resorts at the high end and engineering at the low end.
    • A conversion was whatever action each participating company had designated, so the rates do not represent one uniform outcome.
    • Most participating companies had invested in GEO and dedicated ChatGPT funnels. Treat the figures as an optimized-cohort reference, not a universal market average.
    • Absolute conversion rate and improvement over traditional SEO are different measurements. You need your own matched SEO baseline to calculate channel lift.
    • Keep direct ChatGPT referrals separate from broader AI influence so that attribution assumptions do not distort your benchmark.

    2026 ChatGPT conversion benchmarks by industry

    Six differently shaped visitor pathways lead to geometric goals beside objects representing retail, software, finance, travel, healthcare, and business services.

    Between May 2025 and February 2026, anonymous client data from more than 150 companies measured the proportion of ChatGPT referral traffic that completed a conversion action defined by each company. Most companies in the cohort had higher-than-average ChatGPT referral traffic, prior GEO investment, and a dedicated conversion path for that traffic.

    That context matters. These are useful reference points for a company actively optimizing AI discovery and its post-click experience. They are not reliable predictions for an unoptimized site, and they should not be inserted directly into a revenue forecast.

    IndustryReported average conversion rate
    Addiction Treatment2.9%
    Apparel & Fashion2.8%
    B2B SaaS2.4%
    Biotech2.1%
    Commercial Insurance3.1%
    Construction3.4%
    eCommerce3.0%
    Engineering1.4%
    Entertainment4.7%
    Environmental Services2.0%
    Financial Services1.9%
    Food & Beverage3.4%
    Healthcare4.5%
    Heavy Equipment1.8%
    Higher Education & College4.9%
    Hotels & Resorts7.0%
    HVAC Services3.9%
    Industrial IoT3.9%
    IT & Managed Services2.4%
    Legal Services5.6%
    Luxury Goods1.9%
    Manufacturing3.8%
    Medical Device2.3%
    Oil & Gas3.2%
    PCB Design & Manufacturing2.9%
    Pest Control3.8%
    Pharmaceutical3.2%
    Real Estate2.8%
    Software Development1.8%
    Solar3.5%
    Staffing & Recruiting3.7%
    Transportation & Logistics1.9%

    The useful comparison is your rate against the row for your industry and a matched conversion event, not against the highest rate in the table. A hotel booking and an engineering inquiry represent different commitments. Even two companies in the same industry may assign conversion status to different actions.

    What the industry spread does and does not prove

    The leading rates identify a pattern, not its cause

    Hotels and resorts led at 7.0%, followed by legal services at 5.6%, higher education and college at 4.9%, entertainment at 4.7%, and healthcare at 4.5%. Engineering recorded 1.4%; heavy equipment and software development each recorded 1.8%; financial services, luxury goods, and transportation and logistics each recorded 1.9%.

    Those rates show where conversions landed, not why. Buying urgency, brand strength, traffic mix, conversion definition, landing-page quality, and the amount of friction in the next step are all plausible contributors. None can be isolated from an industry-level rate alone.

    A useful working hypothesis is that conversational search can pre-qualify some visitors. A user can describe a detailed problem, refine the request, and narrow the options before clicking. That can produce a visitor who is closer to a decision than someone arriving through a broad search query. Test that hypothesis against lead quality and downstream outcomes rather than treating it as a settled explanation.

    Complexity can improve channel lift without producing the highest rate

    Commercial insurance converted at 3.1%, while pharmaceuticals converted at 3.2%. Neither sits near the top of the absolute rankings. Their significance lies in the reported advantage over traditional search for complex buying decisions, not in having the largest raw percentages.

    No industry-by-industry traditional SEO baseline rates accompany these ChatGPT figures, so you cannot calculate a defensible uplift from the benchmark alone. Likewise, B2B sectors showed larger improvements over traditional SEO than B2C sectors, but no specific lift values are provided. Treat that distinction as directional until your own analytics can compare the same conversion event over the same measurement period.

    Referral conversion is narrower than total AI influence

    The benchmark measures referral traffic from ChatGPT. It does not represent every buyer who encountered a company in an AI answer and later arrived through direct traffic, branded search, email, or another channel. Mixing those journeys into the referral denominator would make your result incomparable with the industry figures.

    Maintain two views. Use direct ChatGPT referral conversion rate for the industry comparison. Use a separate assisted or influenced view for broader journey analysis, with its attribution assumptions documented. The first tells you how referred visits perform; the second helps you investigate whether AI visibility contributes elsewhere in the buying journey.

    Build an internal benchmark you can defend

    Two hands align visitor tokens, transparent funnels, landing-page tiles, a magnifying lens, and goal markers on an analyst's worktable.

    A percentage becomes useful only when everyone knows what entered its numerator and denominator. Build the internal benchmark in this order:

    1. Choose one primary conversion for each buying motion. For lead generation, distinguish an initial inquiry from a qualified lead, booked meeting, or sales opportunity. For commerce, keep completed purchases separate from add-to-cart and checkout events. Micro-conversions can remain diagnostic metrics, but blending them into the primary rate makes the result easier to inflate and harder to interpret.
    2. State the attribution scope. Label the series as direct ChatGPT referral traffic. If you also model assisted AI influence, store it as a separate series rather than silently adding it to the direct result.
    3. Keep the denominator with the rate. Calculate the percentage from completed primary conversions attributed to ChatGPT referrals divided by all ChatGPT-referred visits, multiplied by 100. Report the visit count, conversion count, conversion rate, event definition, and measurement period together. A rate without its underlying counts can look stable when it is not.
    4. Create a like-for-like comparison. Compare ChatGPT with traditional SEO using the same primary event, date range, geography, device rules, and treatment of new and returning visitors. Annotate any mismatch instead of presenting the resulting difference as channel lift.
    5. Segment by observable landing paths. Break performance down by landing page, content cluster, offer, and call to action. Do not claim to know the user’s original prompt if you did not capture it. The page visited and the actions taken on your site are evidence; an inferred prompt is a hypothesis.
    6. Connect the event to business quality. For lead generation, carry the referral source into qualification and opportunity reporting. For commerce, connect it to completed orders rather than stopping at a checkout signal. A high top-of-funnel conversion rate can still be commercially weak if the resulting leads or orders do not meet the business definition of value.
    7. Choose the decision rule before changing the funnel. When traffic volume supports a controlled test, define the success event and comparison method in advance. When referral volume is sparse, report the uncertainty, group genuinely similar landing paths where appropriate, and avoid declaring a winner from a volatile percentage.

    This process also prevents a common benchmarking mistake: celebrating a rate above the industry figure when your conversion event is easier to complete. A newsletter signup should not be compared with a booked consultation, completed application, or purchase simply because every event has been labeled a conversion.

    Turn the performance pattern into the right next move

    Judge high and low performance relative to a matched industry rate and your own stable history. Then use the combination of referral volume, primary conversion rate, and downstream quality to decide what to investigate.

    Observed patternWhat it may indicateWhat to do next
    Low ChatGPT referral volume with a healthy matched conversion rateThe post-click path may work, while AI discovery or citation coverage is limited.Audit the questions and decision criteria covered by your content. Strengthen pages that contain evidence, clear entity information, and a natural path to the existing conversion action.
    Healthy referral volume with a low matched conversion rateChatGPT visibility is producing clicks, but the landing experience may not continue the user’s intent.Rank landing pages by referred visits, then examine message continuity, proof, call-to-action relevance, and form or checkout friction on the highest-volume cluster.
    Healthy conversion rate with weak qualified-lead or revenue performanceThe primary event may be too shallow, or the offer may attract the wrong kind of demand.Move the primary benchmark deeper into the funnel, preserve the shallow event as a diagnostic metric, and evaluate results by qualified outcome.
    An apparently high rate supported by a small denominatorNormal variation may be creating a persuasive but unstable percentage.Show the counts, gather more observations, and avoid projecting the rate into a budget or revenue model until it becomes decision-worthy.
    ChatGPT and SEO rates calculated from different events or attribution rulesThe apparent channel lift may be a measurement artifact.Rebuild both series around the same event and scope before changing channel investment.

    Do not respond to an underperforming benchmark by rewriting every page that receives a ChatGPT referral. Start with the content cluster responsible for the most referred visits and select one failure point: intent mismatch, missing proof, an irrelevant next step, or conversion friction. Preserve the baseline and record the change so the next measurement has a clear before-and-after boundary.

    Your immediate task is to name the primary conversion, export ChatGPT-referred visits and completed events for the same period, and compare the result with the matched industry row. The benchmark has done its job when it points you to one tracking correction or one funnel test. It has not done its job when it becomes a percentage copied into a forecast without the definitions that produced it.

    References

  • How to Use AI-Powered Advertising Without Losing Control

    How to Use AI-Powered Advertising Without Losing Control

    Your ad platform can now reach beyond the audience you selected, produce analysis inside the campaign interface, and decide which entertainment title is most likely to interest a viewer. Those capabilities may all carry the AI label, but they do not create the same risk or require the same supervision.

    Your job is not to recover every manual lever. It is to decide what the system may optimize, which boundaries it must respect, and what evidence it must produce before you give it more budget. That requires a control system built for automation rather than a longer list of settings.

    The control surface has moved from audience settings to campaign inputs

    Manual advertising made control easy to see. You selected an audience, chose a similarity range, and expected delivery to remain within it. AI-led delivery weakens that visual connection. A setting can influence the model without defining the final audience.

    Google’s announced March 2026 change to Demand Gen Lookalike segments illustrates the shift. Narrow, balanced, and broad similarity tiers become optimization signals instead of rigid targeting limits. Google can reach beyond the selected segment when its system predicts that other users are likely to convert.

    That distinction changes how you should read the campaign setup. A Lookalike tier still communicates useful direction, but it no longer answers the eligibility question by itself. Optimized Targeting remains a separate feature, and layering it with Lookalike signals can give the system additional room to expand.

    Before you launch or diagnose an AI-powered campaign, classify every important input as one of four things:

    • Objective: the result the platform is being asked to maximize, such as a purchase, subscription, ticket sale, or another conversion.
    • Signal: information that helps the model search, such as a seed audience, similarity tier, genre preference, or observed price sensitivity. A signal provides direction; it does not necessarily restrict delivery.
    • Constraint: a boundary the campaign must not cross, such as a spend ceiling, eligible territory, product restriction, or contractual audience requirement.
    • Observation: a metric you use to understand behavior but have not asked the model to optimize, such as reach, conversion rate, or downstream customer quality.

    Do not call a signal a constraint unless the platform’s current behavior explicitly guarantees it. If a territory, age rule, customer exclusion, or other eligibility condition is commercially or legally important, confirm the setting that enforces it. An audience seed is not a safe substitute for a hard boundary.

    Keep a campaign change log with the date, campaign, previous setting, new setting, whether the change was automatic or manual, the expected effect, and the person responsible for reviewing it. This small record becomes essential when the platform changes its interpretation of a familiar control. Without it, a sudden increase in reach can look like creative success when it was actually caused by audience expansion.

    Write an optimization contract before you spend

    A human hand adjusts safety stops around a tabletop model containing audience figures, creative tiles, budget tokens, and an objective marker.

    An AI system can optimize only what you make legible to it. If the selected conversion event is a weak proxy for the business result, the platform can improve its own score while sending the campaign in the wrong direction. A system asked to find inexpensive page visits should not be expected to discover profitable customers by implication.

    Write a short optimization contract for each campaign. It does not need legal language or a new software tool. It needs six explicit decisions:

    1. Name the business outcome. State what has to happen outside the advertising interface: a paid subscription, completed ticket purchase, qualified opportunity, retained customer, or another result that matters to the business.
    2. Name the platform event. Record the event the platform can observe and optimize. If that event occurs earlier than the business outcome, describe the gap instead of pretending the two are equivalent.
    3. Choose one primary score. CPA, conversion rate, conversion volume, and reach answer different questions. Select the metric that decides whether the test passes, then use the others for diagnosis.
    4. Set economic and eligibility boundaries. Use your actual unit economics to define an acceptable acquisition cost and a campaign spend limit. Record territories, offers, audiences, and products that are not eligible for expansion.
    5. Define the quality check. Decide how you will notice low-value conversions. Depending on the campaign, that may be completed purchases, valid subscriptions, qualified leads, attendance, retention, or another downstream signal.
    6. Assign decision rights. State which changes AI may make automatically, which recommendations require human approval, and who can pause, expand, or revert the campaign.

    For an entertainment release, the contract might connect the ad platform’s purchase event to paid tickets, use CPA as the primary score, monitor conversion rate and reach for diagnosis, restrict delivery to eligible markets, and require a human review before a material budget increase. The exact thresholds should come from the release’s economics, not from a generic platform benchmark.

    Do not broaden the audience and increase the budget in the same test step. If performance changes, you will not know whether the cause was additional delivery freedom, additional spend, or an interaction between them. Change one source of freedom, observe the result through the normal conversion lag, and then decide whether the next increment is justified.

    Supervise each kind of advertising AI differently

    AI-powered advertising is not one operating mode. Some features help you analyze a campaign. Some change who receives an ad. Others personalize the content or format presented to a user. The amount and location of human review should follow the type of decision being automated.

    AI roleWhat it changesMain control questionHuman checkpoint
    Decision supportReports, summaries, and audience researchIs the analysis based on the right data and definitions?Verify filters, calculations, and causal claims before acting
    Audience expansionWho may receive the ad beyond the original seedWhich inputs are signals, and which are enforceable boundaries?Audit expansion settings, eligibility, and conversion quality
    Content and format selectionWhich title, card, or presentation a user seesDoes the selected format match the buying decision?Measure the business outcome by title, offer, and market

    Google Demand Gen: audit expansion before interpreting performance

    Start by finding out which targeting behavior actually applies to the campaign. Under Google’s announced transition, campaigns move to the signal-based Lookalike model unless the advertiser uses the dedicated opt-out route for traditional behavior. If restricted audience eligibility is important, verify the account’s current setting rather than relying on the familiar name of the segment.

    Record the selected Lookalike tier even though it is now a signal. It remains part of the model’s direction and therefore part of the test. Record the Optimized Targeting status separately because the two mechanisms are not interchangeable and can operate together.

    Then read the result as a sequence rather than a single KPI:

    • Did reach expand beyond the pattern you expected?
    • Did conversion volume rise with that expansion?
    • Did conversion rate and CPA remain commercially acceptable?
    • Did the additional conversions produce the same downstream quality as the original audience?

    More reach is evidence that the delivery system found more people. It is not evidence that it found better customers. A lower CPA is more promising, but it still needs a quality check if the platform conversion can include low-value or incomplete outcomes.

    Use the traditional targeting option when strict audience control is a real requirement or when you need a clean baseline. Do not opt out merely because expansion feels less familiar. Conversely, do not accept expansion merely because it is the default. The right choice depends on whether scale or controlled eligibility is the binding constraint for that campaign.

    Meta Ads Manager: treat Manus as an analyst, not an authority

    Meta has embedded Manus AI in Ads Manager, where it can assist with report creation and audience research. This is decision-support automation. It may shorten the route from raw campaign data to a usable analysis, but a faster report is not the same as better ad delivery.

    Give the assistant bounded analytical tasks. A useful request names the account or campaign, date range, metrics, comparison, segments, and desired output. Asking for a performance report without those details invites the system to choose definitions that may not match the decision in front of you.

    Review every AI-built report at three levels:

    • Data scope: confirm the campaigns, dates, markets, and filters included.
    • Metric meaning: confirm that conversions, CPA, reach, and other measures use the definitions required by your optimization contract.
    • Inference: separate what changed from why it changed. A report can identify a correlation without proving that an audience, creative, or platform action caused it.

    Audience research generated inside the workflow should become a testable hypothesis, not an immediate budget instruction. Translate the output into a specific question: which audience, which offer, which expected behavior, and which metric would disprove the idea? That keeps the assistant useful without allowing polished language to substitute for evidence.

    Measure Manus first by workflow outcomes: whether it reduced repetitive report building, made useful segments easier to inspect, or surfaced a hypothesis worth testing. Claim an advertising performance gain only when a controlled campaign decision produces one. The presence of AI inside Ads Manager does not establish that causal link by itself.

    TikTok entertainment ads: match the AI format to the buying decision

    TikTok’s European rollout separates two useful entertainment jobs. Streaming Ads can personalize a four-title video carousel or multi-title media card using user interaction, while New Title Launch is designed to find high-intent audiences using signals such as genre preference and price sensitivity.

    Choose between them by starting with the decision you need the viewer to make:

    • Use the streaming format for catalog discovery. Multiple titles make sense when the viewer can enter through more than one piece of content and the business outcome is a subscription, viewership action, or another catalog-level result.
    • Use the launch format for a concentrated release. High-intent signals are more relevant when one title, event, or cultural moment needs to produce tickets, subscriptions, or attendance.

    Do not let personalization blur the measurement unit. Tag and review results by title, offer, and eligible market. If a multi-title unit generates strong interaction but only one title produces the intended business outcome, the useful finding is not that the carousel worked equally well. It is that the AI found an effective entry point that deserves a title-level follow-up.

    TikTok says 80% of its users report that the platform influences their streaming decisions. Treat that vendor-supplied figure as context for why TikTok built the formats, not as a forecast for your campaign. It does not mean 80% of the people you reach will subscribe, buy, or attend. Your optimization contract and campaign evidence still determine whether the format earns more spend.

    Test automation without creating an uninterpretable result

    An analyst observes two isolated campaign-testing lanes, one stable and one containing a glowing automation module.

    The hardest failure to detect is not a campaign that performs badly. It is a campaign that changes in several ways, appears to improve, and leaves you unable to explain which change mattered. AI makes this easier to do because an apparently small setting can alter the system’s decision space.

    Use this sequence whenever a platform introduces a new AI feature or changes the meaning of an existing control:

    1. Write one test question. For example: does signal-based audience expansion increase valid conversion volume while keeping CPA and downstream quality within our limits?
    2. Capture the starting state. Save the objective, conversion event, audience inputs, similarity tier, expansion settings, budget, creative, geography, and any other condition that could affect delivery.
    3. Change one category of decision. Test audience freedom, analytical workflow, format selection, creative, or budget separately whenever the platform and campaign volume make that possible.
    4. Choose the evaluation window from the conversion process. Allow the normal conversion lag to pass before judging results. Do not declare a winner from an incomplete cohort simply because the interface is already showing activity.
    5. Use the strongest comparison available. Prefer a platform experiment when a valid one is available. Otherwise, keep surrounding inputs stable and label a before-and-after comparison as observational rather than causal proof.
    6. Inspect business quality as well as platform efficiency. Compare valid purchases, qualified leads, paid subscriptions, ticket completions, attendance, or the downstream outcome specified in the contract.
    7. Make an explicit decision. Scale, hold, narrow, opt out, or revert. Record the evidence and the unresolved uncertainty so the next review does not restart the argument from memory.

    Set a spend ceiling before the test begins. If the experiment can consume a meaningful amount of budget without producing interpretable evidence, reduce its exposure or improve the measurement design first. Automation does not suspend the campaign’s economics.

    Watch for four false wins. More reach without better outcomes is distribution, not success. A lower platform CPA with weaker downstream quality is metric substitution. A faster AI-generated report is a workflow gain, not a campaign lift. An improvement that appears after simultaneous audience, creative, budget, and format changes is a lead for another test, not a reliable conclusion.

    Key takeaways

    • AI advertising control now depends more on objectives, data, constraints, and review rules than on the number of manual audience settings.
    • A seed audience, similarity tier, or behavioral input may guide a model without restricting delivery. Verify hard eligibility boundaries separately.
    • Write an optimization contract that connects the platform event to a business outcome, an economic limit, a quality check, and a named decision owner.
    • Supervise decision-support AI, audience expansion, and content-selection AI differently. They automate different decisions and create different failure modes.
    • Do not award more budget for reach, reporting speed, or a vendor benchmark. Scale only when the campaign improves the predefined business result within its constraints.

    Before your next campaign review, take one active campaign and write down its objective, signal, hard constraints, primary score, quality check, and stop decision. If you cannot fill in all six, do not give the system more freedom yet. Once those answers are clear, you do not need every old manual lever. You have something more useful: accountable control.

    References