An SEO report can be technically accurate and still fail its audience. Rankings, impressions, and sessions describe search activity, but executives usually need to know whether that activity produced revenue, leads, sales, or a meaningful reduction in acquisition cost.
The solution is not to discard operational SEO data. It is to separate diagnostic metrics from decision-making metrics, then present each at the level where it is useful.
Start with the decision the report must support
Before selecting charts, define the business question. Leadership may need to decide whether to maintain investment, shift resources toward higher-value pages, or compare organic search with other acquisition channels. The report should make that decision easier.
Search Engine Land argues that stakeholder reporting should begin with an existing corporate goal rather than whatever data happens to be available. If the goal concerns revenue or lead generation, the headline measures should show SEO’s contribution to that outcome. Rankings can explain performance, but they are not a substitute for it.
Build a measurement chain from visibility to value
A useful report connects early search signals to later commercial results. Visibility can lead to visits, visits can produce qualified actions, and those actions can become orders, opportunities, or revenue. Reporting should reveal where that chain is working and where it breaks.
Conversions by channel, cost per lead, cost per acquisition, profitability, and revenue contribution can therefore serve as executive-level indicators. Engagement and branded search may add context, especially when they help explain growing demand or stronger audience intent. Their role should be explicit rather than presented as proof of value on their own.
The same standard applies to referrals from ChatGPT, Perplexity, AI Overviews, and other AI-driven discovery experiences discussed by the source. A rising visit count is only an intermediate signal. The commercially relevant question is whether those visits generate qualified leads, sales, or revenue.
Organic visibility, paid media and artificial intelligence merge into one connected search ecosystem, where vivid data streams link a creative website with a powerful analytics dashboard.
Key takeaways
Lead with revenue, orders, qualified leads, profitability, or acquisition cost when those measures match the business goal.
Use rankings, impressions, and traffic as diagnostic evidence, not as the main executive result.
Measure AI referral traffic by the same commercial standard applied to conventional organic search.
Keep technical detail available for practitioners while giving leadership a shorter decision-focused view.
Explain attribution limits and disclose negative movement before stakeholders have to uncover it themselves.
Design two reporting layers for two audiences
Executive reporting and operational reporting have different jobs. A leadership view can open with business contribution, compare results with the relevant target, and identify risks or decisions. A practitioner appendix can retain keyword movement, indexing data, technical findings, page-level traffic, and other evidence needed to diagnose causes.
This layered structure prevents technical teams from losing visibility into their work while keeping the main narrative commercially focused. It also improves the language of the report. A title centered on organic search’s contribution to new business sets a different expectation than a generic SEO performance label, even when both draw from the same underlying data.
Branded search and direct visits may also deserve supporting roles when they move alongside organic investment. They do not fit perfectly within conventional channel attribution, so they should be presented as contextual indicators rather than automatically assigned to SEO.
Handle attribution and declining traffic without false precision
Organic search rarely receives clean credit for every sale or lead it influences. Overly elaborate attribution can create a precise-looking number that stakeholders cannot interpret or trust. A documented, consistently applied estimate is often more useful, provided the report explains what is counted, what is excluded, and where uncertainty remains.
The source also notes that traffic is declining for many sites, particularly those historically dependent on clicks to informational pages. When that affects performance, the report should address it directly. Early disclosure protects credibility and creates room to discuss whether commercial outcomes, branded demand, or higher-intent visits tell a different story.
A gradual transition is practical: introduce one or two business-led measures beside the current dashboard, validate the definitions with finance or sales, and move diagnostic metrics into a secondary layer over time. The strongest SEO report is ultimately the one that lets leadership see value, understand uncertainty, and make the next investment decision with confidence.
A conversion total in an advertising dashboard is not a count of unique customers. It is a platform’s calculation of how many outcomes qualify for credit under its own attribution rules.
That distinction explains why Google Ads, Meta, Microsoft Advertising, analytics software, a CRM, and financial records can show different results without any single system necessarily being broken. The useful question is not which dashboard has the one true number, but what each number measures and which decisions it can support.
One sale can generate several conversion claims
The business records one purchase, but multiple platforms may identify an eligible interaction before that purchase. Each platform evaluates the journey from inside its own environment, so the same customer can appear as a conversion in more than one dashboard.
Search Engine Land describes platform reporting as generous rather than inherently false. Advertising companies have a commercial incentive to demonstrate value, but the larger structural issue is that their systems use different windows, signals, models, and identity data. Adding their reported conversions together therefore does not produce a reliable customer or revenue total.
Seven choices that change the reported total
Several measurement decisions can alter which platform receives credit and how much credit it reports:
Attribution window: According to the source, Meta defaults to a seven-day click window plus a one-day view window, while Google Ads using data-driven attribution can look back as far as 90 days. Different periods naturally capture different sets of conversions.
Eligible interaction: Meta can treat actions such as a carousel swipe, video view, or post share as engagement. Google Ads and Microsoft Advertising generally require an ad click, the source reports.
View-through credit: Display, programmatic, affiliate, and YouTube reporting may connect a conversion to an ad impression even when the person never clicked. Web analytics, ecommerce, and CRM systems may not be able to observe that impression.
Credit distribution: The source says Google’s data-driven model can assign fractional credit across interactions in the Google Ads environment. Meta typically uses a one-touch, last-touch approach. These models can describe the same journey differently.
Platform visibility: Google sees Google Ads activity and Meta sees Meta activity. A broader analytics or business system may observe email, organic, affiliate, paid social, and direct visits, then apply its own attribution logic.
Modeled conversions: Platforms estimate outcomes when privacy restrictions or missing identifiers interrupt direct observation. Search Engine Land points to Google’s enhanced conversions and Consent Mode, as well as Meta’s data-matching methods, as examples.
Cross-device matching: Google and Meta can model activity across devices believed to belong to the same person. A business system without the same identity signals may treat those sessions separately.
Use each measurement system for the right job
Platform conversions are operational metrics. They help bidding systems optimize campaigns and help media teams compare performance within a platform. Revenue records, completed orders, qualified opportunities, and other verified business outcomes serve a different purpose: they establish what the organization actually received.
Even a clean implementation with consistent tags and triggers will not force the systems to agree, because correct tracking cannot eliminate differences in attribution policy. A large unexplained change may still justify an audit, but a stable gap can simply reflect known methodological differences.
Organic visibility, paid media and artificial intelligence merge into one connected search ecosystem, where vivid data streams link a creative website with a powerful analytics dashboard.
View-through reporting deserves particular care. It can help assess channels such as YouTube, but it should not automatically be treated as proof that an impression caused the sale. The source recommends validating this kind of credit with incrementality rather than relying on attribution alone.
A practical way to interpret conflicting dashboards
A useful measurement process starts by separating optimization from accounting. The business can define a verified outcome, document each platform’s attribution window and eligible interactions, and distinguish clicked, viewed, and modeled conversions in reporting.
Teams can then compare directional movement across two layers: platform metrics and business results. If campaign indicators improve while verified sales, revenue, or lead quality deteriorate, the discrepancy deserves investigation. If both layers move together, the platform data may remain useful even when the totals never reconcile exactly.
More mature measurement can incorporate incrementality testing, marketing mix modeling, and first-party customer data. The source also argues for returning stronger business signals to advertising systems, including lifetime value, customer acquisition cost, product margin, returns, and lead quality. Those inputs direct optimization toward commercial value rather than the easiest conversion to count.
Key takeaways
A platform conversion is an attribution claim, not automatically a unique sale.
Windows, engagement rules, view-through credit, modeling, and cross-device matching all affect reported totals.
Platform dashboards are best suited to campaign optimization; verified business systems remain the basis for accounting.
Trends should be checked against real outcomes instead of judging performance by one dashboard in isolation.
Incrementality and first-party business signals can move measurement closer to actual commercial impact.
The next step is to make every reported conversion interpretable: document how it was counted, identify the decision it should inform, and connect optimization to outcomes the business can verify.
My eight-year-old daughter desperately wanted a Nintendo Switch. Her “evil” parents—my spouse and I—refused to buy one for her.
She was too young to get a job, so she did what any resourceful child would do: she opened a lemonade stand in front of our house.
She did more than set out a table and a pitcher, though. She designed what amounted to a high-stakes A/B test.
Her hypothesis was simple: if she could persuade more people to stop, she could sell more lemonade and reach her Nintendo Switch goal faster.
Variant A was her two-year-old sister, Julie, stationed out front to attract attention.
Variant B was our dog, Ginger.
I know what I would have guessed.
The dog. Obviously, the dog.
But Julie won—and it was not even close.
The only metric that mattered
The funny part is that my daughter did not really care about the A/B test result. She was not interested in how many people stopped at the stand or which variant produced the best response.
She cared about one outcome and one outcome only:
At this lemonade stand, the cute-dog advantage loses: Variant A, featuring the seller’s young sister, wins the visibility A/B test over Variant B’s golden retriever.
Did she make enough money to buy the Nintendo Switch?
I believe marketers are facing a similar problem right now.
Generative engine optimization (GEO) is the practice of increasing a brand’s visibility in AI-generated answers across platforms such as ChatGPT, Gemini, Perplexity, and AI Overviews.
I can track AI visibility, citation share, impressions, rankings, and nearly every other signal available. Meanwhile, leadership is asking a much simpler question:
Is any of this helping the business grow?
I answer that question with a simple test I call the Dollar Rule: if I cannot put a dollar sign in front of a metric, I treat it as a channel metric rather than a business metric.
That distinction captures the central measurement challenge in GEO.
Most of the numbers we track are valuable operational signals. They show us what is happening within the channel, but leadership wants to understand the resulting business impact.
GEO emerged at precisely the moment attribution was becoming less reliable.
Traditional SEO measurement relied on a straightforward journey: someone searched, clicked, visited a website, and converted. We could trace that path and connect it to an outcome.
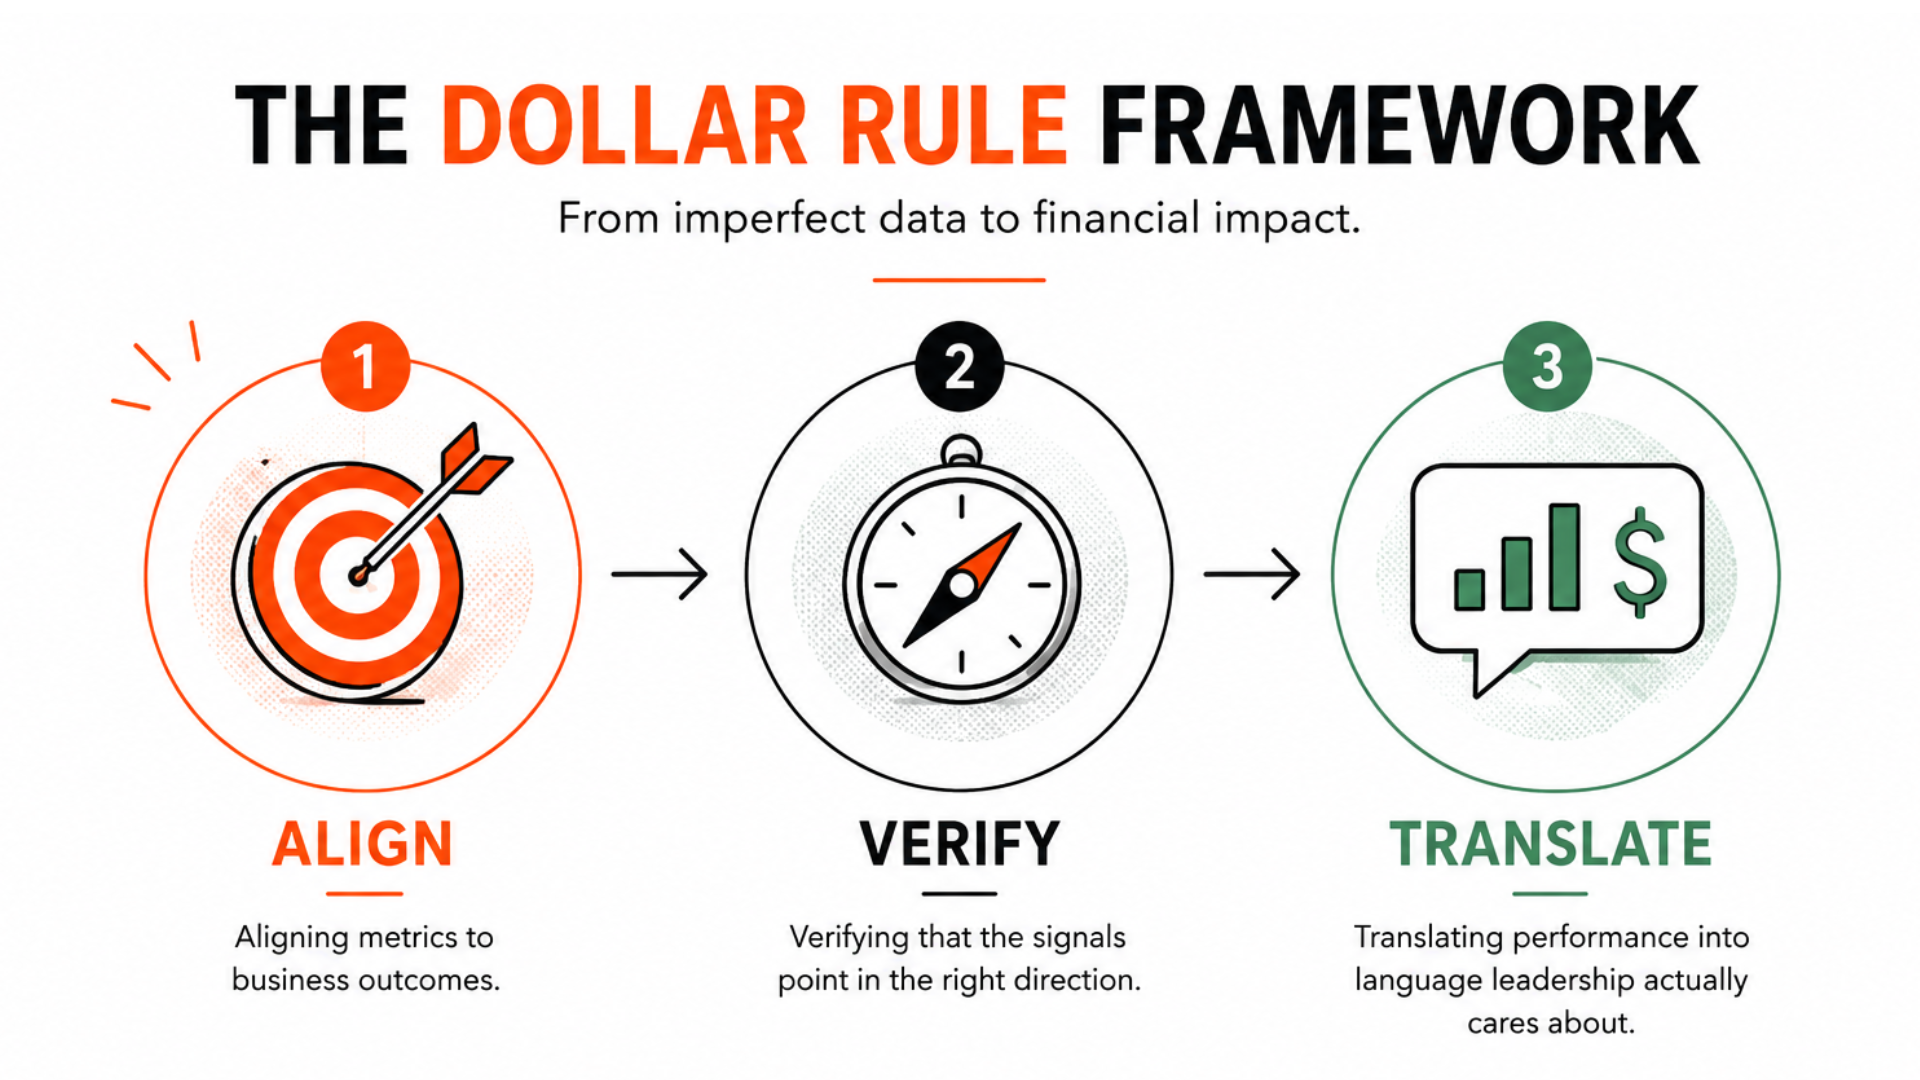
The Dollar Rule turns imperfect GEO attribution into a business case: align metrics with outcomes, verify directional signals, then translate performance into financial language leaders value.
AI search disrupted that model.
I now see buyers forming opinions and making decisions before they ever reach a company’s website. That makes AI’s influence much harder to capture with conventional attribution.
AI search broke attribution
I see buyers discovering brands through AI-generated answers, citations, publishers, forums, reviews, videos, and many other sources. Those touchpoints can shape a decision long before a click occurs, and much of that influence never appears cleanly in analytics.
That is why I see so many teams struggle to justify GEO investments. The visibility is real, and the influence is real, but the attribution is frequently incomplete.
I do not believe waiting for perfect attribution is a sound strategy. Increasingly, it is simply a convenient reason to avoid acting.
When I want leadership to support GEO, I need to connect its influence to business outcomes—even when I cannot connect every interaction to a conversion.
How I make the financial case for GEO
The biggest mistake I see marketers make is trying to prove attribution before proving value.
Before I worry about attribution, I ask whether I am measuring something the business actually considers important. That is where the Dollar Rule becomes useful.
I have found that justifying a GEO investment usually comes down to three actions:
I align my metrics with business outcomes.
I verify that those metrics reliably point me in the right direction.
I translate the evidence into language a CFO understands.
My Dollar Rule is deliberately simple:
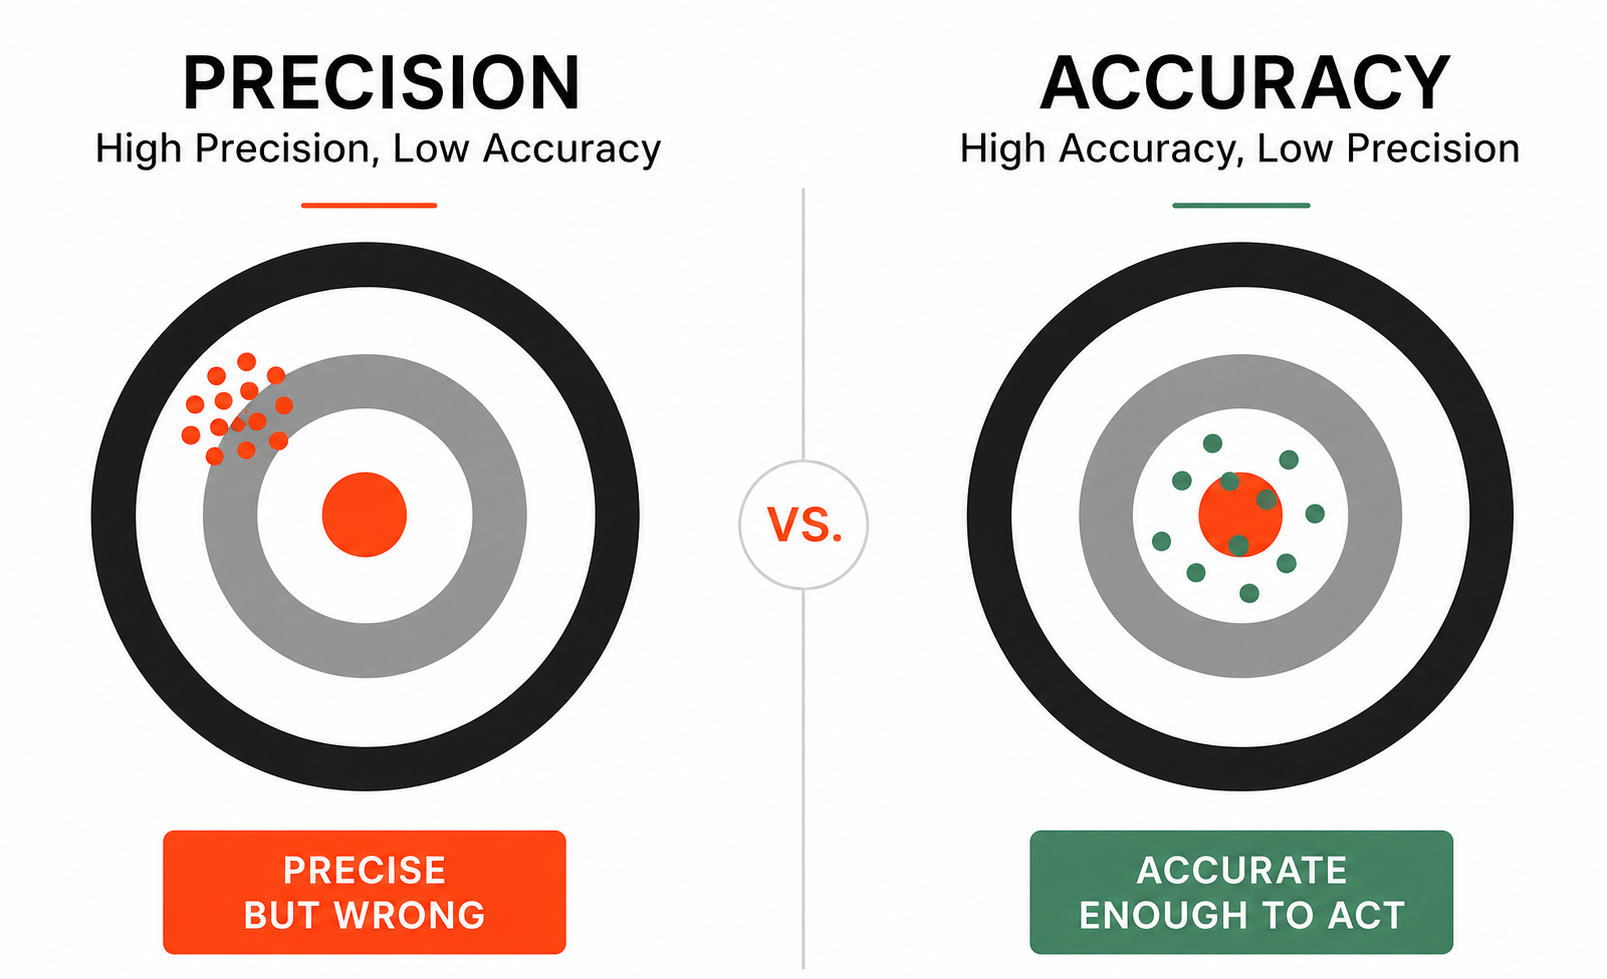
Precision can form a tight cluster in the wrong place; accuracy keeps evidence centered on the outcome that matters. For GEO measurement, a useful estimate can beat an exact but irrelevant metric.
If a number does not translate into dollars, I treat it as a channel metric, not a business metric.
I focus on revenue opportunity, revenue at risk, payback period, and customer acquisition cost. Those metrics live on a P&L, and they are the numbers leadership teams use to evaluate investments.
In my experience, CFOs do not allocate budget because an attribution model looks impressive. They allocate budget based on credible expectations of financial return, risk, and growth.
That principle changes how I measure and present GEO.
I measure influence, not just attribution
AI search did more than change discovery. It changed what I can realistically measure.
Traditional organic attribution assumes a clean sequence: search, click, visit, convert.
AI platforms increasingly answer questions before a click, influence buyers across multiple touchpoints, and withhold the referral data marketers once relied on.
That leaves me in an unusual position: a GEO campaign may be influencing pipeline even while the analytics platform struggles to prove it.
One estimate illustrates the gap. Loamly estimates that roughly 70% of AI-influenced traffic appears as Direct traffic in GA4, making a substantial share of AI’s contribution difficult to trace through traditional attribution models.
I do not take that measurement gap to mean measurement is impossible. I take it as a reason to broaden the evidence I examine.
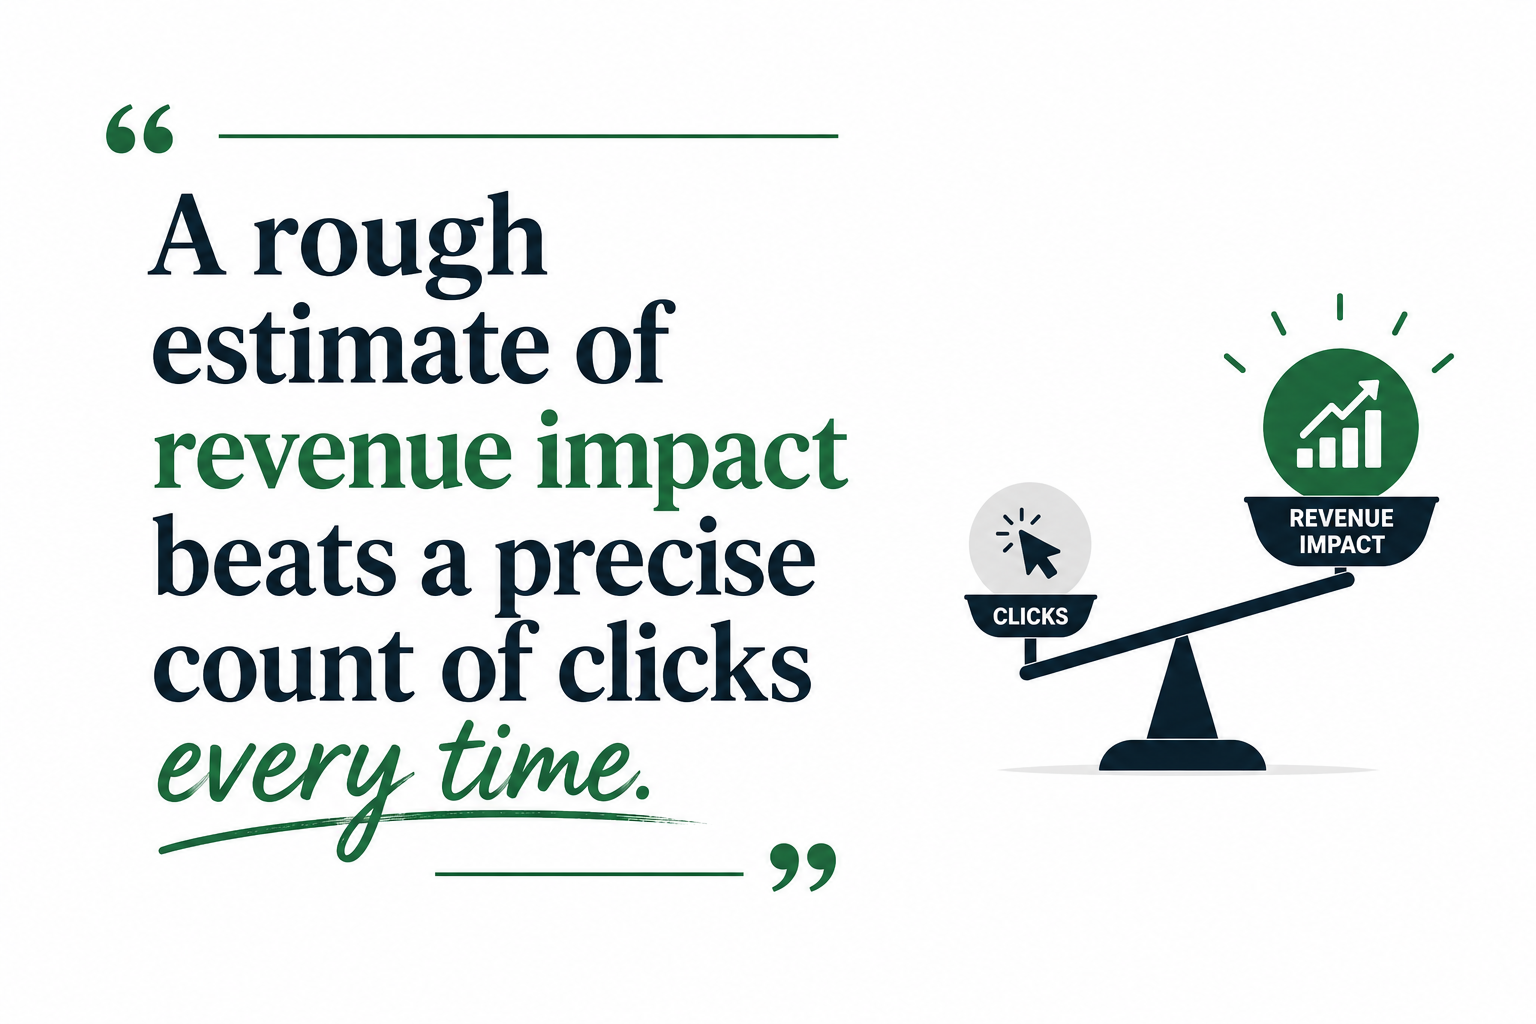
When attribution is incomplete, business value tips the scale: a credible estimate of revenue impact can guide GEO investment better than a perfectly precise tally of clicks.
Instead of asking only, “How many clicks did we receive from AI search?” I ask:
Is our branded search growing?
Are prospects arriving already familiar with our positioning?
Are we being cited in AI answers for questions that drive revenue?
I would not treat any one of these signals as definitive. When I combine them, however, they can create enough confidence to support a responsible investment decision.
That is the essential difference between GEO measurement and traditional SEO measurement. I am not simply measuring a click path; I am measuring market influence.
I believe the marketers who adapt fastest will stop treating attribution as a traffic-sorting exercise. We will combine quantitative signals with qualitative evidence because the goal is not absolute certainty. The goal is confidence that our GEO investment is moving the business in the right direction.
Why I may be measuring the wrong thing
I do not think SEO or GEO metrics are inherently wrong. The problem is that they can be highly precise without being relevant to the business outcome I am trying to influence. They tell me exactly what happened inside a channel, but not whether the business is moving in the right direction.
SEO tools are packed with precise numbers. The challenge is that many of those numbers have only a weak connection to business outcomes.
Precise = exact
Accurate = connected to business outcomes
I have found that leadership would rather receive a roughly correct estimate of revenue impact than a perfectly precise count of clicks.
I studied engineering in school, where we spent a great deal of time discussing precision: how exact and repeatable a measurement is, right down to the decimal point.
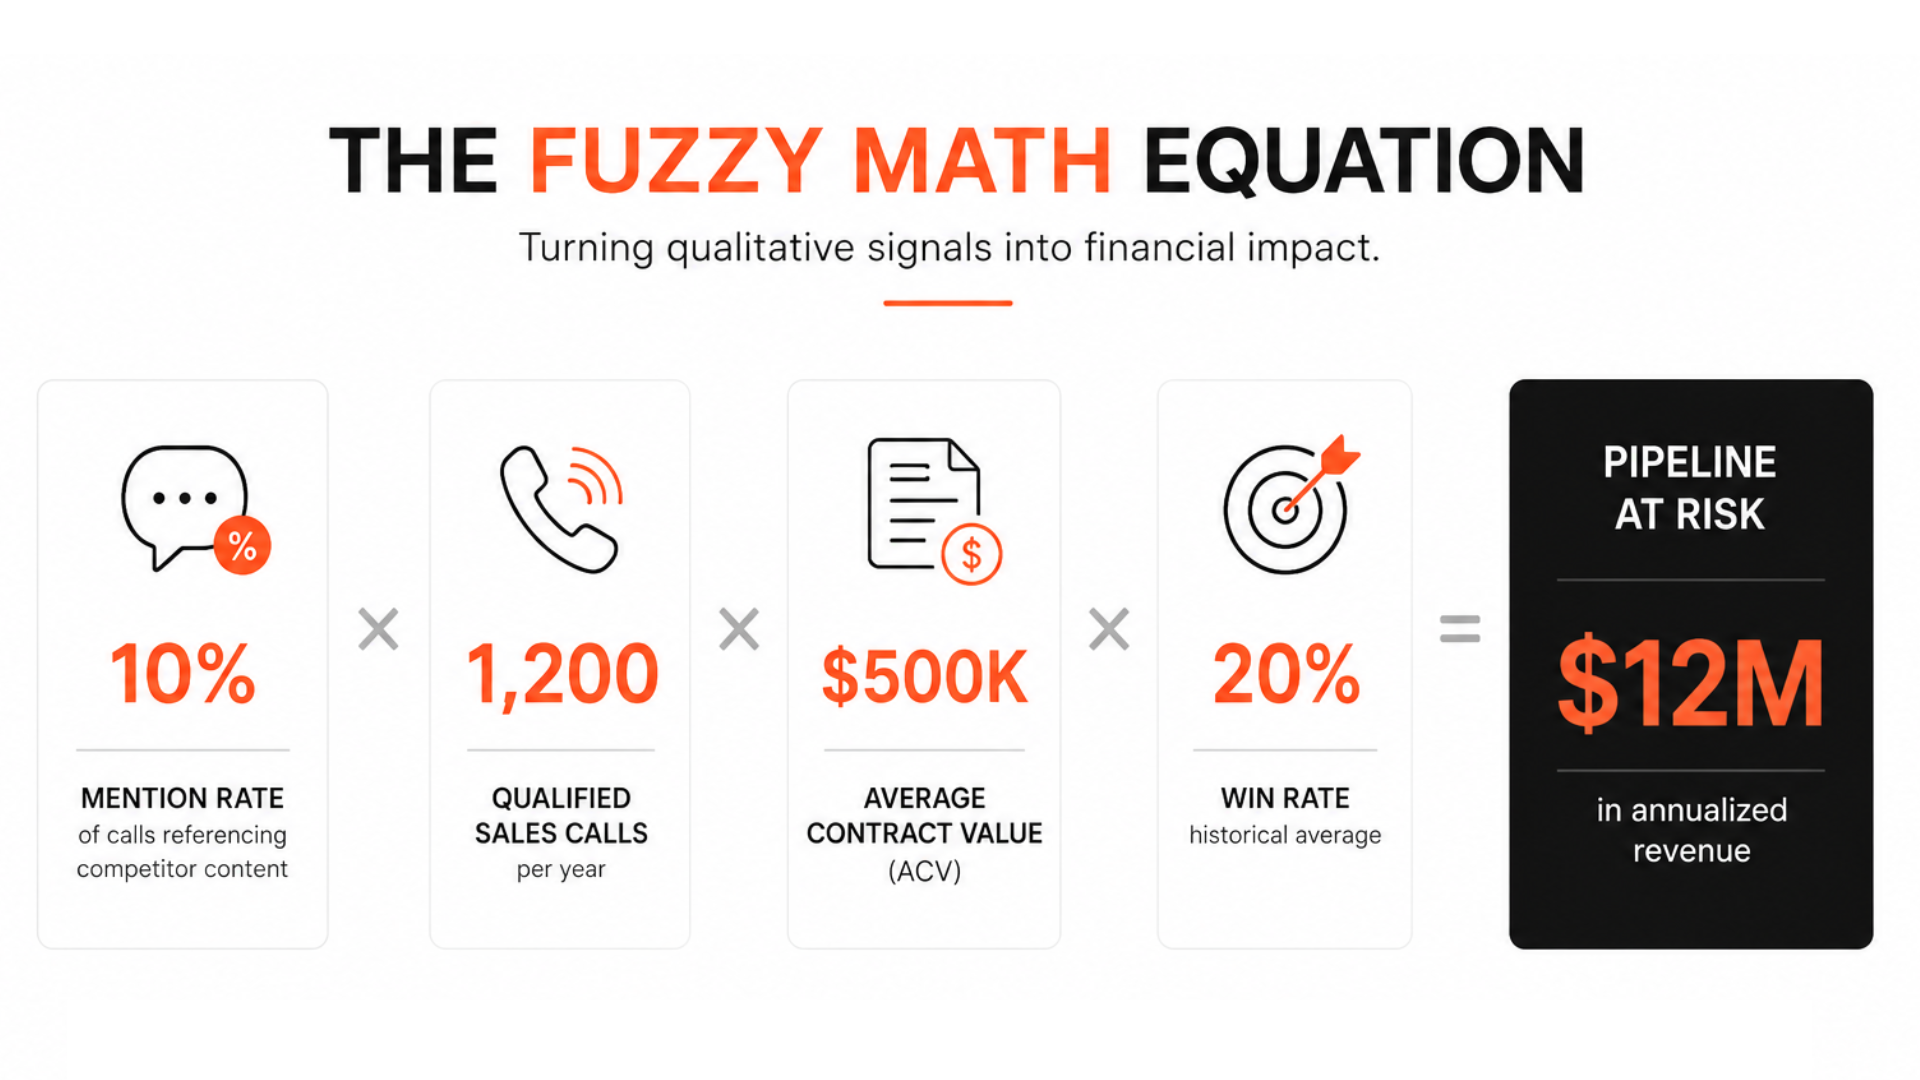
The fuzzy math equation turns a qualitative sales signal into a figure leaders understand: a 10% competitor-content mention rate translates to $12 million in annualized pipeline at risk.
In marketing, I see that kind of precision in organic clicks, rankings, impressions, and click-through rates. Tools such as Google Search Console can give me extremely exact figures for those channel activities.
The problem is that a precise channel number is not necessarily accurate in the business sense. I consider a measurement accurate when it tells me whether I am getting closer to an outcome that matters.
Even when those measurements are not perfectly precise, I find them more useful if they point toward the bullseye: the business outcomes leadership cares about.
Knowing that a page received 40 organic clicks is precise. It tells me almost nothing about whether we are winning or losing in the market—just as a visitor count did not tell my daughter whether she was close to buying her Nintendo Switch.
That is how I apply the Dollar Rule in practice. When attribution is incomplete, I translate the evidence I do have into a directional estimate of business impact.
Why I put revenue ahead of attribution
For me, a rough number tied to revenue beats an exact number tied only to channel activity.
When reliable attribution is unavailable, I build the case from signals I can actually access and then work through the math.
I do not use fuzzy math to replace SEO metrics or attribution. I use it alongside them when traffic-based attribution cannot capture the influence taking place.
One of our healthcare clients gave us a useful example.
Prospects were arriving at sales calls already convinced of claims that were not true.
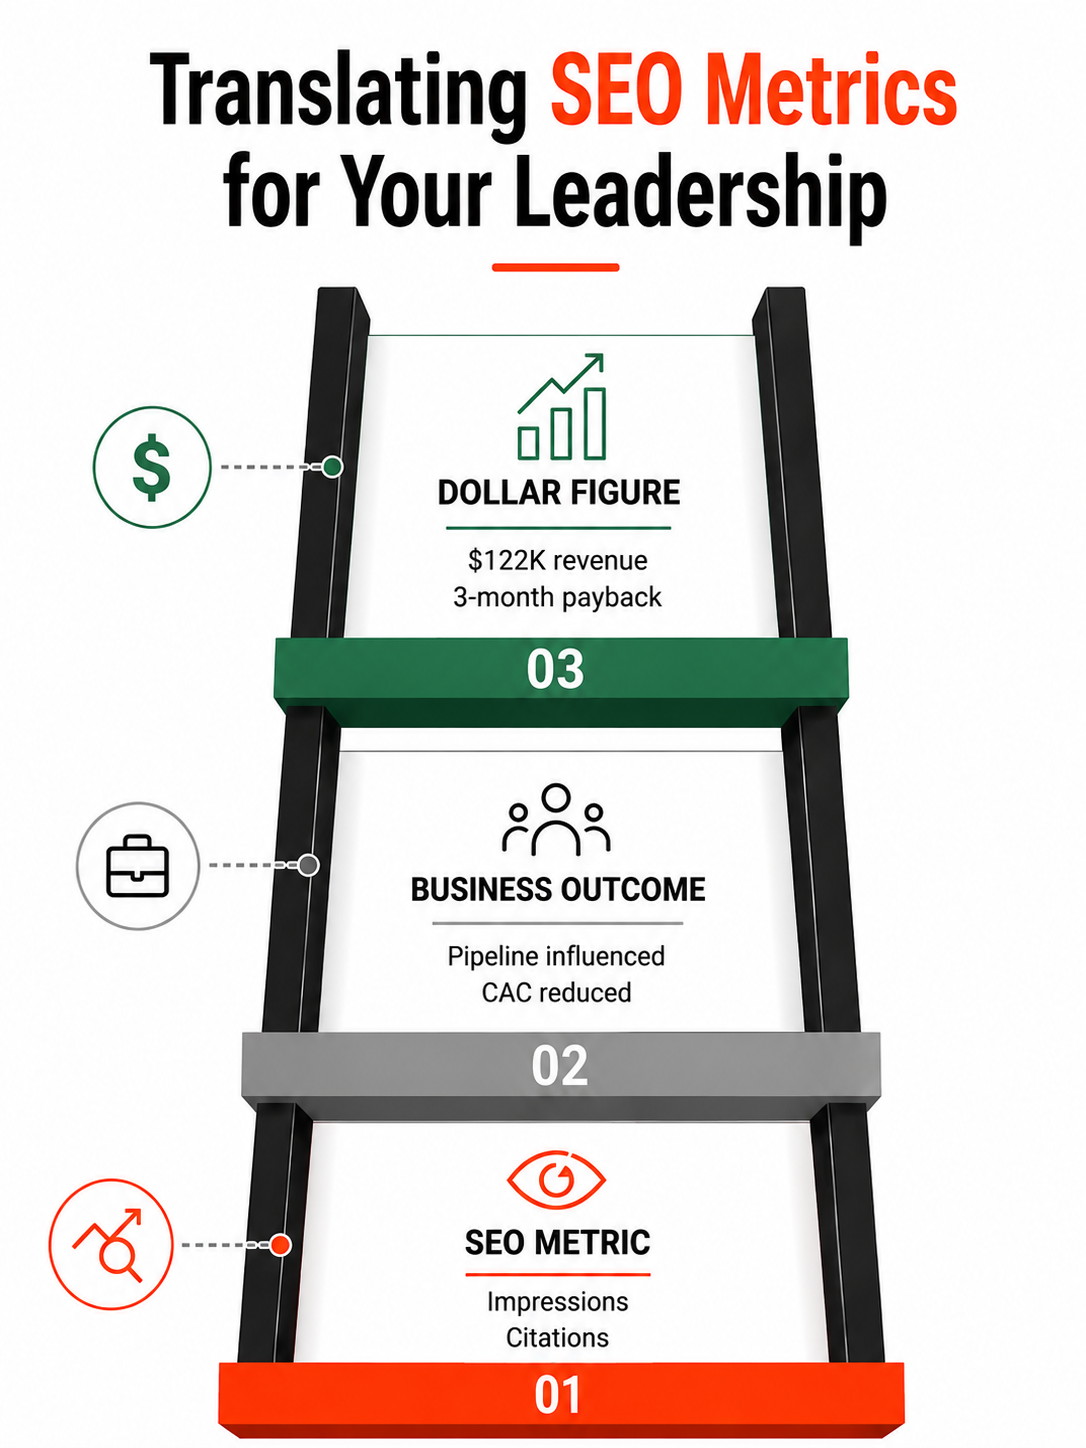
Climb from channel data to executive value: translate SEO impressions and citations into pipeline and lower CAC, then show leadership what matters—$122K in revenue and a three-month payback.
We traced the source to a competitor’s comparison page. That page was shaping buyer perceptions long before our client had an opportunity to present its side of the story.
We recommended publishing content that would counter the narrative, but the leadership team did not believe there was enough evidence to justify a response. We needed to make a stronger business case.
SEO tools estimated that the competitor’s page received roughly 40 organic visits per month. Whether that estimate was right or wrong was beside the point: it did not measure the page’s influence on active buyers.
So we looked for evidence that was closer to the business outcome.
We spoke with our client’s salespeople. They told us that roughly 10% of qualified B2B discovery calls included unprompted mentions of specific claims from the competitor’s page.
That was not a clean number suitable for an exact attribution model, but we could not dismiss it. The influence was real, and it was showing up during live sales conversations.
We used that evidence to build a directional calculation:
10% mention rate on discovery calls
× 1,200 qualified B2B sales calls per year
× $500,000 average contract value
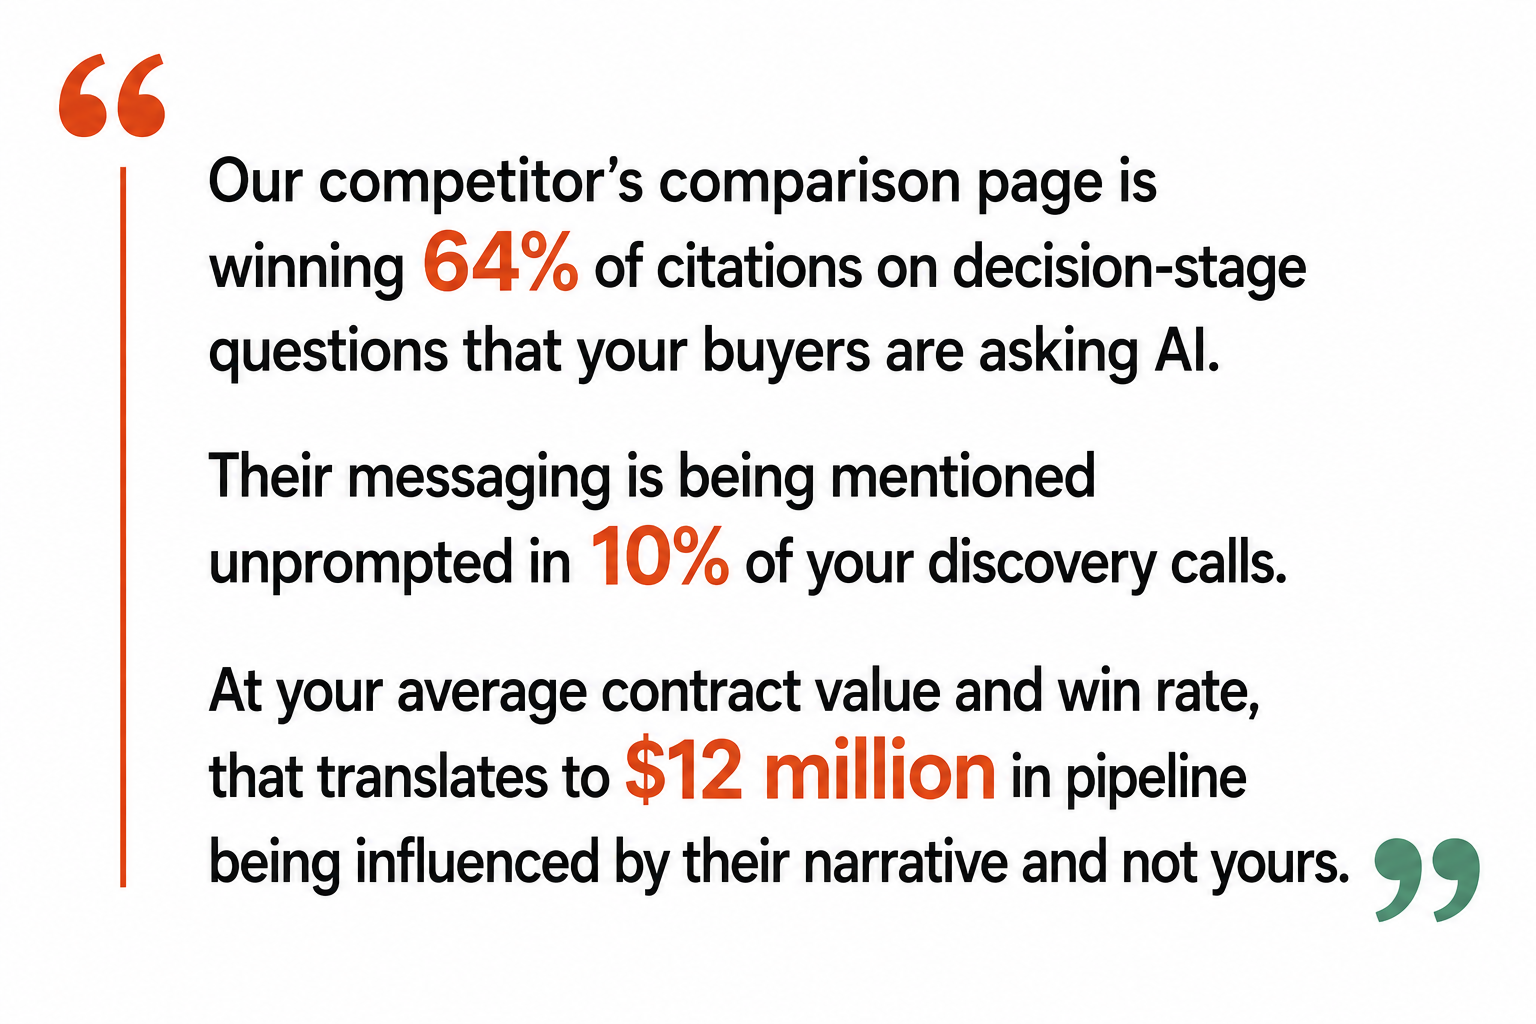
A competitor’s comparison page earns 64% of citations on decision-stage AI questions and surfaces in 10% of discovery calls—putting an estimated $12 million in pipeline under its narrative.
× 20% average win rate
= $12 million in annualized revenue being influenced by the competitor’s narrative
I did not present this as a forecast or a formal attribution model. It was a directional estimate of how much revenue the competitor’s messaging could influence.
That reframing changed the conversation. We stopped debating 40 clicks per month and started discussing $12 million in influenced revenue.
That is the number we brought to leadership—not impressions or citation share, but $12 million in revenue being influenced by a page our client had declined to counter. That is a number a CFO immediately understands.
I lead with value metrics
If we enter a GEO campaign review and lead with rising citation share or growing impressions, our CMO may lose interest and our CFO may wonder what those numbers mean financially. In the worst case, we can lose budget because leadership cannot see the return.
Here is how we framed the situation for our client’s leadership team:
I have learned that leadership funds marketing campaigns based on business impact. Translating a problem into dollars changes the nature of the discussion.
The decision-makers did not need certainty. They needed a credible financial story supported by leading indicators, observable momentum, and enough evidence to inspire confidence.
I focus on what the business values
That is what my eight-year-old intuitively understood at her lemonade stand. Her goal was never to count visitors. Her goal was to buy the Nintendo Switch.
A neon-lit smartphone imagines advertising inside ChatGPT, highlighting how AI platforms are reshaping brand discovery, GEO strategy, and the measurement of marketing influence.
GEO has created anxiety because it disrupted attribution models we relied on for years. But I remind myself that attribution was never the ultimate objective.
The real objective is business growth.
If I can connect GEO activity to revenue opportunity, revenue at risk, pipeline influence, or customer acquisition, I do not need perfect certainty to justify the investment.
I need credible evidence that our GEO campaigns are moving the business in the right direction.
Precise metrics tell me what happened. Relevant metrics tell me whether we are winning.
Before I deliver my next GEO report, I can examine every metric on the page and ask one question:
If this metric doubled tomorrow, would the business care?
Then I ask the follow-up:
Can I translate this metric into revenue opportunity, revenue at risk, pipeline influence, or customer acquisition cost?
If I cannot, I am probably reporting channel impact rather than business impact—and that is unlikely to justify the next GEO investment.