Tag: CPC

  • Why I Turn Off Google Search Partners in Google Ads

    Why I Turn Off Google Search Partners in Google Ads

    When I’m running Google Ads in 2026, one setting I always check carefully is “Search Partners.” It often appears in campaign settings as a simple way to extend reach beyond Google Search, and on the surface, that sounds useful.

    But more reach does not automatically mean better reach. In my experience, Search Partners can bring traffic, but the quality of that traffic is usually the problem.

    For most advertisers, I would not leave Search Partners enabled by default. I’d rather start with the main Google Search results page, prove the campaign can convert, and only then consider whether extra volume is worth testing.

    What are Google Search Partners?

    Google Search Partners are third-party sites that use Google-powered search results. When someone searches on those sites, your ad may be eligible to show there. This network can include YouTube, directories, other search experiences, and even parked domains.

    That sounds like a broader opportunity, but I usually see a familiar pattern: lots of impressions, plenty of clicks, and cheaper CPCs than Google Search. The issue is that cheaper clicks are not always useful clicks. Real conversions and meaningful business value from these placements are often limited.

    If I’m using conversion-focused Smart Bidding, I often see Search Partner spend fall naturally over time. The bidding system eventually learns that those placements are not producing the conversions it wants, so it stops pushing budget there.

    How Search Partners differ from the Google Display Network

    I see advertisers confuse Search Partners with the Google Display Network all the time. Some websites can be involved in both, but the intent and placement logic are different.

    The Google Display Network is made up of websites and apps that use AdSense, where ads can appear while people browse content. It can show up as a placement option in Demand Gen, Video campaigns where it is called “Video Partners,” and Performance Max campaigns.

    Search Partners are tied to search-based activity. That is why they apply to Search, Shopping, and Performance Max campaigns rather than standard Display placements.

    How I audit Search Partner performance

    I do not recommend taking anyone’s word for it, including mine. The better move is to check what Search Partners are actually doing inside your own Google Ads account.

    Futuristic data archive with glowing server-like filing cabinets, stacked documents, and network lights symbolizing AI marketing data infrastructure.
    Rows of illuminated data cabinets and paper files stretch into the distance, capturing the pressure on marketers to turn fragmented customer data into a smarter performance engine.

    For Search or Shopping campaigns

    In Google Ads, I go to the campaign view, select Segment, and choose Network (with search partners). This splits performance into separate rows for Google Search and Search Partners, which makes the difference much easier to see.

    What I usually find is a lot of Search Partner impressions and clicks, often at lower CPCs than Google Search. But when I look for true conversions, the results are usually weak unless the account is tracking something shallow or easy to manipulate, such as a page view or a low-friction form fill.

    For Performance Max campaigns

    Performance Max works differently. Search Partners are required for this campaign type, so I cannot simply opt out. What I can do is monitor the activity through the Channel Performance report.

    If I see heavy Search Partner spend in a Performance Max campaign, I treat it as a signal to review conversion tracking, bid strategy settings, and the quality of the conversion actions being used for optimization.

    Check the Content Suitability report

    For more transparency, I also check the Content Suitability report under Insights and reports. This report can show the actual websites or YouTube channels where ads appeared on the Search Partner network.

    That list is often enough to make the decision clear. Once I see where the ads have been running, I usually find many placements that look low quality, irrelevant, or simply not worth the spend.

    In Google Ads, many decisions really do depend on the account, the market, and the goal. This is one of the few areas where my starting recommendation is straightforward.

    If I’m building a new Search or Shopping campaign, I leave Search Partners unchecked. After the campaign is performing well and has strong conversion data, I may test Search Partners for added volume. Until then, I keep the budget focused on the main Google SERP.

    This article is part of the ongoing Search Engine Land series, Everything you need to know about Google Ads in less than 3 minutes. In each edition, Jyll highlights a different Google Ads feature and explains what advertisers need to know to get better results in a quick 3-minute read.


    Inspired by this post on Search Engine Land.


    crushpress.ai community screenshot
  • How I Defend Branded Traffic From Competitor Google Ads

    How I Defend Branded Traffic From Competitor Google Ads

    How competitors target your branded traffic with Google Ads

    I no longer think of branded search protection as simply bidding on my own brand name. Competitors can position themselves against my brand through landing pages, ad copy, modifier keywords, and Google Ads automation, often in ways that look completely legitimate.

    The real pressure often goes beyond keyword bids. Comparison pages that pass review, dynamic keyword insertion that pulls brand names into headlines, and policy gaps that allow competitors to appear beside my brand can quietly weaken performance without clearly breaking Google’s rules.

    By the time I notice the pattern, the damage may already be visible in branded CPCs, impression share, or conversion rate. That is why I pay close attention to how these tactics work, how to spot them early, and how to respond without overreacting.

    1. Dynamic keyword insertion

    Dynamic keyword insertion, or DKI, is designed to make ads feel more relevant by automatically inserting a user’s search query into the headline. In competitive brand auctions, I see it as a tactic that can create a meaningful loophole.

    If a competitor bids on my branded terms and uses DKI, Google can dynamically place my brand name in the ad headline in real time, even if the competitor never typed my trademark into the ad copy.

    That distinction matters. The competitor is not explicitly writing my trademark into the ad. Google is inserting the searcher’s query. To the user, the ad may look like it directly references my brand. Inside Google’s system, it is treated as standard query matching.

    The result is frustrating: an ad can appear to reference my brand, capture high-intent traffic, and send that user to a competing offer without obviously violating policy.

    I have seen this happen from both sides. Sometimes competitors use it intentionally. Sometimes brands trigger it in their own accounts without realizing what is happening. In one case, a competitor’s name started appearing in a brand’s ad headlines because of DKI. No one had written that name into the ad; Google inserted it based on the query.

    The bigger challenge is that I cannot reliably detect this from inside Google Ads alone. I have to audit the search results page directly. Otherwise, I may only notice the problem after branded CPCs rise or conversion rates start to slip.

    Dig deeper: When to use branded and competitor keywords in PPC

    2. Comparison landing pages

    Comparison landing pages sit in a gray area. Google does not evaluate landing page content the same way it reviews ad copy. If a competitor creates a page such as “[Your Company] alternatives” or “[Competitor vs. Your Company]” and bids on my branded terms, the ad can still run as long as the ad itself stays neutral.

    The ad does not have to mention my brand at all. It can use broad language like “Find the right solution,” “Compare top tools,” or “See your options.” The competitive positioning happens after the click.

    Once the user lands on the page, the comparison does the work. The page may include feature charts, pricing callouts, benefit comparisons, and carefully framed language such as “Why teams choose us over [Your Company].” The page may not be misleading or technically noncompliant, but the intent is obvious.

    Google’s review process tends to focus on the ad rather than the full post-click experience. As long as the ad copy does not make explicit competitive claims, the system may treat it as compliant, even when the landing page is built entirely around positioning against my brand.

    This works because landing page relevance can reinforce auction strength. A page built around my brand and the keywords in the ad group may align closely with the searcher’s intent. Even if the ad copy stays generic, the post-click experience can help the ad compete because it matches what the searcher is trying to evaluate.

    When I respond, I do not focus only on one advertiser. If competitors are using comparison-driven experiences to intercept branded demand, I look at the broader search ecosystem around my brand.

    • I strengthen my presence across the full search results page, not just my own ads.
    • I invest in publishers, review platforms, directories, analysts, and affiliates that influence comparison and alternative searches.
    • I work to build a search results page where credible third-party sources reinforce my positioning when prospects search for alternatives, comparisons, reviews, or competitor evaluations.

    The brands that win these moments do not rely only on their own landing pages. They shape the narrative across the entire search results page.

    Dig deeper: Own your branded search: Building a competitive PPC defense

    3. Brand modifier keywords

    Brand keyword bidding is not new, but I see competitors using it in more strategic ways. Instead of bidding only on my exact brand name, they target brand-and-modifier combinations that give them more flexibility.

    For example, if my brand were “Acme Project Manager,” a competitor might bid on searches like “Acme Project Manager alternative,” “Acme vs. competitors,” or “Acme pricing review.” Their ad copy can avoid mentioning Acme by name while still using the search context to position itself as the alternative.

    Google allows this because the ad itself does not explicitly mention my brand. The searcher does. Modifier keywords provide enough context for the ad to compete without directly referencing a trademark in the copy.

    When competitors bid on terms like “[Your Brand] alternative” or “[Your Brand] vs.,” they are targeting lower-funnel research queries. These searchers may not convert at the same rate as people searching only for my brand, but they can still change the auction dynamics.

    That pressure can increase branded CPCs, force me to spend more to maintain visibility, and raise the cost of my core brand terms, even if competitors convert relatively few of those modifier searches.

    I treat brand modifier queries as a separate audience. I segment them by intent, including pricing, reviews, alternatives, competitors, and comparisons, and I monitor Auction Insights for each group. Exact brand searches and comparison-driven searches need different strategies.

    I also build dedicated landing pages and messaging for each modifier intent. That helps me control high-intent research moments without overpaying for every branded variation.

    Dig deeper: How to benchmark PPC competitors: The definitive guide

    How I monitor and respond

    Manual SERP checks are useful, but they do not scale. If I have meaningful branded spend or active competitors targeting my terms, I use automated brand monitoring tools to identify activity across devices, geographies, and browsers that manual checks can miss.

    This is especially important when competitors use geotargeting, dayparting, or other tactics designed to limit visibility. A competitor may not appear every time I check manually, but that does not mean the activity is not happening.

    I also use a clear escalation framework. If a competitor uses my trademarked term directly in ad copy, I start with Google’s trademark complaint process. If the behavior continues after enforcement action, I document the pattern and involve legal counsel.

    Most other scenarios, including modifier bidding, comparison pages, and competitive positioning, are usually better handled through PPC strategy than legal action.

    Before I decide how aggressively to respond, I measure the economics. I estimate the monthly cost of competitor activity by calculating the increase in branded CPCs and the additional spend required to maintain visibility.

    Then I compare that number with the cost of my response, whether that means higher bids, new landing pages, expanded monitoring, or more investment in third-party visibility. My goal is to keep the cost of defending the brand lower than the value I am protecting.

    Build a proportionate response

    Competitors use modifier keywords, comparison landing pages, dynamic keyword insertion, and other policy-compliant tactics to influence buyers during critical research moments. Often, they can do this while staying within Google’s policies.

    The strongest defense I can build combines continuous monitoring, thoughtful audience segmentation, proportionate responses, and disciplined budget decisions.

    Competitive PPC success comes from understanding the auction, shaping the narrative across search results, and investing where my defensive efforts deliver the greatest return.


    Inspired by this post on Search Engine Land.


    crushpress.ai community screenshot
  • LinkedIn Ads CPC Benchmarks: What I Budget vs Google

    LinkedIn Ads CPC Benchmarks: What I Budget vs Google

    Linkedin Ads vs Google Ads

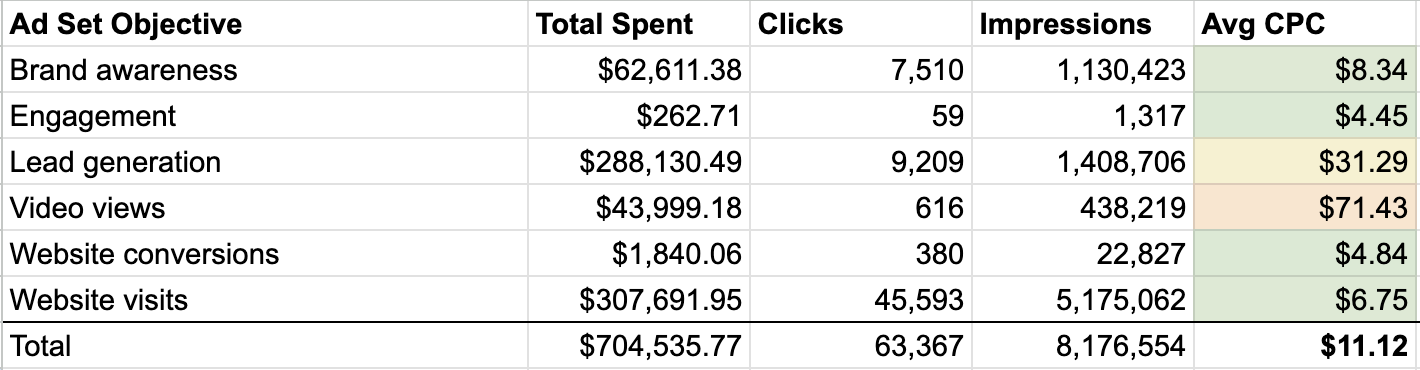
    I know LinkedIn Ads has a reputation for being expensive, and at first glance, the data backs that up. Across the client accounts I analyzed, LinkedIn’s average CPC was $11.12, compared with $5.45 on Google Ads.

    But that simple comparison misses the more useful story. When I compare the cost of reaching new, high-intent B2B buyers, the gap gets much smaller. Non-branded Google Search campaigns averaged a $12.48 CPC, while comparable LinkedIn prospecting campaigns averaged $13.94.

    To understand how LinkedIn CPCs really compare with Google Ads across campaign types and industries, I reviewed more than $700,000 in LinkedIn ad spend and compared it with CPC data from the same accounts on Google Ads.

    What I included in this analysis

    I focused on CPC and performance data from clients that had active campaigns on both LinkedIn Ads and Google Ads over the past year.

    The main questions I wanted to answer were straightforward: What CPCs are we actually seeing? Do CPCs change by ad objective and industry? And how do those costs compare with Google Ads?

    For LinkedIn Ads, I analyzed more than $700,000 in spend across 63,000+ clicks and 8.1 million impressions.

    The clients fell into two main business categories: B2B SaaS, which represented approximately 97% of spend, and professional services.

    I looked at LinkedIn CPCs by ad set objective and business category. For Google Ads, I pulled CPC data from the same client accounts across branded search, non-branded search, Demand Gen, and display campaigns.

    Client names are withheld. The date range for this analysis was May 2025 through May 2026.
    Image

    LinkedIn looks more expensive, but the comparison needs context

    LinkedIn’s blended average CPC across all objectives was $11.12. Google’s blended average CPC across all campaign types was $5.45. On the surface, LinkedIn costs about twice as much per click.

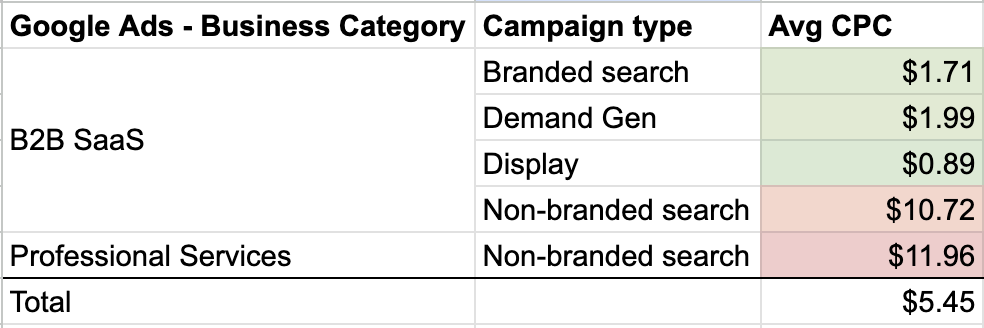
    There is an important caveat. In Google Ads, a large share of those lower-cost clicks came from display campaigns, which averaged $0.89 per click, and branded search, which averaged $1.71 per click. Both are naturally less expensive because display generally reaches lower-intent audiences, while branded search captures people already looking for your company.

    When I narrow the comparison to the cost of reaching new, high-intent audiences, the difference becomes much less dramatic.

    • Google Ads non-branded search averaged a $12.48 CPC across the clients in this study.
    • LinkedIn prospecting campaigns, excluding retargeting and using lead generation, website conversion, or website visit objectives, averaged a $13.94 CPC.

    I used those LinkedIn objectives because they most closely represent high-intent direct-response campaigns, which makes the comparison with non-branded search more useful.

    When I compare the cost of reaching a new audience, LinkedIn is still more expensive, but it is not twice as expensive. In practical terms, I am looking at roughly $12 CPCs on Google and $14 CPCs on LinkedIn.

    LinkedIn CPCs change a lot by objective

    One of the clearest findings in this data set is how widely LinkedIn CPCs vary by campaign objective.

    • Website visits: $6.75
    • Brand awareness: $8.34
    • Website conversions: $4.84
    • Engagement: $4.45
    • Lead generation: $31.29
    • Video views: $71.43

    Lead generation campaigns, where LinkedIn lead gen forms capture contact information directly inside the platform, cost nearly five times more per click than website visit campaigns.

    That higher CPC can still make sense because these campaigns often convert at much higher rates than ads that send people to a website or landing page.
    Image

    Here is the full breakdown of CPCs by campaign objective:

    LinkedIn CPCs by campaign objective

    The number that jumps out most is video views. CPCs for those campaigns look extremely high, but cost per view is the more relevant metric there, so CPC alone can be misleading.

    If I were planning a LinkedIn campaign focused on click volume or site traffic, I would budget for CPCs in the $6-$8 range. For lead gen ads, which in my experience often produce stronger conversion rates and better lead quality, I would plan for $30+ CPCs.

    LinkedIn CPCs also change by industry

    The two business categories in this analysis showed noticeably different CPC profiles on LinkedIn.

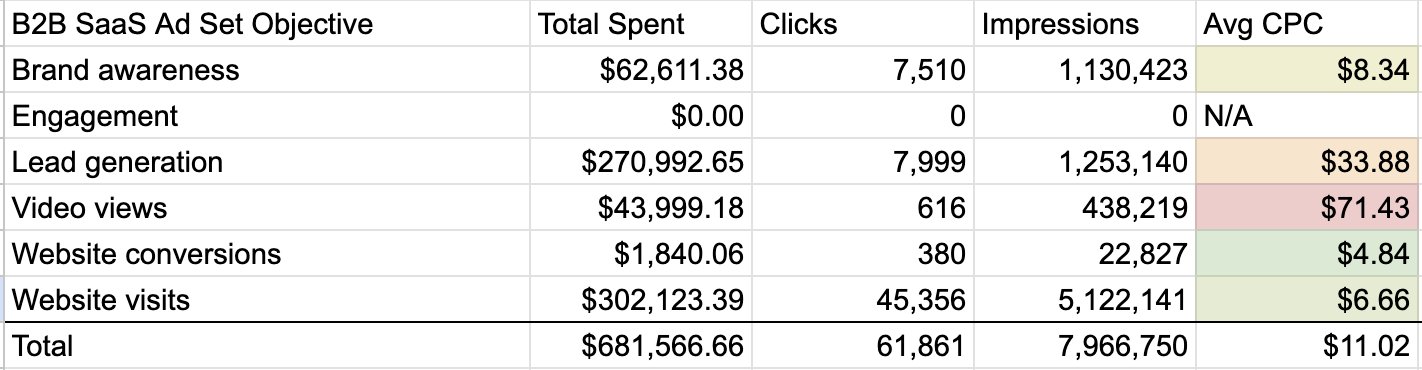
    • B2B SaaS: $11.02 average CPC on $681,000 in spend
    • Professional services: $15.25 average CPC on $23,000 in spend

    I would be careful not to overstate that comparison because the spend levels were very different. B2B SaaS had a much broader mix of campaign types, which likely affected the average CPC. The professional services campaigns also used very specific targeting, which may have pushed CPCs higher.

    B2B SaaS CPCs by campaign objective:

    B2B SaaS LinkedIn CPCs by campaign objective

    Professional services CPCs by campaign objective:

    Professional services LinkedIn CPCs by campaign objective

    One interesting twist is that lead gen CPCs in professional services were lower than website visit CPCs. Lead gen CPCs were also much lower for professional services than they were for B2B SaaS.

    Image

    If I were budgeting for a professional services firm on LinkedIn, I would factor in $15-$20 CPCs. For B2B SaaS, I would plan for a wider range, roughly $7-$35, depending on the campaign objective.


    How this compares with Google Ads

    The pattern is fairly consistent across channels. Professional services had higher CPCs than B2B SaaS in this data set. Even when I compare only non-branded search between the two industries, the CPCs are closer, but professional services still comes out higher.

    Here is the breakdown of Google CPCs by campaign type:

    Google Ads CPCs by campaign type

    What I would budget for LinkedIn Ads

    Your targeting will have a major impact on CPCs and budget needs, but I use this data as a practical planning framework.

    Minimum viable budget: $3,000-$5,000 per month

    Below this level, I would not expect enough traffic to drive meaningful lead volume or conversions. You may still be able to get started, but trend-spotting will be slow, and you will probably be limited to one or two campaigns.

    Testing and learning: $5,000-$10,000 per month

    At this level, I would expect enough budget to run two or three objectives, launch more campaigns, test creative and audiences, and generate more meaningful lead volume.

    Scaling: $10,000+ per month

    With this budget, I can run always-on brand awareness and thought leadership campaigns alongside lead gen and website visit campaigns. I can also support event registrations, test more advanced list-targeted campaigns, and use retargeting without starving direct-response efforts.

    For B2B SaaS or professional services companies with an ACV above $20,000, I would rarely recommend starting LinkedIn with less than $5,000 per month. A single closed deal worth $30,000-$50,000 in ACV can justify meaningful investment, even at a $500+ CPL, as long as the pipeline quality is there.
    Image

    The B2B channel mix I recommend

    For most B2B clients, I do not see LinkedIn and Google as either-or channels. I use them for different jobs.

    Use Google Ads and Microsoft Ads for intent capture

    Non-branded search reaches buyers who are actively researching. Branded search and remarketing are lower-cost and essential. If someone is searching for your category keywords, I want your brand to be visible.

    I also use Demand Gen and Performance Max where they make sense to fill gaps and support brand awareness.

    Use LinkedIn Ads for audience-led demand generation

    If the ideal customer profile is highly specific, such as VP-level decision-makers at mid-market SaaS companies, LinkedIn’s targeting is hard to replace. No other platform gives me the same ability to reach that kind of professional audience at scale.

    Run both channels in parallel

    The strongest setup is to run both channels together. Google captures existing demand. LinkedIn helps create new demand and keeps the brand visible to the exact buyers I want in the pipeline.

    Why I still think LinkedIn is worth the higher CPCs

    LinkedIn is more expensive than Google on a raw CPC basis. But when I compare the platforms more fairly, with both reaching cold, qualified B2B buyers, the gap narrows significantly.

    Higher CPCs can still be worth paying if they put the brand in front of the right customers earlier in the decision-making process. Over time, that can be more valuable than relying only on high-intent keywords after buyers have already narrowed their list of options.

    The best scenario is for the brand to become an active part of the buyer’s decision, shaping the narrative before competitors do it instead.

    My take is simple: I use LinkedIn Ads to build intent and tell the story, and I use Google Ads and Microsoft Ads to capture intent. The right budget depends on targeting, but I want enough spend to generate at least 100 clicks per month. Anything less usually means spending money without giving the system enough data to learn from.


    Inspired by this post on Search Engine Land.


    crushpress.ai community screenshot
  • Channel Strategies: Broad Approaches vs. Focused Commitment

    Channel Strategies: Broad Approaches vs. Focused Commitment

    When I first started looking at budget allocation, I was tempted to believe that every marketing channel followed the same path: spend a little, get a lot, but with diminishing returns.

    Visually, it’s easy to assume all channels mimic this pattern.

    The typical log-shaped curve illustrates that the first dollar you spend is often the most productive. With this mindset, spreading the budget across numerous channels seems like the go-to strategy.

    However, I quickly learned not all channels conform to this model. Some require much more than just a sprinkle of funds to be effective. These channels start with a less efficient spend but eventually pay off if given time to warm up. This condition shifts away from the usual ‘test small, scale the winners’ strategy many marketers follow.

    ```json
{
  "alt": "Comparison charts showing Average CPA and Marginal CPA with costs for different conversion levels.",
  "caption": "Explore cost efficiency with Average and Marginal CPA insights. Visual charts illustrate varying costs per conversion.",
  "description": "This image features two charts comparing Average Cost Per Acquisition (CPA) and Marginal CPA. The average CPA chart displays incremental costs at $5, $6.50, and $10 for increasing conversions. The marginal CPA chart highlights costs at $5, $16, and $21. These visualizations aid in understanding cost efficiency in marketing campaigns, offering valuable insights into cost management strategies."
}
```

    At the core of this difference lies a fundamental question: Is the response curve C-shaped or S-shaped?

    Understanding the shape of the response curve can drastically change how I conduct channel testing and measurement, especially with Google’s increasing inclination towards S-shaped campaigns.

    Let’s delve into what these two curves signify and why they are crucial.

    ```json
{
  "alt": "Two graphs showing C-shaped log response and S-shaped logistic response curves, indicating conversion rates based on monthly spend.",
  "caption": "Explore the differences in conversion rates with C-shaped and S-shaped response curves, highlighting how every dollar spent can vary in effectiveness over time.",
  "description": "This image features two graphs comparing different response curves: a C-shaped log response and an S-shaped logistic response. The C-shaped curve illustrates initial steep conversion rates that diminish with increased spending, while the S-shaped curve shows increasing returns up to a $20k inflection point, followed by diminishing returns. Monthly spend is displayed along the x-axis, with conversions per month on the y-axis. Keywords: conversion rates, response curves, economic modeling."
}
```

    Response curves plot conversions or revenue against spend. Typically, we encounter two main types in marketing.

    A C-shaped curve means diminishing returns kick in from the first dollar spent. Meanwhile, an S-shaped curve starts slow, becomes steep at the inflection point, and finally leads to saturation.

    This insight is crucial for allocation because the marginal curve—the derivative—guides budget decisions. Here, shapes diverge with significant implications.

    ```json
{
  "alt": "Graph shows marginal CPA versus monthly spend with U-shaped S-curve and C-curve channels. Highlights cost efficiency zones.",
  "caption": "Explore the divergence of marginal cost curves with this insightful graph highlighting the U-shaped S-curve and linear C-curve. Where does cost efficiency peak?",
  "description": "This graph illustrates the marginal cost-per-acquisition (CPA) related to monthly spend, featuring two key models: a U-shaped S-curve and a C-curve. The S-curve designates areas of cost efficiency, while the C-curve depicts a consistently rising cost. Key points include the S-curve’s optimal point at $17 per conversion and the C-curve crossing the $18k spend mark. Ideal for marketers analyzing cost efficiency, this chart provides a visual breakdown of expenditure impact on conversion costs."
}
```

    For a C-shaped curve, the highest marginal return is from the first dollar, decreasing thereafter. Conversely, for an S-shaped curve, the initial return is low, increases up to a peak, and then declines.

    This aspect of increasing marginal returns is pivotal. It’s what differentiates channels with productive small budgets from those that seem inefficient but could perform better when scaled correctly.

    Mainstream marketing campaigns exhibit this principle clearly. For instance, if your CPA goal is $50, the way the S-shaped channel behaves under scaling tells a critical story.

    ```json
{
  "alt": "Graph showing marginal returns invert at $30k per month with conversion and cost per acquisition data.",
  "caption": "Discover how marginal returns transform around the $30k mark! This graph illustrates the saturation of conversions compared to monthly spend, highlighting key points of CPA change.",
  "description": "This graph provides visual data on how marginal returns on investment invert around $30,000 per month. The top graph shows the relationship between conversions and monthly spend, identifying a saturation zone. The bottom graph compares average and marginal cost per acquisition (CPA) over monthly spending, with annotations marking significant points like $18 marginal floor and $312 CPA at $40k. Useful for understanding the shift in conversion efficiency with increased spending."
}
```

    A preliminary $10,000 test may misleadingly suggest failure, but at $20,000-$25,000, the channel might be your most cost-effective choice. Small trials in the warm-up phase mislead the eventual conclusion.

    This common misconception arises as many automatically rely on ‘test small, scale what works’. Yet, without sufficient testing past the warm-up phase of an S-curve, we risk dismissing channels that could have been game-changers.

    For allocation logic, in C-shaped channels, going wide is beneficial. One global optimum dictates that spreading your budget thinly across many channels generally works.

    ```json
{
  "alt": "Channel map illustrating the transition from harvesting demand to creating new demand.",
  "caption": "Exploring the dynamic shift from harvesting to generating demand, this chart visualizes marketing channel strategies effectively.",
  "description": "This image shows a channel map, outlining the process from harvesting existing demand to creating new demand. It plots various marketing channels such as branded search, LinkedIn prospecting, and Programmatic display prospecting. The chart illustrates these strategies on a linear scale, with points indicating positions like harvest/retarget and create new demand. It serves as a guide for optimizing marketing strategies through rules-based auctions and machine learning systems. Keywords include channel map, marketing strategies, demand generation, and machine learning."
}
```

    But with S-shaped channels, a small budget is inadequate. Either commit enough budget to surpass the inflection point or don’t invest at all. There is a true minimum budget to ensure viability.

    In marketing, determining whether a channel requires breadth or depth is critical. Channels historically leaned towards a concave shape, although modern platform dynamics have blurred these lines.

    The differences are increasingly relevant with AI-driven campaigns. For example, ‘AI Max’ necessitates sufficient conversion data to learn effectively, affirming the concave-to-sigmoid shift. Campaigns like PMax blend both response types, initially concealing inefficiencies through promising headline numbers.

    ```json
{
  "alt": "Table showing channel response curves for different marketing channels with demand role, shape, and mechanism details.",
  "caption": "Understanding marketing channel dynamics: Explore how different channels respond to demand, from branded search to programmatic display, with clear roles and mechanisms.",
  "description": "This image presents a table of marketing channels with their response curves, detailing the demand role, curve shape, and mechanism for channels like branded search, RLSA, display retargeting, and more. It highlights 'harvest' and 'prospect' channel roles, curve types such as 'Extreme C', 'Steep C', and 'Strong S', alongside mechanisms explaining audience targeting and intent-oriented strategies. Keywords: marketing, channel response, demand role, curve shape, PPC strategies."
}
```

    The key is recognizing the harvest versus create dichotomy. Harvest channels, like branded searches, display fast saturation and diminishing returns. Still, creating new demand—especially through platforms like Meta or YouTube—demands investment beyond superficial trials for truly incremental growth.

    In conclusion, understanding whether to expand broadly or concentrate deeply in a specific channel can transform the efficiency of a marketing strategy.


    Inspired by this post on Search Engine Land.

    crushpress.ai community screenshot
  • Unlocking New Potential: ChatGPT’s Self-Serve Ads Revolution

    Unlocking New Potential: ChatGPT’s Self-Serve Ads Revolution

    I’ve witnessed firsthand how ChatGPT ads are evolving with self-serve buying options, enhanced measurement features, and a vision to create a scalable advertising platform.

    OpenAI is stepping up its game with the ChatGPT ads platform by introducing self-serve buying, CPC bidding, and improved measurement methods to invite more advertisers into its ecosystem.

    What’s happening. The ChatGPT ads initiative is shifting from a limited pilot to a broader rollout, providing businesses new methods to purchase and manage their campaigns. Advertisers can now access inventory through agency and tech partners or directly via the new beta Ads Manager, which is currently rolling out in the U.S.

    This marks a significant move from a controlled test phase to a promising, scalable ad platform.

    Why we care. In the past, access to ChatGPT ads was restricted and costly, limiting it to major advertisers. These updates are lowering the entry barriers, allowing SMBs, startups, and diverse brands to experiment with this channel.

    By introducing CPC bidding, ChatGPT aligns more closely with established performance platforms, enabling advertisers to optimize for actions rather than just impressions.

    Self-serve Ads Manager. With the new Ads Manager, advertisers gain direct control over campaigns, including budgeting, bidding, creative uploads, and performance tracking.

    Even though it’s still in beta, it demonstrates OpenAI’s commitment to building a full-service ad platform, beyond a mere partner-led ecosystem.

    Between the lines. This approach is not new. Typically, platforms start with high-touch, partner-led campaigns before transitioning to self-serve tools that enhance scalability. ChatGPT is entering this second phase.

    CPC bidding arrives. Originally, ChatGPT ads were sold on a CPM basis. The inclusion of CPC enables advertisers to align expenditures with user actions—a critical evolution for performance marketers.

    The nature of ChatGPT queries—often exploratory, comparative, and decision-driven—means that clicks could become an effective indicator of user intent.

    Measurement catches up. OpenAI is also introducing pixel-based tracking and a Conversions API, allowing advertisers to measure actions like purchases, sign-ups, and leads.

    Notably, this data is aggregated, ensuring no access to individual conversations, emphasizing OpenAI’s commitment to privacy.

    Why this is a big deal. Measurement was a major gap in early ChatGPT ads. Without it, justifying ad spend was challenging for advertisers. These updates help bridge that gap, making optimization more feasible.

    The ecosystem grows. OpenAI is expanding its network by partnering with agencies like WPP and Publicis Groupe, along with tech platforms such as Criteo and Adobe.

    This allows advertisers to buy ChatGPT ads through tools and workflows they are already familiar with.

    What to watch:

    • How quickly self-serve adoption scales
    • Whether CPC performance holds as competition increases
    • How measurement evolves to match advertiser expectations

    Bottom line. ChatGPT ads are transitioning from an experiment to a platform—and with self-serve tools, CPC bidding, and enhanced measurement, OpenAI is laying the foundation for expansive growth.


    Inspired by this post on Search Engine Land.


    crushpress.ai community screenshot
  • Discover How OpenAI is Revolutionizing Ads with ChatGPT CPC

    Discover How OpenAI is Revolutionizing Ads with ChatGPT CPC

    Have you heard the news that OpenAI has introduced CPC ads to ChatGPT? This strategic shift has transformed it into a performance-driven channel, offering advertisers new avenues for engaging intent-driven audiences and tracking ROI.

    OpenAI is moving away from a focus purely on impressions in ChatGPT to prioritize performance. This change places OpenAI in direct competition with giants like Google by adopting cost-per-click (CPC) ads, allowing advertisers to pay only when users click on their ads.

    What’s happening? OpenAI has started testing CPC ads within ChatGPT, where advertisers only pay when their ads receive clicks. Initial reports highlight that these clicks are priced between $3 to $5. They’re rolling out this feature through a limited ads manager, alongside their existing CPM-based model.

    Why now? The main catalyst seems to be pricing pressure. Since its launch, ChatGPT’s CPMs have significantly decreased from around $60 to approximately $25. Switching to CPC helps mitigate this decline by connecting revenue to tangible outcomes rather than mere impressions.

    Why do we care? With its evolution into a performance channel, ChatGPT is now not just a branding space. The CPC pricing model makes it easier for us to connect budgets directly to measurable actions, test ROI, and compare these results with channels like Google Search.

    I’m excited about the opportunity for advertisers to access what could be a high-intent audience in a new format. This presents a first-mover advantage before competition—and the associated costs—escalate.

    The bigger picture: This isn’t just a pricing change; it’s a strategic pivot. By embracing CPC advertising, OpenAI challenges Google’s dominance in the market, thereby positioning ChatGPT as a contender for performance marketing budgets.

    Reading between the lines: A major challenge lies in proving user intent. While search advertising is effective because it captures users actively searching for something, ChatGPT’s conversational context needs to generate clicks with equal value. Advertisers will likely compare these results directly with Google, setting a high standard for quality and conversion.

    Zoom out: Advertising is becoming integral to OpenAI’s long-term revenue plan, supported by investments in ad infrastructure, measurement tools, and a wider self-serve platform.

    Bottom line: By implementing CPC ads, OpenAI is vying for the performance-driven ad dollars that have long supported traditional search platforms.


    Inspired by this post on Search Engine Land.


    crushpress.ai community screenshot
  • Unveiling Google’s AI Overviews: Impact on PPC Revenue

    Unveiling Google’s AI Overviews: Impact on PPC Revenue

    When I first heard about Google’s AI Overviews, I realized they weren’t just going to affect visibility; they had the potential to hit revenue hard. Adthena’s latest data analysis sheds light on just how significant this impact could be on CTR and CPC.

    Adthena dove into a detailed study from late December 2025 through January 2026, involving a comprehensive look across six major industries. This involved tracking performance metrics from millions of ads.

    While on the surface, aggregate data seemed stable, a closer inspection revealed a more complex reality. For advertisers like myself, these automated summaries don’t just pose visibility issues; they’re a direct threat to PPC revenue.

    ```json
{
  "alt": "Heat map showing content type preferences by industry, including Automotive, Financial Services, Healthcare, Retail, Technology, and Telecom.",
  "caption": "Explore how various industries like Automotive and Healthcare prioritize content types such as FAQs and News, revealing strategic content focus across sectors.",
  "description": "This heat map illustrates the distribution of preferred content types across different industries including Automotive, Financial Services, Healthcare, Retail, Technology, and Telecom. Each cell represents the percentage focus on content categories like Comparison, FAQ, How To, News, Problem Solve, and Review. For instance, Healthcare predominantly focuses on News (74%), whereas Telecom emphasizes FAQ (58%). This visualization aids in understanding industry-specific content strategies. Keywords: content marketing, industry analysis, content types."
}
```

    What AI Overviews Mean for Paid Search Revenue

    AI-generated summaries are altering the very structure of successful campaigns. When a Google AI Overview pushes ads below the page fold, it sets off a sequence of events impacting my profitability:

    • Lower CTR = fewer clicks: With diminished visibility, there’s a noticeable drop in visits to landing pages, diminishing the traffic flow.
    • Fewer clicks = fewer conversions: A decrease in traffic inevitably means fewer leads or sales.
    • Higher CPC = reduced profitability: In industries where AI summaries appear on competitive terms, maintaining relevance costs more, squeezing margins and lowering ROAS.

    AI Overviews Impact Across Six Industries

    Adthena’s study tracked AI Overview frequency, content themes, and CPC/CTR performance across devices. The results paint a complex picture, with impacts varying by industry, device, query type, and content intent.

    ```json
{
  "alt": "CPC trend graph comparing desktop and mobile across six industries from Dec 30 to Jan 24.",
  "caption": "Dive into the CPC trends across various industries, comparing desktop and mobile devices. Discover how sectors like healthcare and technology evolved over time.",
  "description": "This image shows a CPC trend graph from Adthena, illustrating CPC with and without AIO across six industries — automotive, financial services, healthcare, retail, technology, and telecom. The graph is divided by device type, desktop and mobile, covering dates from December 30 to January 24. The trend lines display subtle variations, revealing a comparative analysis of cost-per-click trends over time. Ideal for analyzing industry-specific advertising strategies."
}
```

    Content Themes: The Battle for Mid-Funnel Intent

    Adthena pinpoints a shift where Google moves deeper into comparison and instructional content spaces, directly targeting high-converting paid search areas.

    • The comparison conflict: In Telecom, Technology, and Retail, AI Overviews frequently deliver comparison content, which could satisfy user curiosity prematurely, preventing a further click on my ads.
    • The informational buffer: In Healthcare and Financial Services, themes like news and FAQs can act as intent barriers, potentially safeguarding ad spend by meeting low-intent signals before a user clicks on a paid ad.
    • The opportunity gap: Problem-solving content remains mostly unaffected at 0-2%. This creates a safe harbor for advertisers, with minimal AI interference in these areas.

    CPC Trends: The Premium for Visibility

    By tracking CPC fluctuations, I can identify where the cost of visibility is increasing due to the presence of AI Overviews.

    ```json
{
  "alt": "Bar chart showing CPC frequency by device type for various industries",
  "caption": "Explore the CPC frequency distribution across industries like technology and healthcare for both desktop and mobile devices.",
  "description": "This bar chart visualizes the CPC frequency distribution divided by device type: desktop and mobile. It illustrates the frequency across industries such as automotive, financial services, and healthcare at different frequency buckets. Each bar represents a unique combination of industry and frequency bucket, providing insights into the comparative cost-per-click performance across sectors. The data could help in understanding advertising trends and strategizing digital marketing efforts effectively."
}
```
    • Technology: AI Overview-related queries consistently yield higher CPCs, signaling increased costs for visibility.
    • Automotive & Retail: Across these sectors, costs remain similar regardless of AI Overviews, signifying less immediate impact.
    • Financial Services: Even modest CPC spikes can significantly impact profitability in industries with already high CPCs.

    Device Splits Expose Desktop Saturation

    Breaking down data by device reveals notable differences, showing more nuance than initially apparent.

    • Desktop dominance: Queries in Technology and Education are heavily populated by AI Overviews, making ad competition unavoidable.
    • Mobile opportunity: While AI Overviews appear less frequently on mobile, they more aggressively displace ads due to limited screen space, unlike desktop where multiple ads can sit below the overview.

    CTR Trends Provide Evidence of Traffic Erosion

    Examining CTR trends reveals ongoing discrepancies between influenced and standard search outcomes.

    ```json
{
  "alt": "Chart comparing CTR trends in various industries on desktop and mobile platforms.",
  "caption": "Explore the CTR trends across automotive, financial services, healthcare, retail, technology, and telecom. See how they vary on desktop and mobile devices over time.",
  "description": "This image presents a detailed CTR trend chart comparing different industries such as automotive, financial services, healthcare, retail, technology, and telecom. The chart is divided into desktop and mobile device categories, illustrating the click-through rate variations over time with two data lines per industry. The data is distinguished by colors for CTR with and without Aio optimization. This visual tool aids in understanding industry-specific digital engagement trends, enhancing searchability for digital marketing analytics."
}
```
    • Persistent gaps: In Telecom and Technology, lower CTRs with AI Overviews highlight the direct impact on traffic flow.
    • Consumer resilience: Financial Services and Retail show narrower CTR gaps, indicating ad preference despite AI Overviews.
    • Late month volatility: Spikes in Healthcare showcase rapid performance fluctuations as Google refines its AI deployment.

    Distribution Data Reveals the Zero Click Reality

    This data layer exposes a winner-take-all dynamic often obscured by average metrics.

    • The baseline gap: In the absence of AI Overviews, CTR remains strong across sectors, particularly Retail. However, where AI Overviews are rampant, the gap reveals the complete story.
    • High AI Overviews frequency, low CTR: Ubiquitous AI Overviews mean reduced CTR across sectors, including Technology. As frequency climbs, ad traffic capture decreases.
    • Resilience in Automotive: Automotive maintains a relatively diverse spread in mid-frequency ranges, suggesting users bypass summaries for brand information.

    Three Immediate Steps to Adapt Your Paid Search Strategy

    To protect my margins, here’s what I can do:

    ```json
{
  "alt": "Bar chart comparing click-through rates across industries on desktop and mobile devices.",
  "caption": "Explore how click-through rates vary across industries and devices in this insightful bar chart, revealing intriguing trends between desktop and mobile users.",
  "description": "This bar chart illustrates click-through rates (CTR) for various industries across desktop and mobile devices. Segmented by frequency buckets from 0 to 100, it showcases comparative performance in Automotive, Financial Services, Healthcare, Retail, Technology, and Telecom. The chart aims to provide insights into how different platforms and sectors perform in terms of user engagement. Created by Adthena, it serves as a valuable resource for understanding digital marketing trends."
}
```
    1. Monitor Click Through Rates (CTR) and Cost Per Click (CPC) changes: Although they don’t provide the complete picture, shifts in CTR or CPC can warn of AI Overview effects.
    2. Segment performance by device: By separating desktop and mobile data, I can discover hidden trends that might be blurred in combined reporting.
    3. Use Adthena’s free Market Share reports: These reports allow me to understand AI Overview frequency in my category and recognize at-risk areas for visibility.

    Gaining Visibility with Adthena’s AI Overview Solution

    To grasp AI Overview effects, continuous and detailed query-level intelligence is crucial. Adthena’s AI Overview solution regularly indexes search results, providing advertisers with insights into:

    • AI Overviews frequency patterns by query, industry, and device.
    • Content themes and citation sources.
    • Performance metrics including impact on CPC and CTR.
    • Ad position vs AI Overviews.

    These insights help advertisers like me detect and address disruptions to revenue before they impact performance.

    Coming soon: Adthena’s enhancement to the AI Overviews solution will include visibility into ads within AI Overviews, offering a comprehensive assessment of ad performance throughout the SERP.

    The SERP Has Changed: Adapt or Fall Behind

    While Google’s AI Overviews are here to stay, their effect isn’t uniform nor unsurmountable. Successful advertisers, like those who are vigilant, understand precisely where and how AI Overviews appear, what content they promote, and how their audience reacts.

    Precision is vital. Assumptions lead to downfall.

    Book a demo to see exactly how AI Overviews are impacting your campaigns.


    Inspired by this post on Search Engine Land.


    crushpress.ai community screenshot