Tag: Channel Strategy

  • Channel Strategies: Broad Approaches vs. Focused Commitment

    Channel Strategies: Broad Approaches vs. Focused Commitment

    When I first started looking at budget allocation, I was tempted to believe that every marketing channel followed the same path: spend a little, get a lot, but with diminishing returns.

    Visually, it’s easy to assume all channels mimic this pattern.

    The typical log-shaped curve illustrates that the first dollar you spend is often the most productive. With this mindset, spreading the budget across numerous channels seems like the go-to strategy.

    However, I quickly learned not all channels conform to this model. Some require much more than just a sprinkle of funds to be effective. These channels start with a less efficient spend but eventually pay off if given time to warm up. This condition shifts away from the usual ‘test small, scale the winners’ strategy many marketers follow.

    ```json
{
  "alt": "Comparison charts showing Average CPA and Marginal CPA with costs for different conversion levels.",
  "caption": "Explore cost efficiency with Average and Marginal CPA insights. Visual charts illustrate varying costs per conversion.",
  "description": "This image features two charts comparing Average Cost Per Acquisition (CPA) and Marginal CPA. The average CPA chart displays incremental costs at $5, $6.50, and $10 for increasing conversions. The marginal CPA chart highlights costs at $5, $16, and $21. These visualizations aid in understanding cost efficiency in marketing campaigns, offering valuable insights into cost management strategies."
}
```

    At the core of this difference lies a fundamental question: Is the response curve C-shaped or S-shaped?

    Understanding the shape of the response curve can drastically change how I conduct channel testing and measurement, especially with Google’s increasing inclination towards S-shaped campaigns.

    Let’s delve into what these two curves signify and why they are crucial.

    ```json
{
  "alt": "Two graphs showing C-shaped log response and S-shaped logistic response curves, indicating conversion rates based on monthly spend.",
  "caption": "Explore the differences in conversion rates with C-shaped and S-shaped response curves, highlighting how every dollar spent can vary in effectiveness over time.",
  "description": "This image features two graphs comparing different response curves: a C-shaped log response and an S-shaped logistic response. The C-shaped curve illustrates initial steep conversion rates that diminish with increased spending, while the S-shaped curve shows increasing returns up to a $20k inflection point, followed by diminishing returns. Monthly spend is displayed along the x-axis, with conversions per month on the y-axis. Keywords: conversion rates, response curves, economic modeling."
}
```

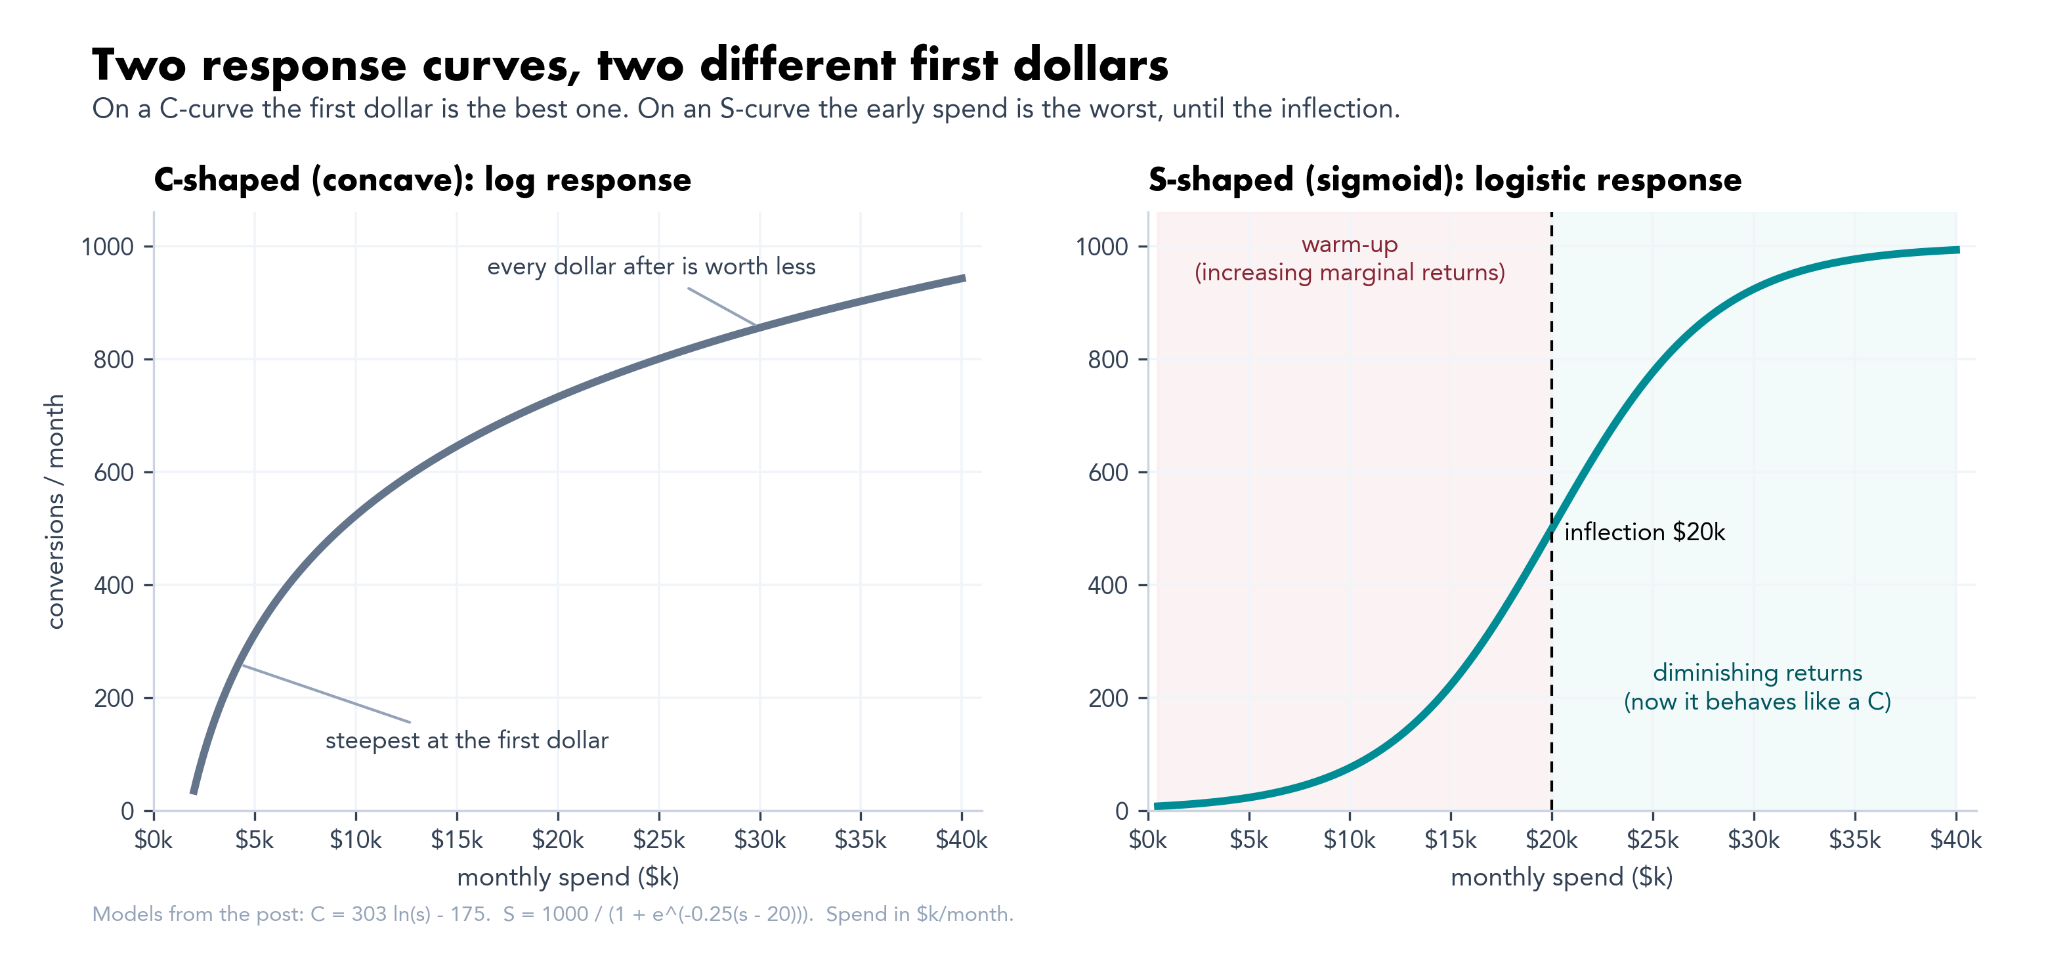
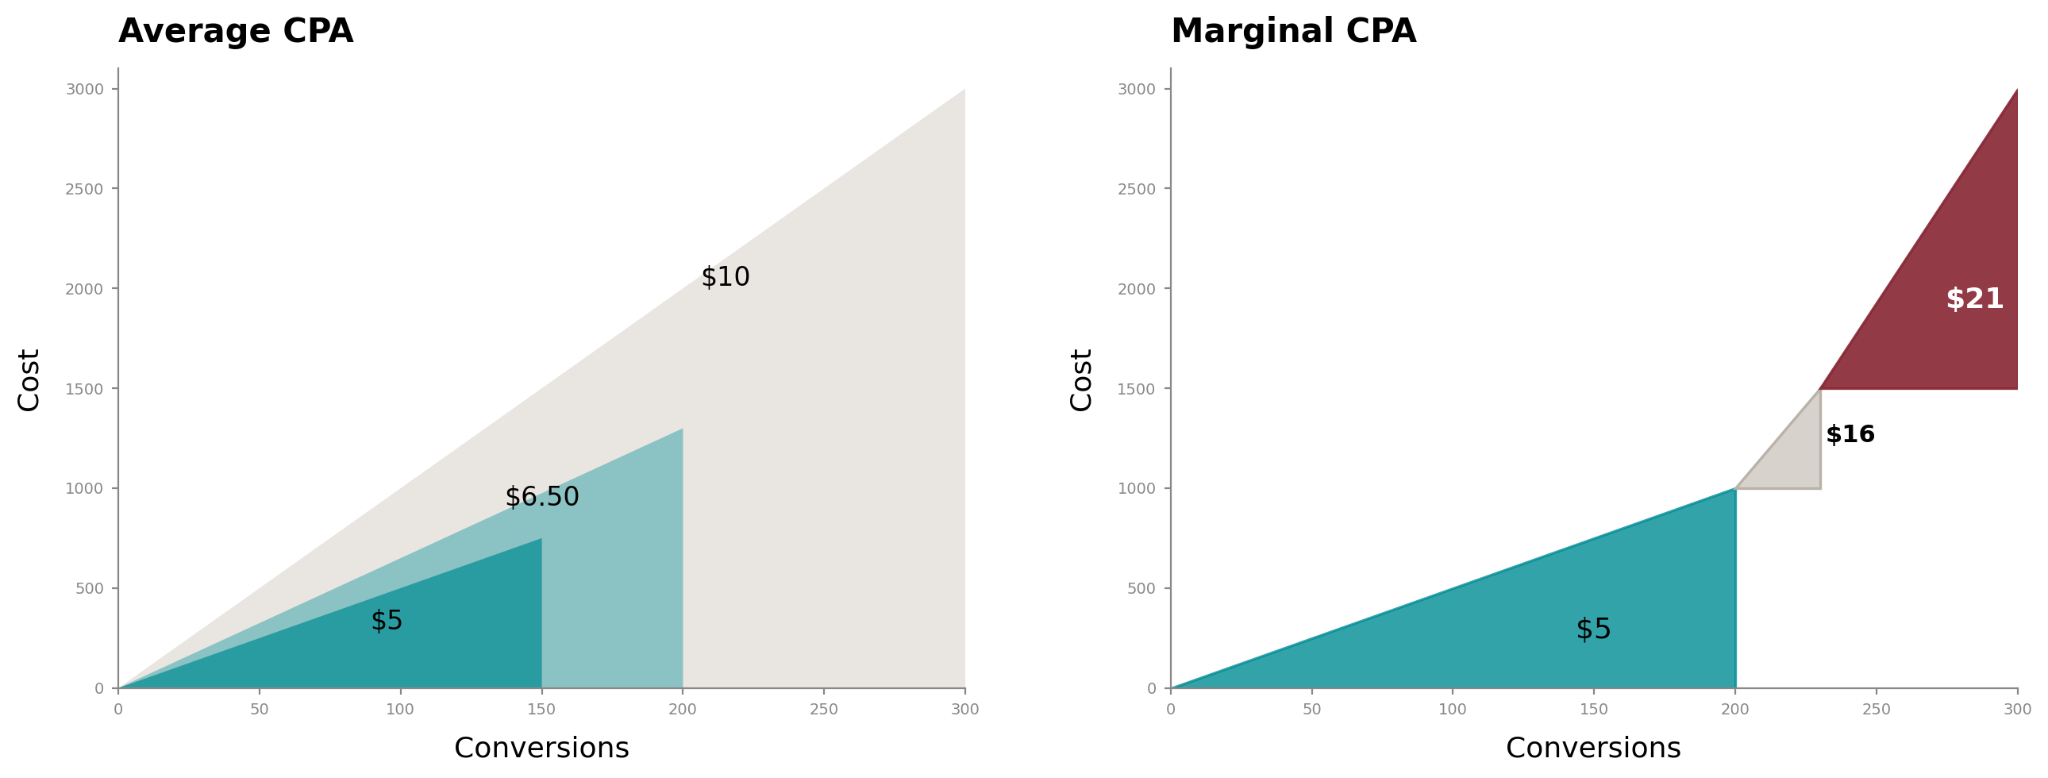
    Response curves plot conversions or revenue against spend. Typically, we encounter two main types in marketing.

    A C-shaped curve means diminishing returns kick in from the first dollar spent. Meanwhile, an S-shaped curve starts slow, becomes steep at the inflection point, and finally leads to saturation.

    This insight is crucial for allocation because the marginal curve—the derivative—guides budget decisions. Here, shapes diverge with significant implications.

    ```json
{
  "alt": "Graph shows marginal CPA versus monthly spend with U-shaped S-curve and C-curve channels. Highlights cost efficiency zones.",
  "caption": "Explore the divergence of marginal cost curves with this insightful graph highlighting the U-shaped S-curve and linear C-curve. Where does cost efficiency peak?",
  "description": "This graph illustrates the marginal cost-per-acquisition (CPA) related to monthly spend, featuring two key models: a U-shaped S-curve and a C-curve. The S-curve designates areas of cost efficiency, while the C-curve depicts a consistently rising cost. Key points include the S-curve’s optimal point at $17 per conversion and the C-curve crossing the $18k spend mark. Ideal for marketers analyzing cost efficiency, this chart provides a visual breakdown of expenditure impact on conversion costs."
}
```

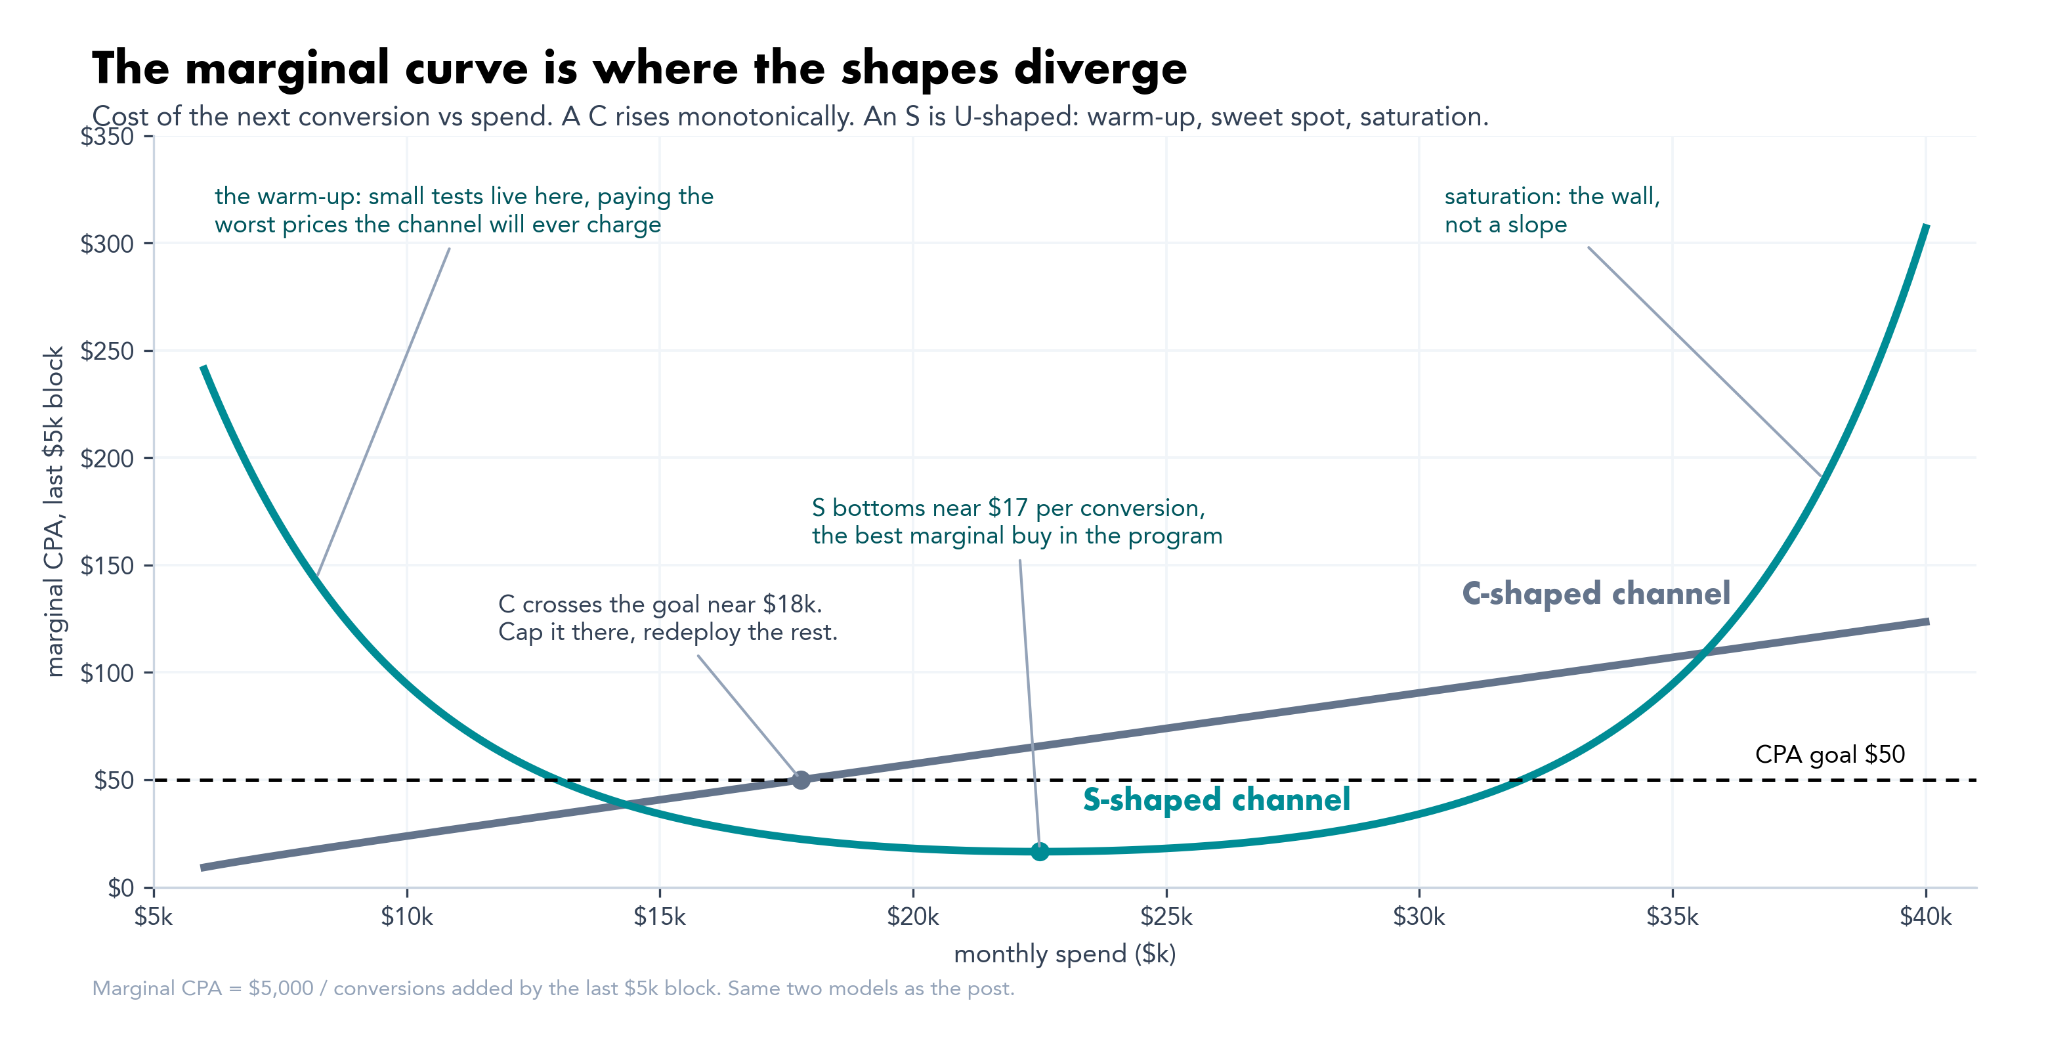
    For a C-shaped curve, the highest marginal return is from the first dollar, decreasing thereafter. Conversely, for an S-shaped curve, the initial return is low, increases up to a peak, and then declines.

    This aspect of increasing marginal returns is pivotal. It’s what differentiates channels with productive small budgets from those that seem inefficient but could perform better when scaled correctly.

    Mainstream marketing campaigns exhibit this principle clearly. For instance, if your CPA goal is $50, the way the S-shaped channel behaves under scaling tells a critical story.

    ```json
{
  "alt": "Graph showing marginal returns invert at $30k per month with conversion and cost per acquisition data.",
  "caption": "Discover how marginal returns transform around the $30k mark! This graph illustrates the saturation of conversions compared to monthly spend, highlighting key points of CPA change.",
  "description": "This graph provides visual data on how marginal returns on investment invert around $30,000 per month. The top graph shows the relationship between conversions and monthly spend, identifying a saturation zone. The bottom graph compares average and marginal cost per acquisition (CPA) over monthly spending, with annotations marking significant points like $18 marginal floor and $312 CPA at $40k. Useful for understanding the shift in conversion efficiency with increased spending."
}
```

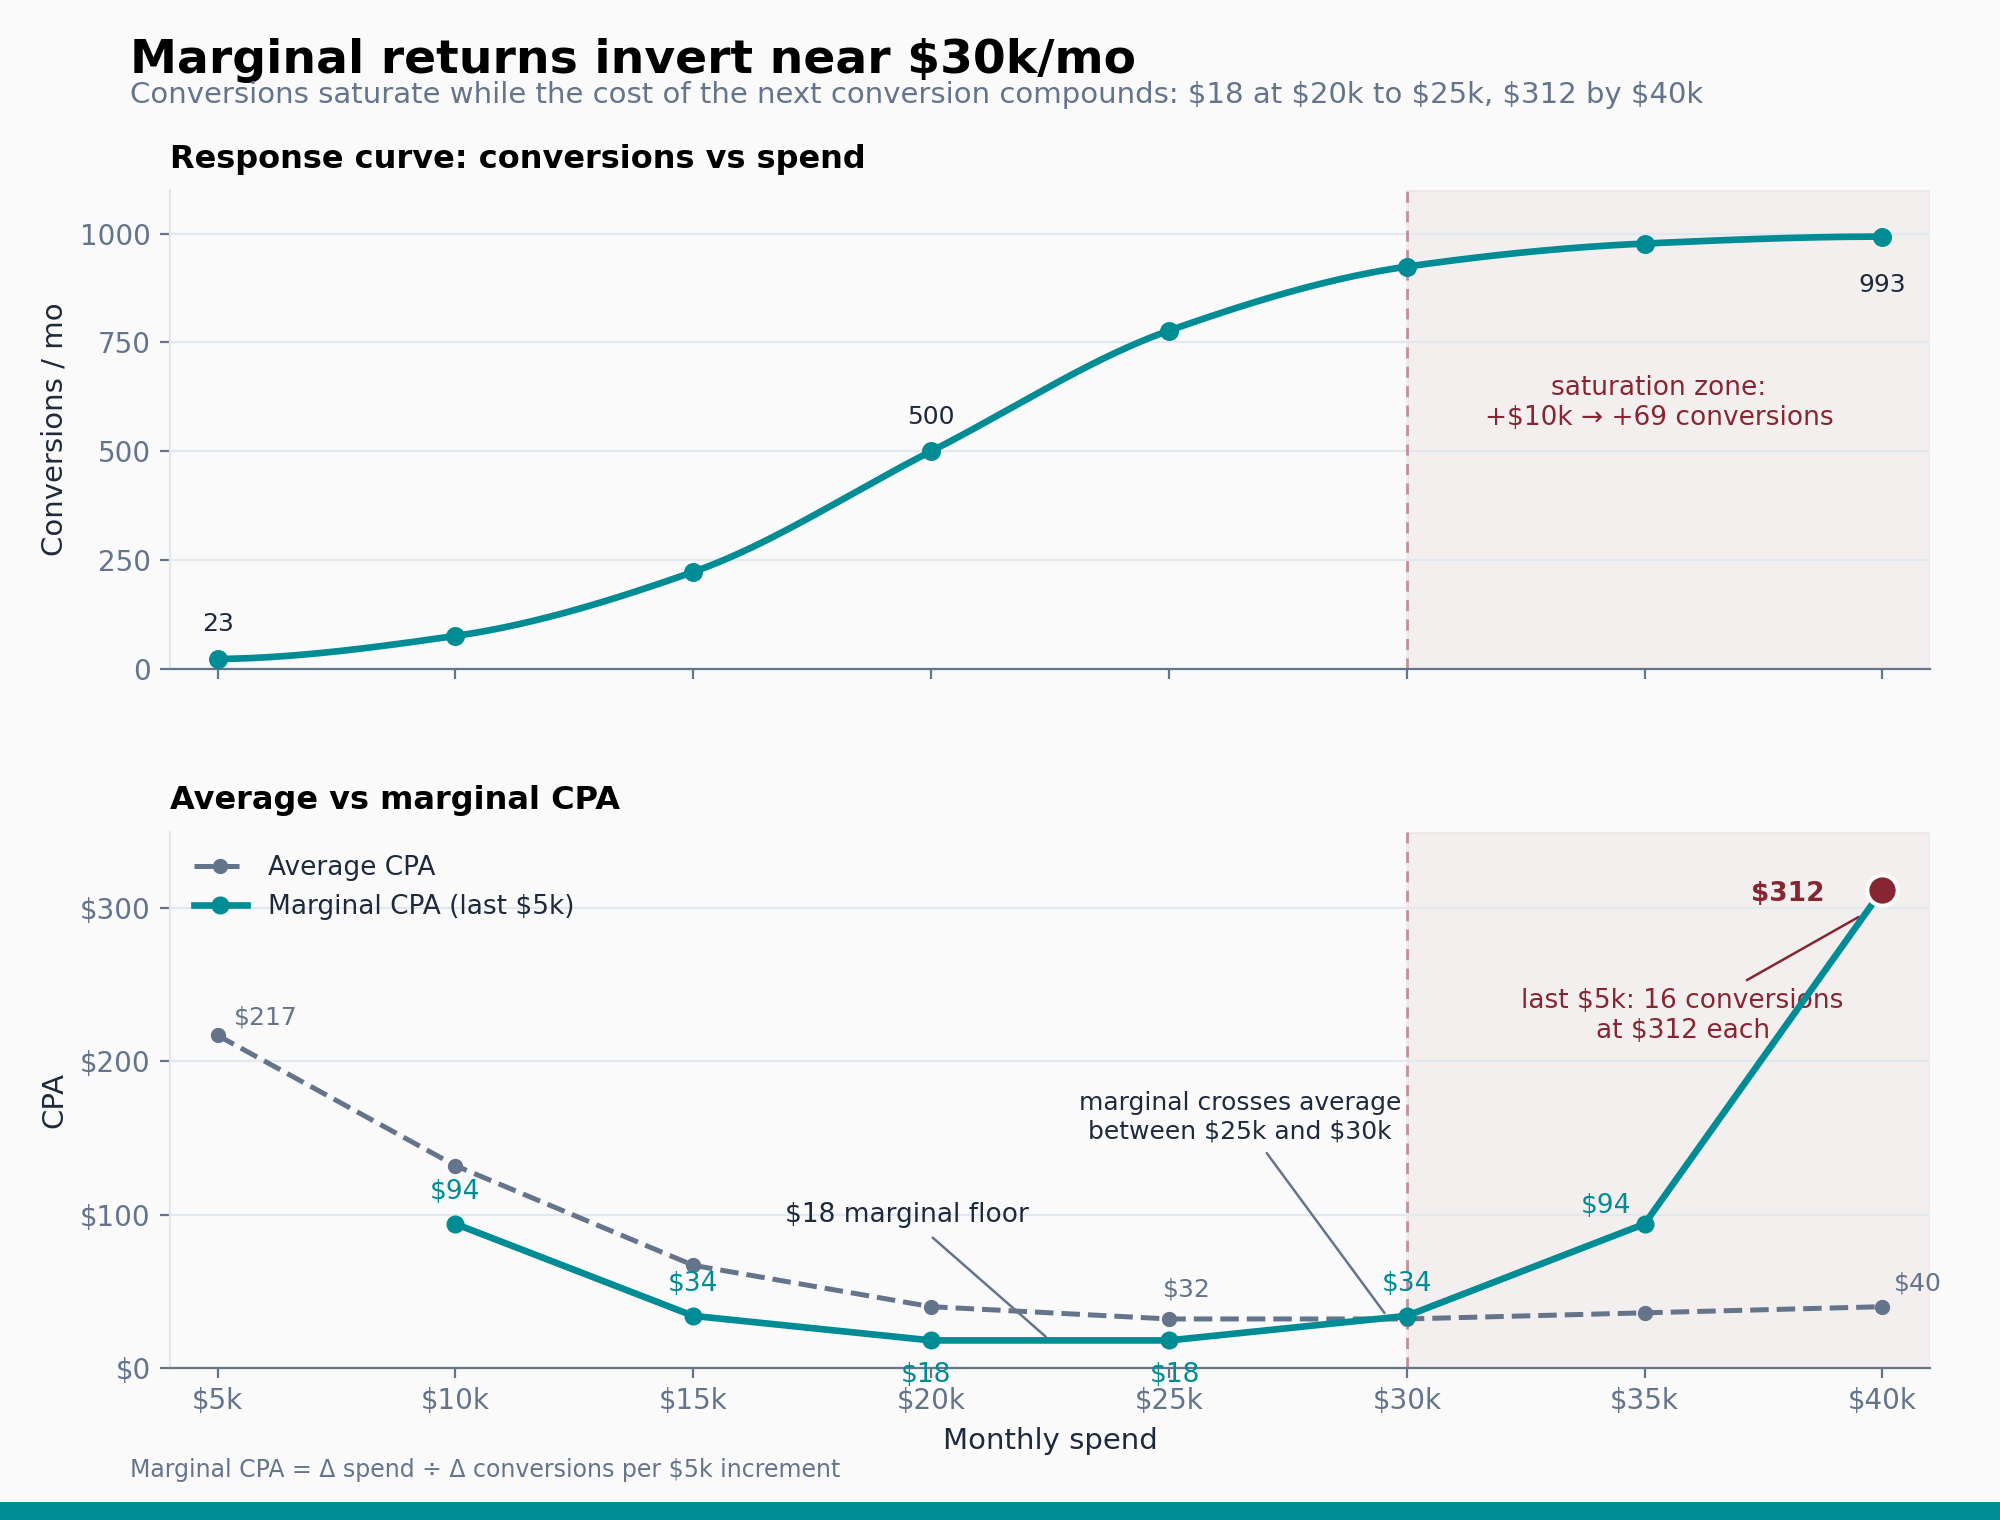
    A preliminary $10,000 test may misleadingly suggest failure, but at $20,000-$25,000, the channel might be your most cost-effective choice. Small trials in the warm-up phase mislead the eventual conclusion.

    This common misconception arises as many automatically rely on ‘test small, scale what works’. Yet, without sufficient testing past the warm-up phase of an S-curve, we risk dismissing channels that could have been game-changers.

    For allocation logic, in C-shaped channels, going wide is beneficial. One global optimum dictates that spreading your budget thinly across many channels generally works.

    ```json
{
  "alt": "Channel map illustrating the transition from harvesting demand to creating new demand.",
  "caption": "Exploring the dynamic shift from harvesting to generating demand, this chart visualizes marketing channel strategies effectively.",
  "description": "This image shows a channel map, outlining the process from harvesting existing demand to creating new demand. It plots various marketing channels such as branded search, LinkedIn prospecting, and Programmatic display prospecting. The chart illustrates these strategies on a linear scale, with points indicating positions like harvest/retarget and create new demand. It serves as a guide for optimizing marketing strategies through rules-based auctions and machine learning systems. Keywords include channel map, marketing strategies, demand generation, and machine learning."
}
```

    But with S-shaped channels, a small budget is inadequate. Either commit enough budget to surpass the inflection point or don’t invest at all. There is a true minimum budget to ensure viability.

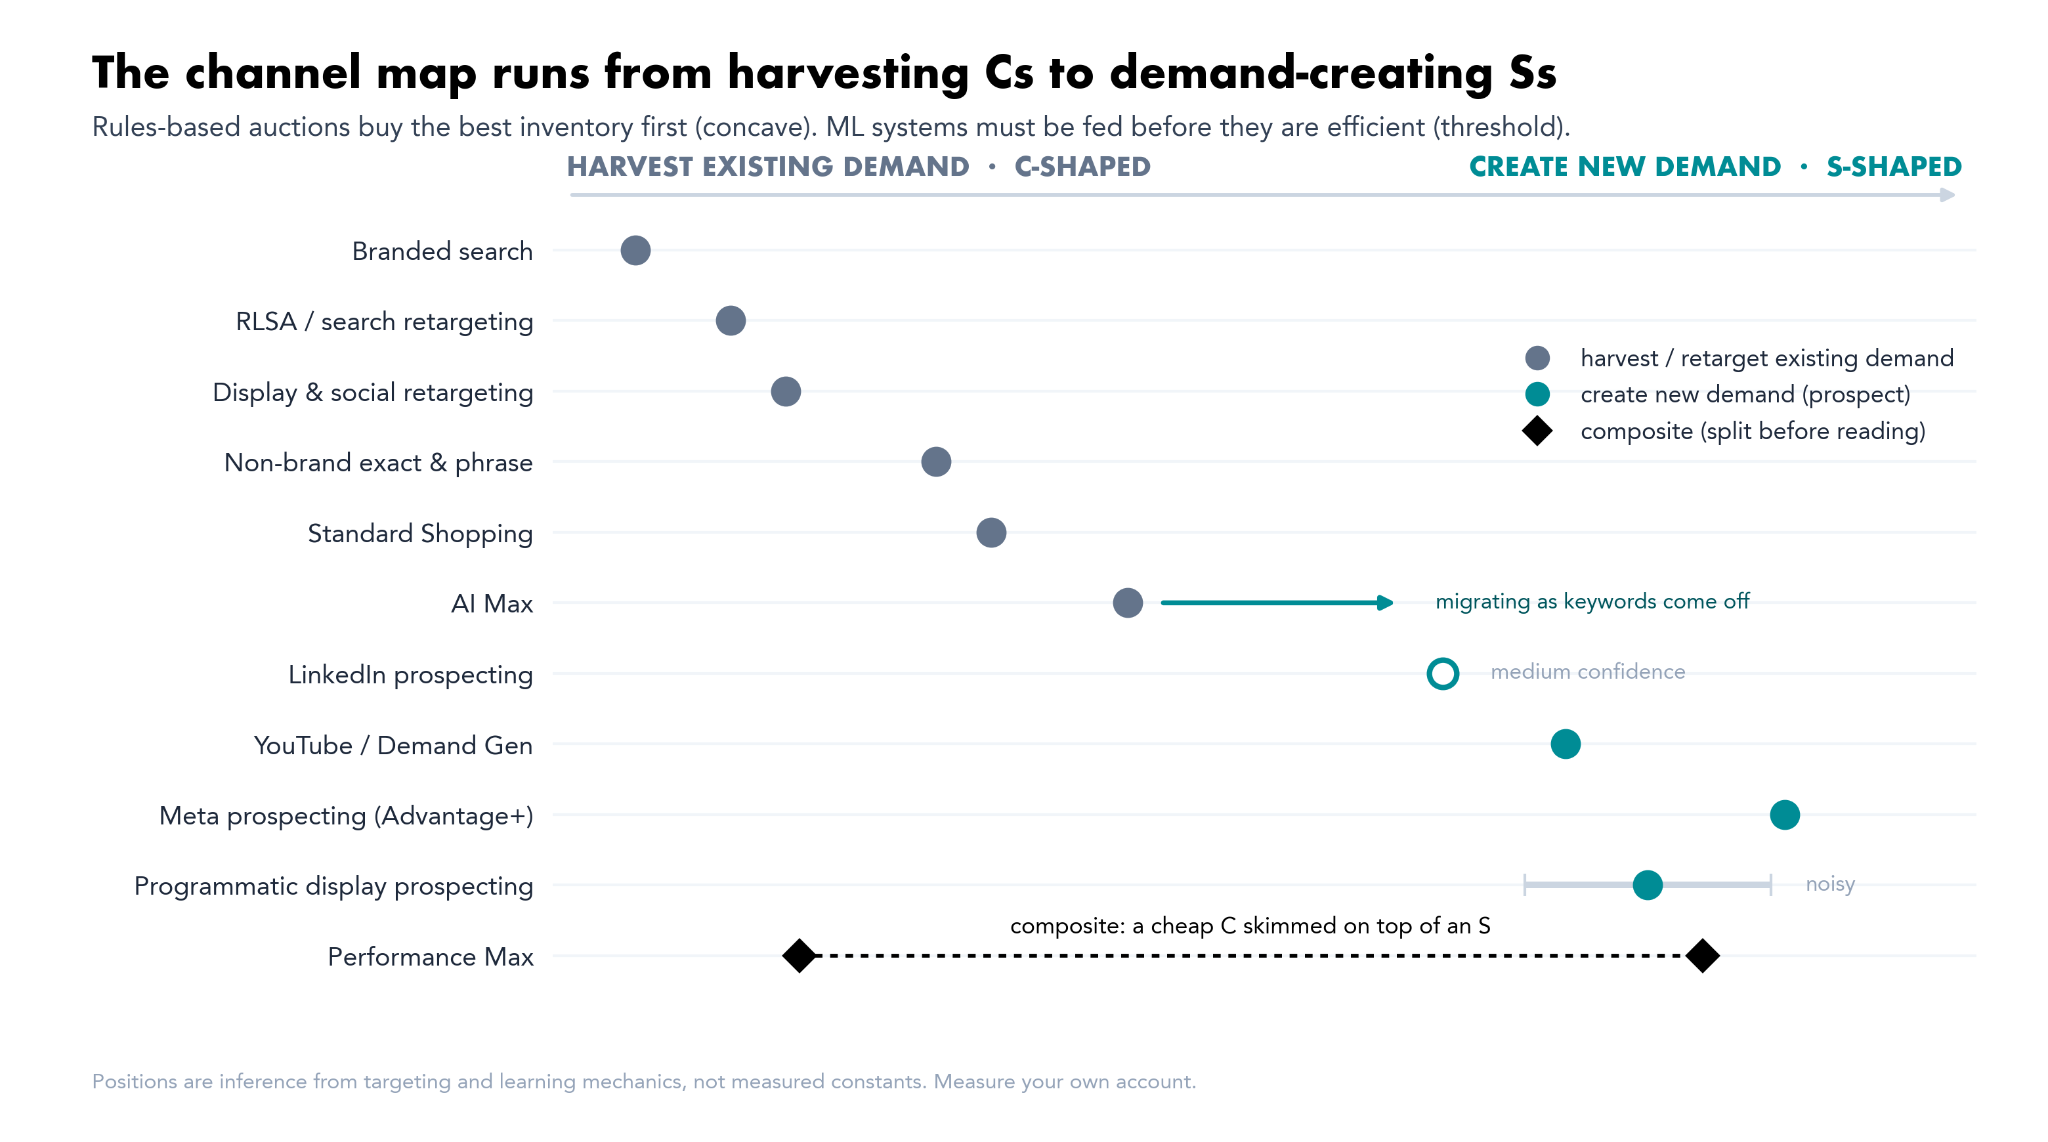
    In marketing, determining whether a channel requires breadth or depth is critical. Channels historically leaned towards a concave shape, although modern platform dynamics have blurred these lines.

    The differences are increasingly relevant with AI-driven campaigns. For example, ‘AI Max’ necessitates sufficient conversion data to learn effectively, affirming the concave-to-sigmoid shift. Campaigns like PMax blend both response types, initially concealing inefficiencies through promising headline numbers.

    ```json
{
  "alt": "Table showing channel response curves for different marketing channels with demand role, shape, and mechanism details.",
  "caption": "Understanding marketing channel dynamics: Explore how different channels respond to demand, from branded search to programmatic display, with clear roles and mechanisms.",
  "description": "This image presents a table of marketing channels with their response curves, detailing the demand role, curve shape, and mechanism for channels like branded search, RLSA, display retargeting, and more. It highlights 'harvest' and 'prospect' channel roles, curve types such as 'Extreme C', 'Steep C', and 'Strong S', alongside mechanisms explaining audience targeting and intent-oriented strategies. Keywords: marketing, channel response, demand role, curve shape, PPC strategies."
}
```

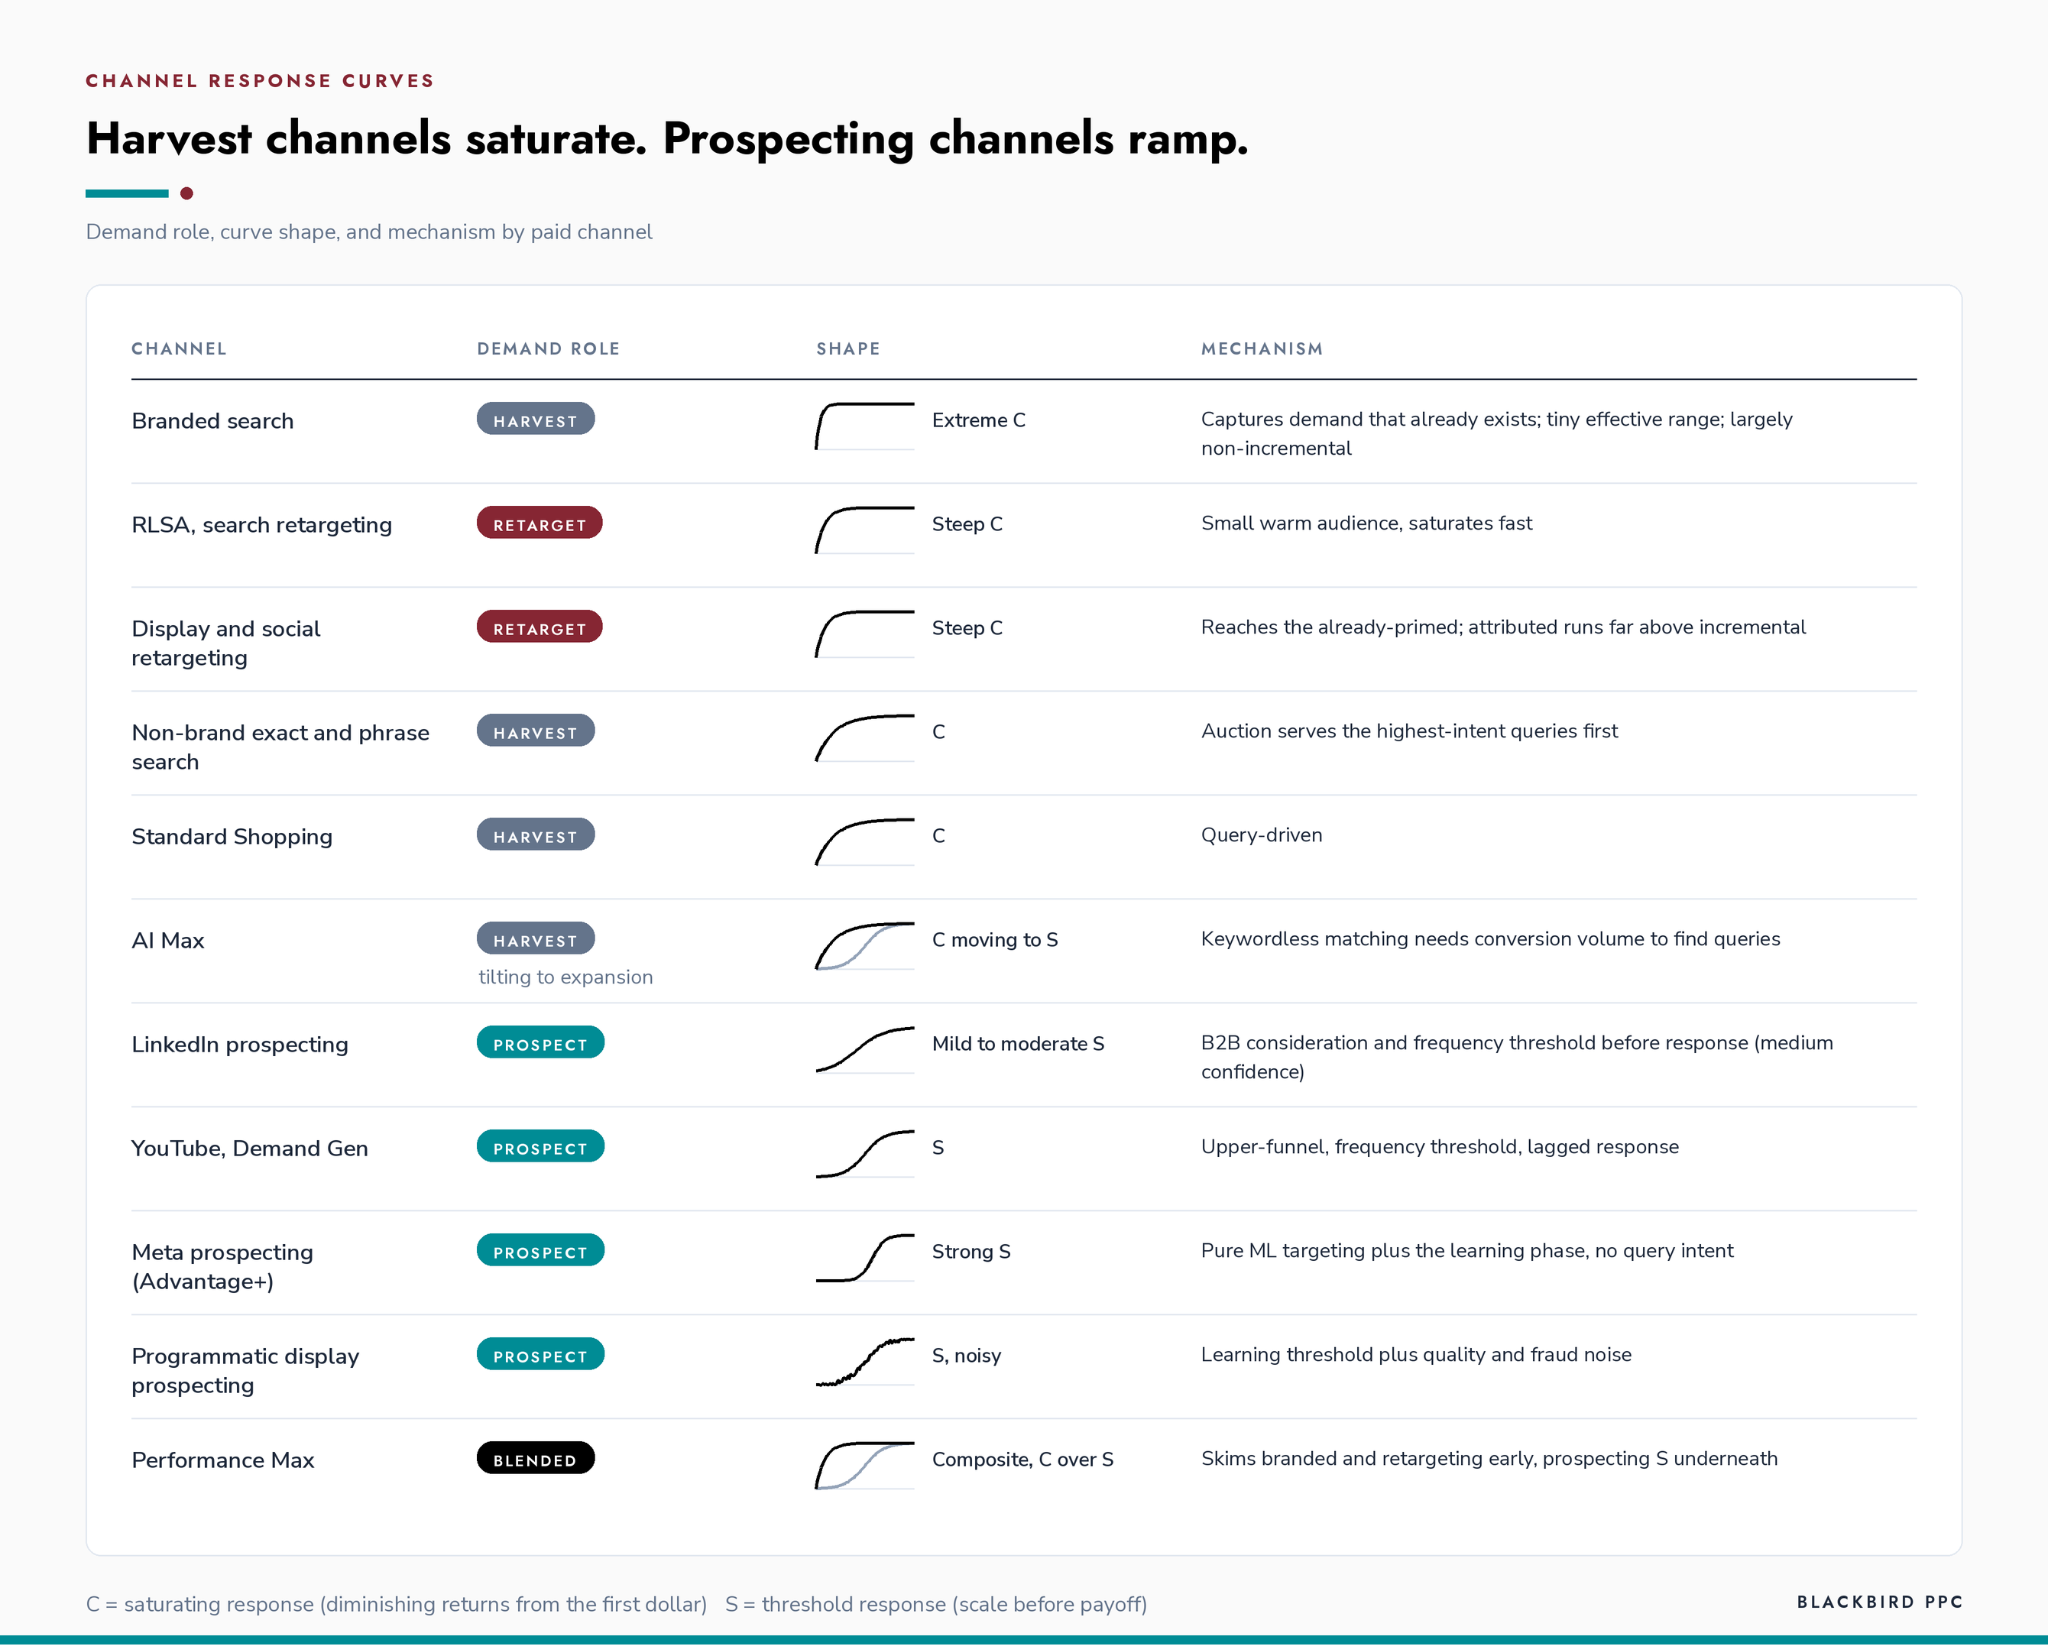
    The key is recognizing the harvest versus create dichotomy. Harvest channels, like branded searches, display fast saturation and diminishing returns. Still, creating new demand—especially through platforms like Meta or YouTube—demands investment beyond superficial trials for truly incremental growth.

    In conclusion, understanding whether to expand broadly or concentrate deeply in a specific channel can transform the efficiency of a marketing strategy.


    Inspired by this post on Search Engine Land.


    crushpress.ai community screenshot