Tag: Business Goals

  • Product-Led SEO Measurement: From Rankings to User Value

    Product-Led SEO Measurement: From Rankings to User Value

    You shipped a template change, internal-link module, or new landing-page experience. Impressions and clicks moved, but the product team asks the question the SEO dashboard cannot answer: did the release help anyone accomplish something valuable?

    Product-led SEO measurement closes that gap. It connects search exposure to the on-page experience, the user’s next meaningful action, and the business decision that follows. The result is not a larger dashboard. It is a measurement system that tells you whether to keep, change, expand, or roll back what you built.

    Start with the decision your dashboard must support

    Before choosing metrics, write down the decision you expect the data to inform. A useful decision statement looks like this: “If eligible organic visitors use the new experience and complete the intended next step without harming search visibility or page performance, expand it to the remaining eligible pages.”

    That sentence establishes the audience, behavior, desired outcome, guardrails, and next decision. Without it, teams tend to collect every available number and debate the meaning after launch.

    Treat the SEO change as a product capability. Define the problem, why it matters, the intended outcome, and the requirements that must survive implementation. Leave room for developers to choose an approach that fits the codebase, but be exact about observable SEO requirements. If links must appear in rendered HTML, state that. If every eligible page needs a canonical URL or a particular content element, make it testable.

    For a related-content module, the measurement brief might contain:

    • User problem: A visitor reaches a useful page from search but encounters a dead end before the next relevant question.
    • Hypothesis: Contextual links will help eligible visitors continue to a relevant page.
    • SEO requirement: The links must be present in rendered HTML and point to indexable destination URLs.
    • User outcome: A visitor selects a relevant recommendation and continues the journey.
    • Business outcome: More eligible organic journeys reach the qualified action that matters for this experience.
    • Guardrails: The release must not introduce broken links, rendering failures, inappropriate destinations, or a material deterioration in the page experience.

    Notice what is missing: “increase traffic” is not the whole objective. Traffic is one stage in the mechanism. The visitor’s ability to use the page is another.

    Build a metric tree from search exposure to product value

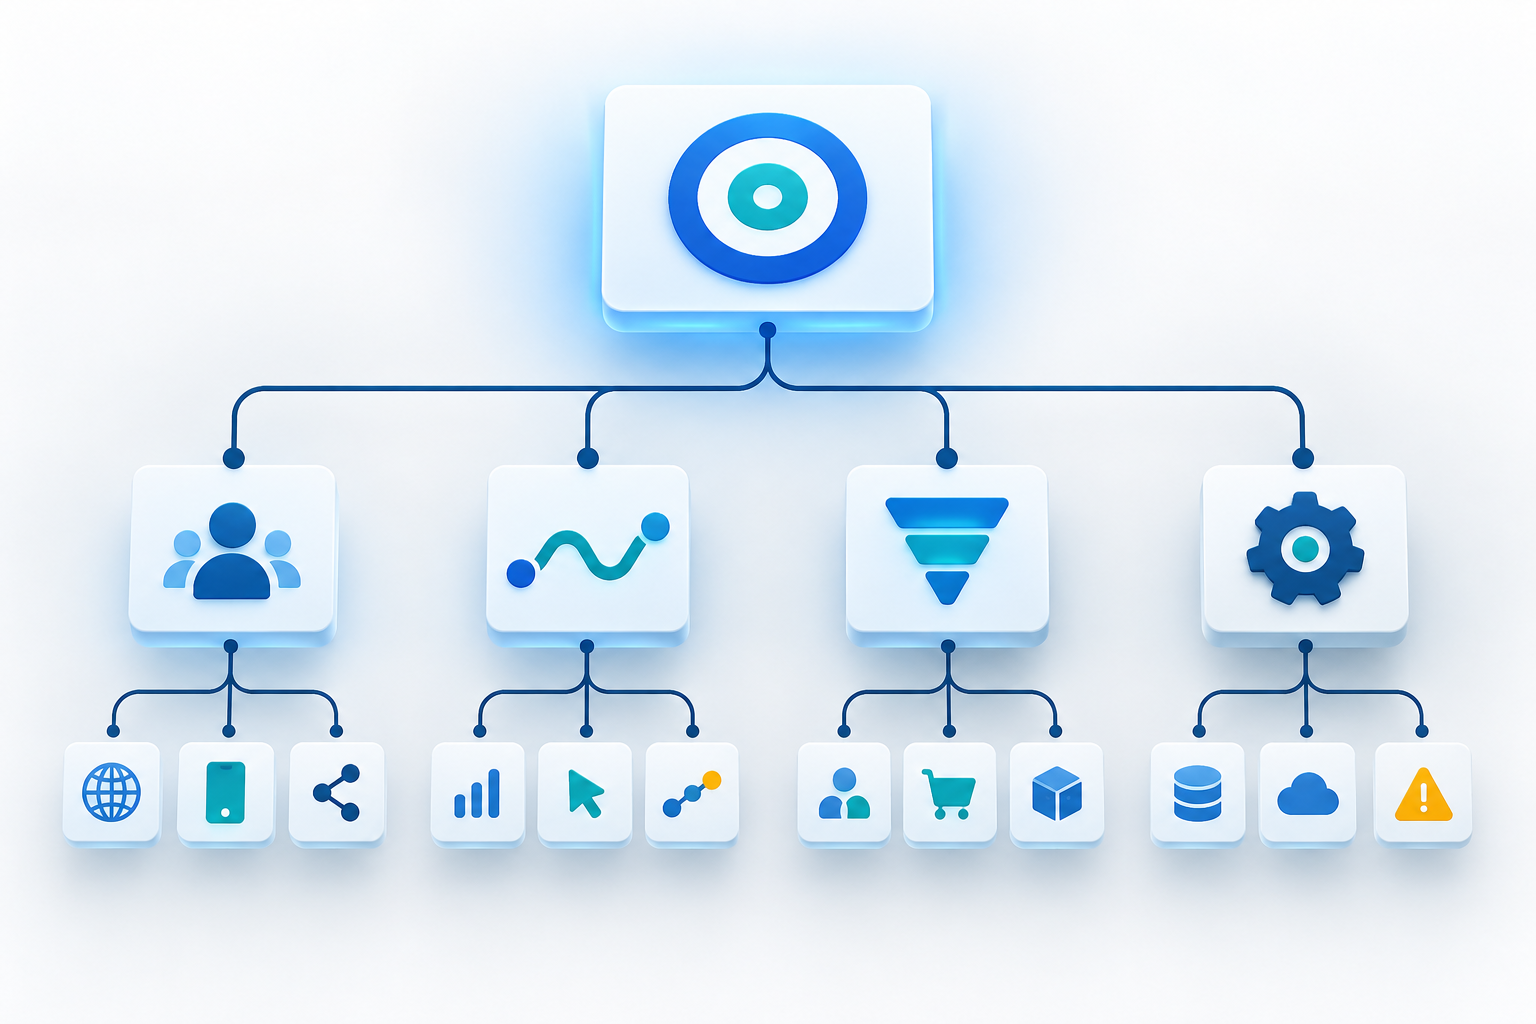
    Abstract branching pathway connecting search exposure lights to interactions, product actions, and a glowing value core.

    A product-led scorecard needs several layers because no single metric can explain the full journey. Rankings can diagnose discoverability, but they cannot tell you whether a visitor found the page useful. Conversions represent value, but they can hide a failed rollout when only a small share of eligible pages received the feature.

    Measurement layerQuestionUseful signalsWhat the layer helps diagnose
    AvailabilityDid the intended experience actually ship?Eligible pages, deployed pages, valid rendered components, crawlable links, error statesRelease and implementation failures
    Search exposureCould searchers discover the eligible pages?Indexed-page coverage, impressions, query coverage, average position, clicksDiscovery, indexing, and search-demand changes
    User behaviorDid organic visitors use the experience as intended?Feature views, interactions, path continuation, return to results where measurable, completion of the intended next stepRelevance, comprehension, placement, and usability
    Product or business valueDid the journey produce a qualified outcome?Sign-ups, purchases, qualified enquiries, subscriptions, or another explicitly defined value eventWhether improved discovery and behavior matter to the business
    GuardrailsWhat might the release have damaged?Rendering errors, broken destinations, unwanted indexation, page-performance deterioration, accessibility failuresCosts hidden by an attractive headline metric

    Connect these layers as a metric tree rather than presenting them as an unrelated set of charts. The business outcome sits at the top. The user behavior that should produce it sits beneath it. Search exposure explains how people reach the experience. Availability and guardrails tell you whether the product operated as designed.

    You can then define a rate whose numerator and denominator match the decision. For example:

    Organic activation rate = eligible organic landing sessions that complete the qualified action / eligible organic landing sessions

    “Eligible” matters. If the feature appears only on one template, including every organic session in the denominator dilutes the effect and can make a successful release look irrelevant. Conversely, reporting only people who interacted with the feature excludes visitors who saw it and ignored it. That turns adoption into a precondition and overstates performance.

    Keep raw counts beside rates. A rising conversion rate with sharply lower eligible traffic may still produce fewer total outcomes. A growing outcome count with a flat rate may simply reflect stronger search demand. You need both views to distinguish efficiency from scale.

    Instrument the feature, not just the pageview

    A pageview confirms that a URL loaded. It does not confirm that the feature was present, visible, relevant, or usable. Product-led measurement therefore needs an explicit event and validation plan for the capability you changed.

    For every important event, document:

    • Name: Use one stable name that describes the action rather than a campaign slogan or temporary design.
    • Trigger: Specify exactly what must happen. A component rendered, entered the viewport, received a click, and led to a successful destination are different events.
    • Properties: Include the page template, component type, destination class, release identifier, and eligibility state needed for analysis.
    • Deduplication: Decide whether repeated actions in one journey count once or multiple times.
    • Failure behavior: Record what happens when the component has no recommendation, returns an error, or points to an invalid destination.
    • Privacy boundary: Do not place personal or sensitive information in event names, URLs, or free-text properties.

    Then separate three states that dashboards often collapse:

    • Available: The feature was deployed to an eligible page and met its technical requirements.
    • Exposed: A visitor had a genuine opportunity to encounter it.
    • Adopted: The visitor used it and completed the intended behavior.

    This distinction makes diagnosis much faster. Low interaction is not a relevance problem if the component failed to render. High interaction is not necessarily valuable if visitors repeatedly hit broken destinations. Strong downstream outcomes among users do not prove the rollout worked if most eligible pages never received the feature.

    Validate instrumentation before evaluating impact. Check that an eligible page is classified correctly, the component appears in rendered HTML where required, events fire only on their defined triggers, properties contain expected values, destination URLs resolve correctly, and analytics can isolate the release cohort. Record the deployment in your reporting timeline so later changes are not mistaken for unexplained movement.

    Search data and product analytics describe different parts of the journey. Search Console impressions and clicks should not be forced to reconcile exactly with analytics sessions or users. Keep the systems connected through common dimensions such as landing page, country, device, query class, template, and release cohort, while preserving the meaning of each metric.

    Evaluate releases with cohorts, segments, and guardrails

    Two parallel release-testing lanes carry grouped user figures toward task outcomes within illuminated safety rails and a final decision platform.

    Comparing the whole site’s performance before and after a release is rarely enough. Search demand, rankings, site changes, promotions, seasonality, and unrelated product work can move during the same period. Build the evaluation around the pages and visitors that could actually be affected.

    Define the analysis cohort before opening the results:

    • List the eligible URLs or the rule that identifies them.
    • Record which URLs received the release and when.
    • Create a credible comparison group when one exists, using pages with similar purpose, template, demand pattern, and prior performance.
    • Preserve a pre-release baseline for the same metrics and segments.
    • Exclude known migrations, outages, redirects, or other changes that make the groups incomparable.
    • Choose the primary outcome and guardrails in advance so the interpretation does not change to fit the result.

    If you run a controlled test, keep the experimental unit clear. A page-level test should be analyzed by its assigned page cohort, not retroactively by whichever visitors converted. Check that search engines and users receive stable, coherent experiences, and do not use URL, canonical, redirect, or indexing changes casually as testing machinery. Those changes can alter discoverability and contaminate the result you are trying to measure.

    Segmentation should answer a plausible mechanism, not create an endless hunt for a favorable slice. Useful cuts commonly include branded versus non-branded demand, country, device, query intent, new versus established pages, and page template. Google Search Console can now combine selected countries in its performance reporting, which makes regional groupings easier to inspect without first exporting and grouping them elsewhere.

    Predefine the segments that could change the decision. If mobile layout determines whether the feature is visible, device is necessary. If a release serves a defined group of markets, combined-country reporting is relevant. If neither condition applies, adding those cuts may only fragment the data.

    Read the layers together when results arrive:

    • Availability fails: Stop interpreting user or business outcomes. Fix the rollout or instrumentation first.
    • Exposure rises but qualified actions stay flat: Inspect intent match, page promise, usability, and the relevance of the next step.
    • Traffic stays flat but activation improves: The release may have improved the experience without changing discoverability. Decide whether that product value justifies expansion.
    • Interaction rises but value does not: The feature may attract attention without advancing the journey. Review destination quality and event definitions.
    • Outcomes rise while a guardrail deteriorates: Do not declare an uncomplicated win. Quantify the downside and determine whether the experience needs revision before expansion.
    • Only one segment improves: Confirm that the segment was expected, large enough to matter to the decision, and not selected after inspecting many alternatives.

    Use language that matches the evidence. An uncontrolled before-and-after movement is an observation, not proof that the release caused it. A well-matched comparison strengthens the case. A properly designed experiment can support a stronger causal conclusion. The dashboard should make those evidence levels visible instead of presenting every green arrow with equal confidence.

    Finally, design the measurement so the next version remains possible. Stable eligibility rules, release identifiers, reusable events, and template-level dimensions let another team extend the capability without rebuilding the reporting model. That is the practical difference between a launch report and a product measurement system.

    Key takeaways

    • Begin with the decision the data must support: keep, revise, expand, or roll back the release.
    • Measure availability, search exposure, user behavior, product value, and guardrails as connected layers.
    • Use the eligible audience as the denominator; neither all site traffic nor feature clickers alone represent the true opportunity.
    • Instrument whether the capability was available, exposed, and adopted instead of relying on pageviews.
    • Analyze affected page cohorts and predefined segments, while treating uncontrolled before-and-after changes as observations rather than causal proof.
    • Keep raw totals beside rates and read gains against technical, accessibility, and experience guardrails.

    For your next SEO release, write the decision statement and metric tree before the implementation ticket is finalized. If the team cannot say what result would change its next action, another dashboard widget will not solve the problem. A clear decision, an eligible cohort, and a verified path from search exposure to user value will.

    References


  • Ecommerce Category Internal Linking: A Practical System

    Ecommerce Category Internal Linking: A Practical System

    Your ecommerce site has more category pages than your navigation can reasonably promote. Merchandising wants one collection featured, SEO sees demand for another, and yesterday’s bestseller still holds most of the site’s internal links. Adding links everywhere won’t resolve that conflict.

    You need a repeatable way to decide which categories deserve support, identify where the current architecture sends the wrong signal, and place links that are useful to shoppers. The goal isn’t an equal distribution. It is an intentional one.

    Make each category earn additional internal links

    Start with the category’s value, not its current link count. A URL does not become important merely because your platform created it, an audit flagged it, or a team wants to rank it. Before you promote a category, confirm that it represents a durable opportunity for both the business and the shopper.

    Evaluate each candidate against these criteria:

    • Business importance: The category supports a defined commercial priority, such as profitable growth, a strategic product line, or a sustained merchandising commitment.
    • Search opportunity: People look for the category as a distinct concept. Its intent is meaningfully different from the parent category and nearby alternatives.
    • Inventory strength: The page offers enough relevant products to satisfy the visit, and stock is likely to remain available. A prominent link to a thin or frequently empty collection sends shoppers into a dead end.
    • Durability: The category will matter beyond a brief promotion. A recurring seasonal category can qualify, but a disposable campaign URL usually should not receive permanent architectural prominence.
    • Landing-page usefulness: The page helps someone understand the selection and continue shopping. Links cannot compensate for an unclear category, irrelevant products, or an experience dominated by unavailable inventory.

    A practical approval record can be short. For every proposed target, write down the target URL, its business purpose, the demand it serves, the inventory owner, and whether it is permanent, recurring, or temporary. That forces the team to distinguish a real category opportunity from a request for more SEO attention.

    Be especially selective with filters. Color, size, brand, material, price, and other facets can produce a large population of URL combinations. Opening internal paths to all of them can slow the discovery of more useful content. Promote a filtered landing page only when it has distinct demand, dependable inventory, a stable purpose, and enough structural support to function as a genuine category.

    If a URL fails those tests, more internal links are not the remedy. Improve or consolidate the page, keep the filter available for shoppers without broadly promoting its URL, or direct attention to the stronger parent category.

    Audit the gap between business priority and site architecture

    Tabletop model contrasting prominently displayed product collections with uneven pathways through a digital storefront structure.

    Once you have a qualified set of categories, compare what the business considers important with what the site currently presents as important. This is the central diagnostic step.

    Google can infer a page’s relative importance from internal-link relationships, including how many internal links lead to the page and how many links a crawler must follow to reach it. Shoppers receive a similar message: categories exposed in navigation and related content look central, while deeply buried categories look peripheral.

    Run the audit in this order:

    1. Set the commercial priority first. Label each approved category as a current priority, a category to maintain, or a low-priority page. Do this before reviewing SEO metrics so existing visibility does not quietly become your definition of importance.
    2. Crawl from the shopper-facing site. Record the shortest click path from the homepage, the number of crawlable internal links pointing to each category, and the templates or pages supplying those links.
    3. Separate structural links from incidental links. A persistent navigation link, a parent-category path, an editorial recommendation, and an old campaign link do not play the same role. Label the source and placement instead of treating every link as interchangeable.
    4. Check relevance. Inspect whether the linking pages share a real product, audience, or shopping relationship with the target. A large count of unrelated links can conceal a weak architecture.
    5. Find mismatches. Prioritize categories with high commercial importance but weak site support. Also flag low-priority categories that still occupy prominent navigation or receive extensive legacy links.

    Use relative comparisons within your own catalog. A universal target for click depth or link count would ignore differences in store size, navigation design, and taxonomy. Compare equivalent category types, then look for outliers.

    Business priorityCurrent site supportWhat it meansRecommended action
    HighLowThe architecture understates a qualified opportunity.Find relevant, prominent pages that can supply links.
    HighHighThe site already reflects the priority.Maintain the paths; investigate other constraints before adding more links.
    LowHighLegacy architecture may be spending attention on an outdated priority.Review navigation and inherited modules before promoting new targets.
    LowLowThe architecture and current business priority are aligned.Leave it alone unless its role changes.

    This matrix prevents a common mistake: assuming that every important category needs more links. If a category is already easy to reach, prominently represented, and supported by relevant pages, its problem may be weak inventory, poor intent alignment, or an unhelpful landing page. Another batch of links would obscure that diagnosis.

    Place links where they help someone continue shopping

    Shopper viewing image-only product panels for trail shoes, hiking socks, outdoor clothing, and backpacks connected in a natural shopping sequence.

    After identifying an under-supported category, choose donor pages by relationship rather than raw authority. The best question is simple: would a shopper on this page reasonably want to explore that category next?

    Consider link locations in descending order of structural fit:

    1. Primary navigation: Reserve this scarce space for durable categories that matter broadly to the business and to shoppers. A short campaign or narrow subcategory rarely belongs here.
    2. Parent categories: A broader department or collection is often the clearest route to an important child category. Make the child visible in the page’s category list or other useful navigation, rather than relying on filters alone.
    3. Closely related categories: Add a related-category module when the destination is a plausible alternative or next step. The relationship should remain understandable without an SEO explanation.
    4. Buying guides and editorial content: Link when the content discusses the product type or helps the reader choose it. This connects informational intent with an appropriate shopping destination.
    5. Recurring seasonal hubs: Use them to support stable seasonal categories while the relationship is useful. Do not let expired promotional pages become the category’s only meaningful route.

    Use anchor text that identifies the destination in ordinary language. The category name is usually clearer than a vague phrase such as “shop now” or an awkward string of keyword variations. Surrounding copy should explain why the destination is relevant; the link should feel like part of the shopping decision, not an SEO insertion.

    Keep the implementation crawlable and consistent with the site’s existing components. Test the final rendered page rather than approving a design mockup alone. Confirm that the link resolves to the intended URL, appears for users and crawlers, works on mobile, and does not point through an unnecessary redirect.

    Avoid solving every mismatch with global navigation or a sitewide footer. Broad placements multiply links quickly, but they ignore context and consume space across the entire store. A focused set of strong paths from parent, related, and editorial pages usually tells a more coherent story about the category’s role.

    Roll out changes as an allocation test

    Internal-link changes often coincide with promotions, inventory shifts, content launches, paid campaigns, and seasonal demand. Without a record of what changed, an improvement or decline becomes difficult to interpret.

    Create a change log with the target category, donor page, placement type, anchor text, implementation date, and business reason. Capture a baseline before release for:

    • the target’s click path and internal-link sources;
    • organic impressions, clicks, and landing-page visibility;
    • shopper clicks on the new link or module;
    • category entrances, product engagement, and conversion outcomes;
    • inventory availability and any promotions affecting demand.

    When possible, phase the work by category group instead of changing the whole taxonomy at once. Keep a comparable set of qualified categories unchanged during the same period. It will not create a perfect experiment, but it gives you a better reference point than a simple before-and-after comparison.

    Look for a coherent chain of evidence. The new paths should be live and used; the target should become easier to discover; search visibility should move in a useful direction; and the traffic should produce meaningful shopping behavior. A ranking movement without inventory, engagement, or commercial value is not enough to justify permanent prominence.

    Review allocation when the business changes. A category that deserved navigation space during a sustained growth phase may later belong under its parent. Likewise, a category with emerging demand and dependable inventory may outgrow its old position. Internal architecture should reflect current priorities without swinging with every short promotion.

    FAQ: ecommerce category internal linking decisions

    Should every category receive a similar number of internal links?

    No. Equal counts would treat strategic categories, utility filters, temporary collections, and minor subcategories as if they had the same role. Allocate links according to business importance, search opportunity, inventory, durability, and relevance.

    Should a buried priority category go into the main navigation?

    Only when it is durable, broadly useful, and important enough to justify scarce navigation space. A narrower category may be better supported through its parent, related collections, and relevant buying content. The right correction is the clearest useful path, not automatically the most global placement.

    Should filtered pages receive internal links?

    Most filter combinations should remain shopping tools rather than promoted landing pages. Support a filtered URL only when it represents distinct and sustained demand, carries adequate inventory, has a stable purpose, and deserves a defined place in the taxonomy.

    Can internal links fix an underperforming category?

    They can correct weak discovery and an architecture that understates the category’s importance. They cannot create search demand, replenish inventory, clarify a confused taxonomy, or make a weak landing page useful. Diagnose those constraints before treating link volume as the answer.

    Start with one qualified category that the business values but the site currently hides. Document the mismatch, add the smallest set of relevant paths that corrects it, and measure the entire journey from discovery to commercial outcome. That gives you a defensible model for the next category instead of another sitewide link rule.

    References


  • Marketing Partnership Accountability: A Practical Operating Model

    Marketing Partnership Accountability: A Practical Operating Model

    You hired capable marketers, approved a plan, and waited for the commercial result. Now the report is full of green arrows while sales says the inquiries are weak, revenue is unchanged, or the work is promoting the wrong offer. Before you conclude that the agency failed or that marketing simply does not work, check whether the partnership ever established a shared definition of success.

    A marketing partner can own research, recommendations, campaigns, content, technical execution, and reporting. It cannot choose your commercial priorities, reveal operational constraints it has never been told about, or decide what your sales team considers a worthwhile lead. Accountability works only when execution is delegated without abandoning leadership.

    Define success in commercial terms before choosing channels

    A brief that says “increase traffic,” “improve rankings,” or “grow AI visibility” gives the marketing team permission to optimize for visible movement. It does not tell them which movement creates value. A campaign can perform exactly as instructed and still send attention toward a low-margin service, attract people who will never buy, or generate demand the business cannot fulfill.

    Begin with a commercial brief that the business leader, marketing lead, and sales lead can all recognize as true. It should answer:

    • What are we trying to sell? Name the priority products or services, the offers that should not receive more demand, and any margin, inventory, staffing, or delivery constraints.
    • Who is the buyer? Describe the person or organization with the problem, the person who approves the purchase, the trigger that creates urgency, and the characteristics that make an account unsuitable.
    • What action matters? Distinguish an informational visit from a buying action such as requesting an assessment, booking a consultation, starting a trial, or contacting sales.
    • What is a qualified lead? Record the required fit, intent, need, authority, and exclusions. “Someone completed a form” is an event, not a qualification standard.
    • How does the business make money? Give the marketing team enough context to understand margins, sales priorities, buying journeys, and the difference between a valuable opportunity and expensive noise.
    • What could change the plan? Surface supply constraints, capacity limits, offer changes, sales coverage, regulatory concerns, and shifting business priorities before they invalidate the campaign.

    This is the dividing line between delegation and abdication. You can outsource specialist execution while retaining responsibility for direction. The business supplies commercial truth and makes consequential decisions. The marketing partner learns the business, challenges weak assumptions, and turns that context into a defensible strategy.

    Use a simple approval test before work begins: could the marketing team explain which buyer matters, which offer deserves demand, why that offer matters commercially, and how sales will judge the resulting opportunities? If not, the partnership is not ready to debate keywords, content formats, paid campaigns, schema, AI-search citations, or channel budgets.

    Assign decision rights before work gets stuck

    Four colleagues organize color-coded decision tokens around converging project paths while one person moves the central token forward.

    Many accountability disputes are ownership disputes in disguise. The agency believes it was waiting for approval. The client believes the agency was hired to take initiative. Sales believes marketing owns lead quality. Marketing believes sales never followed up. Everyone can describe the failure, but nobody had a named final owner for the decision that would have prevented it.

    Create an accountability map at the start of the engagement and revise it whenever the team or scope changes. A practical version looks like this:

    Decision areaBusiness responsibilityMarketing-partner responsibilityEvidence used
    Commercial prioritiesSet and approve priorities, constraints, and tradeoffsExplain the marketing implications and challenge contradictionsMargins, capacity, sales priorities, and business goals
    Qualified-lead definitionDefine fit with sales and provide rejection reasonsTranslate the definition into targeting, messaging, offers, and measurementAccepted leads, rejected leads, sales outcomes, and stated reasons
    Audience and positioningValidate factual claims, differentiation, and brand boundariesResearch the audience, propose messages, and test assumptionsCustomer language, search behavior, sales objections, and campaign response
    Channel and technical executionProvide access and identify material business risksRecommend, implement, verify, and document the workTechnical checks, delivery records, and performance signals
    Budget or resource changesApprove material reallocationsRecommend changes with expected benefits, risks, and uncertaintyOpportunity cost, performance, capacity, and strategic fit
    Performance interpretationProvide actual business outcomes and challenge assumptionsConnect activity to results, explain uncertainty, and propose the next decisionMarketing, sales, revenue, and operational data

    The map should name people, not just departments. “Client to approve” is not ownership. “Sales director approves the lead definition” is. “Agency monitors performance” is incomplete. “Paid media lead recommends reallocations; the business sponsor approves material changes” describes an operating relationship.

    Keep the boundaries sensible. The business sponsor should not become the approval bottleneck for every title tag, ad variation, or internal link. The agency should not quietly decide which product line matters most or publish claims that require business validation. Each side should control the decisions for which it has the context and authority, while making dependencies visible to the other.

    Watch for four warning signs: requests that lack a named decision-maker, approvals with no clear acceptance criteria, strategy changes delivered as casual feedback, and work that proceeds on an unverified commercial assumption. These are not minor process flaws. They create a future argument in which both sides can plausibly say they thought the other side was responsible.

    Build a scorecard that follows the path to revenue

    A tabletop sequence of campaign objects, brass checkpoints, a product sample, interlocking forms, and metallic discs depicts a progression toward revenue.

    Traffic, rankings, impressions, clicks, AI citations, and brand mentions can be useful. They show whether the market is encountering your business and help diagnose where a strategy is gaining or losing traction. They become vanity metrics when the report presents them as proof of commercial success without showing what happened next.

    A useful scorecard reads from the business result backward:

    • Business outcomes: revenue, gross profit, retained business, or another result the company actually values.
    • Pipeline quality: qualified opportunities, lead acceptance, disqualification reasons, pipeline progression, and closed business.
    • Conversion efficiency: whether the intended audience reaches the right page, takes the intended action, and becomes a sales-worthy inquiry.
    • Demand and visibility signals: relevant organic visits, target-query visibility, paid response, branded demand, AI-search visibility, citations, and engagement with commercial content.
    • Delivery and learning: work completed, assumptions tested, technical problems found, lessons learned, and decisions required.

    The layers matter because no single metric tells the whole story. Strong visibility with weak relevant traffic may indicate that the pages or search appearances are attracting the wrong intent. More inquiries with poor sales acceptance may expose faulty targeting, an ambiguous offer, or a loose lead definition. Better qualified pipeline without closed revenue may require examination of sales progression, buying time, pricing, or follow-up. Growing demand for an offer the business cannot deliver is a reason to redirect marketing, not celebrate the graph.

    For SEO, AEO, and GEO work, resist the temptation to make visibility the final destination. A target query should relate to a buyer problem the business can solve. A cited page should lead the right reader toward a useful next step. An increase in AI mentions should be interpreted alongside audience relevance, qualified demand, and commercial outcomes. Otherwise, you are measuring presence without determining whether the presence helps the business.

    Every metric in the scorecard needs a definition, a data owner, an interpretation, and a decision it can influence. If the team cannot say what it would do differently when a metric changes, that metric probably does not belong in the executive view. It may still be valuable in a specialist diagnostic report, but it should not be used to defend an engagement.

    This does not mean demanding direct revenue attribution from every technical fix or content update. Marketing contains leading indicators, delayed effects, and attribution gaps. It does mean requiring a credible line of sight from the work to the customer journey. Impressions, traffic, and rankings are indicators rather than business outcomes; the partner should explain what they indicate, what remains uncertain, and what evidence would justify the next move.

    Run reviews as decision meetings, not report readings

    A dashboard does not create accountability by itself. The operating loop closes only when business context, marketing evidence, sales feedback, and decisions meet in the same conversation. If a review consists of the marketer reading slides while everyone else waits for the final chart, the partnership is documenting activity rather than governing it.

    Build each review around four inputs:

    • Business context: what changed in priorities, margins, capacity, product availability, positioning, or competitive pressure?
    • Funnel truth: which inquiries did sales accept or reject, why were they treated that way, and what happened after handoff?
    • Marketing evidence: what shipped, what changed, which hypothesis was tested, what did the evidence support, and where is the interpretation still uncertain?
    • Decision queue: what needs approval, what should stop, what should continue, what should change, and who owns each next action?

    Sales feedback must be specific enough to change marketing. “The leads are bad” gives the partner nothing to operationalize. Useful feedback identifies the reason: the company was too small, the contact lacked authority, the request concerned employment rather than a purchase, the geography was wrong, the need did not match the offer, or the person was researching without buying intent. Marketing can then adjust targeting, messaging, qualification, forms, content, or channel allocation.

    The marketing partner owes the same level of specificity. “The algorithm changed” or “the campaign needs more time” is not an adequate explanation on its own. The partner should identify the observed change, show which part of the plan it affects, separate evidence from inference, explain the commercial implication, and recommend a decision. Technical detail is useful when it clarifies the choice. It is a problem when it obscures the absence of one.

    Keep an action register with the decision, owner, due point, expected evidence, and status. This prevents the same unresolved dependency from reappearing under different wording. It also makes accountability fair: you can distinguish weak execution from a missing approval, an unavailable data feed, an undisclosed business constraint, or feedback that never reached the people doing the work.

    Adopt a no-surprise rule. The business should disclose material commercial changes as soon as they affect the plan. The marketing team should flag deteriorating quality, wrong-audience signals, tracking gaps, blocked work, or invalid assumptions before the formal report. Waiting until results are challenged turns a manageable course correction into a trust problem.

    Marketing partnership accountability FAQ

    Who is accountable when marketing misses its target?

    Start with the agreed responsibilities rather than assigning blanket blame. The marketing partner is accountable for learning the business, recommending a coherent strategy, executing competently, reporting honestly, and identifying misalignment. The business is accountable for setting priorities, supplying commercial context and access, making decisions, and returning sales and outcome data. A missed target becomes a clear performance failure when the responsible party did not perform an agreed obligation, concealed a problem, or repeatedly failed to learn from evidence. A target miss caused by a disclosed assumption that proved wrong is a learning event, provided the team responds to it.

    What should an executive marketing report include?

    It should connect business outcomes, pipeline quality, conversion behavior, relevant demand signals, completed work, uncertainty, and pending decisions. Each major metric should answer a management question. Executives need to know whether marketing is attracting the intended buyer, supporting the current commercial priority, producing sales-worthy demand, and learning fast enough to justify continued investment. Channel diagnostics can sit beneath that view for the specialists who need them.

    When should you replace a marketing partner?

    Consider replacement when the partner refuses to learn how the business makes money, relies on activity metrics to avoid commercial questions, cannot explain its assumptions, repeats work that attracts the wrong audience, conceals uncertainty, or fails to act on clear feedback. Before ending the relationship, document the commercial objective, decision rights, measurement chain, missing inputs, and corrective actions. That reset shows whether the problem is capability, conduct, scope, or the operating model around the partner. If the business continues to withhold decisions, context, access, or lead feedback, changing agencies will reproduce the same failure with a different logo.

    At your next review, bring the commercial brief, accountability map, scorecard, and action register. Ask the partner to state which offer matters, who the qualified buyer is, what the current evidence means, and which decision is needed from you. Then provide the business context and sales truth they cannot generate on their own.

    You do not need to manage every campaign setting or technical task. You do need to keep strategy connected to the way the company creates value. That is how an outsourced vendor becomes a governed marketing partnership, and how both sides earn the right to be judged on results.

    References


  • Marketing Investment and Incrementality: A Practical Guide

    Marketing Investment and Incrementality: A Practical Guide

    You have a campaign with a healthy return on ad spend, a partner claiming attributed sales, and a finance team asking whether the next dollar should stay. Those facts can all coexist even when the campaign created little new demand. If the budget decision rests on attribution alone, you can reward the channel that was best at standing near an existing sale.

    Incrementality gives you a better basis for that decision. It estimates what changed because of the investment, counts what the investment really cost, and separates a profitable growth engine from activity that merely collected credit. The same discipline works for paid media, commerce networks, SEO and GEO programs, content operations, and AI automation.

    Start with the decision, not the dashboard

    Attribution and incrementality answer different questions. Attribution assigns credit among observed touchpoints. Incrementality asks whether the outcome would have occurred without the marketing activity. That distinction matters because a person exposed to an ad may have purchased anyway.

    Measurement approachQuestion answeredUseful forMain failure mode
    AttributionWhich touchpoint received credit for an observed conversion?Reporting journeys, managing campaigns, and diagnosing channel interactionsCrediting marketing for demand that already existed
    IncrementalityHow much did the outcome change because the investment was present?Budget allocation, forecasting, renewal decisions, and growth planningUsing a weak or contaminated comparison as the counterfactual

    You can never observe the same customer at the same moment both with and without an intervention. A credible test therefore constructs a counterfactual: a comparable estimate of what would have happened without the investment. The quality of that estimate determines whether your lift number is useful.

    Write the decision before choosing a metric. A practical decision statement is: For this eligible population, will this investment produce enough additional business value over this comparison to clear our economic hurdle? Every term needs an operational definition.

    • Eligible population: The customers, accounts, regions, queries, pages, or workflows that could realistically receive the intervention.
    • Investment: The exact spend, campaign, content program, partner, tool, or process change being evaluated.
    • Primary outcome: One business result that can change the decision, such as completed purchases, qualified opportunities, retained customers, or accepted production output.
    • Comparison: A randomized holdout, matched market, staged rollout group, or another defensible estimate of the no-investment outcome.
    • Economic hurdle: The minimum contribution, payback, capacity gain, or other finance-approved result required to justify the investment.

    Use an outcome hierarchy

    A campaign can improve a platform metric without improving the business. Prevent that confusion by assigning each metric a role before launch:

    • Primary outcome: The result that decides whether to invest, such as incremental contribution or qualified pipeline.
    • Guardrails: Results that must not deteriorate, such as margin, return rates, lead quality, publishing accuracy, or customer retention.
    • Diagnostic metrics: Impressions, clicks, rankings, citations, AI visibility, engagement, and other signals that help explain why the primary outcome moved.

    Transaction proximity can make measurement cleaner because the path from exposure to purchase is shorter. It does not, by itself, prove causation. Closed-loop purchase data can show that an exposed customer bought; only a credible comparison can estimate whether the exposure changed that customer’s behavior.

    Count the full investment, including hidden AI labor

    A transparent worktable reveals human review, computing infrastructure, data preparation, and quality control beneath a small set of visible campaign costs.

    Incremental revenue is not enough to justify an investment. You need to compare incremental economic value with the complete cost of producing it. Media spend and software subscriptions are visible. Learning time, quality control, data preparation, creative production, agency support, and operational rework often are not.

    The visibility gap is especially pronounced with AI initiatives. An NBER working paper surveying about 6,000 senior executives across four countries found that 69% used AI for less than one hour a week and 28% did not use it at all. Decision-makers who are distant from production can see a subscription price and a fast output without seeing the workflow construction, failed runs, checking, correction, and governance underneath it.

    Build an investment ledger with separate lines for:

    • Media, platform, network, and technology fees.
    • Creative, content, landing-page, feed, and schema production.
    • Agency, contractor, analytics, engineering, and legal or compliance support.
    • Data acquisition, identity resolution, tagging, storage, and measurement.
    • Internal planning, campaign operations, stakeholder review, and reporting time.
    • Training, workflow design, prompt or automation development, and rollout support.
    • Quality assurance, fact-checking, editing, exception handling, and rework.
    • Incremental fulfillment, support, discounts, returns, and other variable costs created by the additional business.

    For an AI-enabled marketing investment, run a 30-day labor audit before defending its efficiency. Have the people doing the work record time in four distinct categories: learning tools, operating workflows, checking and repairing outputs, and editing or fact-checking long-form work. Explain that the audit measures the process rather than individual performance. Anonymous aggregation can reduce the pressure to underreport.

    Separate setup costs from recurring costs. A pilot may look expensive because it includes workflow design and training that will not recur at the same level. The reverse also happens: an impressive demonstration can omit the continuing cost of review, maintenance, data cleanup, and failures in daily use. Show both the learning-period economics and the expected steady-state economics instead of averaging them into one reassuring number.

    Keep the financial calculation legible

    Do not hide the business case inside one blended percentage. Show these lines separately:

    • Incremental outcome: The observed result minus the estimated no-investment result.
    • Incremental net revenue: Revenue attributable to the incremental outcome, after cancellations, discounts, or returns where applicable.
    • Incremental contribution before marketing: Incremental net revenue minus the variable costs required to deliver it.
    • All-in marketing investment: The cash and labor costs required to run and measure the intervention.
    • Net incremental value: Incremental contribution before marketing minus the all-in marketing investment.

    If finance uses a different contribution or payback definition, use that definition consistently. Do not silently substitute platform revenue for finance-approved value. Show opportunity cost alongside the calculation: what work, campaign, or capacity did this investment displace? That cost may not belong in the formal ratio, but it belongs in the decision.

    Run a test that can change the budget

    Two matched miniature commercial districts are compared, with an abstract marketing intervention applied to one district while the other remains untreated.

    A useful incrementality test is designed backward from a decision. It does not begin with whatever report a platform happens to provide. Before money moves, document the following:

    1. Choose one primary decision metric. Secondary metrics can explain the result, but they must not replace the primary outcome after the data arrives.
    2. Define the unit of assignment. Depending on the investment, this may be a customer, household, account, region, page group, topic cluster, or production workflow.
    3. Select the strongest practical comparison. Randomized holdouts are usually the cleanest option when assignment and exposure can be controlled. Matched geographies, staggered rollouts, or time-based switchbacks can be useful when individual randomization is not feasible.
    4. Set the observation window and detectable effect in advance. Base test size and duration on the normal outcome rate, expected variability, and the smallest lift worth acting on. A monthly meeting date is not a measurement rationale.
    5. Record contamination and operational changes. Cross-channel exposure, audience overlap, internal linking, promotions, pricing changes, stock constraints, sales activity, and mid-test optimizations can all make the comparison less credible.
    6. Pre-commit to actions. State what result will lead you to scale, repair, retest, or stop. This prevents a favored program from receiving a new success definition after it misses the original one.

    Choose the comparison design that fits the investment

    • Randomized audience holdout: Use when you can assign eligible people or accounts to treatment and control and can observe the business outcome for both groups. Watch for people receiving the campaign through another platform or device.
    • Geographic holdout: Use when media exposure or commercial activity can be separated by market. Match markets on relevant baseline behavior and account for local promotions, distribution, competitors, and seasonality.
    • Staggered rollout: Introduce the program to comparable units at different times. This can suit SEO, GEO, content, platform, or workflow changes when a permanent control is impractical. Keep rollout order from simply mirroring business priority or existing performance.
    • Switchback design: Alternate treatment and comparison periods when simultaneous holdouts are unavailable. This is vulnerable to day-of-week effects, seasonality, carryover, and changes in demand, so the time blocks must reflect how quickly the intervention’s effect starts and fades.
    • Pre/post comparison: Use only when stronger designs are unavailable. Demand, competition, algorithms, distribution, and pricing can change between periods, making a simple before-and-after result easy to misread.

    Match the outcome to the type of investment

    InvestmentPossible assignment unitDecision-grade outcomeCommon contamination risk
    Commerce or retail mediaCustomer, household, or geographyCompleted purchases, incremental contribution, or new-customer valueExposure through overlapping networks or promotions
    Paid search or paid socialAudience cell, customer, or geographyQualified conversions, contribution, or pipelineRetargeting and cross-device exposure
    SEO, AEO, or GEO programEligible page group, topic cluster, market, or rollout waveQualified organic demand, leads, or attributable business valueInternal-link, brand, and domain-level spillover
    AI marketing automationTask type, workflow, team, or rollout waveAccepted outputs, time per accepted output, throughput, or defect-adjusted capacityUnrecorded manual work and people switching between old and new processes

    For SEO, AEO, and GEO work, rankings, mentions, citations, and visibility are valuable diagnostics. They are not automatically incremental business outcomes. If visibility is the strategic objective, define it that way before the program begins. If revenue, leads, or qualified demand is the objective, do not substitute visibility after launch because it improved first.

    Report uncertainty with the point estimate. A positive estimate surrounded by a wide range of plausible outcomes is not the same as dependable positive lift. If the plausible range includes both no effect and an economically valuable effect, the result is inconclusive. That does not prove the investment failed, but it also does not justify describing success as established.

    Statistical significance and economic significance are also different. A precisely measured lift can still be too small to cover the investment. A larger but uncertain estimate may deserve another test rather than an immediate scale-up. Let the economic hurdle and the cost of making the wrong decision determine the next step.

    Turn lift into allocation rules and partner requirements

    An incrementality result becomes valuable when it changes allocation. Put each tested investment into one of four decision states:

    • Scale: Lift is credible, net incremental value clears the agreed hurdle, and guardrails remain acceptable. Increase investment in controlled steps and remeasure because response can weaken as reach expands.
    • Repair: The activity creates additional outcomes, but fees, labor, margin, lead quality, or operational burden make the economics unattractive. Fix the cost structure or targeting before buying more volume.
    • Learn: The result is inconclusive, but resolving the uncertainty is worth more than the cost of another test. Improve assignment, sample size, tracking, or exposure separation rather than repeating the same design.
    • Stop or reallocate: Credible evidence shows little lift, negative value, unacceptable guardrail damage, or no realistic path to trustworthy measurement. Continuing because a platform reports attributed conversions compounds the original error.

    Partner selection should support this process. For commerce media, compare options across scale and purchase intent, measurement, activation, working relationship, and proximity to the transaction. A large reachable audience is less valuable when it is passive or difficult to measure. A smaller, high-intent audience can be more useful when exposure, purchase, and comparison data are clear.

    Any evaluation framework supplied by a media network should organize your diligence, not serve as independent proof of lift. Before committing budget, ask each prospective partner:

    • How are treatment and comparison groups created?
    • Can the comparison group still receive ads through another placement, network, campaign, or device?
    • Which outcome is primary, and when is that outcome considered complete?
    • Are reported sales new to the business, shifted from another channel, accelerated from a later date, or merely attributed to the exposure?
    • How are repeat purchasers, new customers, cancellations, returns, and duplicated conversions handled?
    • Will the partner report uncertainty, group sizes, exclusions, and failed assignments as well as the lift estimate?
    • Can your analysts inspect sufficiently detailed data and methodology to reproduce or challenge the conclusion?
    • Will campaign optimization remain stable during the test, or will the platform change delivery in ways that undermine the comparison?
    • If customer lifetime value is used, which portion is observed and which portion is forecast?
    • Can the test be repeated after spend, audience, creative, or season changes?

    No partner needs to solve every marketing problem. One may offer strong purchase signals and limited reach; another may provide scale but a weaker counterfactual. Build a portfolio around the jobs each partner can actually perform, then compare the incremental value of those jobs against their all-in costs.

    Use a one-page investment memo

    Give leadership a decision document rather than a dashboard tour. Keep it to six lines of argument:

    1. Decision: The budget, renewal, rollout, or allocation choice that must be made.
    2. All-in investment: Cash, labor, setup, recurring operations, measurement, and material opportunity cost.
    3. Test: Eligible population, assignment unit, counterfactual, primary outcome, window, and known contamination.
    4. Result: Incremental outcome and its uncertainty, with attributed performance shown separately.
    5. Economics: Incremental net revenue, contribution before marketing, all-in investment, and net incremental value.
    6. Action: Scale, repair, learn, or stop, including the next budget level and the condition that would reverse the decision.

    This format also improves conversations about AI investment. Instead of arguing whether AI is broadly fast, useful, or inevitable, you can show the workflow affected, the human effort consumed, the accepted output produced, the quality guardrails, and the capacity or financial value that changed.

    Key takeaways

    • Attributed revenue tells you where credit landed; incrementality estimates how much business the marketing activity actually created.
    • Define the budget decision, eligible population, counterfactual, primary outcome, and economic hurdle before the campaign or rollout begins.
    • Count the full investment. For AI workflows, include learning, operation, output repair, editing, and fact-checking time rather than measuring only subscriptions or generation speed.
    • Use the strongest feasible comparison design, document contamination, and distinguish an inconclusive result from evidence of no lift.
    • Judge partners by the quality and transparency of their incrementality method, not just their attributed sales, audience scale, or dashboard polish.
    • Translate every result into a pre-agreed action: scale, repair, learn, or stop.

    Before your next budget review, choose one disputed investment and write its decision statement. Build the all-in cost ledger, name the counterfactual, and agree on the action thresholds before asking for another report. That small change turns incrementality from a measurement project into an allocation discipline.

    References


  • Practical SEO Measurement: How to Prioritize What Works

    Practical SEO Measurement: How to Prioritize What Works

    You can have rankings, clicks, conversions, and a polished dashboard yet still be unable to answer the question that matters: should you put another sprint, another content batch, or another dollar into this SEO initiative?

    The practical goal isn’t to prove that SEO caused every conversion. It is to build enough reliable evidence to decide what to continue, what to expand, what to repair, and what to stop. That requires a measurement contract for every meaningful initiative, explicit thresholds, and an honest separation between what you observed and what you inferred.

    Measure for the decision, not the dashboard

    An architectural model shows a central evidence platform leading to four distinct routes, with a pointer aimed toward one path.

    Start by naming the decision your measurement must support. Are you deciding whether to launch, wait, expand, revise, or stop? A metric can be useful without answering all five questions.

    Separate the evidence into four levels:

    • Delivery evidence: Did the planned pages, templates, links, or technical changes actually ship? Until they do, you are measuring execution failure or delay, not SEO impact.
    • Leading indicators: Did search engines discover and index the affected pages? Are nonbrand impressions, rankings, or other early visibility signals moving in the expected direction?
    • Observed business outcomes: Did the affected traffic produce qualified leads, revenue, subscriptions, lower acquisition costs, affiliate earnings, or another unit of value that the business recognizes?
    • Attributed influence: How much of that outcome can reasonably be connected to the initiative? This is usually the least certain layer because SEO changes overlap with seasonality, algorithm changes, product releases, competitor activity, and work elsewhere on the site.

    Do not promote evidence from one level into another. Indexation shows that pages entered the search system; it does not show that the pages created profitable demand. More impressions indicate visibility; they do not prove incremental revenue. An organic conversion is observable, but its recorded channel does not reveal every earlier interaction that influenced the buyer.

    This distinction also keeps disagreements about tools from derailing the decision. Search Console and web analytics observe different events, while Search Console totals may not reconcile when segmented. Assign one system of record to each metric, document the definition, and judge movement within that system. Do not force unlike datasets to produce an artificial match.

    For every metric on your scorecard, complete this sentence: “If this crosses the agreed threshold by the review date, we will make this decision.” If you cannot finish the sentence, the metric may be informative, but it is not yet operational.

    Write a measurement contract before the work starts

    A project board is arranged with a target, balance scale, hourglass, boundary blocks, and separate trays of evidence stones.

    A forecast describes what you hope will happen. A measurement contract states how the team will decide what to do after reality arrives. Write it while everyone is still neutral, before delayed results and sunk costs make the thresholds negotiable.

    The contract should contain:

    <!– wp:list {
  • Google Ads Automated Bidding Changes: What to Reassess

    Google Ads Automated Bidding Changes: What to Reassess

    Your Google Ads campaign can look less efficient even when automated bidding is doing exactly what you told it to do. If a budget-limited campaign used to beat its target ROAS or CPA but now buys more expensive traffic and exhausts its budget sooner, don’t assume the bidder is broken.

    The more useful question is whether your target still expresses the result your business actually needs. Google has made target-based bidding more literal for budget-constrained campaigns, while a separate retail beta adds product-level value signals. Together, these changes put more responsibility on you to define acceptable economics rather than relying on budget pressure to produce accidental efficiency.

    Budget limits no longer create the same efficiency buffer

    A limited tank of glowing coins drains through an automated bidding machine that sends larger bundles toward several abstract auction gates.

    A target ROAS or target CPA is an instruction, not a label. If you give the bidder a target that is looser than your real business requirement, it has room to pursue additional opportunities until performance approaches that stated target.

    Before the Smart Bidding change, a constrained budget could effectively make bidding more conservative. Some campaigns captured cheaper clicks, stretched their allocations and substantially exceeded their targets. The update that started rolling out on Aug. 17 and finished globally on Aug. 27 was intended to make target-based, budget-limited campaigns perform more consistently around the goals advertisers entered, including when budgets changed.

    The practical consequence is easy to miss. A target CPA campaign set to $10 but previously delivering a $5 CPA could move closer to $10 unless the advertiser tightens the target. The equivalent can happen with target ROAS: historical overperformance is not necessarily a permanent buffer when the system is being asked to deliver only the lower stated return.

    The initial post-rollout pattern was substantial. Median CPC for budget-limited target ROAS campaigns rose 15.8%, while CPC for campaigns that were never budget-limited fell 13%. Before the change, more than half of the constrained campaigns were exceeding their ROAS targets. Only 30% of non-limited campaigns overdelivered, while 57% landed on target.

    Observed medianBefore the rolloutAfter the rolloutWhat you should notice
    CPC for budget-limited campaigns€0.38€0.44The constrained campaigns paid more for each click.
    Impression share lost to rankAbout 45%About 30%Ad rank was responsible for a smaller share of missed impressions.
    Impression share lost to budgetAbout 4%About 33%The budget became the more direct constraint.
    Overall impression share40%31%The campaigns reached a smaller portion of available impressions.

    That combination matters more than any one number. Higher CPC, lower rank loss and sharply higher budget loss indicate that the bidder may be competing more strongly when it enters an auction, then running into the spending limit sooner. It is a different mechanism from simply bidding conservatively all day.

    The findings are early rather than universal. Conversion attribution was still developing, so the long-term ROAS effect was not yet settled. Treat Aug. 17 as a meaningful diagnostic breakpoint, not as proof that every performance change in every account has the same cause.

    Audit affected campaigns without hiding the change in averages

    An account-level average can conceal exactly what you need to see. Separate target-based campaigns that were budget-limited from campaigns that had enough budget. The two groups moved differently after the rollout, so combining them can turn a clear bidding shift into an ambiguous blended trend.

    1. Identify campaigns using a target-based strategy. Separate target ROAS from target CPA so you evaluate each one against the correct efficiency measure.
    2. Flag campaigns that were budget-limited around the rollout. Keep campaigns that were never constrained as a comparison group rather than mixing their results into the same total.
    3. Use Aug. 17 as the beginning of the change and Aug. 27 as the completion point. Avoid treating the rollout interval as a clean before-or-after period.
    4. Allow conversion attribution to mature before making a final ROAS or CPA judgment. CPC and impression-share signals appear sooner than fully attributed conversion value.
    5. Compare actual performance with the target you entered. Record target ROAS versus delivered ROAS, or target CPA versus delivered CPA, rather than looking only at the change from the previous period.
    6. Review CPC, total impression share, impression share lost to rank and impression share lost to budget together where those metrics are available. This shows whether the campaign became less competitive, more budget-constrained or both.
    7. Check the business result behind the platform metric. Revenue, contribution margin, inventory priorities and acquisition value determine whether performance near the target is acceptable.

    Read the metrics as a system

    If CPC rises, rank loss falls and budget loss rises, the campaign is probably bidding more competitively and exhausting its allocation more directly. Review the target before assuming the budget is too small.

    If actual ROAS falls toward target ROAS, or actual CPA rises toward target CPA, the bidder may be using the flexibility you explicitly gave it. Decide whether the additional opportunity is economically worthwhile. Don’t call the movement a failure merely because the old campaign overdelivered, but don’t accept it merely because the platform reached its target either.

    If total impression share falls while budget loss rises, you face a real reach decision. You can accept fewer impressions, tighten the target and potentially reject more opportunities, or fund more of the available demand. The correct answer depends on the value of the next unit of spend, not on a desire to recover an old impression-share percentage.

    If those auction signals are absent, don’t force the bidding update to explain the problem. A conversion-tracking change, product mix, demand shift or landing-page issue can also alter ROAS or CPA. The update is a hypothesis to test against campaign-level evidence, not a universal diagnosis.

    Choose the lever that matches the actual constraint

    You have four defensible responses: accept less reach, tighten the target, increase the budget where the economics support it, or reconsider the bidding strategy. The dangerous response is to raise the budget automatically because the interface says a campaign is limited.

    Tighten a target that understates your real requirement

    If the business needs a higher return than the target ROAS currently entered, raise the target toward the efficiency level you genuinely require. If the business cannot tolerate the current target CPA, lower that target toward the acceptable acquisition cost. Historically delivered performance can inform the change, but it should not replace your unit economics.

    A tighter target can reduce reach because the bidder must reject opportunities that do not fit the new instruction. That is not necessarily a defect. It is the cost of refusing volume that fails your efficiency requirement.

    Increase the budget only when performance at the target is valuable

    A larger budget can make sense when the stated target is profitable and additional demand has value. Evaluate the next dollars as though they will perform near the target, not at the unusually strong ROAS or CPA the constrained campaign used to deliver. The update was designed to bring delivery closer to the entered goal, so historical overperformance is a weak basis for approving more spend.

    This decision creates direct financial exposure. Set the approved spending limit from margin, cash flow and customer value, then decide how much reach to purchase. A platform warning that a campaign is budget-limited does not establish that the missed traffic is profitable.

    Accept reduced reach when the budget is fixed

    If the spending cap cannot move and the target already reflects your economics, reduced reach may be the honest result. You cannot demand the same auction coverage, preserve the same efficiency and keep the same budget when click costs rise. Choose which constraint is real instead of asking automation to satisfy three incompatible requirements.

    Reconsider the strategy when one target cannot express the objective

    A single account-wide or campaign-wide value target can be too blunt when products have materially different commercial value. Before abandoning automation, examine whether the bidding system is receiving the wrong definition of value. For retailers, the Product Value Optimization beta is intended to address part of that problem.

    Whichever lever you select, change it deliberately. Altering the target, budget and value rules together makes the result hard to interpret. Record the reason for the first change, let attributed conversions develop, and then judge whether that lever addressed the constraint you identified.

    Product Value Optimization adds business context to retail bidding

    Generic retail products send layered margin, inventory, customer value, and priority signals into a central automated bidding engine.

    Standard conversion-value bidding can treat equal amounts of reported revenue as equally desirable even when the underlying sales have different margins or inventory consequences. Product Value Optimization is a retail beta that allows value adjustments for individual products or attributes such as brands and categories. Those adjusted signals can guide automated bidding in Performance Max and Shopping campaigns without requiring a campaign restructure.

    This gives you three different controls with three different jobs. The budget limits the spend available. The ROAS or CPA target communicates the desired efficiency. A product value rule tells the bidder which items or sales deserve more emphasis. Confusing those jobs leads to bad fixes, such as raising an entire campaign’s budget when the real need is to favor a profitable category within it.

    The beta identifies profit, seasonal sell-through and best-selling products as possible use cases. Those goals are not interchangeable. A bestseller may produce volume but weak incremental profit. Seasonal inventory may warrant temporary priority because its value falls after the selling window. A high-margin product may deserve emphasis even if it does not lead the revenue report.

    Define the rule before enabling the adjustment

    1. Choose one commercial objective for the rule: profit, seasonal sell-through or another clearly defined inventory priority.
    2. Select the narrowest appropriate level. Use a product rule when the priority is item-specific, or an attribute such as category or brand when the logic genuinely applies across that group.
    3. Write down why the selected sale is more valuable. Higher revenue alone is not enough if margin, returns or inventory costs point in the opposite direction.
    4. Map overlapping product, category and brand logic before activation. The bidder needs a coherent value hierarchy, not competing expressions of internal preferences.
    5. Keep actual revenue and profit as independent business measures. An adjusted optimization value is an instruction to the bidder; it is not proof that the resulting sales created more profit.
    6. Evaluate product mix as well as aggregate ROAS. A stable top-line return can hide a meaningful shift toward or away from the inventory the rule was designed to prioritize.

    If the beta appears in your account, start with the business distinction you can defend most clearly. A rule grounded in margin or time-sensitive inventory has a testable rationale. Prioritizing a product merely because it is already popular risks teaching the bidder to amplify volume that would have occurred anyway.

    Key takeaways

    • Budget-limited target bidding may no longer produce the same conservative bidding and accidental target overperformance it produced before the Aug. 17 rollout.
    • A CPC increase combined with lower rank loss and higher budget loss is more informative than a CPC increase viewed alone.
    • Treat target ROAS and target CPA as permissions the bidder can use, not as passive reporting benchmarks.
    • Model a budget increase at performance near the stated target rather than assuming the campaign will retain its former overperformance.
    • Use Product Value Optimization to express genuine differences in commercial value, not to promote products based on popularity alone.
    • Allow attribution to mature before declaring the long-term ROAS effect, because the available post-rollout evidence was still preliminary.

    Start with the budget-limited campaign where the gap between target and historical performance was largest. Reconstruct what changed across CPC, impression-share losses and actual efficiency, then make the smallest change that brings the bidding instruction back into line with the economics you are prepared to accept.

    References


  • How to Build a Google Analytics Dashboard for Decisions

    How to Build a Google Analytics Dashboard for Decisions

    You open Google Analytics to answer one question and end up moving through several reports, copying figures into a document, and trying to remember whether everyone used the same comparison period. The data may be available, but the route to a decision is unnecessarily long.

    Google Analytics Dashboards can shorten that route by putting selected KPIs and visualizations on a customizable, grid-based canvas. The useful part isn’t the canvas itself. It is the discipline of deciding which questions deserve permanent space, which chart can answer each question, and what someone should do after seeing the result.

    Decide what the dashboard must make obvious

    A dashboard should reduce decision time. It shouldn’t reproduce every report your team might occasionally need. Before you add a card, write a short dashboard brief that answers:

    • Who will use it? An SEO lead investigating landing pages needs different detail from an executive checking overall acquisition and conversion performance.
    • What recurring decision will it support? Examples include deciding where to investigate a traffic decline, which content group needs attention, or where users leave a conversion journey.
    • How often will someone review it? The review rhythm determines whether short-term movement or longer trends deserve more space.
    • What is the primary outcome? Name the result the dashboard is supposed to monitor before choosing supporting metrics.
    • Who owns the response? A metric without an owner becomes decoration. Decide who investigates, who explains, and who acts.

    Turn each proposed card into a complete question. “Organic traffic” is only a label. “Is traffic from organic discovery moving in the expected direction, and which landing content explains the change?” is a question. It tells you that you need a headline value, a trend, and enough detail to locate the affected content.

    Give every KPI an explicit scope as well. The team should know which property, audience, outcome, time period, and comparison the number represents. Two people can read the same number differently when one assumes all traffic and the other assumes a particular channel. The dashboard won’t fix an unsettled definition; it will simply make the ambiguity more visible.

    This distinction matters for SEO, AEO, and GEO reporting. Google Analytics can show activity captured in the property, including measurable visits and subsequent behavior. It cannot turn external rank tracking, AI citation visibility, crawl findings, CRM revenue, or platform delivery data into Analytics measurements merely by arranging cards on a page. Keep those claims in their appropriate systems, then use the dashboard for the questions its data can actually answer.

    Build from outcomes to diagnosis

    A large outcome tile branches into several smaller diagnostic dashboard modules in a layered hierarchy.

    The builder lets you drag dimensions and metrics onto the canvas, then position, resize, and align the resulting visualizations. That makes experimentation easy, but it also makes it easy to fill the page before establishing a hierarchy.

    Build in the order a reader will think:

    1. Start with the outcome. Place the KPI that best represents the dashboard’s primary business result where the eye lands first.
    2. Add its context. Show the input or volume metric needed to interpret that result. An outcome without scale can make a small fluctuation look more important than it is.
    3. Show direction. Add a time-series view so the reader can distinguish a sustained movement from an isolated value.
    4. Expose the main comparison. Break performance down by the category most likely to explain a change, such as an acquisition grouping or content grouping that your measurement plan defines consistently.
    5. Provide a diagnostic route. Use a detailed table for the pages, campaigns, or other entities someone will inspect next.
    6. Add the journey where it matters. If the decision concerns an ordered conversion process, use a funnel to reveal the step where progress changes.
    7. Remove repetition. If two cards lead to the same observation and action, keep the clearer one.

    This sequence creates a practical reading path: outcome, context, trend, explanation, detail, action. It also leaves room beneath the documented cap of 15 cards for standard properties. Premium properties can contain up to 30, but a larger allowance isn’t a reason to use every available position.

    Review the completed canvas at the size your intended audience will normally use. Visual priority comes from position and size as well as chart type. If the primary outcome is smaller than a supporting breakdown, the layout is telling the reader that the breakdown matters more.

    Match each business question to the right visualization

    Six dashboard cards display abstract line, bar, ring, funnel, dot, and gauge visualization forms.

    Six visualization types are available: scorecards, tables, line charts, bar charts, donut charts, and funnel charts. Choose among them by the question being asked, not by the visual variety they add to the page.

    VisualizationQuestion it should answerBest useCommon mistake
    ScorecardWhat is the current headline value?A primary KPI or an essential context metricDisplaying several isolated values without showing why any change matters
    Line chartWhen did the movement begin, and did it persist?Performance over timeUsing a trend line when the real question is a comparison between categories
    Bar chartWhich categories are larger, smaller, ahead, or behind?Direct category comparisonsAdding so many categories that meaningful differences become hard to see
    Donut chartHow is a whole divided among a limited set of parts?A simple composition or share breakdownUsing similar-sized or numerous slices that are difficult to compare
    TableWhich exact item requires investigation?Detailed rows that support diagnosisTurning the dashboard into an exhaustive data export
    Funnel chartAt which ordered step does progression change?Conversion steps and drop-offsTreating unrelated actions as if they formed a single sequential journey

    Use date context deliberately. Scorecards can display percentage change when a date comparison is applied, while line charts support daily, weekly, and monthly views. Pick the line-chart interval that matches the decision rhythm. A view that is too granular can distract the reader with ordinary variation; one that is too broad can conceal when a meaningful shift began.

    A percentage movement also needs its underlying value. A large percentage attached to a small base may deserve less attention than a modest movement in the metric most closely tied to the business outcome. Keep the scorecard for quick detection, then place a trend or detailed breakdown nearby so the reader can test whether the movement is broad, persistent, and actionable.

    Publish with property-wide governance in mind

    Creating a useful layout is only half the job. A user needs an Editor or Administrator role to create and publish a dashboard. Once published, the dashboard can be viewed by anyone who has access to the property, and it can be placed directly in the Reports navigation without routing it through the Analytics library.

    That convenience changes the governance standard. Published dashboards are shared across the property rather than privately with selected individuals, so don’t treat the published area as a personal scratchpad. Settle experimental metric definitions and layouts before exposing them to every property user.

    • Name the audience and purpose clearly. A title such as “Content performance” is weaker than one that identifies the intended decision or review context.
    • Assign an owner outside the dashboard. Someone should be responsible for definitions, layout changes, and questions from viewers.
    • Record the KPI definitions. Preserve the scope, outcome meaning, and expected response in team documentation so the dashboard doesn’t become its own undocumented vocabulary.
    • Check the published view with ordinary access. Confirm that the navigation placement and reading order work for viewers, not only for the person who built it.
    • Review cards when strategy changes. Remove KPIs that no longer inform a live decision instead of leaving them in place for historical familiarity.

    Plan around the launch limitations before promising the dashboard as a complete reporting system. API support, segments, and card-level comparisons were not supported at launch. That means you shouldn’t design a workflow that depends on programmatic dashboard management, segment-based dashboard cards, or a different comparison basis for each card unless those capabilities are verified in your property.

    The absence of card-level comparisons is especially important. Agree on a coherent comparison before presenting the page, and explain any analysis that requires a different baseline somewhere else. Otherwise, adjacent cards can appear comparable while answering different questions.

    Key takeaways

    • Start with a recurring decision and its owner, then choose the metrics needed to make that decision.
    • Arrange cards as a reading path from outcome to context, trend, explanation, and diagnostic detail.
    • Use scorecards for headline values, line charts for timing, bar charts for comparison, donut charts for simple composition, tables for diagnosis, and funnels for ordered journeys.
    • Keep metric definitions and scope explicit; a clean layout cannot repair an ambiguous KPI.
    • Design within the 15-card standard or 30-card premium limit, but treat those figures as ceilings rather than targets.
    • Publish only after accounting for property-wide visibility, role requirements, and the feature limitations that applied at launch.

    Your first dashboard should feel focused rather than comprehensive. Open the builder with your decision brief beside you, place the primary outcome first, and add a card only when it helps the reader detect a change, explain it, or choose the next action. If a card does none of those jobs, leave the space empty.

    References


  • How to Tell Whether an SEO Audit Is Worth the Money

    How to Tell Whether an SEO Audit Is Worth the Money

    You have an SEO audit proposal in front of you, but the deliverables sound suspiciously like a list of errors from a crawling tool. The price may buy expert investigation, or it may buy an export you could generate yourself.

    The difference is judgment. A valuable audit identifies which findings are real, explains why they matter to your business, accounts for intentional choices and technical constraints, and gives your team a safe order of operations. Use the framework below before signing a proposal or implementing recommendations from an audit you have already received.

    Start with the decision the audit must unlock

    An audit cannot be valuable in the abstract. It has to help you make a decision: what to repair, what to improve, what to leave alone, and where to invest next.

    Write the audit’s job as one sentence before discussing tools or deliverables. For example:

    • Find out why commercially important pages are not being crawled, indexed, or discovered.
    • Determine whether a site migration introduced technical problems that are suppressing organic visibility.
    • Identify which content gaps prevent the site from satisfying the audience’s most important questions.
    • Separate genuine technical defects from warnings that do not affect search performance.
    • Assess whether search and AI visibility lead visitors toward a meaningful conversion.

    That sentence becomes your first acceptance criterion. If a recommendation does not help answer the stated question, it should not outrank work that does.

    The auditor also needs context that a crawler cannot collect on its own. At minimum, provide your business goals, priority audiences, important products or services, conversion paths, recent site changes, platform constraints, known technical debt, and any SEO decisions your team made intentionally. Without that context, an automated warning can easily be mistaken for a defect. Implementing the resulting recommendation may waste development time or reduce visibility instead of improving it.

    AI search does not make this discovery work optional. Many large language model experiences use retrieval and existing search results to find information with which to construct or check an answer. Your pages still need to be accessible, indexable, relevant, credible enough to surface, and useful once someone arrives. That makes an effective SEO audit part technical review, part content evaluation, and part business analysis. Calling the same crawler export a GEO audit does not add value.

    A valuable audit adds judgment to crawler data

    A specialist inspects a layered website structure with a magnifying lens while automated devices flag both harmless details and one broken connection.

    Crawlers are useful. They can expose URLs, response behavior, directives, internal linking patterns, metadata, and other machine-readable signals at a scale that manual browsing cannot match. The mistake is treating those observations as conclusions.

    This distinction matters because professional audits can cost from $2,500 to more than $20,000, depending in part on the size of the site and the engagement. Screaming Frog and Sitebulb cost a fraction of that amount, and trial access may be available. Run one of them against your site before buying an audit. You do not need to become a technical SEO; you only need enough familiarity to recognize when the final deliverable reproduces automated output without adding analysis.

    Part of the workLow-value outputUseful audit work
    DiscoveryRepeats crawler warnings and severity labelsCombines automated findings with manual investigation
    ContextAssumes every unusual configuration is wrongChecks business intent, technical debt, templates, and platform constraints
    EvidenceNames an issue without showing its scopeProvides affected URLs, patterns, or examples when they are needed
    ExplanationUses generic wording that could describe any siteExplains what is happening on your site, why it matters, and what may have caused it
    RecommendationIssues a universal command such as fix all or remove allTailors the action to your goals and identifies exceptions, dependencies, and risks
    PriorityCopies a tool’s high, medium, or low labelOrders work by likely business impact, effort, confidence, and potential downside
    HandoffEnds with a list of tasksClarifies ownership, implementation needs, and how the result will be checked

    Ask the auditor to walk you through one finding using that table. A convincing answer should distinguish what the tool detected from what manual review established. It should connect the issue to your audit objective, explain the proposed change, identify what could be affected, and state how your team will know whether the change worked.

    Generic explanations are another warning sign. Crawler documentation often explains why a category of warning may matter. Paying an expert makes sense when the expert can determine whether it matters here. A useful explanation names the relevant part of your site and shows the path from observation to consequence. If the same paragraph could be pasted into an audit for an unrelated company, it is probably documentation rather than analysis.

    Test every recommendation before it enters the backlog

    A technical team tests a website component in a transparent staging chamber before moving it toward a balanced production structure.

    A long audit can feel substantial while still being difficult to use. Do not judge it by page count, warning count, or the number of charts. Judge each recommendation by whether your team can verify, understand, execute, and measure it.

    Is the finding valid?

    Start with the evidence. Which URLs, page types, templates, queries, or journeys are affected? Is the pattern consistent? Did manual review confirm the crawler’s interpretation? Could the behavior be intentional?

    A tool can tell you that two pages look similar or that a directive blocks crawling. It cannot reliably decide whether the pages serve different audiences or whether the directive protects low-value areas from unnecessary crawling. The audit should resolve that ambiguity, not hide it beneath a severity label.

    Is the finding material?

    Connect the issue to a meaningful outcome. Does it prevent discovery or indexing? Does it weaken the page’s relevance for an important audience? Does it make a valuable page harder to navigate? Does it obstruct the conversion path?

    Not every technically imperfect detail deserves engineering time. An audit should make that trade-off visible. The useful question is not whether a warning exists; it is whether resolving that warning is a better use of resources than the competing work in your backlog.

    Is the recommendation executable and safe?

    Your implementation team should be able to identify the target, desired behavior, dependencies, owner, and exceptions. The auditor should provide examples where that falls within their expertise. Where it does not, they should still explain what needs to change and why, then identify the type of specialist required.

    Be especially careful with recommendations that affect server configuration, templates, directives, canonicals, redirects, or large groups of URLs. A blanket change can alter access to far more pages than the audit intended. Do not send ambiguous instructions straight into production. Have a qualified developer define the implementation, use your normal review and testing process, and preserve a rollback path.

    Can you verify the result?

    Define completion before implementation. A technical change may be complete when the intended URLs return the expected behavior and the crawler confirms no unintended pattern. A content change may require checking discovery, relevant search visibility, qualified visits, and the next step in the conversion journey.

    Separate implementation validation from performance evaluation. The first asks whether the change was deployed correctly. The second asks whether it improved the outcome that justified the work. Without both, your team can close tickets without learning whether the audit created value.

    For a fast review, label every recommendation Keep, Clarify, or Reject. Keep it when the evidence, consequence, action, risk, and validation plan are clear. Mark it Clarify when one of those elements is missing. Reject it when manual review disproves the finding, the action conflicts with an intentional decision, or the likely value does not justify the risk and effort. This turns an intimidating report into a governed backlog.

    Protect the engagement in the scope and contract

    You should know what will be delivered before the crawl begins. A strong scope does not merely promise an SEO audit. It describes the investigative work, the form of the evidence, the method of prioritization, and the handoff.

    • Manual review: Require investigation beyond crawler, analytics, or LLM output.
    • Site-specific reasoning: Require each material finding to explain its relevance to your site, audience, and business objective.
    • Evidence: Specify that affected URLs, templates, examples, or patterns will be included where needed.
    • Prioritization: Ask for impact, confidence, effort, dependencies, and implementation risk rather than tool-generated severity alone.
    • Handoff: Define whether the fee includes a walkthrough, questions from developers, implementation examples, or post-change validation.
    • Exclusions: Record what the auditor will diagnose but cannot implement, and who is expected to own that work.
    • Early notification: Require the auditor to tell you if manual investigation finds nothing material beyond automated output.

    A refund or scope-change provision can make the final point enforceable. One practical starting point is: The deliverable must include material findings from manual review and site-specific reasoning beyond automated crawler or LLM output. If the auditor determines that no such findings exist, the parties will agree to a revised scope or an appropriate partial refund before final delivery. A deliverable consisting solely of automated output triggers a full refund.

    That language carries commercial and legal consequences, so have your procurement team or counsel adapt it to the engagement and local requirements. The purpose is not to prohibit crawlers or AI assistance. Those tools can support the work. The provision makes clear that your fee purchases human discovery, interpretation, and prioritization rather than undisclosed automation.

    If the investigation finds that a full audit is unnecessary, do not force production of a padded report. Agree on the useful alternative before the work continues. Depending on the professional’s actual skills and your original goal, the remaining effort might be redirected toward content, development planning, conversion analysis, analytics, or another defined need. Document the revised deliverable and price so goodwill does not replace accountability.

    You can also evaluate the auditor’s fit before signing. The relevant expertise depends on the question you need answered. A crawl and indexation problem calls for strong technical and development literacy. A visibility problem may require content and audience analysis. An engagement expected to connect traffic with revenue needs analytics and conversion competence. No individual has to implement every discipline, but the proposal should state where the auditor’s expertise ends and how gaps will be handled.

    Key takeaways

    • An audit fee should buy judgment, prioritization, and a safer decision path, not merely crawler data.
    • Define the business question first; recommendations that do not help answer it should not dominate the backlog.
    • Run a crawler yourself before hiring so you can distinguish automated output from expert investigation.
    • Require manual review that accounts for your audience, goals, intentional decisions, technical debt, and conversion path.
    • Accept a recommendation only when its evidence, consequence, action, risk, ownership, and validation method are clear.
    • Put site-specific deliverables, early notification, scope revision, and refund terms in the agreement before work begins.
    • Evaluate AI-search readiness through the same fundamentals: accessible and indexable pages, relevant content, sufficient visibility, and a useful destination for the visitor.

    Open the proposal or completed audit now and highlight where it promises manual discovery, site-specific reasoning, prioritized action, implementation safeguards, and validation. Ask for a revision wherever one of those elements is absent. If recommendations have already reached your backlog, place the ambiguous ones on hold until someone can supply the missing evidence or context.

    The right audit leaves you with fewer uncertainties, not simply more tasks. Buy it when you need informed decisions that your tools and internal context cannot produce separately.

    References


  • How to Validate a Programmatic SEO Pilot Before Scaling

    How to Validate a Programmatic SEO Pilot Before Scaling

    You have a spreadsheet full of potential URLs, a working template, and a credible path to publishing at scale. The decision in front of you is not whether the pages can be generated. It is whether the underlying page pattern deserves to be multiplied.

    That distinction matters because one page model can unlock hundreds or thousands of search opportunities, but it can multiply weak differentiation just as efficiently. A proper pilot should reveal where the model earns discovery, distinct search demand, and useful visitor behavior. It should also expose the conditions under which the model breaks.

    Key takeaways

    • Compare 10 candidate pages before development. If their substance barely changes, the template is not ready for search.
    • Build the pilot from strong, average, and difficult cases. A collection of obvious winners cannot validate the larger opportunity.
    • Record each page’s intended query family, possible competing URL, unique information, and desired visitor action before launch.
    • Evaluate four separate gates: discovery and indexing, query fit, performance drivers, and business behavior.
    • Scale only the segments supported by the evidence. A successful subset does not justify publishing every possible permutation.

    Define the page pattern as a testable hypothesis

    A programmatic template is not a strategy by itself. It is a production mechanism. Your strategy begins with a hypothesis about why each generated page will deserve its own URL and satisfy a distinct need.

    Write that hypothesis in a form your pilot can disprove:

    For [audience or context], a page differentiated by [variable] will satisfy [query family] because it provides [unique information], leading the visitor toward [useful action].

    For an integration library, the variable might be the connected product. The unique information might include supported workflows, setup instructions, screenshots, and limitations. For location pages, meaningful differences could come from local inventory, provider availability, pricing, or market-specific data. A changed city name or software logo is not meaningful differentiation if the underlying problem, evidence, and answer stay the same.

    Before anyone builds the generator, sketch 10 candidate pages and compare them side by side. For each candidate, answer:

    • What information changes in a way that helps this visitor?
    • What problem, constraint, or decision is specific to this variation?
    • What data, proof, examples, or screenshots change?
    • What capability, inventory, workflow, or limitation changes?
    • What should the visitor do next, and why is that action appropriate here?

    If most answers reduce to swapped nouns, do not move into pilot production. You have found a keyword permutation, not a durable page pattern. Either add a data source that creates substantive variation, narrow the eligible page set, or abandon the pattern.

    This is also where structured data belongs in the plan. Keep markup and other template-wide elements consistent unless you are deliberately testing them. Valid JSON-LD can describe a page accurately, but it cannot supply the missing local facts, workflows, inventory, or proof that should distinguish one generated URL from another.

    Create a pilot manifest before publishing. Give every candidate a row containing:

    • The proposed URL and page type.
    • The primary search intent and related query family.
    • The existing URL most likely to compete with it.
    • The unique information or assets available for that variation.
    • The intended visitor action.
    • Relevant characteristics such as demand, data depth, inventory, internal-link depth, competition, and content completeness.

    Those fields become your baseline. Without them, a team can reinterpret almost any post-launch result as success.

    Build a representative pilot, not a showcase

    A varied sample of blank web-page cards and assorted data pieces is arranged on a worktable beside a larger unused stack.

    The easiest candidates are useful for proving that the template can work under favorable conditions. They cannot tell you whether it will hold up across the full library.

    Build your sample around the dimensions that vary in the eventual rollout. A location project might include large, medium, and small markets, plus locations with rich and limited inventory. An integration project might include well-known connections with extensive workflows, ordinary integrations with moderate demand, and edge cases with less supporting material. A use-case library should likewise include both obvious audience needs and narrower combinations.

    There is no universal number of pages that makes a pilot valid. The right sample depends on how many materially different conditions the template must survive. List those conditions first, then select enough candidates to expose recurring differences without building the full library.

    A practical selection process looks like this:

    1. List every dimension that could change page quality or performance: demand, data depth, inventory, competition, link depth, and completeness.
    2. Divide each dimension into meaningful bands, such as stronger, typical, and weaker cases. Use labels appropriate to your dataset rather than arbitrary industry thresholds.
    3. Select candidates across the intersections. Do not let high-demand, data-rich pages dominate the sample.
    4. Check the manifest for missing conditions. If thin-data or low-demand cases will exist after scaling, they must appear in the pilot.
    5. Freeze the sample and success rules before results arrive. Additions made after launch should be treated as a new test, not quietly folded into the original one.

    A representative pilot is intentionally uncomfortable. It includes pages you suspect may fail because those failures help define an eligibility rule. If data-poor variations repeatedly fall out of the index or never acquire distinct queries, the lesson is not necessarily that the entire model failed. The model may work only above a particular level of data or inventory. That boundary is exactly what the pilot should uncover.

    Use four validation gates instead of one traffic total

    Web-page tiles move through four symbolic checkpoints for discovery, differentiation, quality, and visitor interaction before entering a limited expansion area.

    Do not collapse the pilot into sessions, clicks, or aggregate impressions. A few strong URLs can conceal widespread indexing problems, query overlap, or pages that attract attention without helping the business. Evaluate each gate separately, by URL and by candidate segment.

    Gate 1: Can Google discover and retain the pages?

    Start by checking whether Google can find each pilot page through your internal linking structure. Then distinguish initial indexing from sustained indexing. A URL that enters the index briefly and later disappears has not demonstrated the same stability as one that remains indexed.

    • Was the URL discovered?
    • Did it enter the index?
    • Did it remain indexed over the observation period?
    • Do indexed and excluded pages differ by data depth, inventory, completeness, or internal-link depth?

    Suppose 40 of 50 pilot location pages remain indexed, while the excluded pages consistently have limited local inventory. That is not proof that inventory alone caused the outcome. It is a useful hypothesis: the page model may require more inventory to remain viable. Test that condition in the next controlled batch before turning it into a permanent rule.

    Do not respond to weak indexing by publishing more URLs. That increases the number of pages requiring discovery, internal links, and maintenance without resolving the defect the pilot exposed.

    Gate 2: Do the URLs attract their intended query families?

    Compare the queries recorded in your manifest with the impressions each URL receives in Google Search Console. Look beyond the primary phrase. Related queries often show more clearly whether Google understands the page’s specific purpose.

    Imagine separate pages for CRM software aimed at accountants, real estate agents, and consultants. The pattern is beginning to differentiate if each page attracts searches connected to its intended industry. If all three mainly appear for the same generic CRM terms and overlap with the main product page, the audience variable has not translated into distinct search relevance.

    Some query overlap is natural. The warning sign is not a shared word; it is a shared job. Flag URLs when most of their visibility comes from a generic intent already served elsewhere, when several generated pages repeatedly compete for the same query family, or when the intended supporting queries never emerge.

    For every flagged URL, choose a deliberate response: sharpen its unique information, merge it into a stronger page, change the eligibility rule, or remove it from the scalable pattern. Do not leave overlapping URLs in place simply because each one received impressions.

    Gate 3: Which page characteristics travel with better results?

    Once individual results are visible, group pilot pages by the characteristics you recorded before launch. Compare cohorts based on search demand, unique-data depth, inventory or product availability, internal-link depth, competition, and content completeness.

    The objective is not to crown a universal ranking factor. It is to identify the operating conditions for your page model. Integration pages with detailed setup instructions and several supported workflows may consistently outperform pages with a short capability description. Data-rich locations may remain indexed more reliably than locations with sparse availability. Those associations tell you what to test next and which candidates should qualify for expansion.

    Keep the analysis at URL level before rolling it up. Report how each segment performs across indexing, intended-query visibility, and the desired visitor action. An overall average can look healthy even when every edge case fails.

    Gate 4: Does the visibility produce useful behavior?

    Organic visibility is an intermediate result. Your pilot also needs a business outcome appropriate to the intent: starting setup, viewing available inventory, requesting information, creating an account, or moving into another meaningful step.

    Define that action before launch and measure it by page and segment. Otherwise, teams tend to celebrate whatever metric moved. A page with impressions but no useful next step may have an intent mismatch, an incomplete answer, or a weak transition into the product. A lower-volume page can still justify its place if it attracts the intended audience and produces the behavior the page was designed to support.

    If AI visibility is also part of your objective, record it separately rather than treating Google indexing as a proxy. Define the prompt family you care about, note whether the brand or page appears in the relevant response, and capture any citation or link that is actually present. Keep those observations distinct from Search Console query performance so one channel does not mask failure in another.

    Turn the evidence into a bounded scale decision

    A pilot is finished when it supports a decision, not when a reporting window happens to close. Give it enough time to collect meaningful evidence, then classify the result. Do not invent a universal waiting period; demand and page conditions differ too much for one calendar threshold to fit every project.

    Observed patternLikely implicationNext action
    Weak discovery across most segmentsThe internal path to the library is not working reliably.Repair the linking structure and rerun the pilot before expanding.
    Only data-rich or inventory-rich pages remain indexedThe template may work under a narrower eligibility condition.Test and document a minimum data rule, then exclude weaker candidates.
    Pages are indexed but attract generic, overlapping queriesThe proposed variation is not creating a distinct search purpose.Rework the page model, consolidate overlapping URLs, or stop the pattern.
    Visibility appears, but the intended action does notSearch intent, page value, or the next-step path may be misaligned.Diagnose the affected segment and retest before increasing URL volume.
    Strong results occur only among obvious head casesThe opportunity is smaller than the full permutation count suggests.Scale the proven segment and keep adjacent segments in testing.
    Multiple representative segments pass all four gatesThe page pattern has earned a controlled expansion.Release the next bounded batch and apply the same validation process.

    Use four decision states rather than forcing a binary launch:

    • Scale: Multiple representative segments meet your predeclared standards across all four gates, and you can describe the characteristics associated with success.
    • Expand the pilot: Results are promising, but an important condition is underrepresented or the apparent pattern rests on too few comparable pages.
    • Rework: The URLs are discoverable, but query overlap, thin differentiation, or weak business behavior points to a repairable page-model problem.
    • Stop: Most candidates cannot support materially different information, or representative pages repeatedly fail without a credible condition you can change.

    When you do scale, scale in bounded batches. Carry the manifest, eligibility rules, internal-link approach, and four gates into every release. New segments introduce new conditions, so success among large markets, popular integrations, or rich-data pages should not grant automatic approval to smaller markets, obscure connections, or sparse records.

    Your next step is simple: put 10 proposed pages side by side and complete the manifest before approving the generator. If their differences disappear under scrutiny, you have avoided multiplying a weak idea. If the differences hold, publish a representative pilot and let observed indexing, query fit, page characteristics, and business behavior determine how far the pattern deserves to go.

    References