Tag: Branded Search

  • False Allegations in Google AI Answers: How to Respond

    False Allegations in Google AI Answers: How to Respond

    You search your name and find a Google AI-generated answer accusing you of misconduct, suspension, fraud or another event that never happened. Your first move matters. The answer may change after the next query, while screenshots of the original allegation could become essential to a platform report, a publisher correction or legal advice.

    Treat this as an evidence, identity and reputation incident. Preserve what Google displayed, determine how the false narrative was assembled, correct the information environment around it and keep testing until the error is genuinely gone. A rewritten answer is not necessarily a corrected answer.

    Key takeaways

    • Capture the complete output before acting. Keep the query, wording, citations, date, time, language, location and relevant account context together.
    • Diagnose the failure precisely. A false source, unsupported citation, identity collision and invented inference require different corrections.
    • Work on three tracks. Report the AI answer, correct inaccurate or ambiguous web content and assess the professional or legal risk separately.
    • Strengthen your canonical identity. Consistent profile information and accurate Person JSON-LD can reduce ambiguity, but markup cannot force Google to retract an allegation.
    • Test a query set, not one search. The wording can disappear from one answer while surviving in related queries or a vaguer narrative.

    Preserve the output before it changes

    A laptop and phone are arranged on a desk to document a generic AI-generated answer, with a clock, notebook, and evidence folder nearby.

    Do not begin by editing your website or publishing an angry rebuttal. Generated answers can vary across queries and over time. In one documented incident, later searches replaced specific accusations with different but still inaccurate language, making the original output harder to reconstruct. Your evidence packet should exist before you ask anyone to change anything.

    1. Capture the whole result page. Save full-page screenshots and, where practical, a short screen recording that starts with the query and scrolls through the complete generated answer. Do not crop out qualifications, citations or surrounding context.
    2. Copy the exact text. A searchable text copy makes it easier to compare later versions word by word. Preserve unusual punctuation, headings and certainty language such as reportedly, allegedly, faced scrutiny or was suspended.
    3. Record the search conditions. Note the exact query, date, time zone, displayed language, approximate search location, device type and whether you were signed in. These details do not prove why the output appeared, but they make reproduction more disciplined.
    4. Save every cited page. Record each URL and the passage that supposedly supports the answer. Keep a copy of the page as it appeared at the time. The page may later be edited, removed or recrawled.
    5. Preserve contradictory evidence separately. Collect official registers, employer records, court or regulatory records, dated professional biographies and other primary material that establishes the accurate facts. Do not annotate or alter the originals.
    6. Start an impact log. Record who encountered the claim, when they saw it, what they did because of it and any resulting professional, contractual or financial consequence. Save direct communications rather than reconstructing them from memory later.
    7. Give each version an identifier. Labels such as AI-01, AI-02 and AI-03 make it clear which query, screenshot, output and report belong together.

    Keep an untouched evidence set and use redacted copies when sharing it. Search pages can expose account information, location clues or other personal data that a publisher, colleague or outside adviser does not need.

    Find where the false narrative entered the answer

    Anonymous source cards connect to a central AI prism, with a magnifying glass highlighting one identity strand routed into the wrong path.

    Calling the output a hallucination may be emotionally accurate, but it is not a useful diagnosis. Break every allegation into an individual factual proposition, then trace the apparent support for each one. One paragraph can contain several different failure modes.

    1. An underlying page makes the false claim

    If a cited page actually contains the accusation, the problem begins upstream. You need a correction, clarification, removal or legal assessment involving that page as well as feedback about the AI answer. Fixing your own profile will not neutralize a false statement that remains published elsewhere.

    2. The citation does not support the generated sentence

    A page may mention the right person but not the alleged event, or describe scrutiny without documenting a suspension. Record that mismatch exactly. The strongest report is not that the answer feels misleading; it is that a specific sentence asserts fact X while its displayed citation establishes only fact Y.

    3. Google has joined two identities

    Look for shared surnames, professional titles, employers, locations, initials, channel names and subject terms. An identity collision can occur even when each underlying fragment is real. The falsehood appears in the bridge between them.

    UK doctor and YouTuber Dr. Ed Hope said Google’s AI falsely claimed that he had been suspended in mid-2025, profited from selling sick notes, exploited patients and faced discipline because of his online fame. He believed the system may have connected his inactive YouTube channel, Dr. Hope’s Sick Notes, with an unrelated sick-note controversy involving another doctor, Dr. Asif Munaf. That explanation is a plausible identity-collision hypothesis, not a verified account of Google’s internal generation process. The important diagnostic lesson is that real fragments can be connected by a completely false relationship.

    4. The answer invents a narrative between unrelated facts

    The person and event may both be identified correctly while the claimed cause, motive or sequence is fabricated. A gap in publishing activity does not establish professional discipline. Online visibility does not establish that fame caused a regulator to act. Treat every causal word, not just every name and date, as a claim requiring support.

    Build a claim map with six fields: the exact AI sentence, its displayed citation, what that page actually says, the person or event described, the evidence establishing the accurate fact and the likely failure mode. This map becomes the working document for platform reports, publisher requests and professional advice.

    Run the correction on three separate tracks

    No single action covers the entire incident. Platform feedback addresses Google’s output. Publisher corrections address material on the open web. Professional and legal advice addresses the consequences. Run these tracks in parallel, but keep their evidence and objectives distinct.

    Track 1: Report the generated answer

    Use the feedback or reporting control attached to the answer when one is available. Interface labels can vary, so focus on the substance of the submission rather than the name of the button. Include:

    • the exact query and search conditions;
    • the complete false sentence, not a paraphrase;
    • the accurate fact stated in one direct sentence;
    • the identity distinction if another person or event has been attached to you;
    • the displayed citation and the precise reason it does not support the claim;
    • links to primary evidence that a reviewer can verify; and
    • the evidence identifier for your corresponding screenshot and text copy.

    Keep the report factual. Explain which proposition is false and how it can be checked. A long argument about AI safety gives a reviewer less usable information than a short claim-by-claim correction. Save any confirmation, case number or submitted text. If a materially different answer appears, preserve it as a new version before reporting that version too.

    Track 2: Correct the cited information environment

    If an external page contains the error, send its publisher a precise correction request. Identify the URL, heading, sentence, false proposition and primary evidence. Ask for a visible correction where quiet editing would leave readers with no way to understand what changed.

    If the cited page is accurate but Google has overstated it, do not pressure the publisher to rewrite a correct record merely to accommodate the AI system. Preserve the citation mismatch and concentrate the platform report on the unsupported inference. You can still ask the publisher to make ambiguous names or relationships clearer when a reasonable reader could confuse them.

    Track 3: Assess professional and legal exposure

    Claims involving criminal conduct, fraud, professional suspension, patient exploitation or regulatory discipline can carry consequences beyond search visibility. If the allegation is serious, persistent or already affecting work, speak with a lawyer qualified in defamation and reputation matters in the relevant jurisdiction. An SEO workflow is not a substitute for legal advice.

    Do not assume that Section 230 either resolves the issue or is relevant everywhere. It is a question of US law, and some legal experts have argued that generated output may be a newly published statement rather than third-party speech. Whether that position applies to a particular output, defendant or jurisdiction requires a legal assessment.

    Before notifying an employer, regulator, insurer, client base or large social audience, decide with the appropriate legal or communications adviser what the notification should accomplish. Unnecessary circulation can expose more people to the accusation and create additional searchable copies of it. Where a stakeholder genuinely needs warning, provide the preserved output, the accurate record and a concise statement of the steps underway.

    Make your identity harder to confuse without amplifying the lie

    A cleaner entity footprint can help search systems distinguish you from a namesake or unrelated event. It cannot prove a negative, erase an external page or guarantee a corrected AI answer. Think of it as disambiguation infrastructure, not a deletion tool.

    • Choose one canonical profile URL. Put the person’s full professional name, current role, organization, jurisdiction or location where appropriate, official profile links and a clear biography on a stable HTML page.
    • Keep identity facts consistent. The name, title, organization and profile links on the canonical page should agree with the organization’s team page and the person’s legitimate professional or social profiles. Resolve old titles and unexplained variants rather than publishing conflicting descriptions.
    • Add accurate Person JSON-LD. Use a stable @id and properties such as name, url, jobTitle, worksFor or affiliation, sameAs and, where genuinely useful, disambiguatingDescription. Every property should describe visible, verifiable page content.
    • Use sameAs narrowly. Link only to pages that represent the same person. A page that merely mentions the person, covers a similar topic or belongs to a namesake is not an identity-equivalent profile.
    • Connect primary records. Where appropriate, link to an official organization profile, professional register or other authoritative record that lets a reader verify the stated status directly.
    • Add contextual internal links. Organization biographies, author pages and relevant professional pages should link to the canonical profile using the person’s full name, not vague anchor text.
    • Clarify ambiguous brands and titles. If a channel, project or company name resembles the subject of an unrelated controversy, explain what it is and who owns it on the canonical page.

    If the allegation has already reached stakeholders, a short clarification page may be appropriate after legal or communications review. Keep it narrower than the rumor. State the accurate status, link to the record that verifies it, identify any mistaken entity only as far as necessary and show a publication or update date. Put the factual clarification in visible HTML rather than hiding it inside an image or downloadable file.

    A usable correction pattern: [Name] has not been [falsely alleged action]. [Official record] confirms [accurate status] as of [date]. The event involving [different person or organization] is unrelated. Use this structure only when every part is true, supported and appropriate to publish.

    Avoid mass-producing rebuttal pages, copying the accusation into every profile or adding unsupported positive claims to structured data. Those tactics enlarge the same noisy information environment that allowed the collision. One well-supported canonical record is more useful than a network of repetitive denials.

    Verify a correction instead of mistaking change for resolution

    When the original sentence disappears, resist declaring victory. The system may have removed the panel, softened the wording, changed its citations or moved the false association into another query. Verification needs a fixed test set and a record of every result.

    Your test set should cover:

    • the person’s exact name;
    • the name plus profession, organization or location;
    • the name plus the alleged event or disciplinary term;
    • the name plus the confused person’s distinguishing details;
    • the other person’s name plus the topic that triggered the collision; and
    • a distinctive excerpt from the original false sentence.

    For every check, record whether an AI answer appeared, its exact wording, its citations, the identity it described and the degree of certainty it used. Repeat relevant checks in the languages and locations where the person’s audience actually searches. Do not organize a public campaign asking large numbers of people to run the allegation as a query; that can spread the wording without producing controlled evidence.

    A correction is credible when the false assertion is absent across the relevant query set, replacement statements are accurate, displayed citations support what Google says, the mistaken identity no longer appears and later checks remain clean. A single favorable search is only one observation.

    Changed language deserves particular scrutiny. In Dr. Hope’s case, a later answer referred more vaguely to scrutiny and suspension, but it still attached an invented professional narrative to him; another variation blurred real and fictional contexts. The incident shows why less specific wording can remain materially false.

    Once the results are clean, archive the final test log and retain the evidence packet under an appropriate retention policy. Assign one person to own future checks and record the platform, publisher, legal and communications contacts that were useful. If you have not faced an incident yet, create the canonical identity page and branded-query test set now. Those two assets remove guesswork when a harmful answer appears.


    References

  • How TV Advertising Changes Search Behavior and Demand

    How TV Advertising Changes Search Behavior and Demand

    A TV campaign can do its job and still look inefficient in your dashboard. The spot creates curiosity, the viewer searches, and search receives the click and often the conversion. If the channels are reported separately, search gets credit for demand it did not create while TV loses credit for the action it caused.

    When a campaign is approaching, your practical problem is not whether TV affects search. It is whether the questions created by the commercial will meet the right result, whether your pages and paid campaigns can capture the resulting demand, and whether measurement can distinguish demand creation from demand capture. Treat those as one operating system.

    TV changes the query, not just the number of searches

    TV advertising does more than send extra people toward keywords that already exist. It can change what people search for, how specific their searches become, and which brand they include in the query.

    Someone who might otherwise search for a category such as car insurance may search for a particular insurer after seeing its commercial. Someone who was not shopping at all may search for the actor, song, claim, product, offer, or scene they remember. A later search may become more commercial: price, reviews, availability, eligibility, alternatives, or where to buy.

    That produces several distinct kinds of demand:

    • Navigational demand: The viewer remembers the company or product and wants the official destination.
    • Campaign-identification demand: The viewer remembers a celebrity, character, song, phrase, or plot but not necessarily the brand.
    • Informational demand: The commercial creates a question about what the product does, how an offer works, or whether a claim applies to the viewer.
    • Commercial-investigation demand: Interest turns into searches for pricing, reviews, comparisons, specifications, availability, or alternatives.
    • Transactional demand: The viewer looks for a store, application, booking page, product page, or other way to act.

    The sequence is not always linear. A viewer can search during the commercial on a second device, later that evening after another exposure, or days afterward when a related need appears. Comscore’s 2024 work connected coordinated TV and digital activity with stronger engagement and second-screen actions. In February 2025, YouTube also said television had overtaken mobile as the primary device for its U.S. viewing, based on Nielsen data. Your TV-to-search plan therefore needs to cover broadcast, connected TV, and streaming rather than treating them as separate consumer journeys.

    The timing can be fast. Google and Nielsen found in 2015 that TV ads could increase branded search queries by up to 20%, often within hours of an airing. DAIVID, a creative-analytics provider, has offered a higher vendor estimate of up to 60%, with the possibility of more in well-coordinated campaigns. Those figures demonstrate the possible scale, but they are upper bounds from different contexts, not universal planning assumptions. Reach, repetition, creative attention, prior brand awareness, category demand, market conditions, and the clarity of the call to action all affect the result.

    Do not place 20% or 60% into a forecast as if TV produces a fixed search multiplier. Build your planning range from your own previous airings, separated by market, creative, product, and schedule. If this is your first flight, treat branded search lift as a measurement question rather than a promised outcome.

    A useful working model is: exposure → attention → memory or curiosity → query → result → action. Search teams control the final handoffs. If the memorable clue from the commercial is absent from your pages, ads, video metadata, and entity information, viewers can be interested and still fail to find you.

    Build the search surface from the creative itself

    A television, phone, and laptop display matching unbranded visual elements connected by glowing lines.

    Keyword tools show existing demand. A new commercial can create language that did not have meaningful volume before the campaign. Start with the finished creative, not with last month’s keyword export.

    Watch the commercial without the creative brief in front of you. Record what an ordinary viewer could actually remember: the spoken brand name, product name, campaign line, spokesperson, character, visual device, offer, claim, date, location, and requested action. Then watch it again without sound. Connected-TV viewers may be distracted, and visual memory can produce a different query from the approved campaign wording.

    Turn those observations into a search-intent inventory:

    1. List exact entities. Include the brand, product, service, campaign, spokesperson, featured organization, and location named or shown in the spot.
    2. Write identification queries. Model the fragments a viewer might remember, such as [brand] commercial actor, ad with [scene], or what company made the ad about [theme].
    3. Write promise and explanation queries. Include the central benefit, claim, offer, qualification, or problem depicted in the commercial.
    4. Write action queries. Cover price, availability, release date, eligibility, locations, applications, bookings, trials, and where to buy when those intents apply.
    5. Add natural variants. Include abbreviations, common misspellings, shortened product names, and spoken versions of stylized brand names.
    6. Map every query family to a destination. Assign an existing page, create a new one, or document why paid coverage is the appropriate route.
    7. Inspect the live results. Search the phrases from the target market and device context. Check whether the correct page appears and whether the title and description make the relationship to the commercial obvious.

    The map should connect each memory or intention to an answer, not merely to your home page.

    Search signalLikely query patternBest destinationFailure to catch before airing
    Brand or product recall[brand], [product name]Official brand or product pageAn outdated page, reseller, or competitor is more prominent
    Memory of the creative[brand] commercial song, ad with [person or scene]Campaign page, video page, or concise commercial FAQThe creative clue appears nowhere in crawlable text or video metadata
    Offer or claim[offer] terms, how does [claim] workOffer page with conditions, dates, and next stepThe landing page repeats the slogan but does not explain it
    Evaluation[product] reviews, [product] vs [alternative]Product details, evidence, comparison, or review resourcesThe viewer must leave the site to understand basic differences
    Availability or locationwhere to buy [product], [service] near meStore locator, local page, product listing, or booking flowInventory, locations, or business information is inconsistent
    Eligibility or applicationwho qualifies for [offer], apply for [service]Eligibility explanation and application pageImportant restrictions appear only after the user starts converting

    The destination should visibly repeat the language and visual identity of the commercial. A viewer who searches after seeing an ad is looking for recognition as much as information. If the page uses a different product name, campaign line, image, or offer, the visitor has to decide whether they found the right company before they can consider the product.

    Put the answer to the commercial’s main unresolved question near the beginning of the page. Include dates, eligibility, price conditions, inventory limits, or geographic restrictions when the campaign depends on them. A memorable slogan is not an explanation. Sending every query to a generic home page wastes the context that made the search valuable.

    Prepare the machine-readable layer with the same discipline. Use Organization, Product, Offer, or VideoObject structured data only when the visible content supports it. Keep names, URLs, images, availability, dates, and offer details consistent across the page and markup. If you publish the commercial, include a useful title, description, transcript or summary, thumbnail, and campaign context. Structured data can clarify entities and relationships for search and answer systems, but it cannot repair an absent answer or an unsupported marketing claim.

    Write a few direct, self-contained answers for people who search conversationally or ask an AI assistant to identify the ad. State what the campaign promotes, which product or service appears, how the offer works, and where someone can act. Do not bury those facts in brand language that only makes sense after a visitor has watched the full commercial.

    Run paid and organic search as one response system

    Organic pages cannot be switched on at the moment an ad airs. They need to be published, crawlable, internally linked, indexed, and tested beforehand. Paid search can respond more quickly, but it still needs the right keywords, creative, budgets, locations, schedules, landing pages, and measurement conventions before volume arrives.

    Before the flight

    • Create one airing log with the creative ID, campaign name, product, market, channel or platform, planned timestamp, and time zone. Search and analytics teams should use the same identifiers.
    • Verify that every mapped landing page is indexable, uses the intended canonical URL, works on mobile, and completes its conversion path without errors.
    • Check page titles, descriptions, headings, visible copy, video metadata, structured data, and internal links against the language viewers will remember.
    • Build paid coverage for brand, product, campaign, offer, and high-value action queries. Review match types and negative keywords so a new campaign phrase is not accidentally blocked.
    • Confirm that budgets and targeting reflect the markets and times receiving media. A national paid-search increase is a poor response to a limited regional TV schedule.
    • Record a baseline for branded, product, campaign-related, and non-brand category queries before the campaign changes demand.
    • Test site capacity, inventory feeds, forms, phone routing, store data, and analytics events. A search spike has little value if the next step fails.

    Share creative changes immediately. A late edit to an offer, product name, spokesperson, or campaign line can invalidate keyword coverage and landing-page copy even when the media schedule stays the same.

    During the flight

    Monitor around actual airings where the volume supports that level of analysis. Look at branded and campaign-cue queries, paid impression share, spend, click-through rate, organic impressions, landing-page traffic, page errors, conversion events, on-site searches, and customer questions. Use the time zone recorded in the airing log; otherwise an apparent lag or lead may be a reporting error.

    Paid copy should repeat the recognizable product, benefit, and offer from the commercial, then add the practical detail the viewer needs. If the spot is emotional and the search ad sounds like unrelated direct-response copy, the handoff feels broken. Consistency does not require copying the script. It requires confirming that the searcher has reached the right answer.

    Do not automatically raise bids on every branded query. Blanket increases can make you pay for visits your organic result would have received anyway. Paid brand coverage is more defensible when competitors are present, the results are ambiguous, the campaign needs a precise destination, or the organic page is not yet strong enough. Where volume allows, compare markets or airing windows with and without paid brand coverage to estimate whether the ads add clicks and conversions rather than merely moving them from organic search.

    Watch the mix, not just total volume. If searches grow for the actor or song but not the brand or product, the entertainment may be more memorable than the advertiser. If viewers search for basic eligibility, pricing, or meaning, the spot has created interest but left a consequential question unresolved. Update paid copy and owned answers while the campaign is still running.

    After an airing or flight

    Do not remove campaign pages the moment paid media stops. Search can lag an exposure, and commercials can continue circulating through streaming, video sharing, press coverage, and memory. Use your own query and visit decay to decide how long active paid support should remain.

    When an offer expires, keep a useful destination if people are still searching. State clearly that the promotion ended, preserve relevant campaign context, and direct visitors to a current product, offer, or support page. Replacing a known campaign URL with a generic error page converts residual demand into confusion.

    Annotate changes to the creative, media weight, search campaigns, pages, offers, pricing, and tracking. Without that change log, a later analyst may attribute a search shift to the wrong channel or assume that two materially different commercials were the same treatment.

    Measure incremental demand without giving search all the credit

    Two miniature neighborhoods show different levels of glowing activity from televisions to phones and destinations.

    Last-click reporting answers which channel completed the recorded journey. It does not answer which channel created or accelerated the need to search. A branded search conversion after a commercial may be captured by PPC or SEO while being caused partly by TV. The reverse mistake is also possible: not every branded search during a TV flight was caused by the campaign.

    Separate three layers in your reporting:

    • Demand response: Incremental brand, product, campaign-cue, and relevant category searches associated with the airing.
    • Search capture: The portion of available demand reached through organic and paid results, followed by clicks and useful landing-page behavior.
    • Business outcome: Incremental leads, purchases, store actions, applications, bookings, or other outcomes after accounting for the demand that would have existed without TV.

    This distinction prevents a common misreading. A successful TV campaign can lower the conversion rate of search traffic because the commercial brings in a broader, earlier-stage audience. More curious visitors may arrive before they are ready to buy. Total incremental conversions can rise even while the percentage of visits that convert falls. Judge the campaign using volume and incrementality alongside conversion rate, not conversion rate in isolation.

    Use a repeatable measurement sequence:

    1. Define the expected baseline. Compare with similar non-airing periods, matched weekdays and dayparts, previous weeks, or comparable markets. Adjust the baseline when seasonality or an established trend makes a simple average misleading.
    2. Align the airing log. Use actual timestamps and markets when available, not merely the campaign’s overall start and end dates.
    3. Group queries by intent. Separate brand, product, campaign identifier, offer, high-intent non-brand, navigational, and unrelated searches. A total branded-search line can conceal what changed.
    4. Inspect multiple response windows. Look for an immediate second-screen response and a later memory response. Do not force one universal attribution window onto every product, creative, or buying cycle.
    5. Control overlapping activity. Promotions, product launches, email, public relations, influencer activity, news, seasonality, competitor campaigns, site changes, and search-platform changes can all move demand at the same time.
    6. Use a comparison design when feasible. Matched geographic markets, staggered schedules, non-airing periods, or carefully chosen holdouts produce a stronger estimate than a simple before-and-after chart.
    7. Reconcile the channels. Report how much demand appeared, how much search captured, and how much converted. Do not add TV-attributed and search-attributed conversions if both labels include the same people.

    A simple diagnostic calculation is: search lift (%) = (observed query volume – expected query volume) / expected query volume x 100. The difficult part is not the arithmetic. It is constructing a credible expected value. A baseline contaminated by a promotion or product launch will produce a precise-looking but unreliable lift figure.

    No single platform supplies the complete denominator. Google Trends shows relative interest rather than absolute query counts. Search Console shows impressions and clicks involving your properties, not every search in the market. Paid-search reporting describes the auctions and traffic your campaigns entered. Web analytics describes visits and recorded outcomes after a user reaches the site. Read those alongside airing data, direct traffic, on-site search, video search behavior, sales, calls, and customer-service questions.

    Search terms also function as creative feedback, but only when you interpret their meaning:

    • A rise in exact brand and product searches indicates that viewers connected the message to the advertiser.
    • A rise dominated by the celebrity, song, or scene can indicate strong entertainment recall but weak brand linkage.
    • Queries such as what company is that ad or repeated misspellings can expose a naming or pronunciation problem.
    • Growth in pricing, availability, location, or application queries signals movement toward action and tells you which destination must be strongest.
    • Growth in eligibility, explanation, or what does it mean queries reveals an information gap. The gap may be intentional curiosity, but the search result still has to resolve it.
    • Complaint, skepticism, or confusion queries should not be counted as favorable response merely because volume increased. Investigate the underlying issue and adjust the answer or campaign where warranted.

    Branded search volume is therefore a useful creative-response indicator, not a standalone verdict. It tells you that the commercial entered behavior. Query composition, result quality, incremental visits, and business outcomes tell you whether that behavior helped.

    Key takeaways

    • TV can create navigational, informational, commercial, and transactional searches; it can also shift an existing generic search toward a named brand.
    • Search response may begin within minutes or hours, so pages, paid campaigns, tracking, and operational systems must be ready before the commercial airs.
    • Build the keyword and content map from what viewers can remember in the creative, including the product, offer, person, phrase, scene, and unresolved question.
    • Give every important query family a recognizable destination instead of sending all TV-driven demand to a generic home page.
    • Coordinate paid-search schedules and budgets with actual markets and airings, while testing whether branded ads add incremental value over organic results.
    • Measure demand creation separately from search capture, then use matched baselines or holdouts to estimate the incremental effect.
    • Read the query mix as feedback: product searches, campaign-identification searches, action searches, and confusion searches tell you different things about the creative.

    Before the next creative lock, bring the media schedule, search team, analytics owner, web team, and campaign decision-maker into the same handoff. Leave with four concrete artifacts: a query inventory, a destination map, a scheduled paid-search plan, and a measurement sheet with baselines and comparison markets or periods.

    If one of those is missing, the campaign is not fully ready. The goal is not to make TV look like search or search look like TV. It is to ensure that the demand your commercial creates reaches a clear answer, and that each channel receives credit for the part of the journey it actually performed.

    References

  • PPC Brand Protection: A Practical Monitoring Playbook

    PPC Brand Protection: A Practical Monitoring Playbook

    If the cost of your own brand terms keeps rising, your first move should not be to raise bids. You need to find out who is entering the auction, what searchers are seeing, and whether the activity is legitimate competition, a partner violation, or an attempt to impersonate your business.

    A useful PPC brand protection program gives you that answer quickly. It also gives your affiliate, paid media, legal, and security teams enough evidence to act without relying on a suspicious screenshot or an unexplained change in CPC.

    Protect the conversion path, not just the brand keyword

    A branded search often happens close to a decision. The searcher already knows your name, product, or service and is trying to reach a relevant destination. That makes the traffic attractive to competitors, affiliates, resellers, and fraudsters.

    Your defensive campaign protects only one part of that journey. Winning the top paid position does not stop an affiliate from collecting commission on demand you created, an unauthorized reseller from using old messaging, or an impersonator from sending searchers through a deceptive redirect.

    At minimum, a mature program should monitor branded bidders, CPC and impression-share anomalies, unauthorized trademark use, geo-targeted ads, and partner compliance. It should classify what it finds before anyone starts enforcement.

    • Competitor brand bidding places another company’s offer in front of people searching for you. It can increase auction pressure and divert high-intent visits, but the appearance of a competitor does not by itself prove fraud or a trademark violation.
    • Affiliate or partner bidding becomes a compliance issue when it breaches the agreement governing brand terms, ad copy, direct linking, redirects, or approved markets. The commercial loss can include both higher media costs and commission paid for customers you may have acquired directly.
    • Ad hijacking imitates your ad closely enough that a searcher may believe it is official. The destination, tracking path, or advertiser identity reveals the difference.
    • Malicious redirection uses a brand-looking ad as the entry point to phishing, malware, or another unsafe destination. Treat this as a security incident, not merely a campaign optimization problem.
    • Message misuse includes outdated offers, unsupported claims, incorrect prices, or unapproved positioning. Even when the destination is an authorized seller, the ad can still damage trust in your brand.

    This classification matters because the remedies are different. A commercial response may be appropriate for ordinary competitor bidding. An affiliate breach belongs in the partner enforcement process. Impersonation, phishing, and malicious redirects may require the ad platform, your security team, and legal counsel. Sending every case through the trademark channel wastes time and can weaken an otherwise valid complaint.

    Build a baseline that makes interference visible

    You cannot identify an anomaly if all branded traffic is blended into one campaign total. Start by separating the searches, entities, and performance signals that need different treatment.

    1. Create a branded-query inventory. Include your exact brand name, common variations, product names, brand-plus-product searches, offer or coupon searches, and navigational searches such as login or support. Group them by intent so a movement in one cluster is not hidden by stable performance elsewhere.
    2. Create an authorized-party register. Record your own domains and advertiser accounts, regional entities, approved agencies, resellers, affiliates, and any partner allowed to use the brand. Add the conditions attached to that permission, including markets, destinations, messaging, and expiration dates.
    3. Separate brand from non-brand campaign performance. Clear segmentation makes CPC, impression share, and click-through-rate changes easier to investigate. Use targeted negatives to control traffic crossing between campaign groups, but do not add blanket negatives before checking which legitimate queries they would exclude.
    4. Record a working baseline for branded CPC, impression share, CTR, and affiliate contribution. Break out the query clusters and relevant locations or devices where your data permits. Treat the baseline as a comparison range, not a permanent target; promotions, demand, your own account changes, and auction conditions can all move the numbers.
    5. Assign an owner and an escalation route. Monitoring without ownership creates an alert queue, not protection. Specify who validates an observation, who contacts partners, and who handles security, platform, or legal escalation.

    The authorized-party register is especially important. A familiar advertiser name can still be out of scope in a particular market, while an unfamiliar account may belong to an approved regional partner. Match the advertiser, domain, tracking path, location, and policy conditions before labeling an appearance unauthorized.

    Watch combinations of signals rather than treating one metric as proof. Rising CPC with falling impression share can justify checking for new auction pressure. Falling CTR can indicate that another message is attracting or confusing searchers. A jump in affiliate conversions associated with branded traffic can indicate commission leakage. Each is a prompt to investigate, not a verdict.

    Monitor what searchers see and preserve usable evidence

    An analyst reviews multiple monitors of unlabeled search result cards while a suspicious result is highlighted and evidence tiles are collected beside the workstation.

    Account reporting tells you that something changed. Search-result monitoring tells you what appeared, where it appeared, and which destination sat behind it. You need both.

    Automated monitoring is valuable because prohibited ads can be limited by geography, device, query variation, or schedule. A clean result from one office does not clear every market. Configure alerts around new advertisers, changes in ad copy or destination, suspicious redirects, and material movements in branded CPC or impression share. Then have a person validate the context before enforcement begins.

    Observed activityWhat you need to establishLikely response
    A competitor appears on a branded queryAdvertiser identity, exact wording, destination, affected market, repetition, and whether the message is misleadingMonitor the commercial impact; escalate only the specific policy, trademark, or deceptive element you can substantiate
    An affiliate or reseller appearsPartner identity, tracking parameters, redirect path, query, market, and the relevant agreement clauseUse the partner or affiliate enforcement process and verify that the prohibited activity stops
    An ad closely imitates your official creativeDifferences in advertiser identity, visible URL, landing page, final URL, and claimsPreserve evidence and involve the platform, brand, security, or legal owner as appropriate
    The destination changes through redirectsThe complete path, affiliate identifiers, final destination, and whether the path differs by location or deviceRoute a contractual breach to partner enforcement; route a suspected malicious destination to security
    An authorized seller uses unapproved copyThe exact claim, current approved language, partner permission, and affected offer or marketRequest correction under the messaging or reseller terms, then recheck the live ad

    For every validated observation, capture the exact query, location, device type, date and time, advertiser name, full ad copy, visible domain, landing page, and final destination. Preserve screenshots and the redirect sequence. If an affiliate is involved, retain the tracking identifier and the policy clause that applies.

    Evidence should be reproducible. A cropped screenshot with no query, market, or destination may show that an ad existed, but it gives a partner manager or platform reviewer little basis for action. Recheck under the same relevant conditions and record whether the behavior repeats.

    Do not investigate a suspected phishing or malware destination from a routine workstation. Preserve the visible evidence, avoid unnecessary interaction with the ad, and hand the destination to your security team for controlled analysis. The potential harm is larger than the value of personally confirming one more redirect.

    Turn each violation into a controlled enforcement workflow

    A suspicious ad tile moves through scanning, evidence capture, review, and resolution stations as four specialists collaborate around the process.

    Enforcement should be predictable enough that the same behavior receives the same response. That reduces arguments between teams and prevents a serious security issue from sitting behind a minor affiliate dispute.

    1. Validate the entity and behavior. Separate ordinary competitive advertising from contractual noncompliance, misleading brand use, impersonation, and malicious activity.
    2. Preserve the evidence before making contact. Ads, landing pages, and redirects can change after a warning, leaving you unable to demonstrate what happened.
    3. Contain immediate harm. Route suspected malicious activity to security and the relevant platform. For a partner breach, suspend the prohibited placement or invoke the contract process available to you. Do not make irreversible account or commercial changes on the strength of an unverified alert.
    4. Use the correct enforcement channel. Contact the affiliate network or partner owner for a contractual breach, the reseller owner for unapproved messaging, and the relevant platform process for deceptive advertising. Bring in qualified legal counsel when the remedy depends on trademark rights, contractual interpretation, or a formal demand.
    5. State the case precisely. Identify the query, ad, destination, market, evidence, applicable rule, required correction, and how compliance will be verified. Avoid broad accusations that go beyond what the record supports.
    6. Verify removal under the same conditions. Closing a ticket because a notice was sent confuses activity with resolution. Recheck the query, location, device, destination, and redirect path, then monitor for recurrence under another account or domain.

    Write affiliate rules that can actually be enforced

    “No brand bidding” is rarely enough on its own. Your policy should define the behavior so affiliates and enforcement teams do not have to guess what the phrase covers.

    • Name the protected brands, product names, common variations, and combined searches covered by the rule.
    • State whether any branded bidding is permitted and identify exceptions by partner, market, or campaign.
    • Define whether affiliates may use the trademark in ad copy, visible URLs, domains, or landing-page headings.
    • Specify rules for direct linking, redirects, coupon or offer messaging, and sub-affiliates.
    • Maintain a current set of approved claims and make clear how partners receive updates.
    • Describe the evidence required, the correction process, the consequences of repeat violations, and how disputed commissions will be handled.

    Have the appropriate commercial and legal owners review these terms before relying on them. A monitoring team can document behavior, but it should not invent contractual rights or make legal conclusions that the agreement does not support.

    Do not answer every CPC increase with a higher bid

    A bid increase may restore position while leaving the cause untouched. If the pressure comes from a prohibited affiliate, you can end up paying more for the auction and then paying commission on the resulting conversion. If it comes from an impersonator, bidding harder does nothing to remove the deceptive destination.

    Check your own setup at the same time. Confirm that the brand campaign is eligible, funded, correctly segmented, and sending searchers to the intended page. Then investigate external activity. That sequence keeps an internal campaign error from being mistaken for interference and keeps genuine violations from being treated as ordinary optimization.

    Measure recovered control without overstating new growth

    Brand protection can improve efficiency and restore visibility, but it does not necessarily create new demand. Some recovered clicks may move from an affiliate, competitor, organic result, or direct visit into your official paid path. Report that movement honestly.

    • Validated violations by type: Separate competitor activity, partner breaches, message misuse, impersonation, and malicious redirects. A rising count can mean more abuse, better monitoring coverage, or both, so preserve the classification and coverage context.
    • Enforcement rate: Divide confirmed resolutions by actionable, validated violations. Do not count an automated alert as a violation or a sent email as a resolution.
    • Detection and resolution time: Measure the path from first observable evidence through validation, notice, removal, and verification. This exposes delays hidden by a single closed-ticket date.
    • Recurrence: Track whether the same advertiser, affiliate, domain, or redirect pattern returns. Repeated behavior may require a stronger contractual or platform response.
    • Branded CPC and impression share: Compare like query clusters and markets before and after a confirmed intervention. Account changes, promotions, demand, and broader auction movement can affect both metrics, so do not assign the entire difference to enforcement.
    • Branded CTR recovery: Look for improvement after a misleading or competing placement disappears, while checking that your own ad copy and position did not change at the same time.
    • Affiliate commission leakage: Identify commissions tied to traffic that breached your branded-search rules. Distinguish money actually recovered from an estimate of future leakage prevented.

    You can estimate avoidable auction cost by multiplying affected branded clicks by the difference between the observed CPC during the validated incident and a comparable baseline CPC. Label the result as an estimate. It depends on the quality of the comparison and does not prove what every click would have cost in the absence of the other advertiser.

    Estimate affiliate leakage from commissions attached to prohibited branded traffic, net of any traffic that remains legitimate under the agreement. Do not automatically add that estimate to auction-cost savings: the same conversion path may contribute to both calculations, creating double counting.

    Key takeaways

    • Classify the behavior before acting. Competitor bidding, affiliate noncompliance, misleading copy, impersonation, and malicious redirects require different remedies.
    • Segment branded queries and maintain an authorized-party register so genuine anomalies stand out.
    • Use automated monitoring for coverage and human validation for context, evidence, and enforcement decisions.
    • Preserve the query, market, device, ad, destination, redirect path, and applicable rule before contacting the advertiser or partner.
    • Measure verified resolutions, recurrence, CPC, impression share, CTR, and commission leakage without presenting shifted branded traffic as entirely new demand.

    Start with one query inventory, one authorized-party register, and one evidence template. Assign an owner to each escalation route, then configure monitoring around the gaps you can no longer see manually. That gives you a defensible operating process before the next CPC spike forces a rushed decision.

    References

  • Mastering LLM Visibility: Metrics and Insights for Real Impact

    Mastering LLM Visibility: Metrics and Insights for Real Impact

    I’ve been deeply involved in the compelling discussions around AI, especially the intriguing intersection of ‘AI hype meets AI reality.’ Tools like Semrush One and its Enterprise AIO tool have taken center stage, offering invaluable insights into what’s happening inside LLMs. The big questions I often ponder are: How many citations are we capturing and just how many mentions are our brands accumulating?

    When this data first emerged, it felt revolutionary. However, it quickly prompted other questions, like ‘What’s the ROI here?’ and ‘How can I integrate this data into my team’s marketing strategy?’ Ensuring that this valuable and fascinating data translates into actionable insights is a challenge I enjoy tackling.

    ```json
{
  "alt": "The CapmatchOne logo with a gradient circle and bold text.",
  "caption": "Discover innovation with the CapmatchOne logo, featuring sleek typography and a modern gradient circle.",
  "description": "The CapmatchOne logo features bold, modern typography coupled with a gradient circle, symbolizing connection and innovation. The sleek design conveys a sense of progress and creativity. This image can be used for branding or promotional purposes, appealing to audiences interested in innovative solutions and forward-thinking designs."
}
```

    It’s no secret that the data these tools provide is incredibly valuable. But, what steps do I take next? Let’s uncover this journey together.

    ```json
{
  "alt": "Trending products list showing ranking of TV brands and models by share of voice.",
  "caption": "Discover what's trending in TV technology as LG and TCL lead the rankings by share of voice.",
  "description": "This image displays a list of trending TV products ranked by share of voice. LG's G3 model takes the top spot with 11%, followed by LG's C3 and TCL's 6-Series both with an 8% share. Samsung's QN90C and S95C, along with TCL's QM8K, also feature among the top-ranked models. The list highlights popular brands and models in the current TV market, useful for consumers looking to stay informed about top choices."
}
```

    The Fundamental Challenges of Tracking LLMs

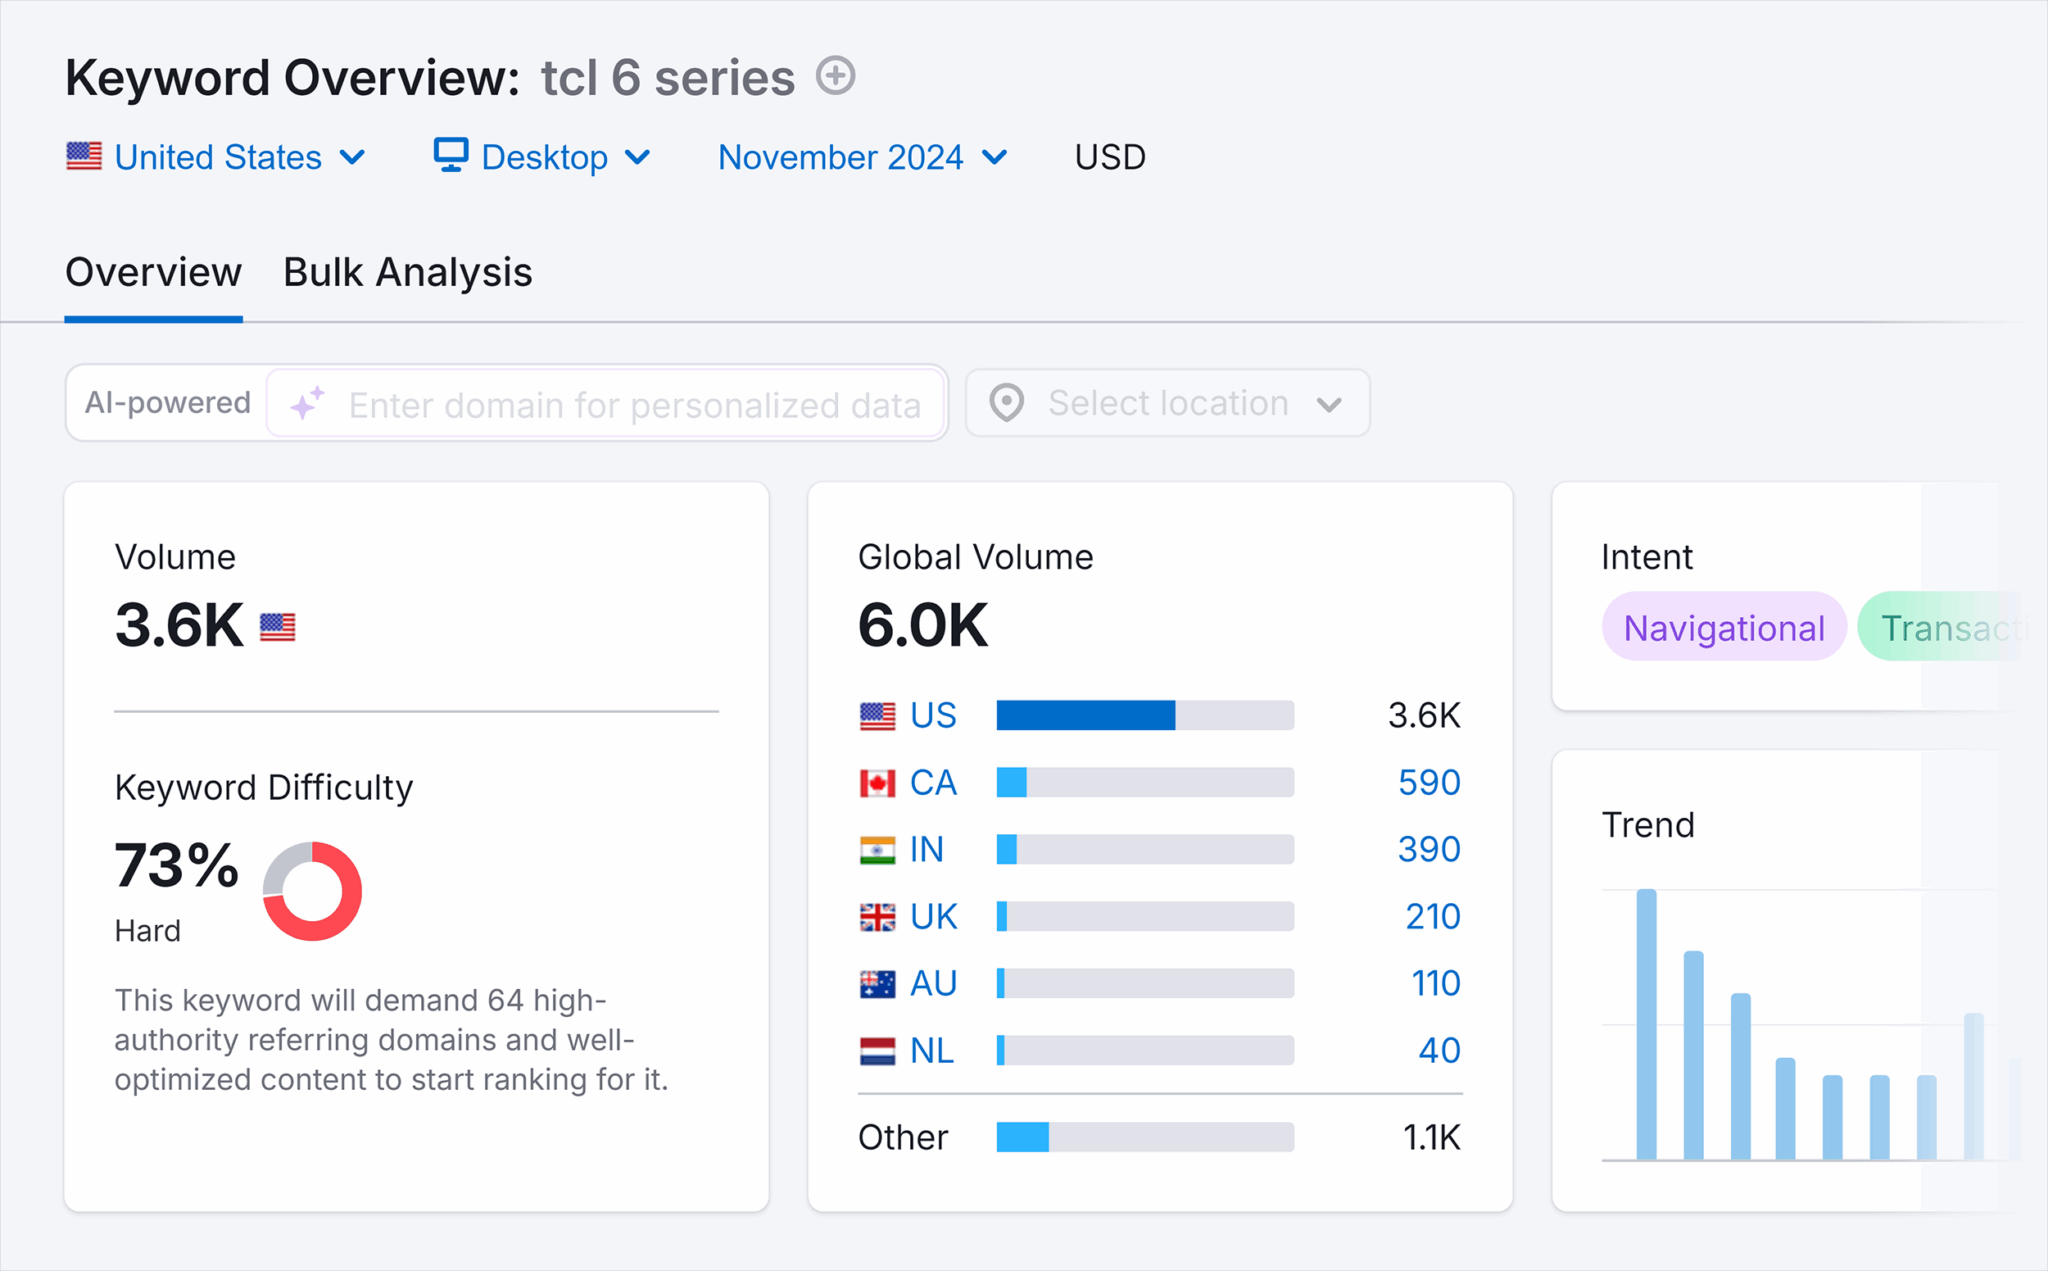
    Tracking LLMs can be more challenging than traditional metrics like Google rankings. Google rankings may show where I stand, but ranking doesn’t always correlate with traffic or revenue. Even if I rank highly, an AI Overview could dominate the search, reducing my traffic for a given keyword. I need to ask myself, is this the right traffic for my business goals?

    ```json
{
  "alt": "Keyword overview of TCL 6 series showing search volume, keyword difficulty, and trend data.",
  "caption": "Explore the keyword analysis for 'TCL 6 series' with detailed volume, global reach, and trend insights for November 2024.",
  "description": "This image displays a keyword analysis dashboard for the 'TCL 6 series.' In November 2024, the keyword has a search volume of 3.6K in the US and 6K globally, with a difficulty score of 73%, indicating high competition. The data is segmented by country, revealing insights into search intent and trend progression, helpful for content strategists and SEO professionals optimizing for this keyword."
}
```

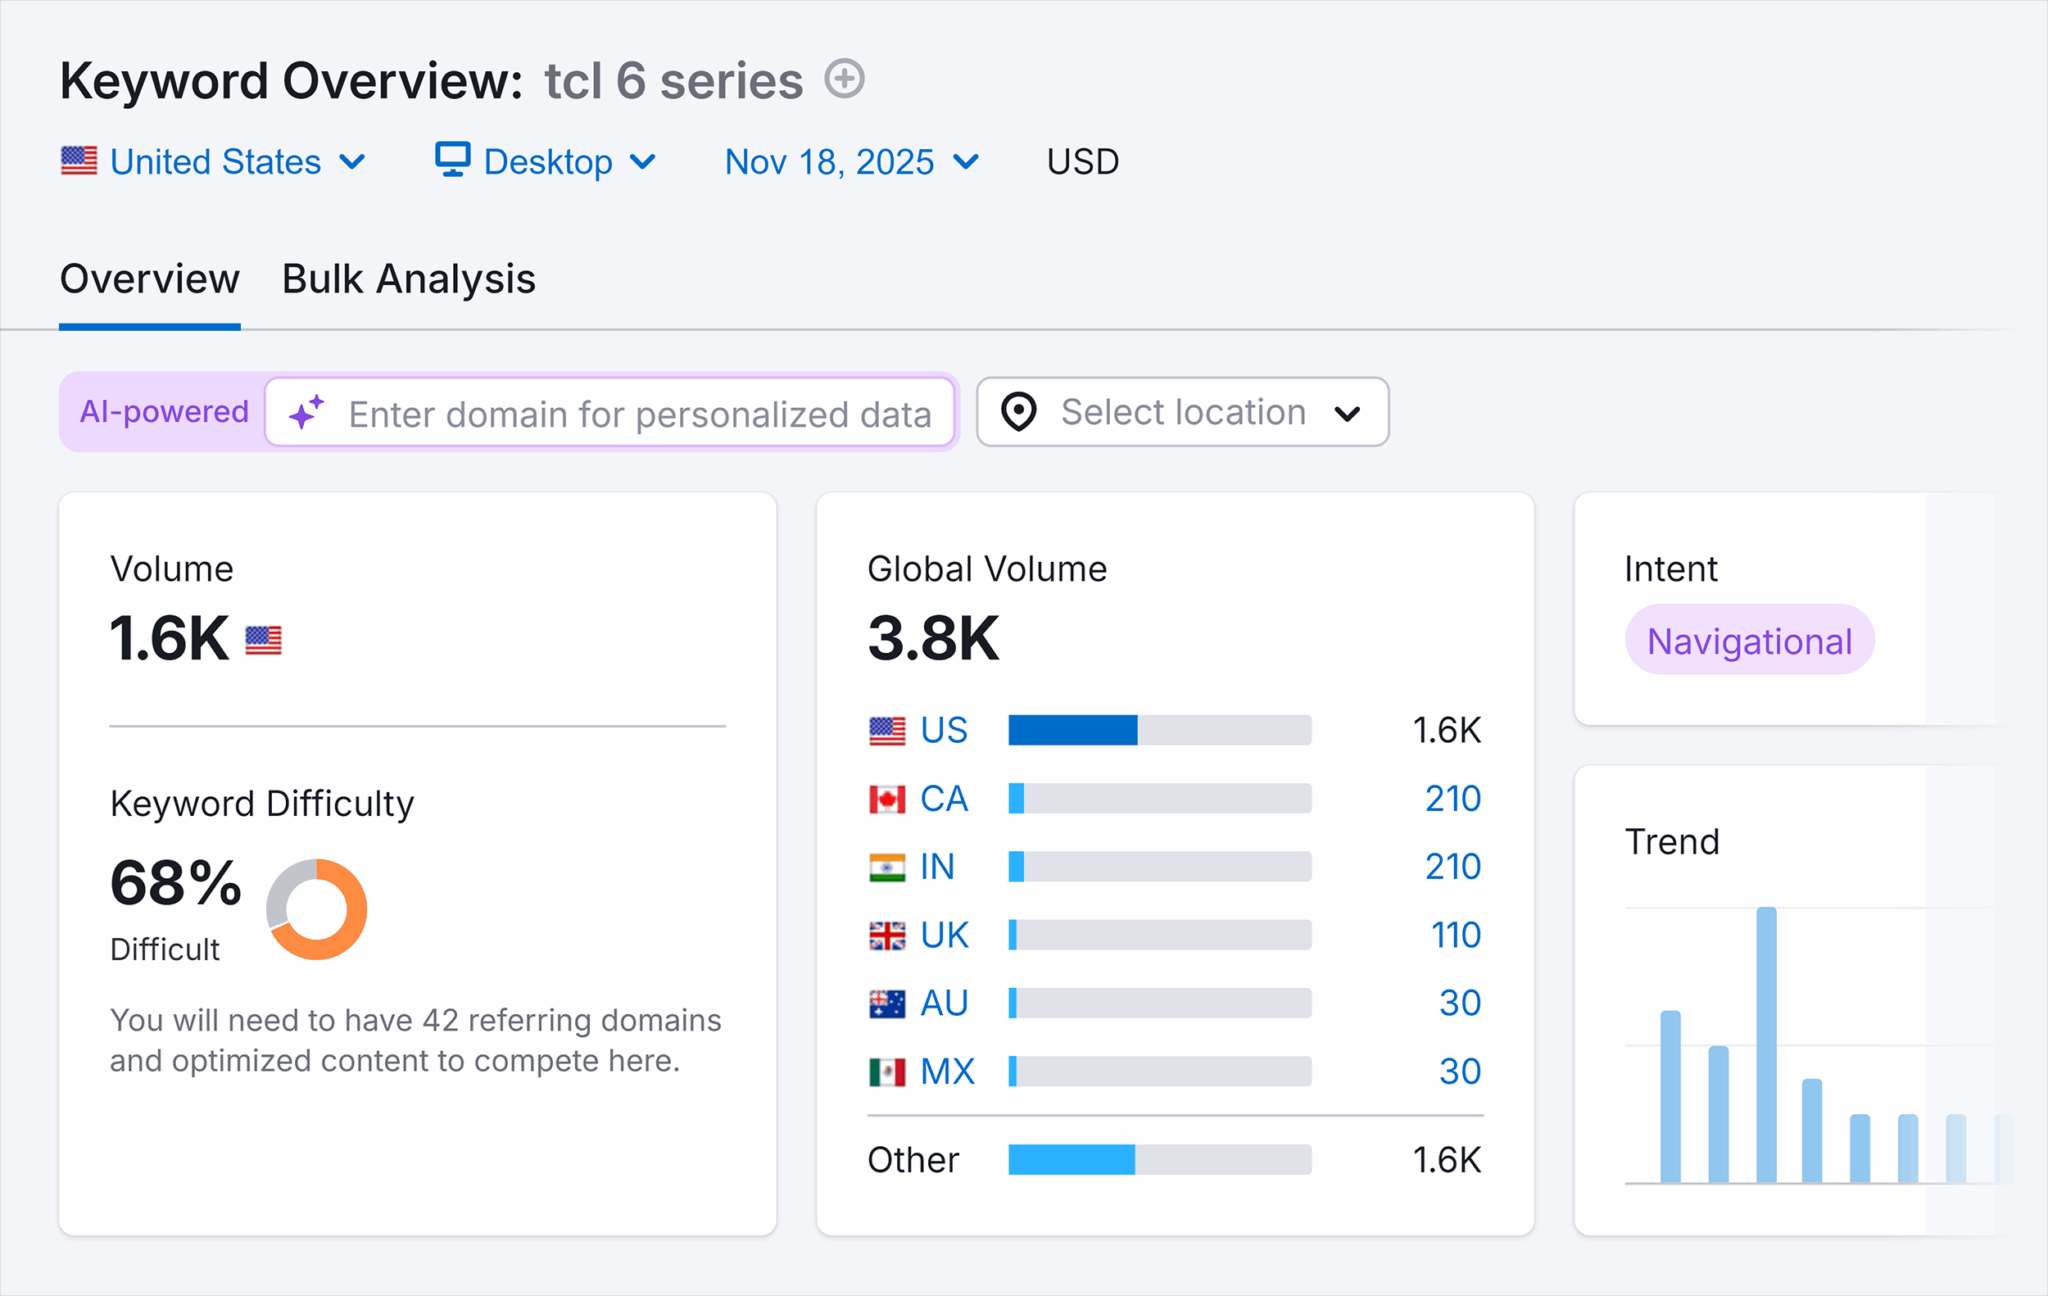
    The big difference between traditional SEO rankings and LLM visibility is the straightforward correlation between strong rankings and increased revenue, which is more complex with LLMs. I can easily track user behavior after they land on my site from organic search, but it’s not so clear-cut with LLMs.

    ```json
{
  "alt": "Keyword overview for TCL 6 series, showing search volumes, keyword difficulty, and intent.",
  "caption": "Explore detailed keyword insights for the TCL 6 Series, highlighting search volume, difficulty, and intent to refine your SEO strategy.",
  "description": "The image presents a keyword overview for the TCL 6 Series, detailing a search volume of 1.6K in the US and a global volume of 3.8K. It notes a keyword difficulty of 68%, indicating a challenging competition level. The intent is labeled as navigational, with trends visualized in a bar graph. This data is segmented by countries, including CA, IN, UK, AU, and MX, offering a comprehensive analysis suitable for refining SEO efforts. Keywords: TCL 6 Series, Keyword Overview, Search Volume, SEO, Navigational Intent."
}
```

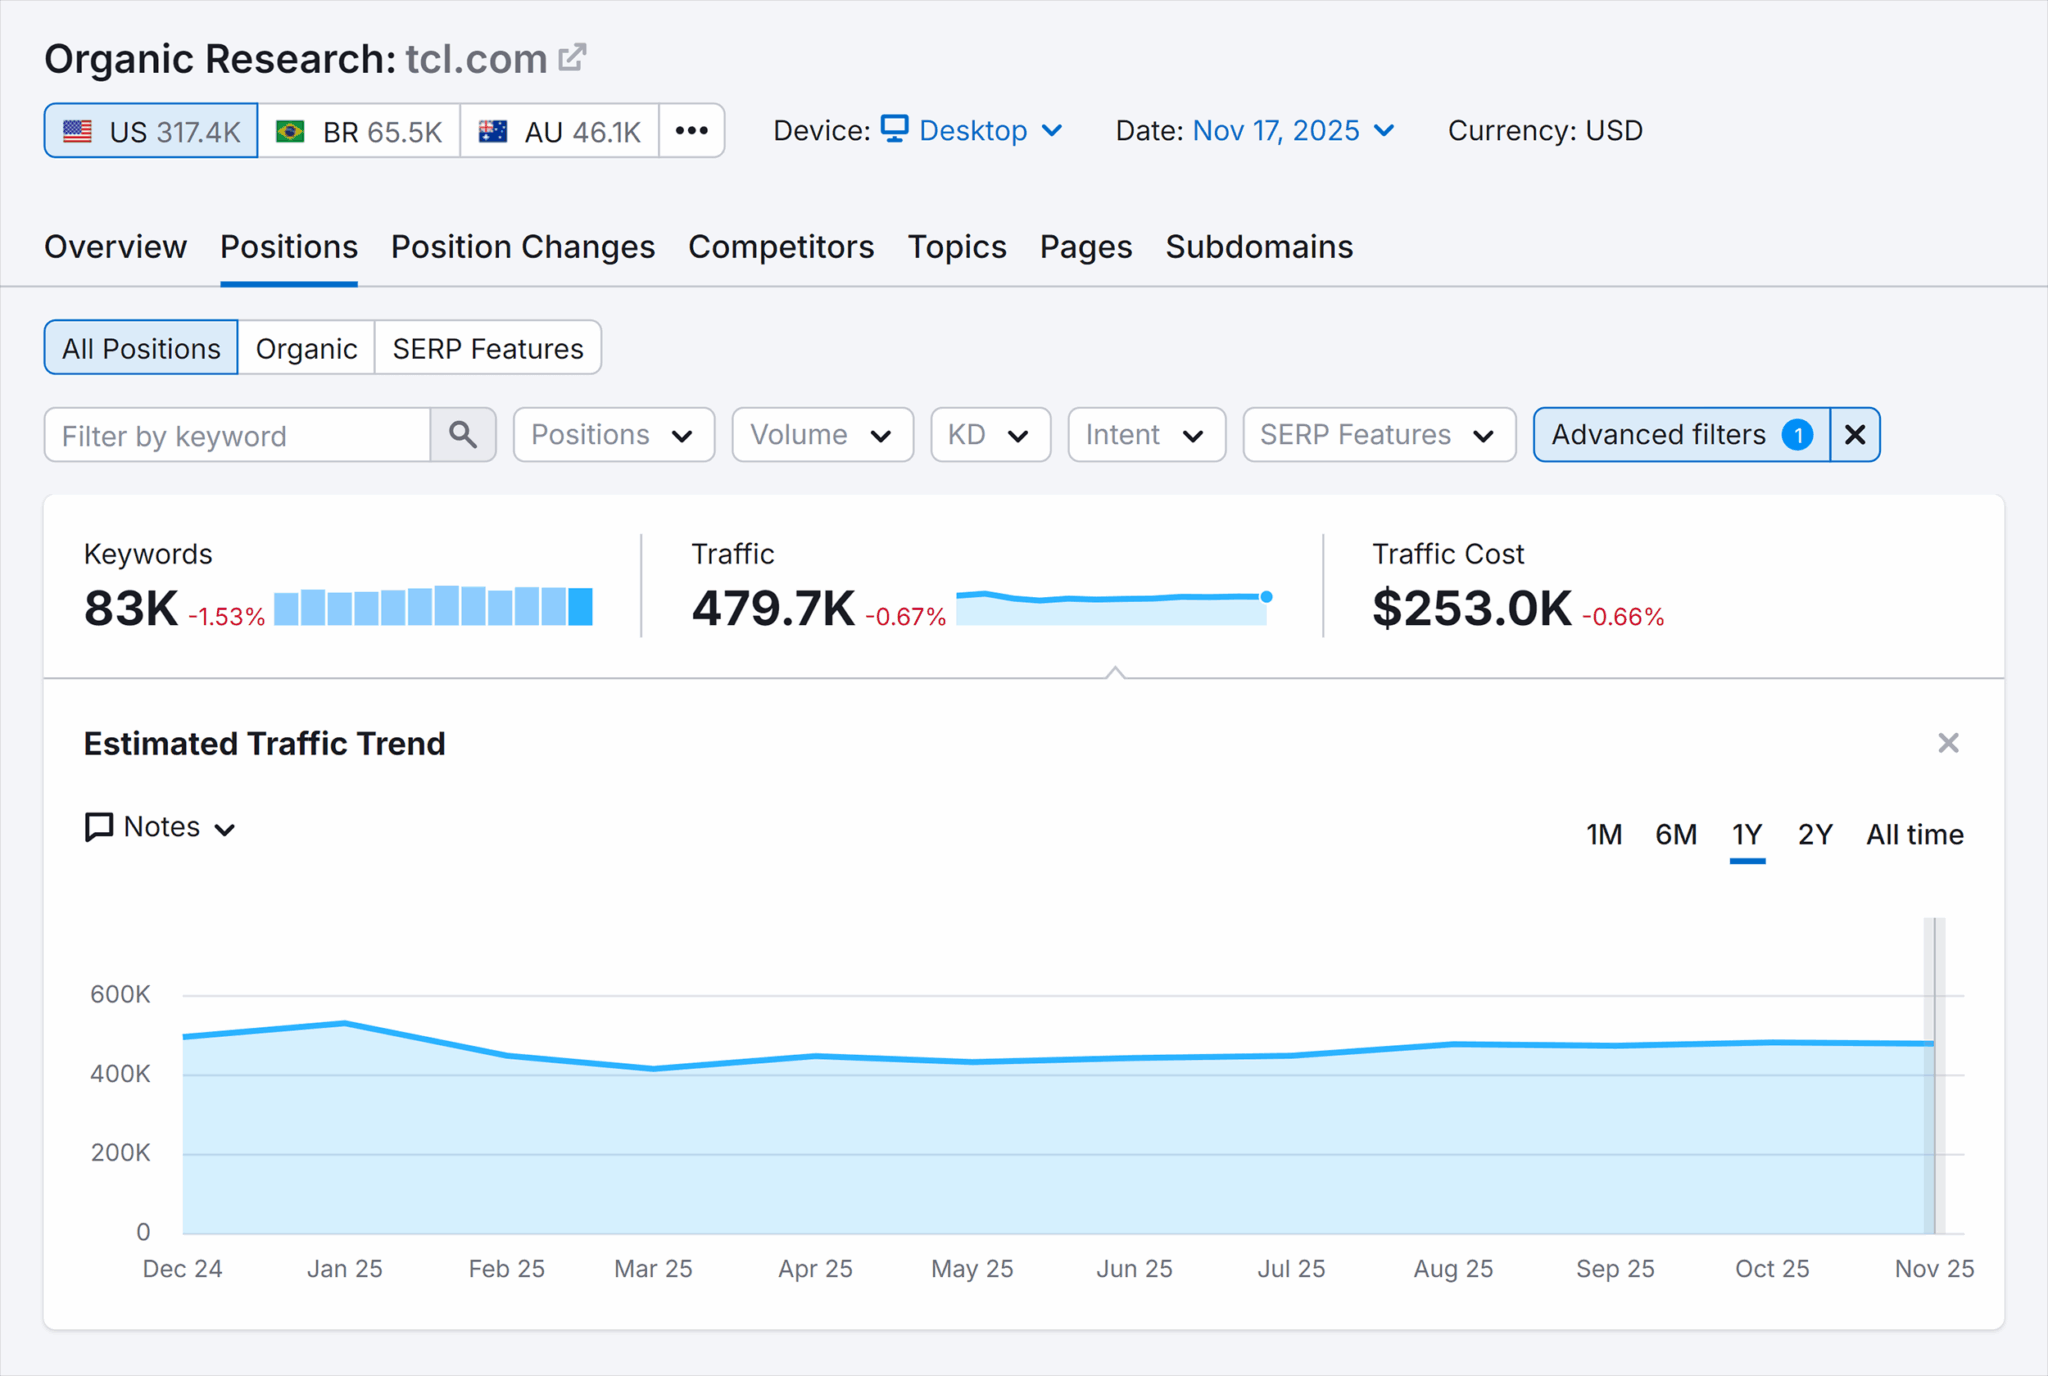
    SEO effectively drives traffic to my site, allowing me to evaluate the success of my conversion rate optimization (CRO) strategies. However, LLMs operate differently, leaving me with the task of creatively connecting the dots.

    ```json
{
  "alt": "SEO report for tcl.com showing keyword, traffic, and cost data with a traffic trend graph.",
  "caption": "Dive into the SEO stats for tcl.com, showcasing keyword performance, traffic data, and cost analysis, all accompanied by a visual traffic trend over the past year.",
  "description": "This image presents an SEO report for tcl.com as of November 17, 2025. It highlights key statistics such as 83K keywords, 479.7K monthly traffic, and a traffic cost of $253K, each experiencing slight decreases. The report includes a traffic trend graph showing fluctuations over the past year. This report is useful for analyzing search performance and strategizing for better visibility. Keywords: SEO, traffic, keywords, tcl.com, report, analysis, performance, trend."
}
```

    The Problem with Methodology

    As I dive deeper into using LLM-related data, I realize this approach requires me to step out of my comfort zone as a performance marketer. My usual reliance on direct attribution and data points is shifted toward constructing a narrative that ties LLM visibility to larger brand storytelling.

    ```json
{
  "alt": "SEO report showing organic research data for tcl.com including keywords, traffic, and estimated traffic trend over two years.",
  "caption": "An in-depth look into tcl.com's SEO performance: Explore key metrics like declining keywords and traffic, alongside an estimated trend over the past two years.",
  "description": "This image displays a detailed SEO report on tcl.com, featuring data such as a 5.37% drop in keywords to 317, a 1.72% decrease in traffic to 2.2K, and an 8.13% rise in traffic cost to $1.1K. The chart illustrates the estimated traffic trend for desktop devices over a two-year span from January 2024 to October 2025, with significant fluctuations and an overall downward trajectory. This visual is essential for analyzing SEO metrics and understanding website performance in different markets, including the US, Brazil, and Australia."
}
```

    This method isn’t novel, however. Brand marketers have dealt with indirect metrics since the days of billboard advertising. Still, the shift requires me to create insights from what might seem like fragmented LLM data.

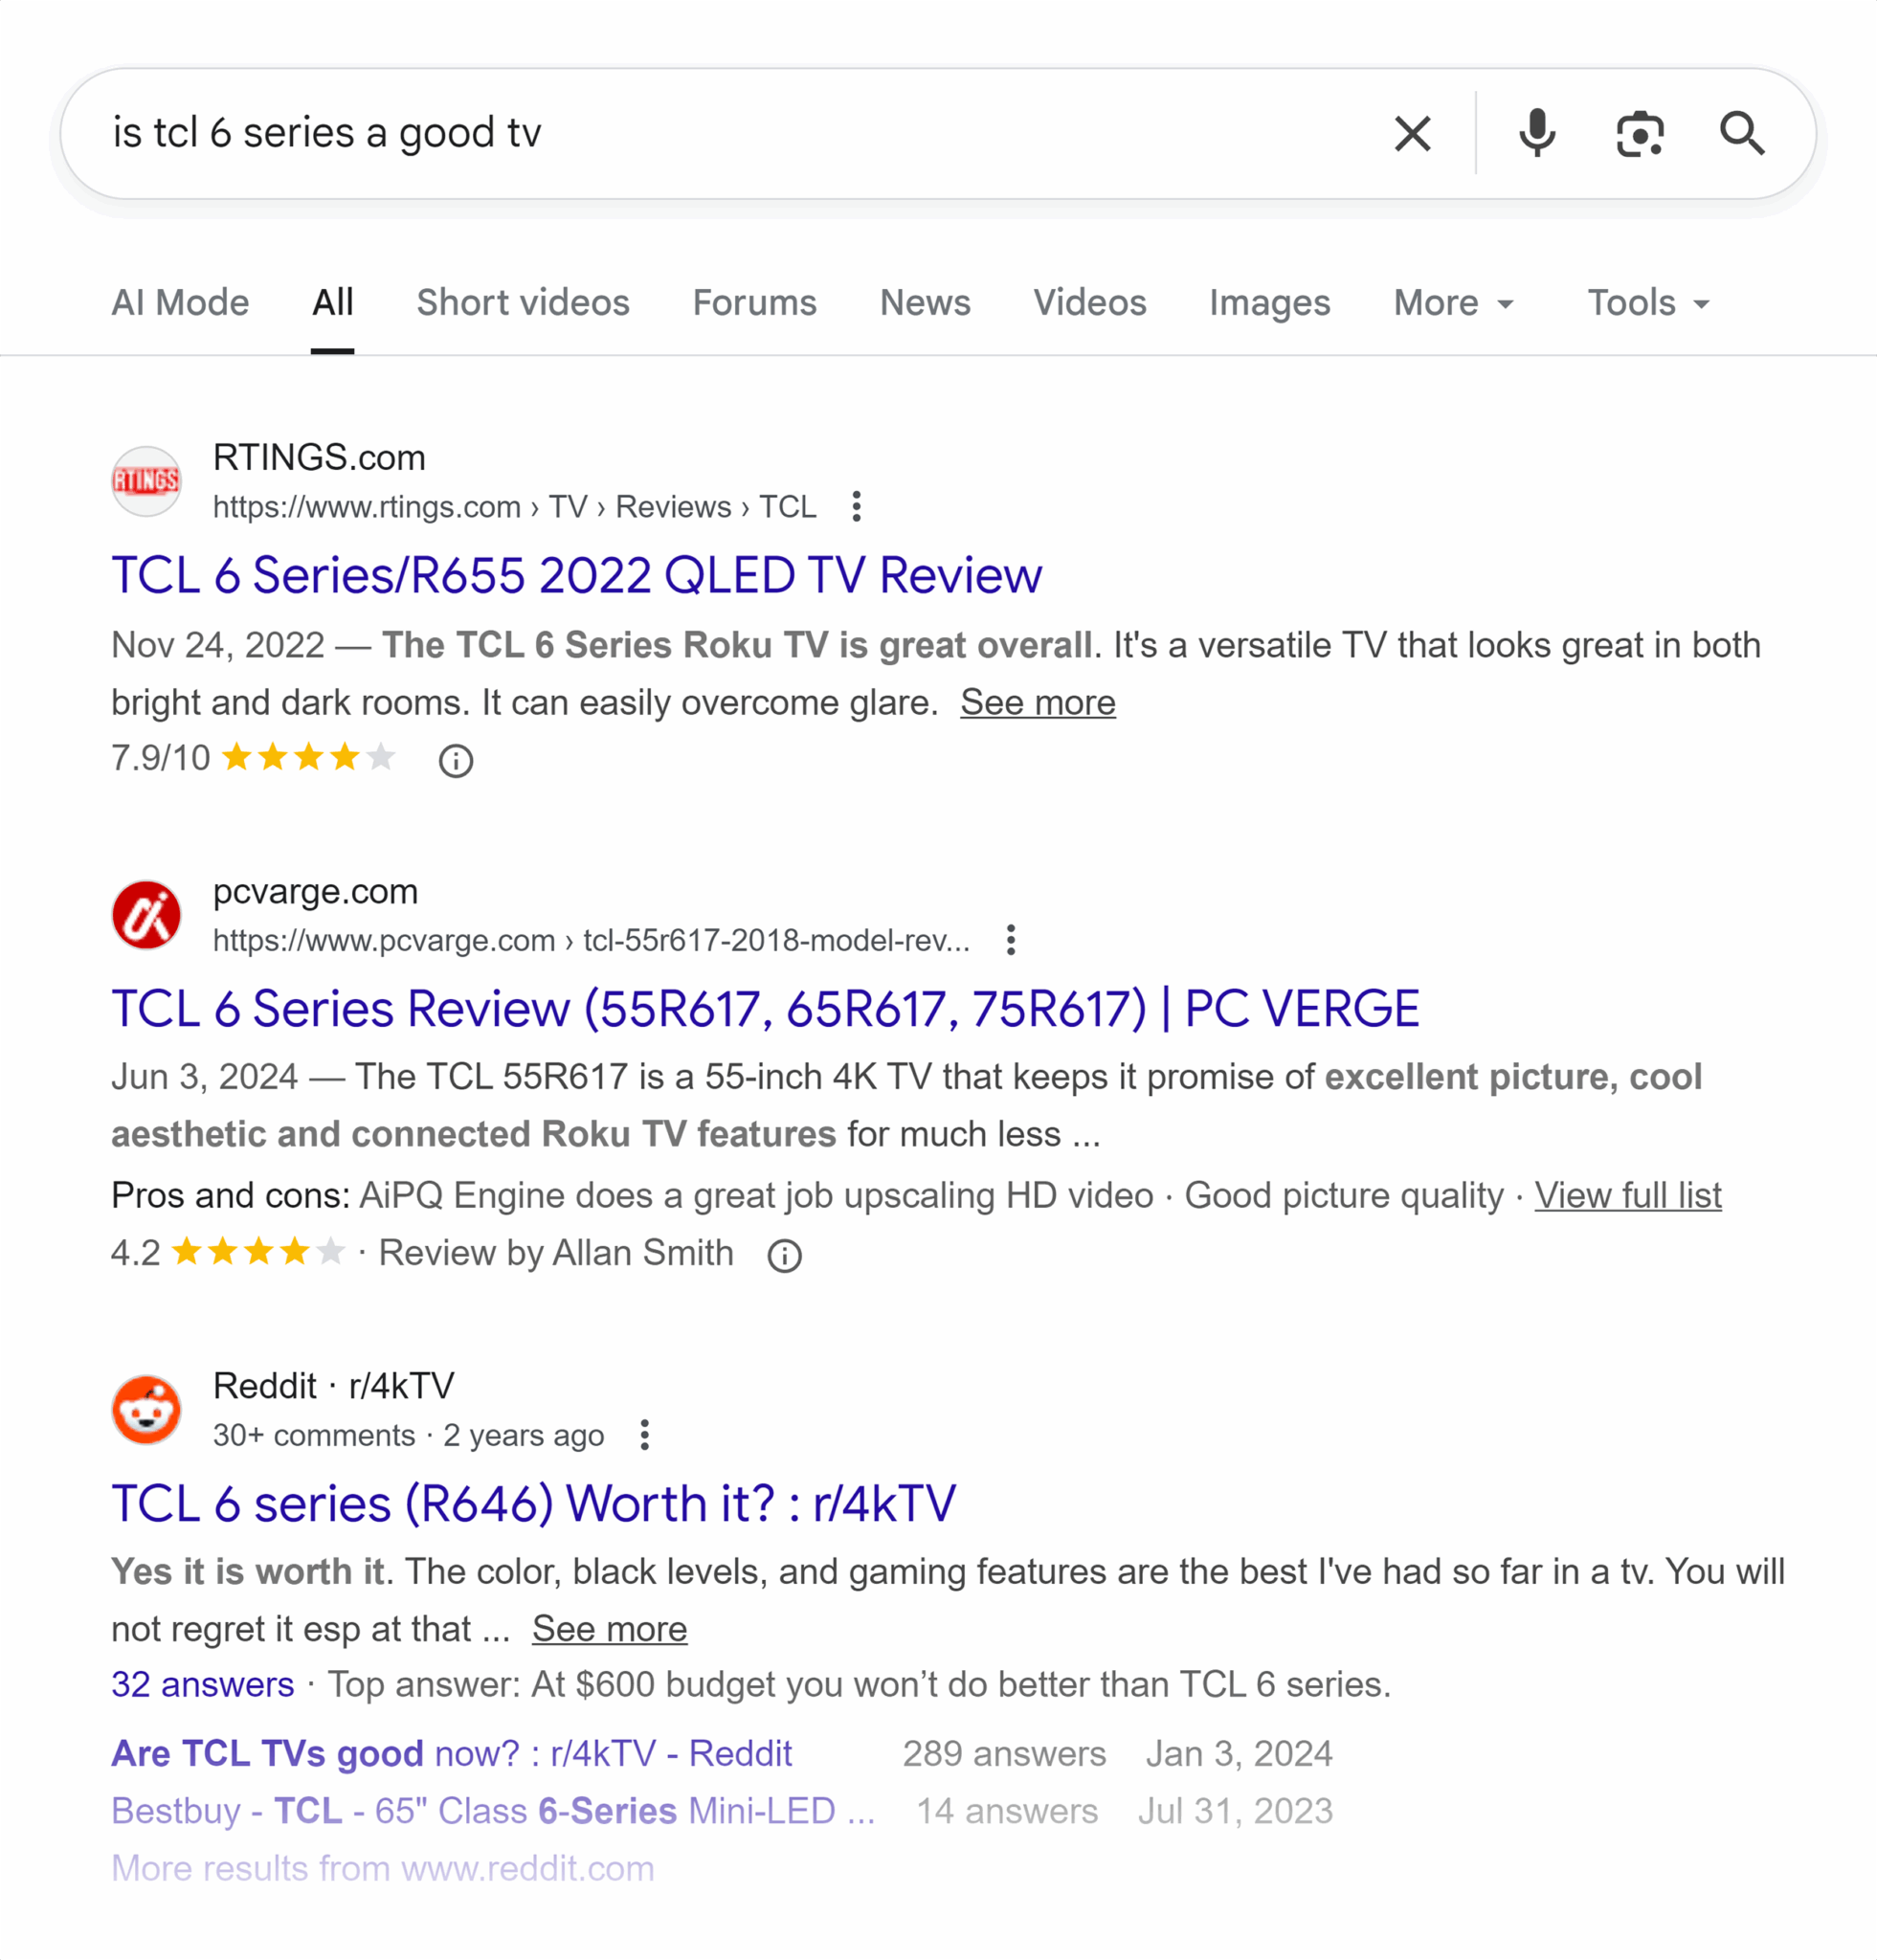
    ```json
{
  "alt": "Search results for 'is tcl 6 series a good tv' showing review snippets from RTINGS, PC Verge, and Reddit.",
  "caption": "Curious about the TCL 6 Series TV? Explore a compilation of expert reviews and user opinions from RTINGS, PC Verge, and Reddit.",
  "description": "This image displays Google search results for the query 'is tcl 6 series a good TV.' The results include snippets from RTINGS, PC Verge, and Reddit discussing the TCL 6 Series TV. The RTINGS review describes it as a great overall product, highlighting its versatility. PC Verge emphasizes the TV's excellent picture quality and Roku features, with a 4.2-star rating. Meanwhile, a Reddit thread discusses the TCL 6 Series model R646, with users praising its color and gaming features. This image provides a quick overview of expert and user assessments of the TCL 6 Series TV."
}
```

    Metrics and Approach to LLM Impact Measurement

    Uncovering the true value brought by LLM visibility metrics is a layered and comprehensive process. To do this accurately, I need to understand the wider ecosystem of my organization’s promotional efforts. This understanding allows me to determine the root cause of site traffic or branded searches effectively.

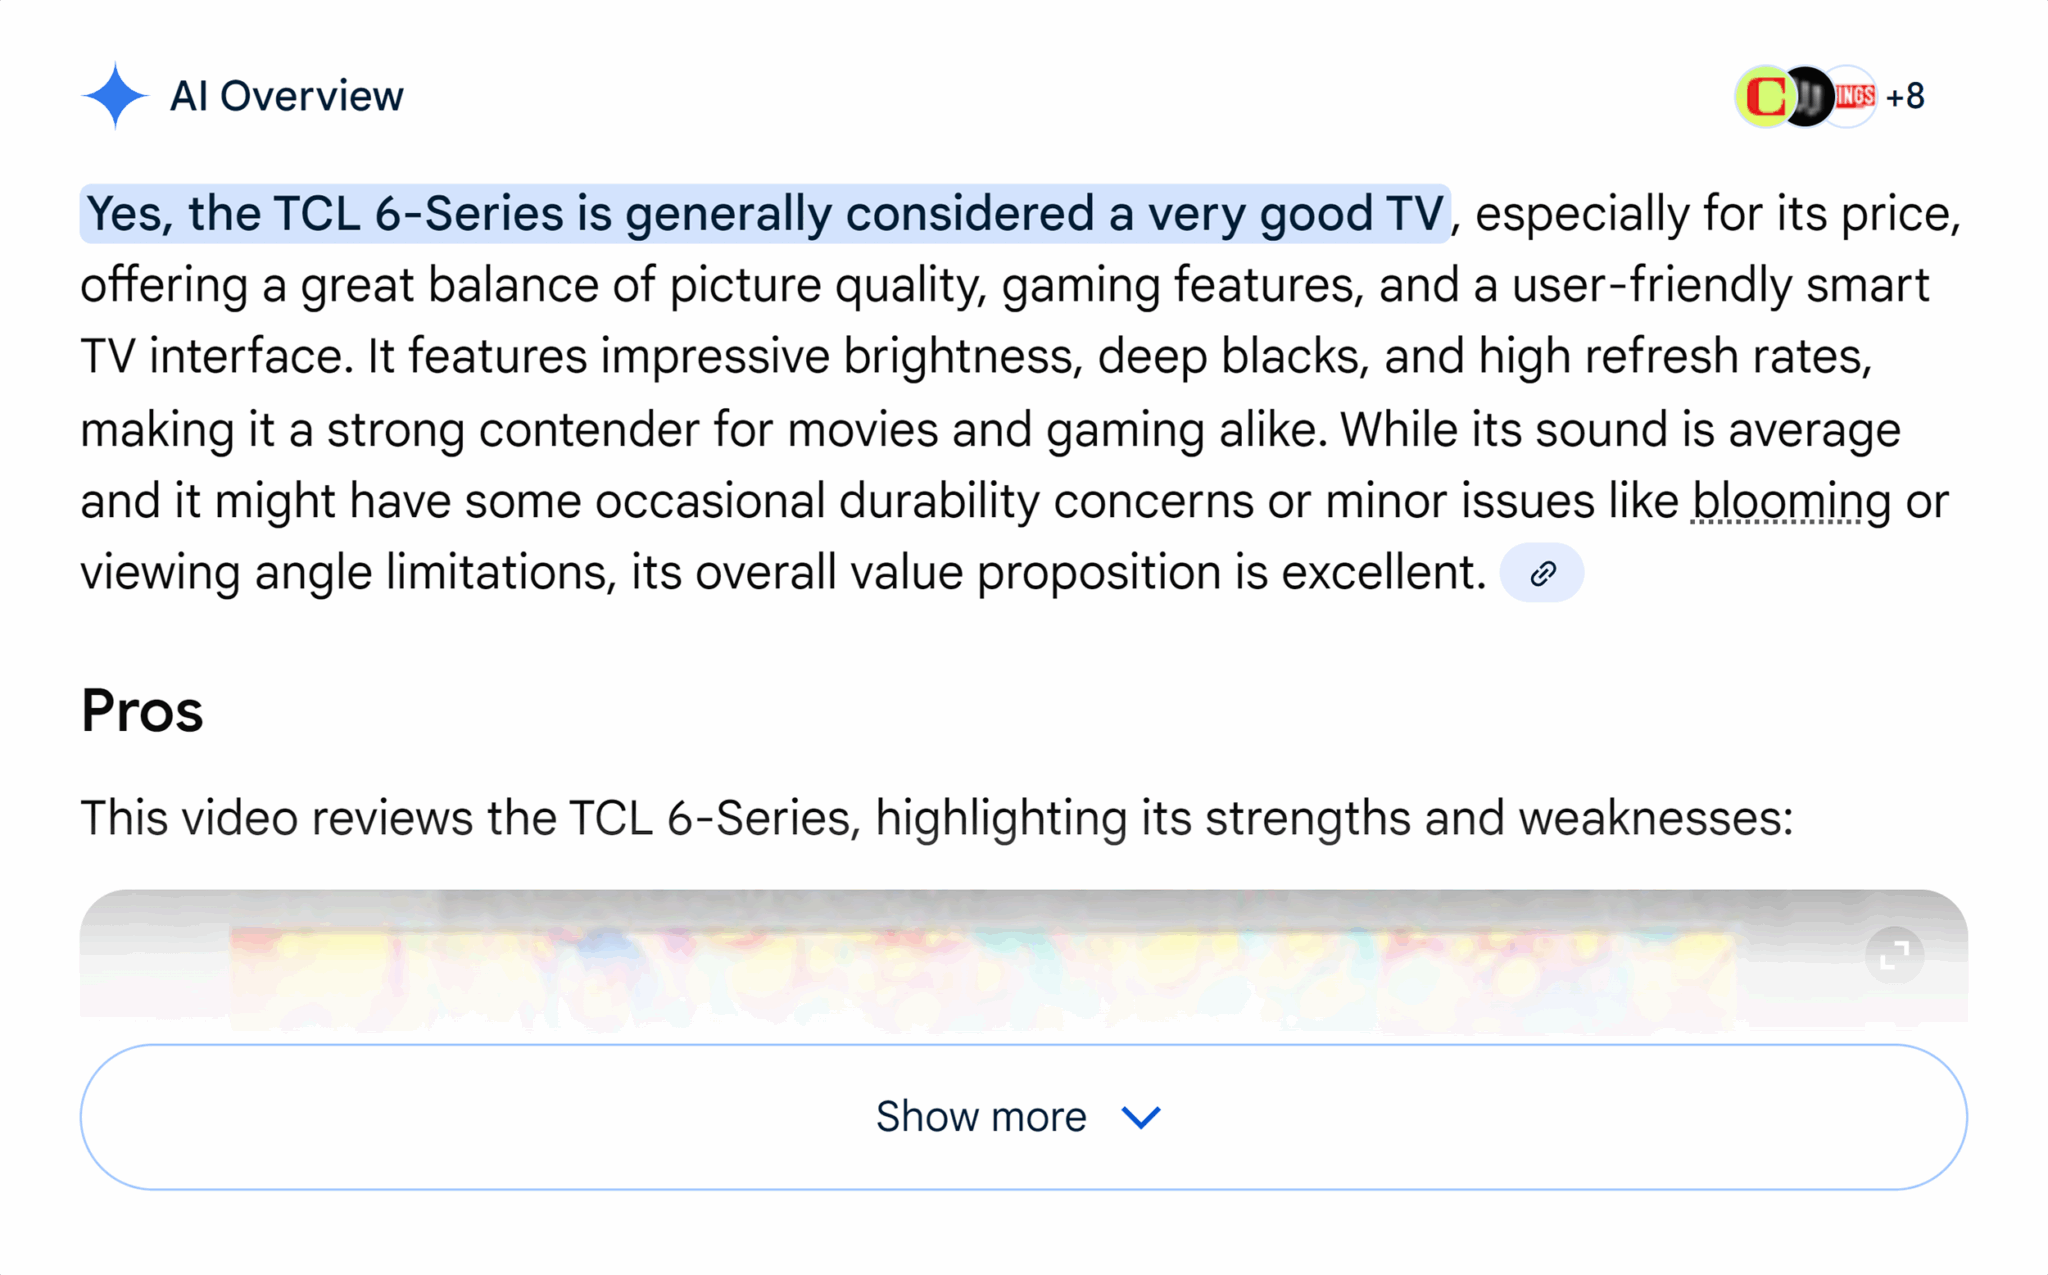
    ```json
{
  "alt": "Text review of the TCL 6-Series TV highlighting its strengths and weaknesses.",
  "caption": "Discover why the TCL 6-Series TV is celebrated for its picture quality and gaming features, balancing affordability with performance.",
  "description": "This image features a text review of the TCL 6-Series TV, emphasizing its value for money with excellent picture quality, gaming features, and a smart TV interface. The text acknowledges minor issues like blooming and sound quality but highlights the TV’s competitive edge for movies and gaming. Keywords: TCL 6-Series, TV review, picture quality, gaming features, smart TV."
}
```

    For instance, if a TV ad campaign runs concurrently with optimizing for LLM mentions, analyzing their impact becomes essential. Only with complete awareness of such activities can I identify true causality or correlation.

    ```json
{
  "alt": "Line graph showing share of voice trends for Samsung, LG, and TCL over a span of one month.",
  "caption": "Explore the fluctuating share of voice for Samsung, LG, and TCL across a bustling month, revealing dynamic brand interactions.",
  "description": "This line graph displays the share of voice trends for three major brands: Samsung (blue), LG (yellow), and TCL (green), over a monthly period starting October 3rd to November 2nd. The graph showcases the daily variations in visibility and mentions for each brand, highlighting peaks and troughs in their market presence. Useful for tracking brand performance and consumer engagement over time."
}
```

    From here, I find that LLM visibility data is usually just the starting point. It’s unlike traditional SEO insights, which might be more apparent and direct. My task is to delve deeper, probing these data points to uncover richer insights.

    ```json
{
  "alt": "Visibility overview dashboard for buffalowildwings.com showing AI visibility score and audience data across multiple platforms.",
  "caption": "Explore the visibility insights of buffalowildwings.com with this detailed dashboard, highlighting AI visibility scores and audience metrics over time.",
  "description": "The image displays a visibility overview dashboard for buffalowildwings.com. It includes AI visibility scores, with a total score of 74 out of 100, labeled as medium. There are graphs indicating trends in total AI visibility, Chat GPT, AI Overview, and AI Mode from September to October 2025. The audience metrics show a monthly audience of 98.7 million, with an increase of 3.9 million, and mentions at 18.4K, which decreased by 390. The mention sources include Chat GPT, AI Overview, and AI Mode, with future integration of Gemini."
}
```

    The Branded Search of It All

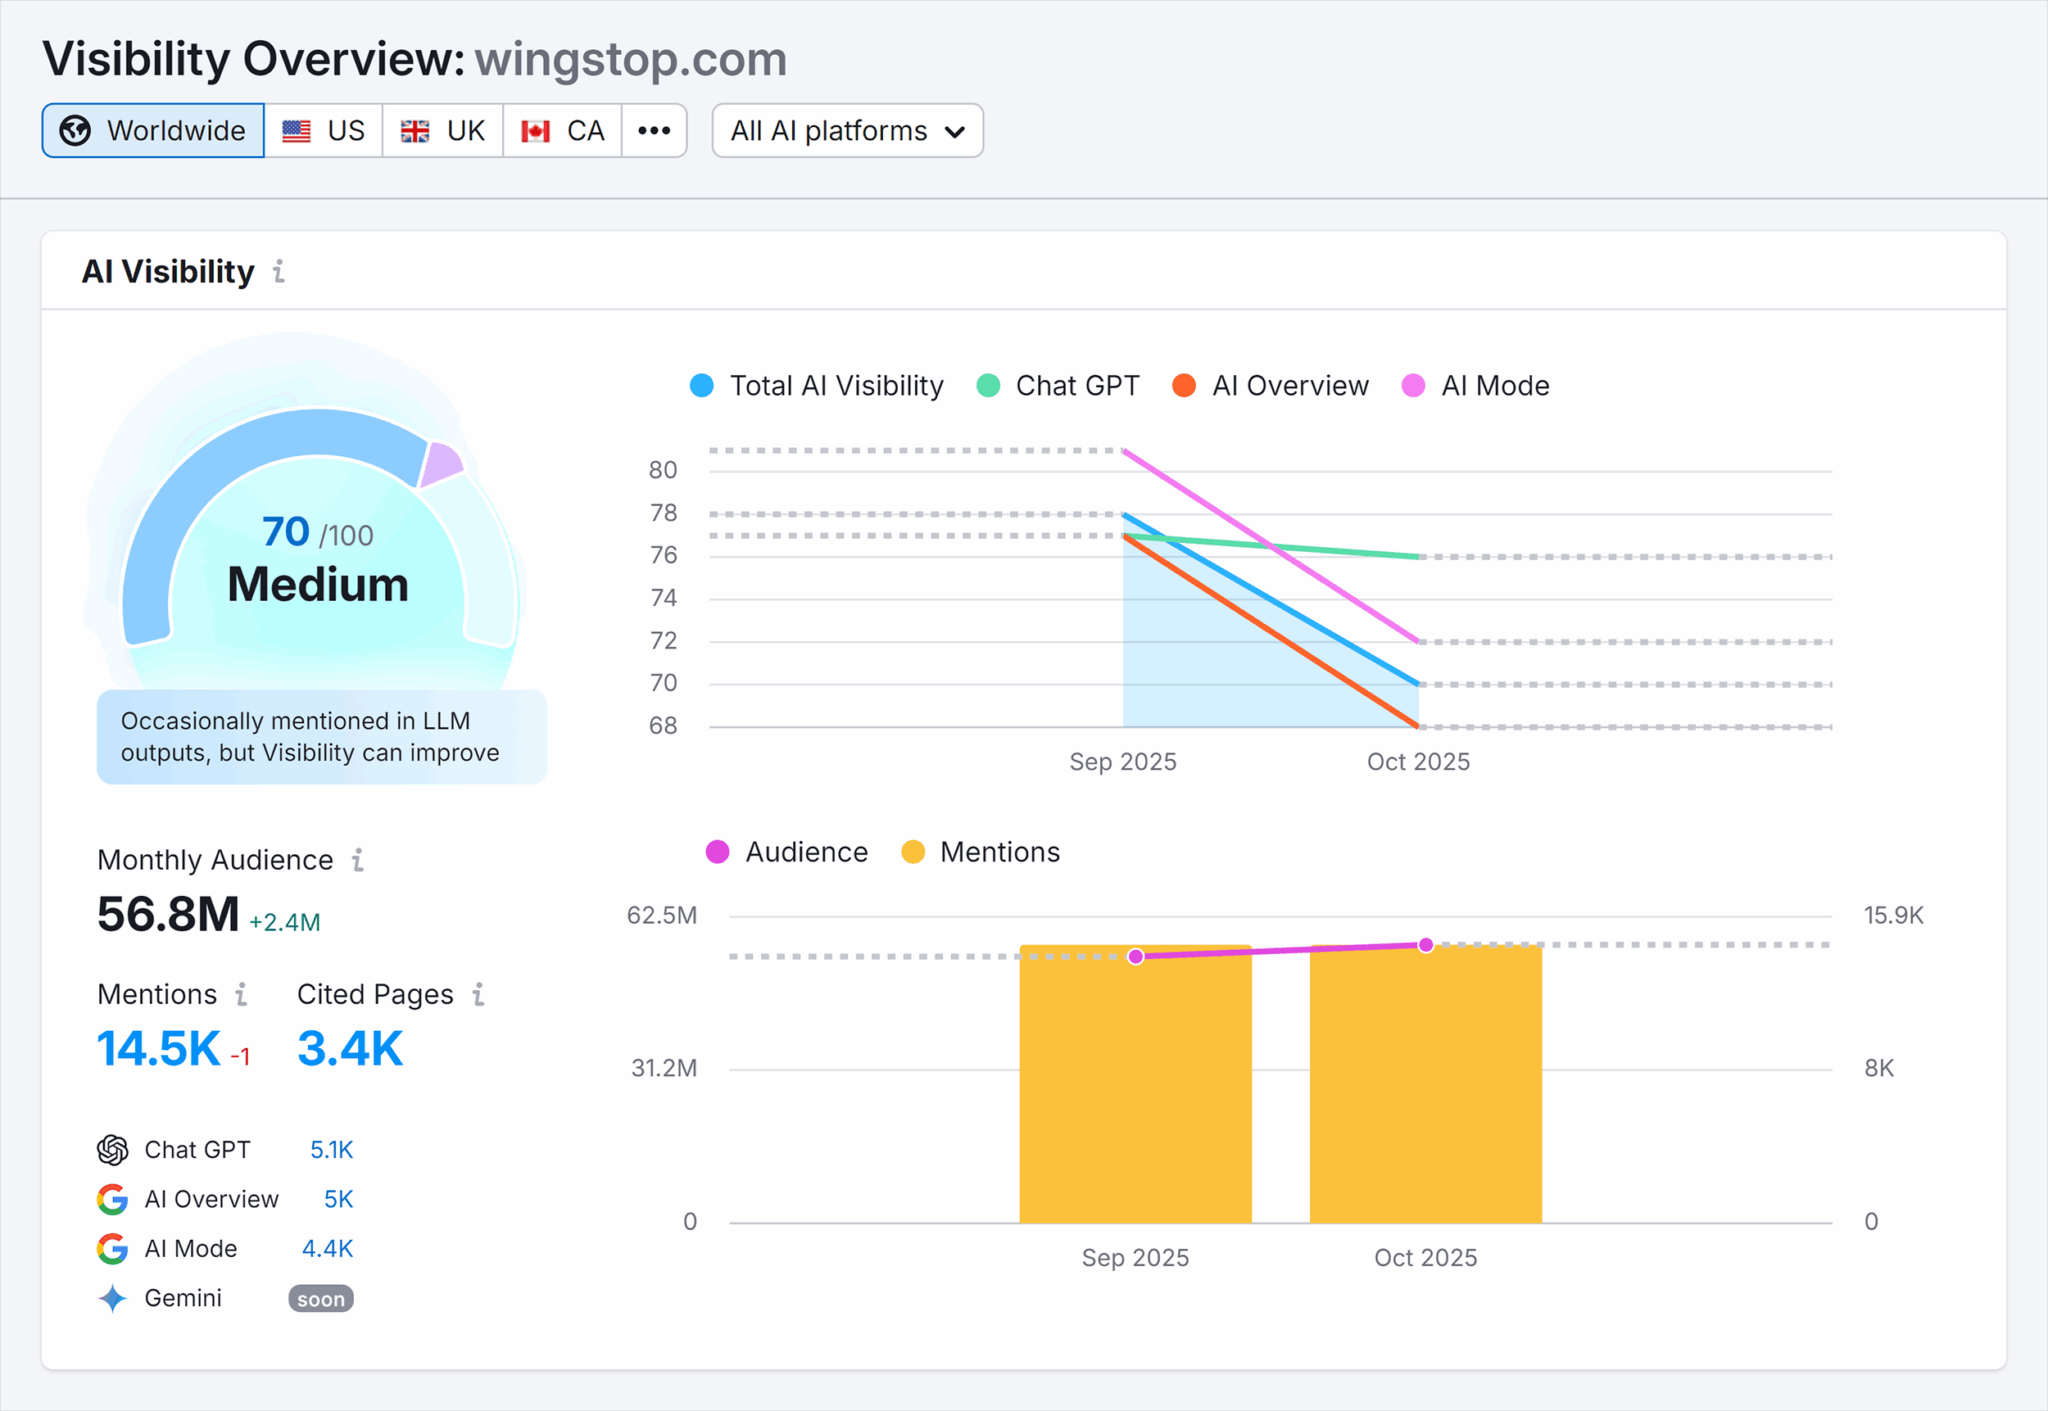
    I’ve noticed that brand search provides exceptional insights into LLM performance, offering a rich vein of marketing intelligence. The comparison between two competing chicken wing chains, Buffalo Wild Wings and Wingstop, brightened this understanding for me. While their LLM citations differ, their brand awareness through social media presence offers a clearer picture of market positioning.

    ```json
{
  "alt": "AI visibility overview for wingstop.com showing medium AI visibility and audience metrics for Sep to Oct 2025.",
  "caption": "Wingstop.com is currently rated as having medium AI visibility with audiences engaging steadily through to October 2025.",
  "description": "This image displays an AI visibility overview for wingstop.com. It highlights a medium visibility score of 70/100, with key metrics such as monthly audience at 56.8M and mentions at 14.5K. The accompanying chart visualizes trends in audience and mentions from September to October 2025 across platforms like Chat GPT and AI Overview."
}
```

    Simply examining the branded search traffic showed me how both brands performed similarly on Google, despite their different social media followings. Here lies the heart of utilizing search data creatively to find LLM visibility data strategies.

    ```json
{
  "alt": "Instagram profiles of Wingstop and Buffalo Wild Wings with logos and follower counts.",
  "caption": "Wingstop and Buffalo Wild Wings go head-to-head on Instagram, showcasing their vibrant profiles and follower stats. Which wing will you pick?",
  "description": "This image displays the Instagram profiles of two popular restaurants, Wingstop and Buffalo Wild Wings. Wingstop's profile features a green logo, 772K followers, and promotes their 'Fiery Lime' flavor. Buffalo Wild Wings showcases a yellow logo with a bison, boasting 540K followers, and advertises their 'Pick 6 Meal For 2'. Both profiles include website links and number of posts and followings, emphasizing their presence on social media."
}
```

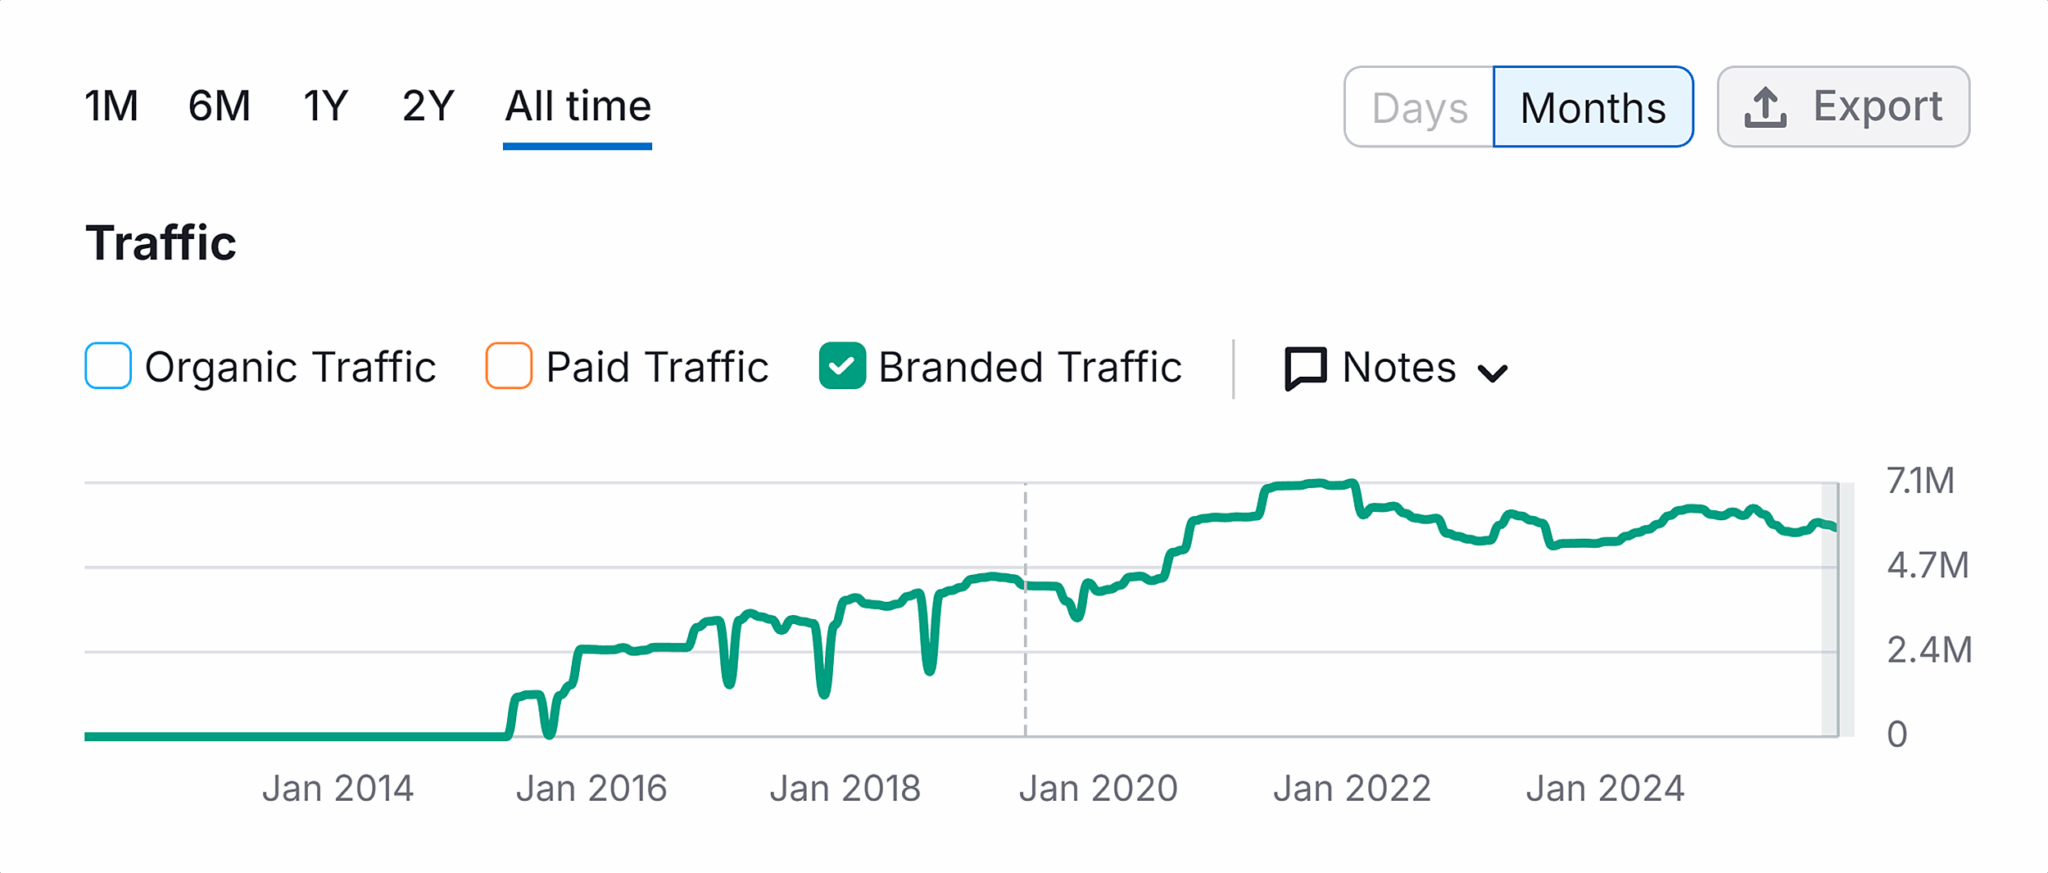
    Rather than merely counting traffic, I am now compelled to consider the number of branded keywords involved, providing a sometimes surprising view on brand awareness and diversity. This approach provides a richer understanding of LLM visibility’s impact.

    ```json
{
  "alt": "Graph showing branded traffic growth from 2014 to 2024.",
  "caption": "Branded traffic trends over a decade reveal growth patterns and fluctuations from 2014 to 2024.",
  "description": "This line graph illustrates the growth of branded traffic from 2014 to 2024. Displayed over a timeline, the data reveals significant upward trends with moments of fluctuation, particularly notable around 2018 and 2022. The graph uses a green line to represent branded traffic, with metrics ranging from 0 to 7.1 million. The interface includes options to view data in various time frames, including days and months, and features a menu for exporting the data."
}
```

    Direct Traffic: My Trusted LLM Data Companion

    I’ve come to see direct traffic as an essential part of my LLM data narrative. Far from being a black hole, direct traffic can often indicate brand awareness and affinity, especially when correlated with LLM visibility metrics. Understanding these correlations allows me to paint a clearer picture of AI’s practical impact on consumer behavior.

    ```json
{
  "alt": "Traffic chart showing branded traffic from January 2014 to January 2024 with steady growth and fluctuations.",
  "caption": "Charting Success: This graph illustrates the rise and fluctuations in branded traffic over a decade, painting a picture of strategic growth!",
  "description": "This image features a traffic chart depicting the growth of branded traffic from January 2014 to January 2024. The graph shows a green line that represents the number of visitors in millions, starting near zero in 2014 and rising to over 4.7 million by 2024. The data reflects a general upward trend with noticeable fluctuations, representing periodic changes in traffic levels. The chart includes options for viewing organic and paid traffic, and it is set to display monthly data over the entire period. Keywords: traffic chart, branded traffic, growth, analytics."
}
```

    For instance, if I compare LG and TCL, LG’s superior direct traffic and increasing momentum in LLM visibility suggest a tangible AI-driven influence, a possibility I must explore through multi-metric analysis.

    ```json
{
  "alt": "SEO dashboard for buffalowildwings.com showing keyword metrics and traffic data.",
  "caption": "Explore the SEO metrics of buffalowildwings.com, showcasing keyword rankings and traffic trends as of November 17, 2025.",
  "description": "The image displays an SEO research interface for buffalowildwings.com, focusing on positions and metrics. It highlights keyword usage of 360.2K with a 3.28% change, alongside traffic data of 5.7M visitors and a traffic cost of $886.4K. The dashboard offers a detailed view of SEO performance across different regions, including the US, Canada, and the UK, with device-specific metrics for desktop usage."
}
```

    Considering various metrics together and identifying shared trends offer insight into how LLM visibility might be affecting my brand’s overall recognition and engagement.

    ```json
{
  "alt": "Screenshot of organic research data for wingstop.com showing keyword statistics, traffic, and traffic cost.",
  "caption": "Explore Wingstop.com's robust organic search performance, showcasing a substantial keyword volume and valuable traffic data insights.",
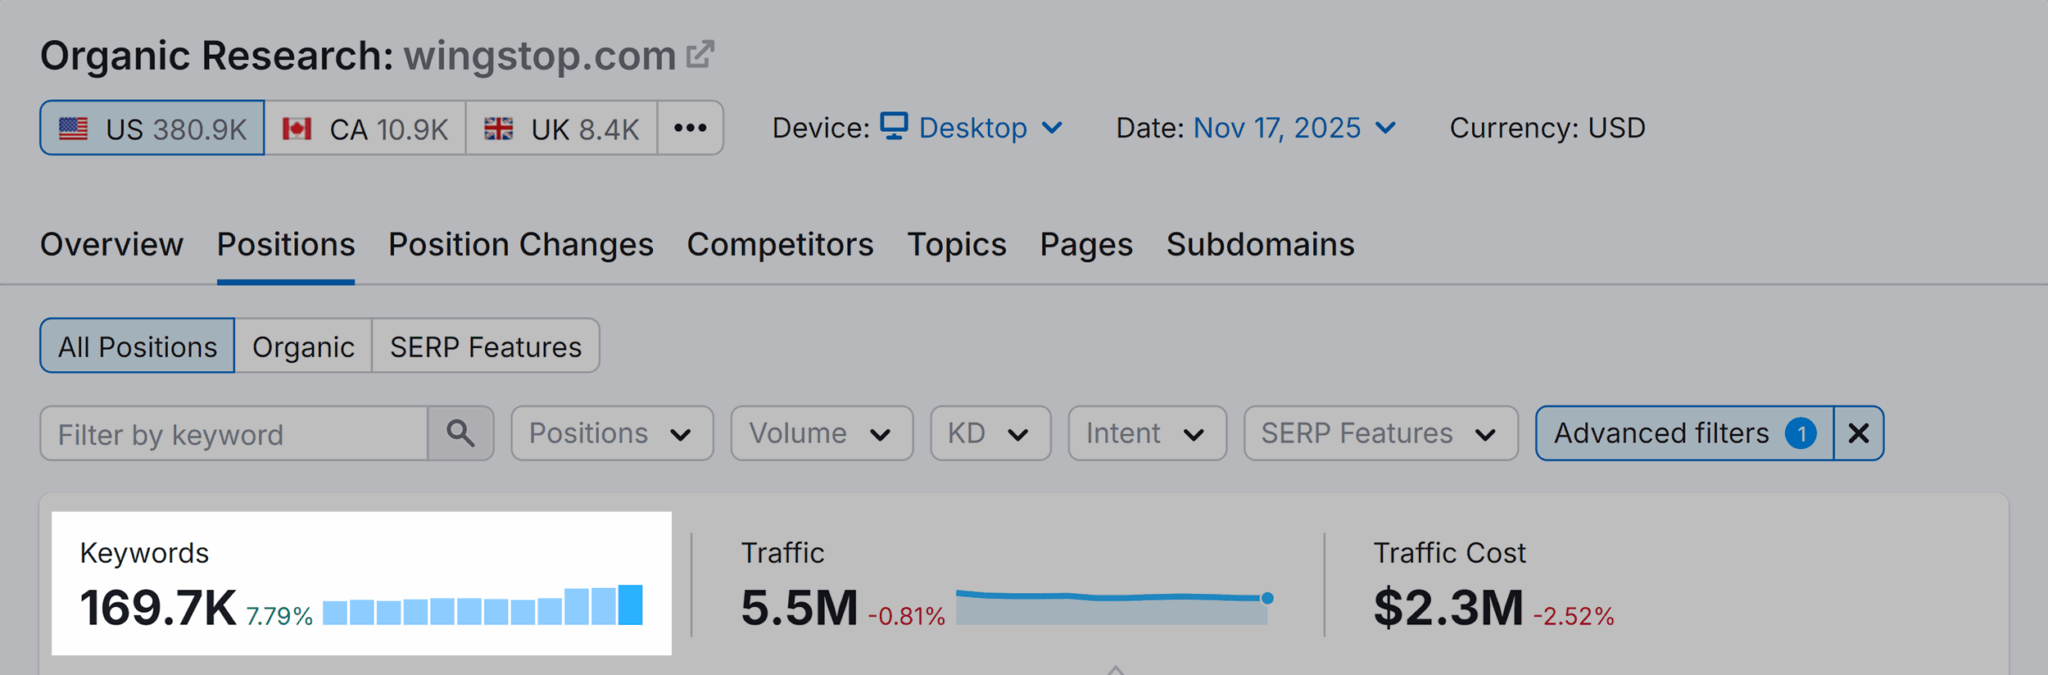
  "description": "This image displays a screenshot from an SEO tool showing organic research data for wingstop.com. It highlights key metrics, including 169.7K keywords with a growth of 7.79%, 5.5M in traffic with a slight decrease of 0.81%, and a traffic cost of $2.3M, down 2.52%. The interface presents data for the US, Canada, and the UK, with options to filter results by keywords and positions. This detailed view assists in analyzing website performance and search engine visibility."
}
```

    Not Just One Metric: Stitching Together LLM Data Stories

    Ultimately, it’s about developing a comprehensive data story from LLM visibility insights. This story goes beyond direct KPIs, utilizing various data sources, such as bounce rates and organic traffic, to add depth and relevance to the narrative. Every piece of performance-focused data stands as testimony to the expertise we can bring to LLM visibility.

    ```json
{
  "alt": "Dashboard showing keyword, traffic, and cost metrics for 'sauce' with a traffic trend graph.",
  "caption": "Explore the SEO journey of 'sauce' with detailed keyword performance, traffic data, and cost analysis over the past year.",
  "description": "This image depicts an SEO dashboard for the keyword 'sauce,' showing 406 keywords with a 3.79% decrease, traffic at 10.4K with a slight 0.04% drop, and a traffic cost of $585 reflecting a 5.49% decrease. A traffic trend graph illustrates data over a year, highlighting fluctuations. Useful for SEO analysis and tracking keyword performance metrics."
}
```

    Total LLM visibility data, when creatively amalgamated with performance data, can transform insights into actionable strategies that align with pragmatic business objectives, showcasing our value in the AI-driven landscape.

    ```json
{
  "alt": "Traffic analytics chart showing keyword and traffic data for 'sauce'.",
  "caption": "Dive into the analytics! This chart reveals keyword dynamics and traffic trends for the term 'sauce' over the past year.",
  "description": "This image displays a traffic analytics dashboard for the keyword 'sauce', revealing data on keyword volume, traffic, and traffic costs. The chart shows an estimated traffic trend spanning a year from December to November, with metrics indicating a slight decline in keyword count and traffic cost, but an increase in total traffic. The interface includes advanced filter options and time range adjustments for detailed insights."
}
```

    Inspired by this post on Search Engine Land.


    crushpress.ai community screenshot
  • How to Use Google Search Console’s Branded Queries Filter

    How to Use Google Search Console’s Branded Queries Filter

    Your organic traffic changed, but the total line in Google Search Console can’t tell you whether more people discovered your site or simply searched for a brand they already knew. Those are different kinds of demand, and they call for different SEO decisions.

    The branded queries filter gives you that missing split. Used carefully, it can expose non-branded discovery growth, stop brand demand from inflating an SEO report, and show where your search visibility actually needs attention.

    What the branded query split actually measures

    A branded query can include your brand name, variations of that name, or brand-related products. The non-branded segment covers the queries Google does not classify that way.

    That makes the split useful for separating explicit brand demand from broader discovery. Someone searching your name is already navigating toward your brand. Someone searching for a problem, category, service, or product type gives you a clearer view of how often search introduces your site without requiring the brand name first.

    Do not translate those labels into “returning users” and “new users.” Search Console is classifying queries, not identifying the person behind each search. A first-time visitor can use a branded query after seeing your name elsewhere, while an existing customer can use a non-branded query. Treat the segments as types of search demand, not audience identities.

    This distinction also changes how you should judge click-through rate. Branded searches often carry stronger navigational intent, so they can produce a higher CTR than broad discovery searches. Comparing branded CTR directly with non-branded CTR usually tells you less than comparing each segment with its own previous performance.

    How to create a clean branded versus non-branded comparison

    An analyst sorts anonymous query tiles through a transparent funnel into two trays, with ambiguous tiles set aside for review.

    The filter sits in Search Console’s performance reporting as a query filter. The mechanics are simple, but the order matters. If you change dates, search types, countries, devices, or other filters between views, you no longer have a controlled comparison.

    1. Open the relevant Search Console property and go to its performance report.
    2. Choose the date range you want to analyze. If you are evaluating a change, set a comparison period before segmenting the queries.
    3. Select one search type. The branded query filter works with web, image, video, and news search, but each should be evaluated in its own context.
    4. Open the query filter and select the branded option. Record the clicks, impressions, CTR, and share of traffic shown for that segment.
    5. Switch to the non-branded option without changing any other setting. Record the same metrics.
    6. Inspect the queries and pages inside each segment. The aggregate split tells you what moved; the underlying rows show where it moved.

    If you do not see the option yet, that does not necessarily indicate a property or permission problem. Access is being rolled out gradually, so availability can differ between users or properties.

    Run the comparison separately for each property that represents a meaningful site or market. Combining unlike properties in your interpretation can hide whether the change belongs to one brand, language, product line, or regional site.

    Read absolute performance before you read traffic share

    Two pairs of glass vessels hold different quantities and proportions of cyan and coral spheres.

    A percentage can move even when the segment you are watching does not. Branded share rises when branded traffic grows, but it also rises when branded traffic stays flat and non-branded traffic falls. Those two situations look similar in a share chart and require opposite responses.

    Start with clicks and impressions for both segments. Then use CTR to understand whether visibility is turning into visits. Only after that should you interpret the percentage split.

    Pattern you seeWhat it may meanWhat to inspect next
    Branded clicks and impressions rise while non-branded performance stays stableExplicit demand for the brand may be increasingCheck which branded names or products account for the change, and note any campaigns, publicity, launches, or other activity that could have created demand
    Branded share rises, branded totals stay flat, and non-branded totals fallThe site has not necessarily gained brand strength; discovery performance has weakenedFind the non-branded queries and landing pages that lost impressions or clicks
    Non-branded impressions rise but clicks do not rise proportionallyThe site is appearing for more discovery searches without winning the same share of visitsReview the affected queries, search intent, page relevance, titles, and search-result descriptions
    Non-branded clicks rise while branded performance remains stableOrganic discovery is expanding beyond existing brand demandIdentify the pages, topics, and query groups producing the growth so you can reinforce them
    Branded impressions remain stable while branded CTR fallsSearchers still express brand demand, but fewer of those impressions become clicksInspect individual branded queries and their ranking pages before assuming the brand itself has weakened

    These patterns are diagnostic prompts, not automatic explanations. Search Console shows search performance, not the cause of brand demand. A branded increase may coincide with SEO work, but it can also reflect advertising, email, events, public relations, word of mouth, or product activity. Check the surrounding business context before assigning credit.

    Turn the split into better SEO reporting and prioritization

    The most useful reporting change is to stop presenting one organic total as if every click represents the same achievement. Give branded and non-branded performance separate lines in your scorecard. For each segment, show clicks, impressions, CTR, and the comparison with its own prior period.

    This makes three common reporting mistakes easier to avoid:

    • Calling brand demand an SEO discovery win. If total organic clicks increased because more people searched for the brand, report the gain accurately. It is valuable traffic, but it does not prove that category or problem-led visibility improved.
    • Missing a non-branded decline behind strong brand performance. A growing brand can keep the total trend positive while discovery queries and content-led entry pages lose ground.
    • Treating a lower non-branded CTR as a failure by default. Non-branded searches often cover broader intent. Judge their CTR against relevant prior performance and inspect the actual query mix before drawing a conclusion.

    The split can also sharpen content decisions. If non-branded impressions are growing around a topic but clicks lag, focus on the pages already earning those impressions. Check whether they answer the query directly, whether their titles describe the right outcome, and whether one page is being stretched across several different intents.

    If non-branded clicks are falling, do not respond with a site-wide rewrite. Use the filtered page and query rows to locate the loss first. A decline concentrated in one topic cluster calls for a different response from a decline spread across many page types.

    Branded data deserves its own review as well. Look for unexpected product terms, name variations, or branded queries landing on weak pages. A branded searcher usually has a more specific destination in mind, so a mismatch between the query and landing page can create friction even when the site still receives the click.

    Keep search types separate throughout this analysis. A rise in branded image visibility is not interchangeable with a rise in branded web clicks, and video or news performance may follow a different publishing cycle. The filter works across those surfaces; it does not make their metrics equivalent.

    Know what the filter cannot tell you

    The branded queries filter is Google’s classification, not a custom taxonomy built around your reporting rules. Because the definition can include name variations and related products, it may not match the exact list your organization uses for brand tracking.

    That matters when you manage several brands, share product names with generic terms, or need a contractual definition for client reporting. Use the native split for fast, consistent analysis. If the exact membership of the branded basket affects a formal target, inspect the included queries and apply your own documented classification outside the native filter.

    The filter also does not provide attribution. It cannot tell you which channel taught a searcher the brand name, whether the searcher is new or returning, or what happened after the click. Answer those questions with the appropriate campaign, audience, and conversion data instead of forcing Search Console to do work it was not designed to do.

    Finally, avoid turning the branded-to-non-branded ratio into a universal benchmark. The expected mix varies with business model, brand maturity, product naming, media activity, and the kinds of searches a site can satisfy. Your own trend, under consistent filters, is the defensible comparison.

    Key takeaways

    • Use branded and non-branded filters with identical dates, search types, and other report settings.
    • Treat the labels as query categories, not as proof of new versus returning users.
    • Read clicks and impressions before interpreting either segment’s percentage share.
    • Compare branded CTR with previous branded CTR, and non-branded CTR with previous non-branded CTR.
    • Report discovery performance separately so stronger brand demand cannot conceal weaker non-branded SEO.
    • Inspect the underlying queries and pages before assigning a cause or choosing an optimization task.

    Add the split to your next Search Console review, then choose one action from the segment that actually changed. That may be repairing lost non-branded visibility, improving a page with growing impressions, or correcting a branded landing-page mismatch. The filter earns its place when it changes the work you prioritize, not merely the chart you present.

    References