I’ve been deeply involved in the compelling discussions around AI, especially the intriguing intersection of ‘AI hype meets AI reality.’ Tools like Semrush One and its Enterprise AIO tool have taken center stage, offering invaluable insights into what’s happening inside LLMs. The big questions I often ponder are: How many citations are we capturing and just how many mentions are our brands accumulating?
When this data first emerged, it felt revolutionary. However, it quickly prompted other questions, like ‘What’s the ROI here?’ and ‘How can I integrate this data into my team’s marketing strategy?’ Ensuring that this valuable and fascinating data translates into actionable insights is a challenge I enjoy tackling.
It’s no secret that the data these tools provide is incredibly valuable. But, what steps do I take next? Let’s uncover this journey together.
The Fundamental Challenges of Tracking LLMs
Tracking LLMs can be more challenging than traditional metrics like Google rankings. Google rankings may show where I stand, but ranking doesn’t always correlate with traffic or revenue. Even if I rank highly, an AI Overview could dominate the search, reducing my traffic for a given keyword. I need to ask myself, is this the right traffic for my business goals?
The big difference between traditional SEO rankings and LLM visibility is the straightforward correlation between strong rankings and increased revenue, which is more complex with LLMs. I can easily track user behavior after they land on my site from organic search, but it’s not so clear-cut with LLMs.
SEO effectively drives traffic to my site, allowing me to evaluate the success of my conversion rate optimization (CRO) strategies. However, LLMs operate differently, leaving me with the task of creatively connecting the dots.
The Problem with Methodology
As I dive deeper into using LLM-related data, I realize this approach requires me to step out of my comfort zone as a performance marketer. My usual reliance on direct attribution and data points is shifted toward constructing a narrative that ties LLM visibility to larger brand storytelling.
This method isn’t novel, however. Brand marketers have dealt with indirect metrics since the days of billboard advertising. Still, the shift requires me to create insights from what might seem like fragmented LLM data.
Metrics and Approach to LLM Impact Measurement
Uncovering the true value brought by LLM visibility metrics is a layered and comprehensive process. To do this accurately, I need to understand the wider ecosystem of my organization’s promotional efforts. This understanding allows me to determine the root cause of site traffic or branded searches effectively.
For instance, if a TV ad campaign runs concurrently with optimizing for LLM mentions, analyzing their impact becomes essential. Only with complete awareness of such activities can I identify true causality or correlation.
From here, I find that LLM visibility data is usually just the starting point. It’s unlike traditional SEO insights, which might be more apparent and direct. My task is to delve deeper, probing these data points to uncover richer insights.
The Branded Search of It All
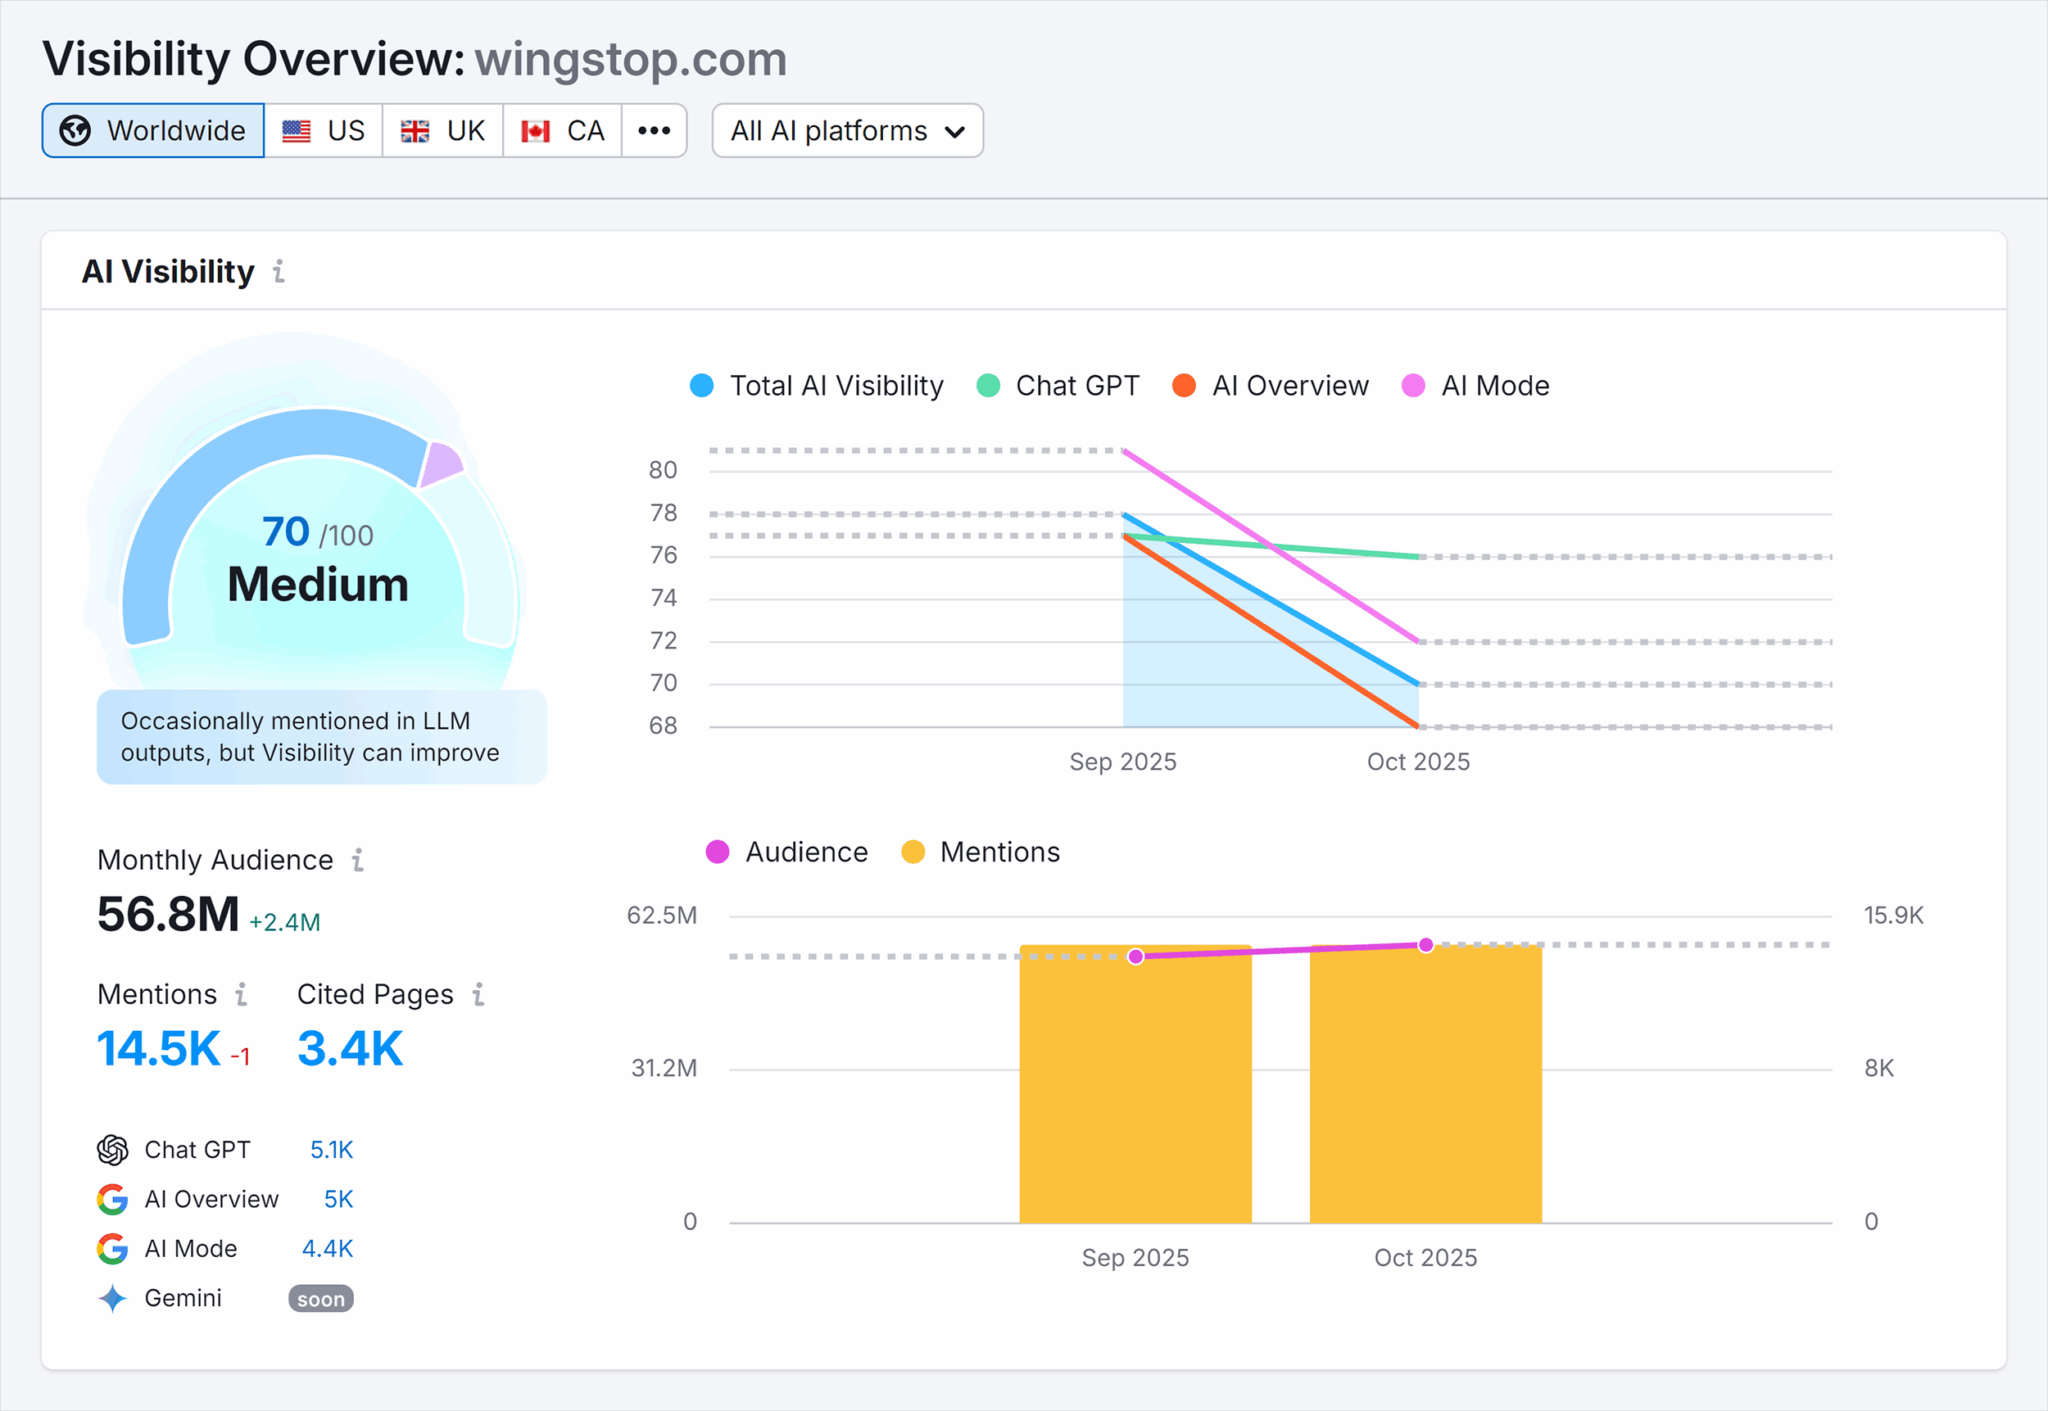
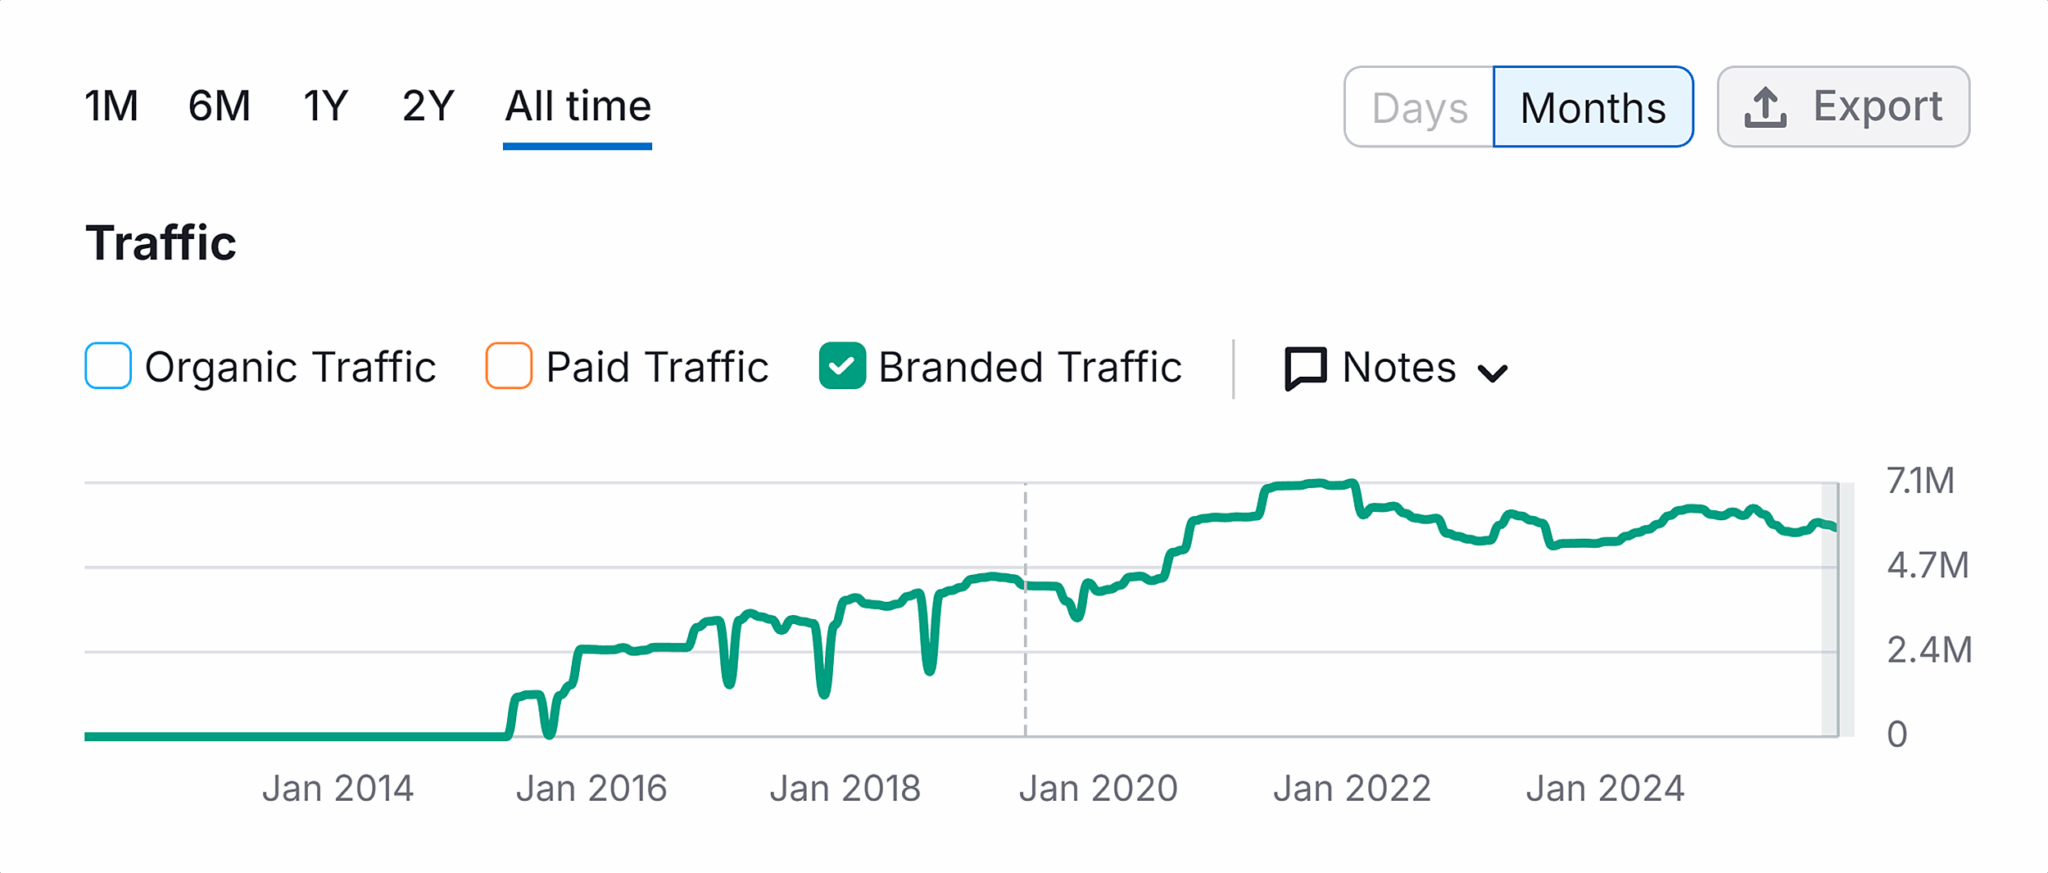
I’ve noticed that brand search provides exceptional insights into LLM performance, offering a rich vein of marketing intelligence. The comparison between two competing chicken wing chains, Buffalo Wild Wings and Wingstop, brightened this understanding for me. While their LLM citations differ, their brand awareness through social media presence offers a clearer picture of market positioning.
Simply examining the branded search traffic showed me how both brands performed similarly on Google, despite their different social media followings. Here lies the heart of utilizing search data creatively to find LLM visibility data strategies.
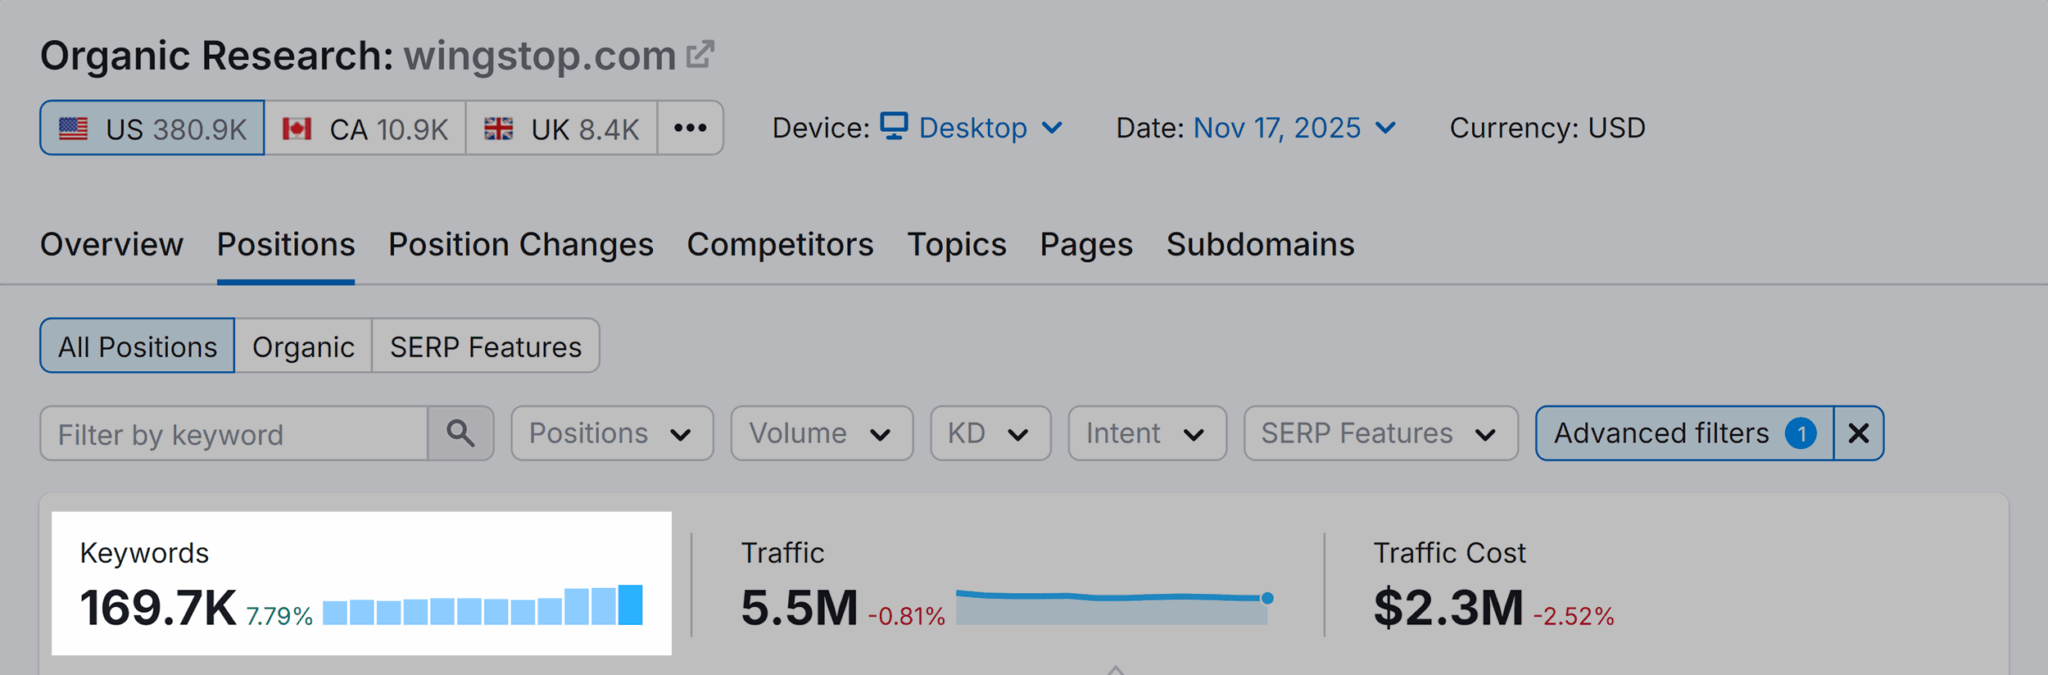
Rather than merely counting traffic, I am now compelled to consider the number of branded keywords involved, providing a sometimes surprising view on brand awareness and diversity. This approach provides a richer understanding of LLM visibility’s impact.
Direct Traffic: My Trusted LLM Data Companion
I’ve come to see direct traffic as an essential part of my LLM data narrative. Far from being a black hole, direct traffic can often indicate brand awareness and affinity, especially when correlated with LLM visibility metrics. Understanding these correlations allows me to paint a clearer picture of AI’s practical impact on consumer behavior.
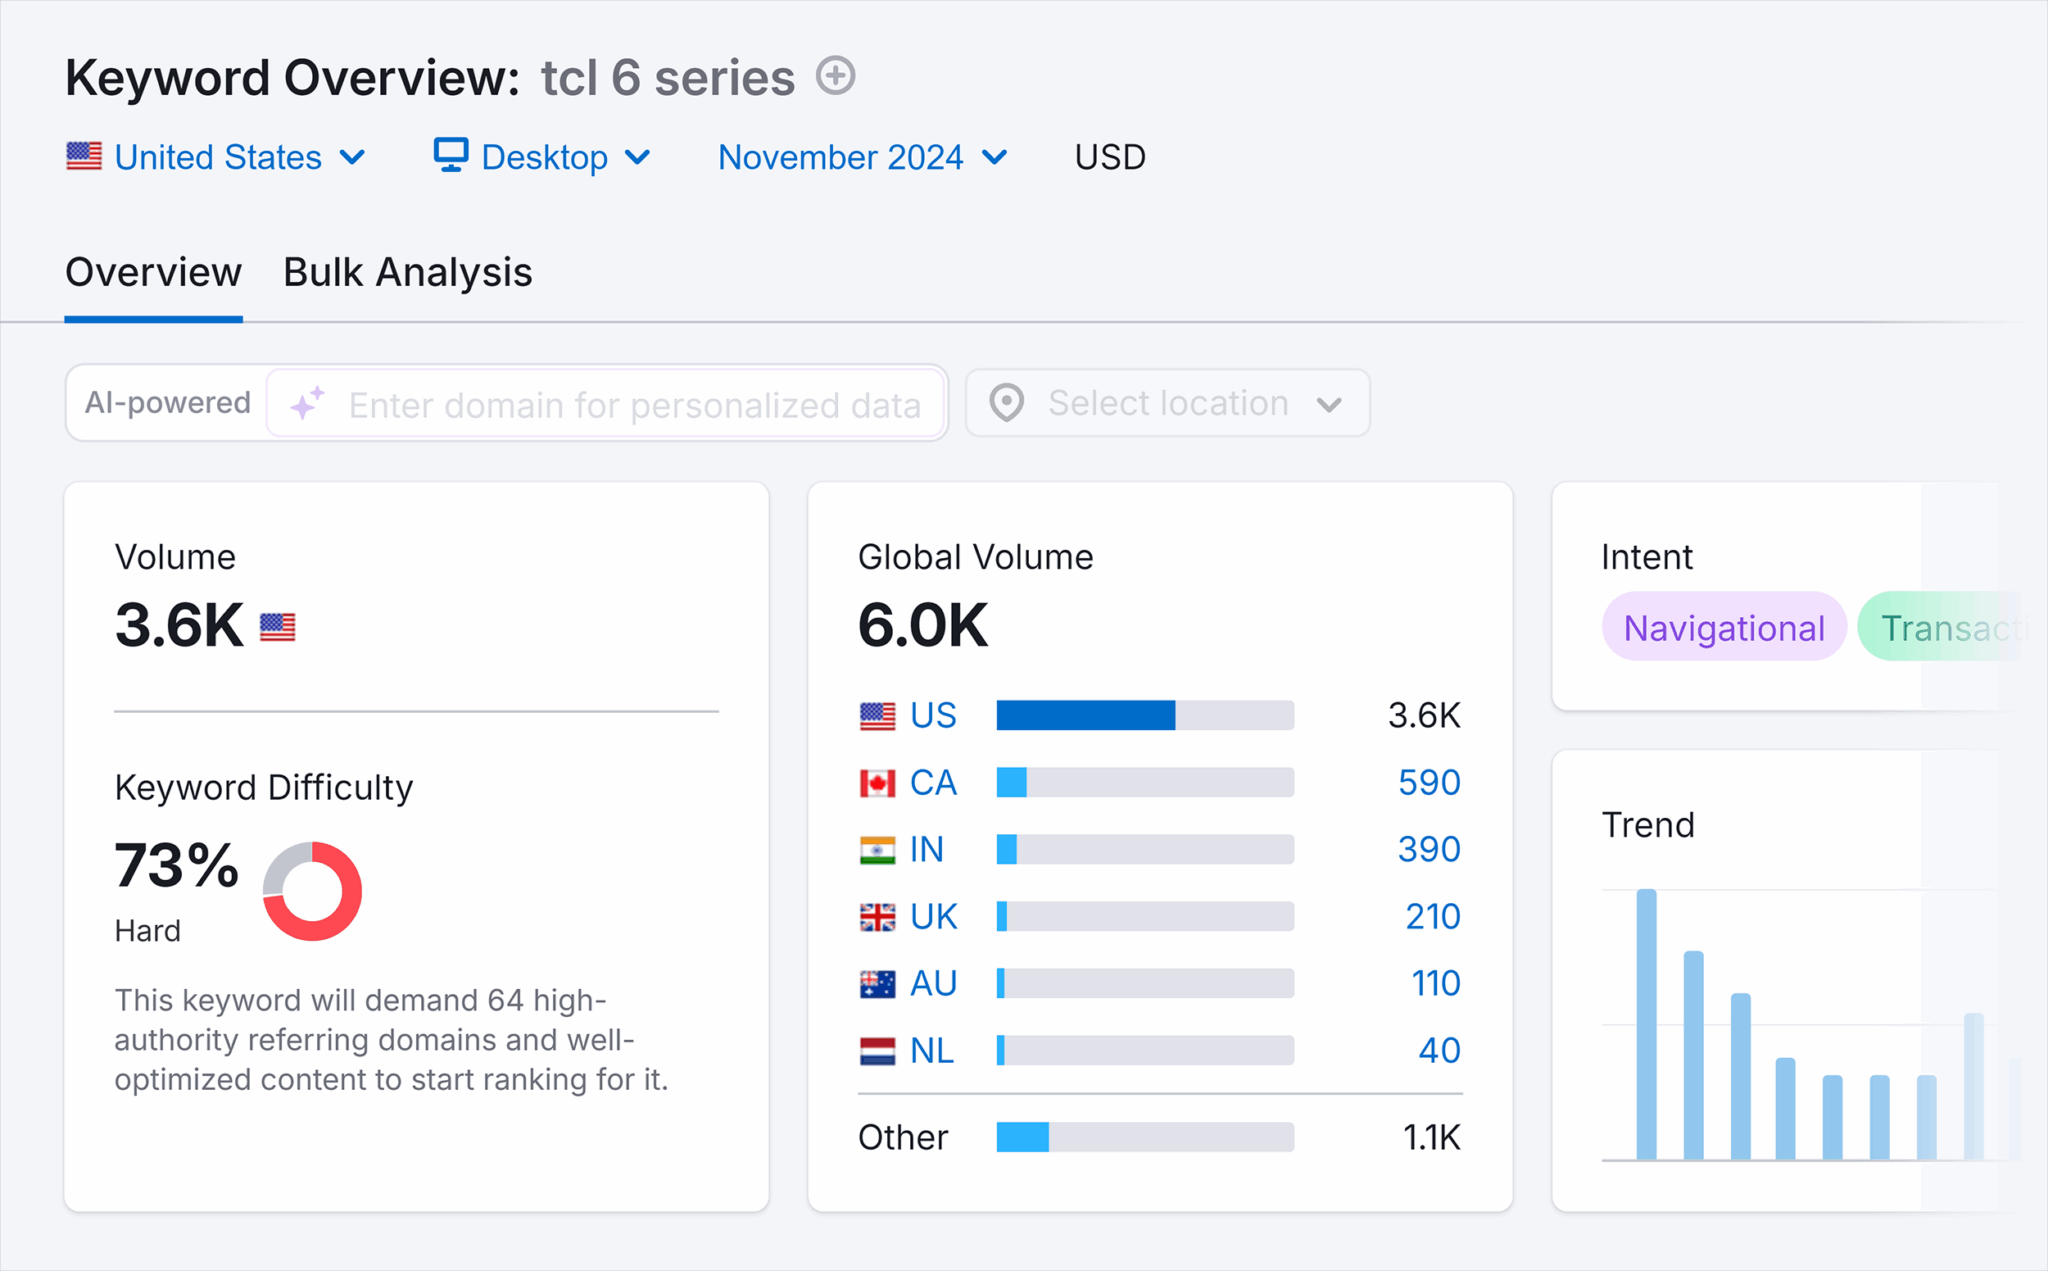
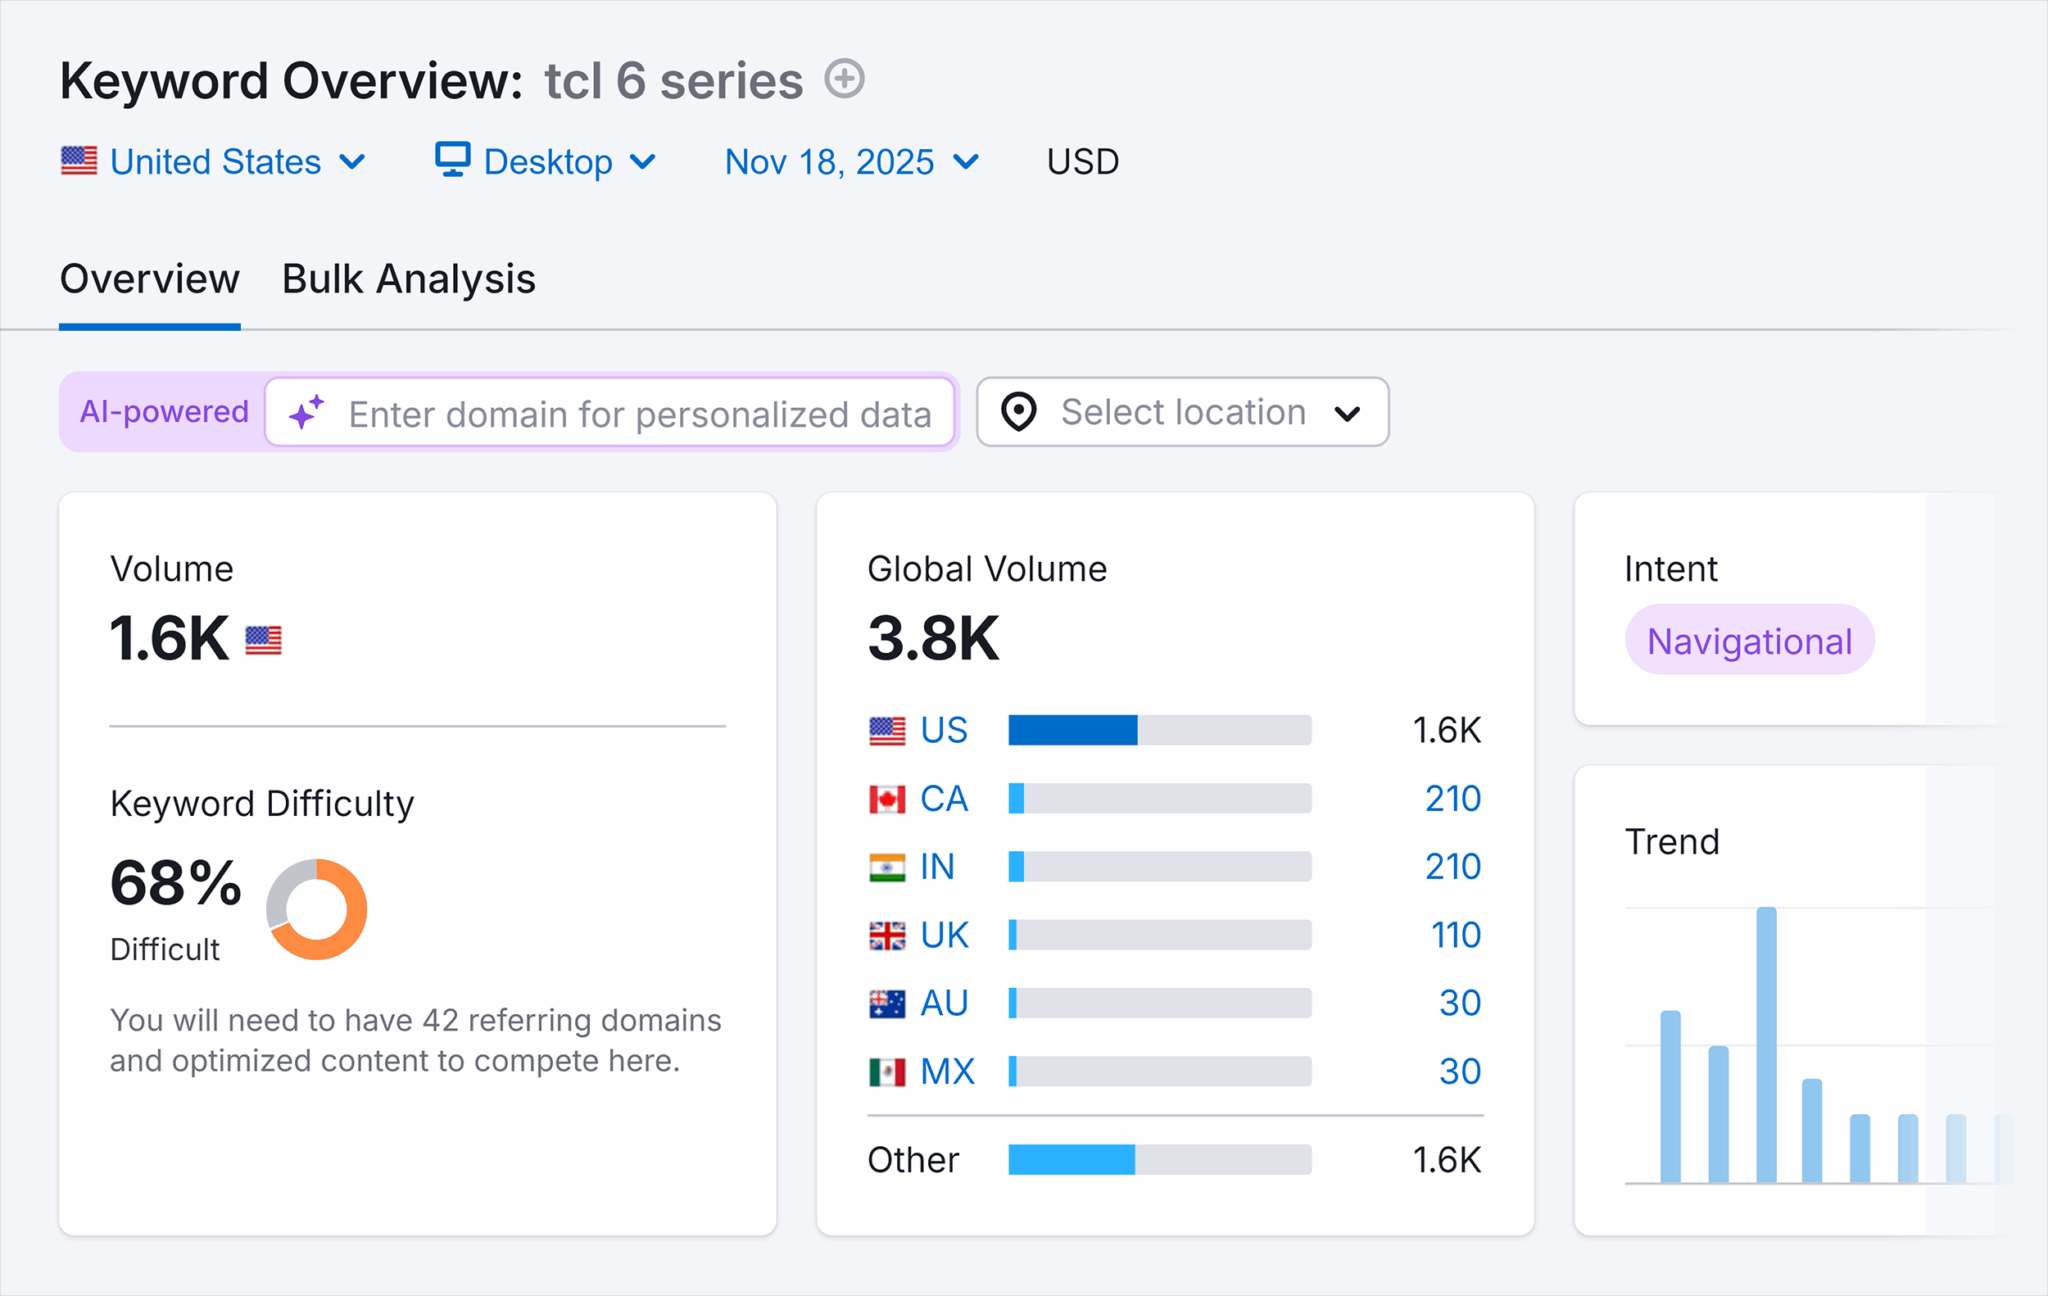
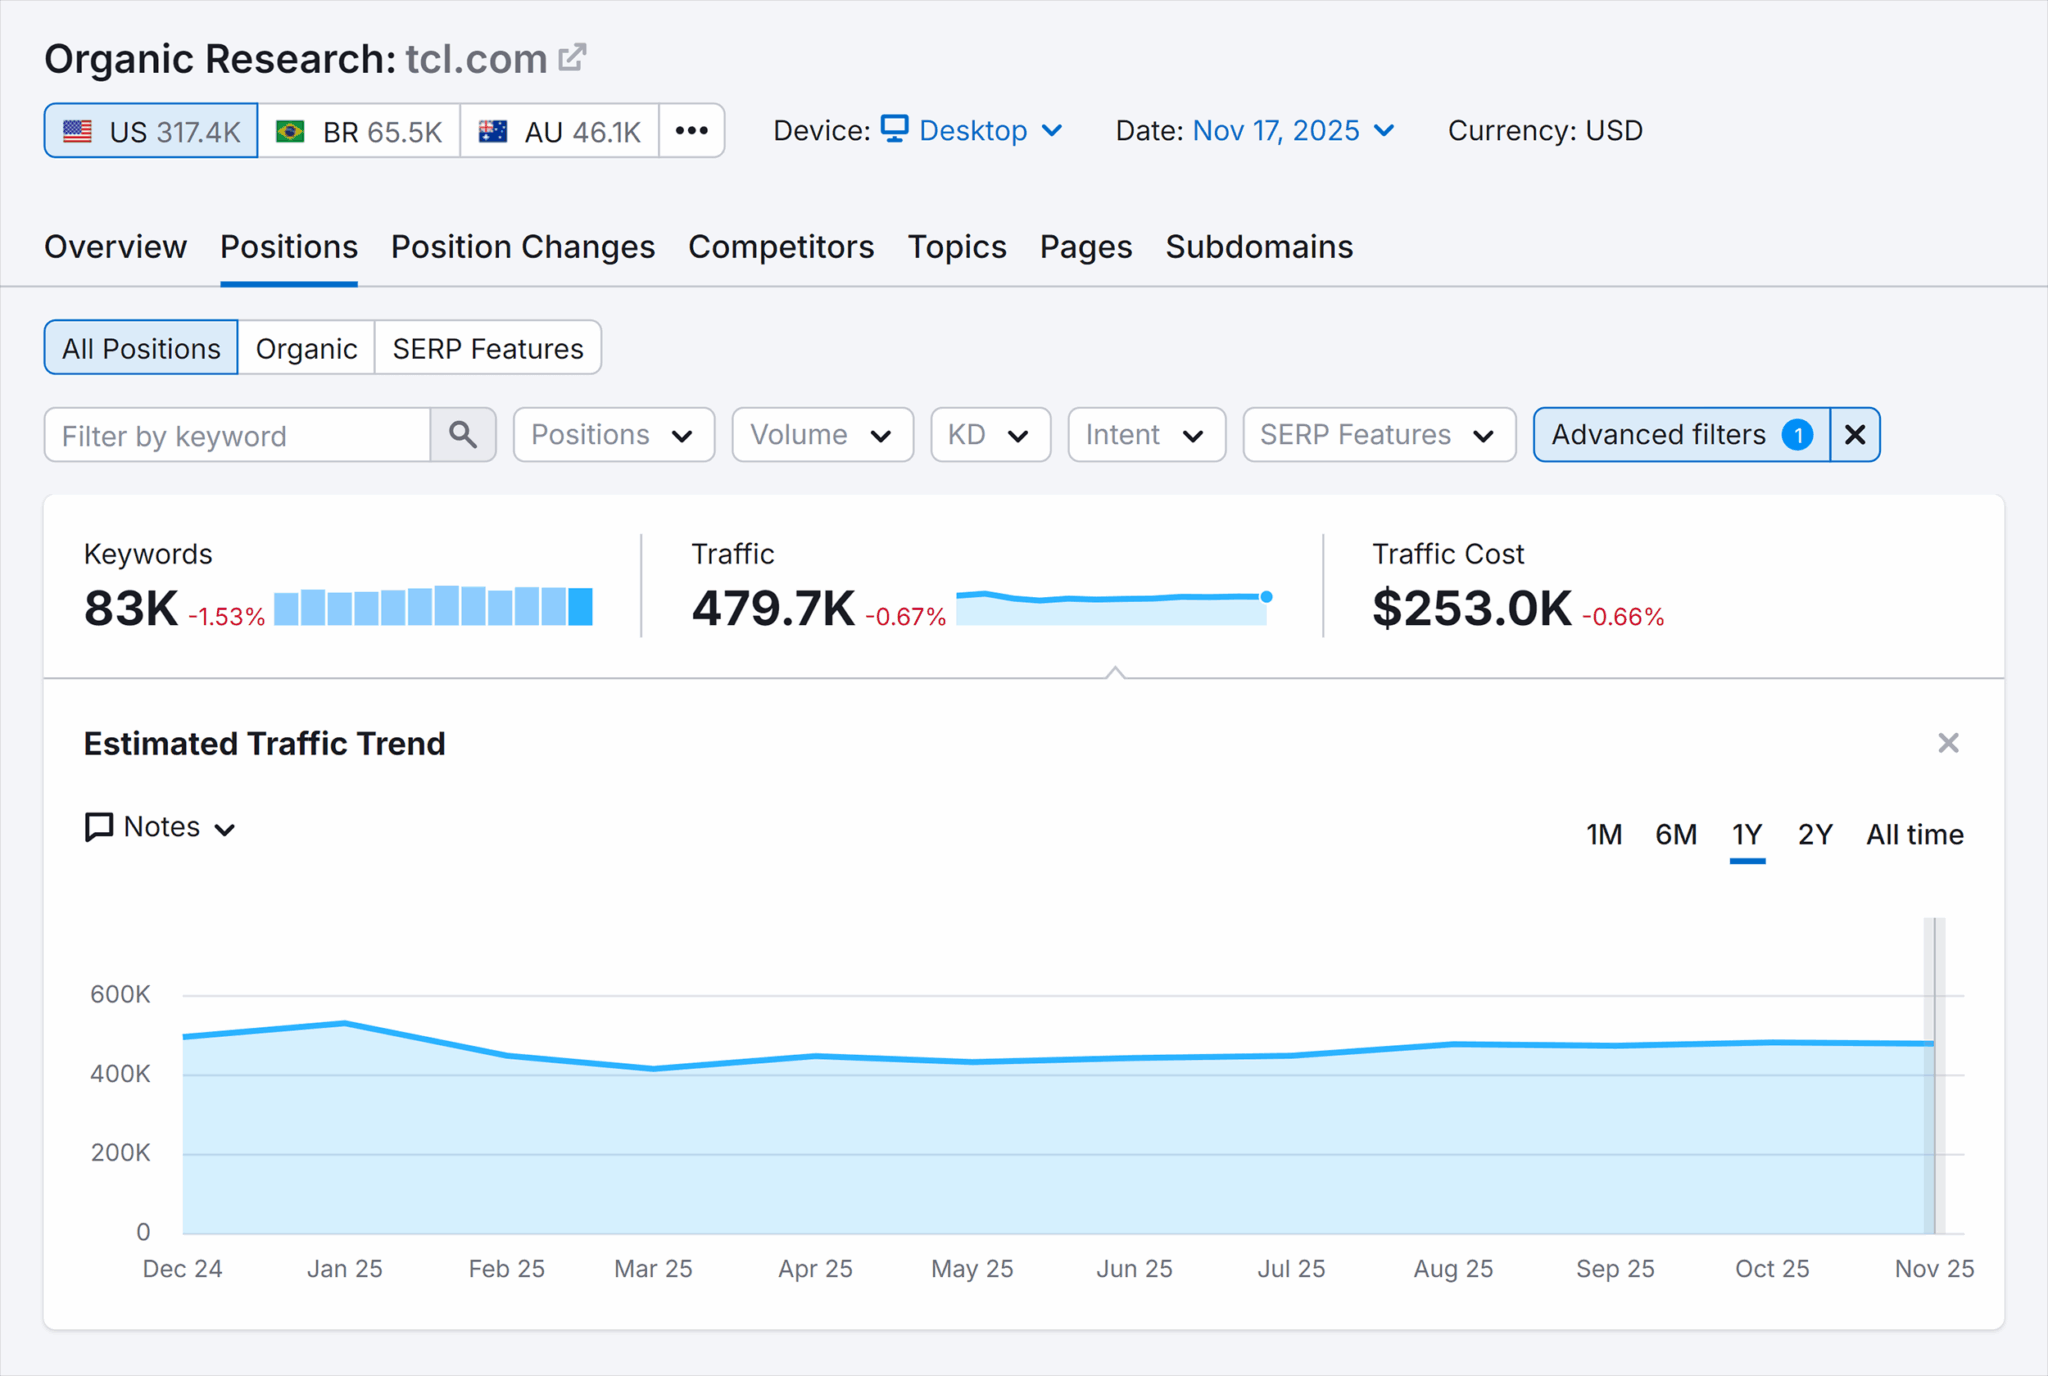
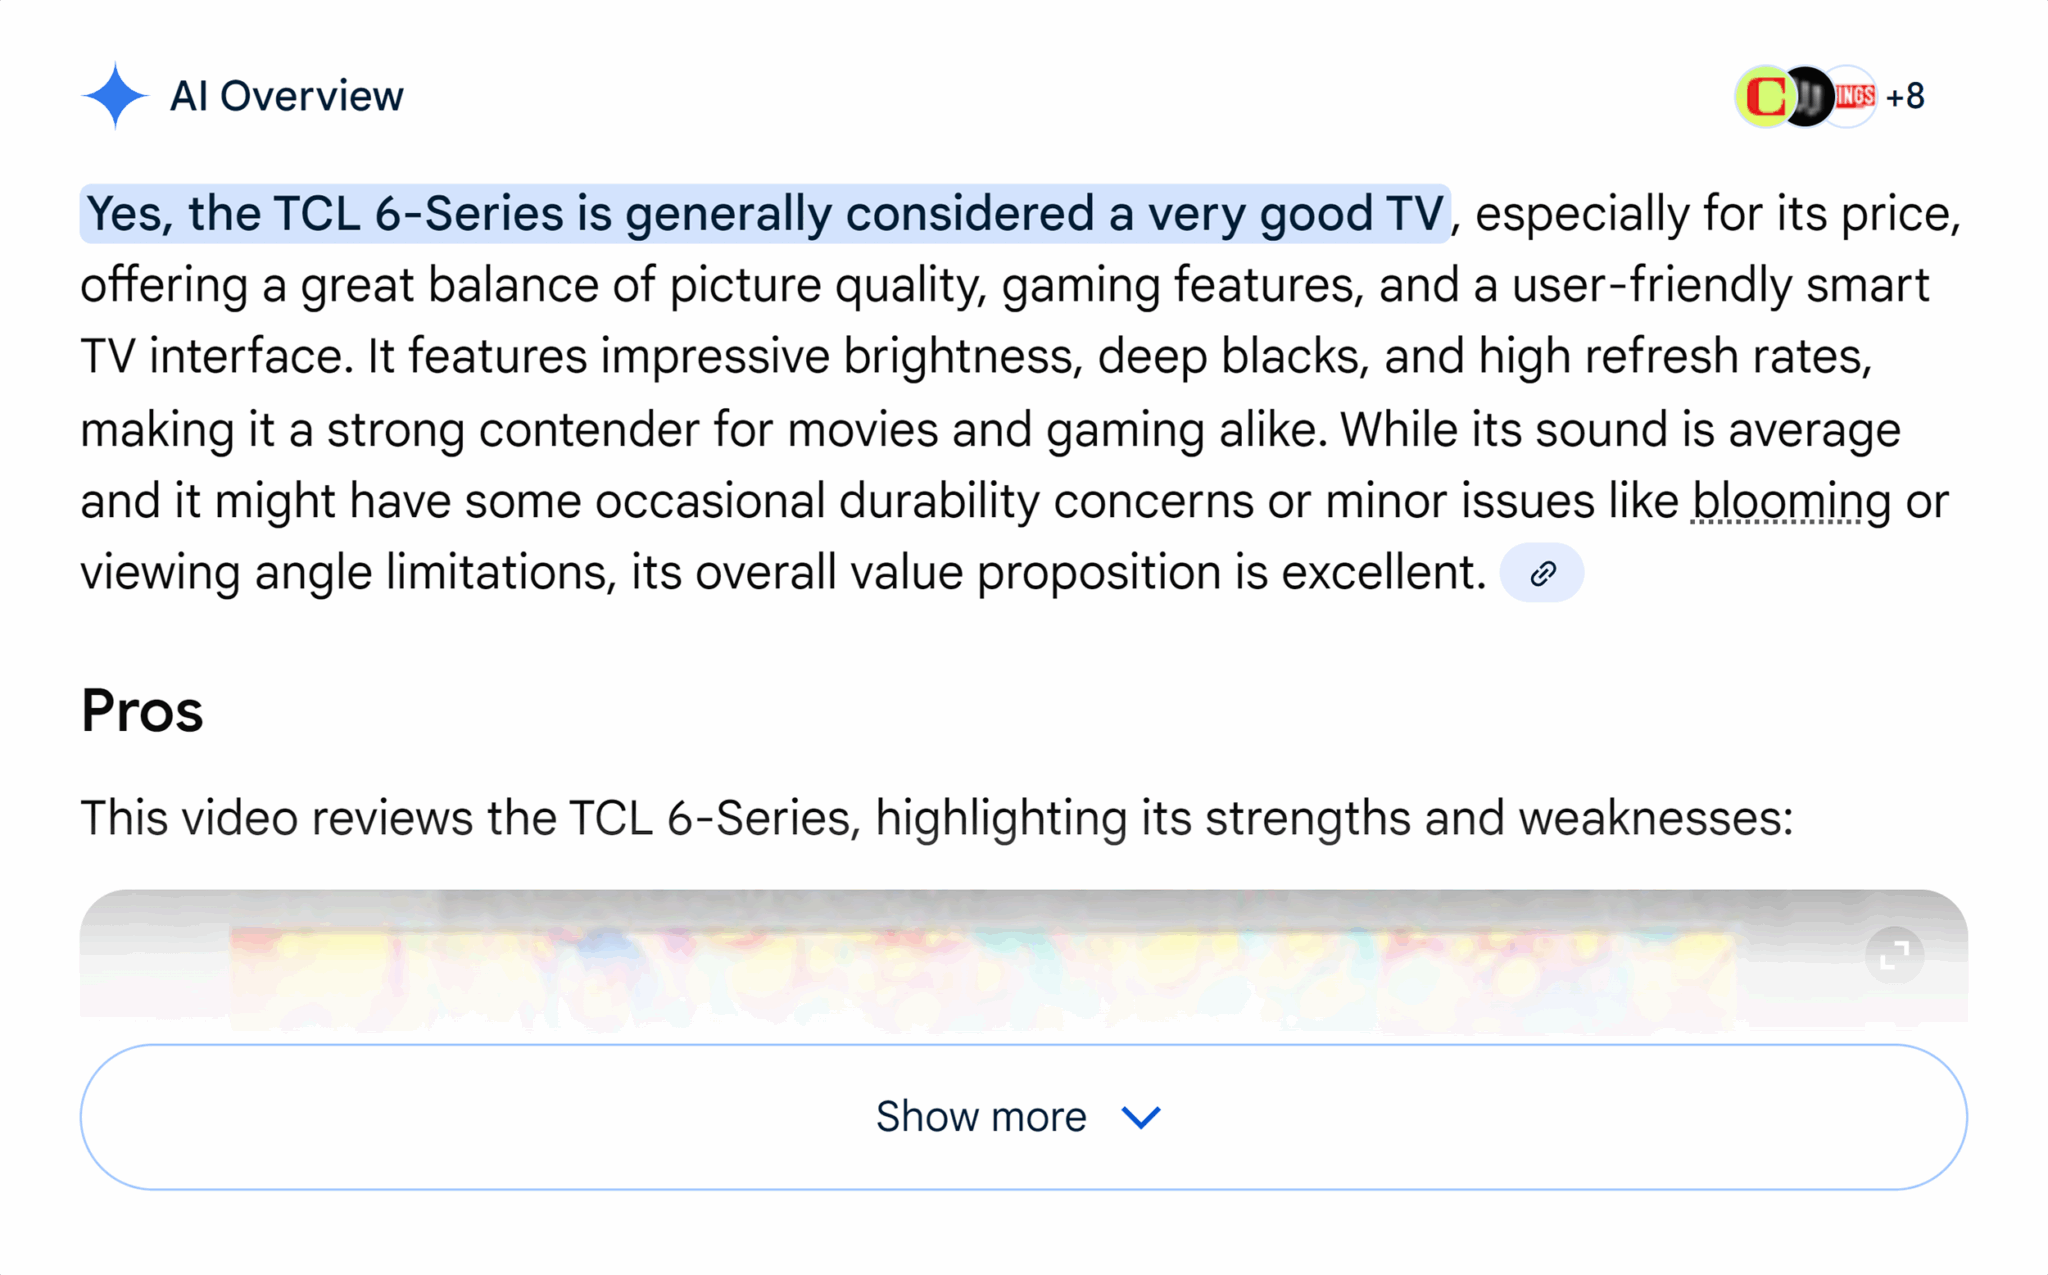
For instance, if I compare LG and TCL, LG’s superior direct traffic and increasing momentum in LLM visibility suggest a tangible AI-driven influence, a possibility I must explore through multi-metric analysis.
Considering various metrics together and identifying shared trends offer insight into how LLM visibility might be affecting my brand’s overall recognition and engagement.
Not Just One Metric: Stitching Together LLM Data Stories
Ultimately, it’s about developing a comprehensive data story from LLM visibility insights. This story goes beyond direct KPIs, utilizing various data sources, such as bounce rates and organic traffic, to add depth and relevance to the narrative. Every piece of performance-focused data stands as testimony to the expertise we can bring to LLM visibility.
Total LLM visibility data, when creatively amalgamated with performance data, can transform insights into actionable strategies that align with pragmatic business objectives, showcasing our value in the AI-driven landscape.
When a client asks why ChatGPT names a competitor instead of them, a screenshot is not an AEO service. You need to reproduce the result, distinguish a real visibility problem from prompt-level noise, identify an intervention, and show what changed afterward.
Profound’s expansion raises the bar for agency value
Starter and Growth plans change the commercial baseline. A business can approach AEO as a direct software purchase rather than assuming it must begin with a large consulting engagement. That does not remove the need for agencies. It removes the weakest version of the agency offer: charging mainly for access, exports, and screenshots.
Your defensible value now sits in the work around the platform:
Translating the client’s buying journey into questions that real prospects might ask.
Separating category, comparison, validation, risk, and brand-specific questions instead of blending them into one visibility score.
Explaining whether an unfavorable answer reflects missing content, weak third-party evidence, ambiguous brand information, a reputation issue, or merely one unstable response.
Turning the diagnosis into owned work across content, technical optimization, brand, product marketing, and public relations.
Maintaining an evidence trail that shows what was observed, what changed, and what can reasonably be inferred.
This distinction matters because ChatGPT, Perplexity, and Google AI Overviews are separate answer surfaces. They can interpret the same question differently, draw on different evidence, and present brands in different ways. Do not collapse their outputs into a single percentage unless you can explain the weighting and why that weighting matches the client’s market.
Keep the underlying observations separate. Record the engine, exact question, answer, citations, competitors mentioned, brand description, and collection date. You can create an executive summary later, but the summary should remain traceable to those observations.
Also keep three signals distinct. A citation means an answer used or exposed a source. A mention means the brand appeared. A recommendation means the answer positioned the brand as a suitable choice. Treating those events as interchangeable makes a report look cleaner while making it less useful.
Design separate pitch and delivery workflows
Agency Mode can reduce the setup friction around multiple brands, but an on-demand environment is only a container. Your methodology still determines whether that container becomes a repeatable service or a collection of unrelated prompts.
Use the pitch environment to establish whether a problem exists
A pitch audit should be narrow enough to complete without pretending it is a full strategy. Its job is to establish whether the prospect has a material, actionable AI-discovery gap.
Define the decision before collecting answers. Write one sentence describing what the audit must help the prospect decide, such as whether to commission a full diagnostic or which product category deserves deeper analysis.
Choose questions by intent. Include category discovery, direct comparison, evidence-seeking, objection, and branded questions. Do not select only prompts that are likely to produce a dramatic competitor comparison.
Freeze the wording used for the audit. Small wording changes can alter an answer. Store the exact prompt rather than a shortened label such as “best tools.”
Create an evidence ledger. For every observation, capture the answer surface, prompt, output, citations, brand status, competitor status, and collection date. Preserve the evidence behind every slide.
End with decisions, not a visibility score. State which gaps appear actionable, what remains uncertain, and what a full engagement would need to investigate.
A pitch finding should sound like this: the brand was absent from a group of comparison questions while named competitors appeared with third-party support, so the next step is to examine the evidence those answers relied on. It should not sound like this: the brand has poor AEO and needs an open-ended retainer. The first statement is bounded by evidence. The second turns a sample into a diagnosis.
Give the client environment delivery-grade governance
Once a prospect becomes a client, do not continue the pitch setup casually and call it production-ready. Convert it through a defined handoff. A full brand setup needs:
An approved list of brand names, products, former names, abbreviations, and commonly confused entities.
A scope statement covering markets, languages, audiences, product lines, and excluded areas.
A governed prompt library divided into stable monitoring questions and temporary exploratory questions.
Rules for selecting competitors, so the comparison set does not change whenever a surprising answer appears.
An evidence archive connected to each reported finding.
An action register with a diagnosis, owner, dependency, expected signal, and implementation status.
A change log linking live content, technical, reputation, or distribution work to later observations.
A reporting definition for presence, citation, recommendation, accuracy, and sentiment or positioning.
The reusable asset is the structure, not the client’s assumptions. Reuse fields, classifications, quality checks, and reporting logic. Do not reuse another brand’s competitors, prompt wording, market boundaries, or definition of success.
This is where Agency Mode can support real scale. Faster environment creation is valuable only if each new environment inherits a sound operating method and remains isolated from unrelated client context.
Sell a decision ladder instead of a dashboard
An agency offer becomes easier to buy when each stage answers a different question. It also becomes easier to deliver because the team knows where an engagement ends and what evidence is required before it expands.
Service stage
Client decision
Required evidence
Primary deliverable
Pitch audit
Is there an AEO problem worth investigating?
A bounded sample of buyer questions with preserved outputs and citations
An evidence-backed opportunity brief with clear uncertainties
Baseline diagnostic
Where is the brand underrepresented, misrepresented, or weakly supported?
A governed question set, competitor rules, source patterns, and brand-position analysis
A prioritized backlog tied to specific visibility problems
Implementation program
Which changes should go live, and who owns them?
Approved recommendations, dependencies, owners, and measurement criteria
Published improvements plus a complete change log
Managed AEO program
Is representation changing, and does it support a business objective?
Repeated observations gathered consistently and connected to available business data
Trend analysis, experiment decisions, and the next prioritized actions
This ladder prevents two common scope failures. The first is giving away a full diagnostic under the label of a pitch audit. The second is selling recurring monitoring without responsibility for deciding or implementing what happens next.
Clients with direct access to an entry plan can already inspect outputs. The agency must therefore define what its fee covers beyond software: research design, validation, interpretation, implementation, governance, cross-team coordination, and outcome analysis. Put those responsibilities in the scope rather than leaving the client to infer them.
Three commercial boundaries should remain explicit:
Platform access is not an outcome. A subscription can provide observations, but it cannot guarantee that an answer engine will mention or recommend a brand.
An audit is not implementation. State whether your team will publish changes, advise the client’s team, coordinate other specialists, or stop after prioritization.
AI visibility is not conversion. A stronger presence may support discovery, but it should not be presented as revenue unless the measurement chain reaches a defensible business event.
Before setting fees, verify the plan limits and operating costs that apply to the agency’s actual account. Model the staff time required for prompt governance, evidence review, client communication, and implementation. A tool can reduce setup effort without removing the expensive judgment work.
Measure performance without pretending attribution is solved
Profound’s G2 partnership points toward a performance-oriented view of AI search. That direction is commercially important, but the existence of a partnership does not by itself establish closed-loop attribution. An agency still needs to show exactly how an observation becomes a business claim.
Use an evidence chain that a client can audit:
Observation: preserve the exact question, answer surface, output, citations, and collection date.
Classification: mark whether the brand was absent, mentioned, cited, described accurately, compared, or recommended. Keep the raw output available.
Diagnosis: explain the likely mechanism and label it as a hypothesis until supporting evidence exists. An absent brand mention does not automatically prove a content problem.
Intervention: record the content, technical, entity, reputation, or distribution change that went live, along with its owner and completion status.
Leading response: repeat the governed observation process and report changes in presence, citation, accuracy, or positioning without claiming that the intervention was the sole cause.
Business evidence: connect the work to qualified traffic, leads, pipeline, sales, or another agreed outcome only where analytics or customer data supports that connection.
This chain protects the client and the agency from an attractive but misleading shortcut: turning a visibility movement into a revenue claim. Keep visibility, influence, and outcome as separate reporting layers.
Visibility asks whether and how the brand appeared.
Influence asks whether the representation could help or hinder a buyer’s evaluation. Unless user behavior is observed, this remains an interpretation rather than a measured action.
Outcome requires an observable business event connected through available analytics, CRM, commerce, or customer evidence.
AI answers can vary even when a prompt does not. That makes reproducibility a method rather than a promise that every run will match. Preserve wording, keep market and language settings consistent where possible, document collection conditions, and look for patterns across the governed question set. Do not conceal variation by selecting only the output that supports the preferred story.
Before expanding Profound across an agency, verify the operational details in the current product, account, and contract:
Which answer surfaces, markets, and languages are supported for the work you intend to sell?
What limits apply to brands, environments, users, prompts, or usage?
How do roles and permissions prevent unwanted access across client teams?
Can raw evidence, reports, and historical data be exported in a usable form?
What happens to a pitch environment when the prospect becomes a client?
How are metrics defined, and can your team inspect the observations beneath an aggregate score?
What data is retained, for how long, and under which controls?
What does the G2 partnership enable in practice, and which attribution steps still require the agency’s own data?
These are not edge-case procurement questions. Their answers determine your delivery capacity, evidence quality, client confidentiality, margin, and ability to change platforms later.
Key takeaways
Profound’s broader plans make software access easier, so agencies need to compete on methodology, interpretation, implementation, and governance.
Agency Mode is most useful when pitch audits and full client programs follow separate, documented workflows.
Build offers as a decision ladder: pitch audit, baseline diagnostic, implementation, and managed optimization should answer different client questions.
Do not merge citations, mentions, recommendations, and business outcomes into a single visibility claim.
Treat performance attribution as an evidence chain, and verify exactly what the platform and G2 partnership contribute before promising it to clients.
Your next move is to run the operating model on one suitable prospect or existing client. Define the decision first, build the evidence ledger before collecting answers, and require every finding to lead to an owned action or an explicit uncertainty. That dry run will expose weaknesses in your scope, handoff, measurement, and margins before you multiply them across more brand environments.