Tag: AI Traffic

  • How Bot Traffic Changes AI Search Visibility Measurement

    How Bot Traffic Changes AI Search Visibility Measurement

    AI is changing web visibility in two directions at once: answer systems can influence buyers without sending a visit, while automated agents can generate large volumes of requests without producing human attention. The result is a widening gap between what traffic logs record and what marketing teams actually need to understand.

    Bringing these developments together reveals a practical lesson: request volume, human engagement, and market influence must be measured as separate layers. A useful visibility model then reconnects those layers without treating any single signal as proof of AI-driven demand.

    More web requests do not necessarily mean a larger audience

    The clearest warning against equating traffic with attention comes from the bot data. The CrushPress.AI article on automated web requests reports, based on figures shared by Cloudflare CEO Matthew Prince, that bots accounted for 57.3% of global HTTP requests for HTML content, compared with 42.7% from humans. It also says this crossed a threshold Prince had predicted during SXSW would be reached by early 2027.

    Those percentages describe requests, not unique visitors, reading time, purchasing intent, or revenue. That distinction becomes especially important in an agentic browsing environment. As the article explains, a person shopping online might inspect a small number of pages, whereas an AI agent could request thousands while researching on the person’s behalf. The activity is real at the infrastructure level, but it does not create thousands of human opportunities to view advertising or engage with a page.

    This creates a measurement paradox. A site can receive more machine activity while seeing little corresponding improvement in human sessions or commercial outcomes. Publishers and brands therefore need to classify automated requests before using raw traffic trends to judge reach, content performance, or audience growth.

    AI can create influence while removing the observable visit

    The attribution problem is the mirror image of the bot-traffic problem. Automated systems may produce requests that overstate apparent audience activity, yet AI-generated answers may also create genuine brand influence that website analytics fail to capture.

    The CrushPress.AI article on AI search visibility describes prospects using tools such as ChatGPT or Google’s AI Overviews to discover vendors, compare alternatives, and form a shortlist before visiting any company website. A brand can appear in recommendations, comparisons, citations, or generated responses throughout that research. If the prospect later arrives through a branded query or a direct visit, conventional analytics may record only that final, deceptively simple step.

    This extends the zero-click pattern already associated with search features such as snippets, knowledge panels, and local packs. Generative answers can compress more of the research process into the search or assistant interface, making the missing click more consequential: discovery and evaluation can both occur before the measurable session begins.

    The combined implication is that low referral traffic does not necessarily mean low AI influence, just as high request volume does not necessarily mean high human interest. One metric can undercount the role of AI in a buying journey while another can overstate the audience that AI activity represents.

    A layered measurement model separates activity from impact

    Three connected transparent layers depict automated requests, human engagement, and broader influence as separate forms of measurement.

    A more useful model starts by distinguishing three questions. The first is whether machines are accessing the site. The second is whether people are arriving and engaging. The third is whether AI systems are shaping awareness or consideration before those visits. Keeping the questions separate prevents request logs, referral reports, and brand indicators from being collapsed into a single ambiguous traffic number.

    At the machine-activity layer, teams can examine bot identification and request patterns to determine how much recorded activity is automated. This layer helps explain infrastructure demand and content access, but it should not be presented as audience reach without supporting evidence of human engagement.

    At the human-behavior layer, traditional analytics remain useful for sessions, engagement, assisted conversions, and conversion paths. The AI search visibility article specifically identifies assisted conversions as a way to detect channels that contributed before the final interaction. These reports remain incomplete when an AI exposure sends no detectable referral, but they still show how observable touchpoints work together.

    At the influence layer, the same article proposes watching branded search growth, direct traffic trends, and brand appearances within AI prompts and recommendations. None is conclusive alone. Branded searches can have several causes, direct traffic is an imprecise category, and an AI mention does not prove that it affected a purchase. Read together over time, however, these signals can support a more credible account of how awareness and consideration are developing.

    The strongest interpretation comes from convergence. Repeated AI visibility followed by growth in branded demand, relevant human engagement, and assisted or completed conversions presents a more meaningful pattern than any isolated spike. This is an inference framework rather than person-level attribution: it indicates probable influence without claiming to reconstruct every buyer’s path.

    Key takeaways

    • Bot request share measures automated access, not the size or quality of a human audience.
    • AI-generated answers can influence discovery and vendor evaluation without producing a referral click.
    • Direct visits and branded searches may be downstream signs of earlier AI exposure, but neither proves causation by itself.
    • AI visibility measurement should combine machine-activity data, human engagement, conversion evidence, and brand-demand signals.
    • Trends that move together are more informative than a single traffic, mention, or attribution metric.

    Visibility strategy must serve machines and people differently

    An abstract AI agent and a person access the same central web content through different structured and visual pathways.

    The growth of automated access gives brands a reason to make content clear, authoritative, and interpretable by AI systems, as the bot-traffic article argues. But machine readability is not an end in itself. The commercial objective is still to help a person discover, evaluate, trust, and eventually choose the brand.

    Reporting should reflect that distinction. Bot requests belong in an access and infrastructure view; human sessions belong in an engagement view; AI mentions and branded-demand indicators belong in an influence view; conversions remain the outcome view. Connecting these views can reveal useful relationships, but labeling them separately limits false precision.

    As AI agents assume more browsing and answer engines absorb more research, the most resilient measurement programs will track both sides of the exchange: how machines consume content and how people reveal the effects later.

    References

  • How to Measure AI Search Visibility, Traffic, and Value

    How to Measure AI Search Visibility, Traffic, and Value

    You can see organic impressions rising, spot visits from an AI assistant, and still have no defensible answer when someone asks whether AI search is helping the business. The problem is rarely missing data. It is treating visibility, visits, and outcomes as if they were the same thing.

    You need an evidence chain. Search Console shows where discovery may be changing. GA4 shows what identifiable visitors do. Google Tag Manager can add section-level context. Used together, they turn an ambiguous channel into something you can manage.

    Key takeaways

    • Measure AI visibility, traffic, engagement, and business outcomes separately.
    • Use Search Console for query and page trends, but do not label every organic change as an AI effect.
    • Use GA4 to evaluate identifiable AI referrals, Google organic landings, engagement, and key events.
    • Use GTM text-fragment tracking as supporting evidence that visitors are arriving at specific passages, not as proof of an AI citation.

    Start with the questions your data can answer

    A useful measurement plan starts with business questions, not a dashboard labeled “AI traffic.” The practical shift is to make AI search part of your broader search program because it can change how people discover and evaluate answers, even when the eventual visit resembles ordinary organic traffic.

    QuestionSignal to inspectPrimary toolDecision it supports
    Are relevant pages becoming easier to discover?Impressions and clicks for stable query groups and landing pagesGoogle Search ConsoleWhether to strengthen topic coverage, answer clarity, or search-result appeal
    Are identifiable AI services sending visits?Sessions grouped by referral source and landing pageGA4Which sources and pages deserve closer attention
    Do those visits show useful engagement?Engagement and navigation after the landing pageGA4Whether the page satisfies the apparent intent and offers a sensible next step
    Are visitors being sent to a particular passage?A text-fragment landing event tied to a stable section labelGTM and GA4Which answer blocks should be maintained, expanded, or connected to deeper content
    Does the activity create business value?Relevant key events or conversions by source and landing pageGA4Whether visibility is contributing to a meaningful outcome

    Keep these signals in separate columns. Search Console clicks and GA4 sessions come from different measurement systems, so forcing them to reconcile can create false confidence. Their job is to corroborate a pattern, not produce an identical total.

    There is another important boundary: an AI-generated answer can expose your brand without producing a click. A traffic-only report misses that possibility. A visibility-only report, meanwhile, cannot tell you whether the exposure helped the business. Your dashboard needs both, with the limitation stated plainly.

    Configure Search Console, GA4, and GTM as one evidence stack

    Three connected measurement instruments represent search discovery, visitor journeys, and section-level event tracking.

    Use Search Console to establish the discovery baseline

    Begin with query-and-page pairs rather than sitewide totals. Group queries by intent, such as branded questions, informational problems, comparisons, and decision-stage searches. Keep each group’s definition stable so a later movement reflects the data rather than a changing filter.

    For every group, retain impressions, clicks, click-through rate, average position, and the landing pages receiving visibility. Add an annotation whenever you materially revise an answer, heading, structured content block, title, or internal link. Compare the same group across consistent reporting windows and check whether the affected pages moved in the expected direction.

    This is evidence of changing search performance, not automatic proof that an AI Overview caused the change. Search Console query analysis can help you investigate the impact of AI-driven discovery, but you still need landing-page and engagement evidence before making a stronger attribution claim.

    Use GA4 to separate arrival from value

    Create a reporting view for recognizable AI-assistant referrals. Maintain the source rule explicitly and record when you change it; otherwise, a larger referral list can masquerade as traffic growth. Report the original source alongside landing page, engagement, useful downstream navigation, and the key event that represents value for your site.

    Keep Google organic traffic in its own segment. A visit that began around an AI feature on a Google results page may still appear as Google organic rather than carry a clean feature label. That makes the landing page, associated Search Console query trend, and on-page behavior more useful than the channel name alone.

    Choose outcomes that match the page’s purpose. A documentation page may be expected to lead to another help resource. A commercial page may be expected to produce a qualified inquiry or purchase-related action. If you apply the same conversion expectation to every content type, useful informational visits can look like failures and weak commercial visits can look healthier than they are.

    Add section-level context with text fragments

    Text fragments can open a page at a specific passage. GTM can detect that kind of landing and send a custom event to GA4. Use a clear event name, attach the page path and a stable section identifier, and classify the referrer when it is available.

    Do not send the literal highlighted text as an analytics parameter. It can create noisy, high-cardinality data and may capture words you do not want stored. Map the arrival to a controlled label such as the section’s internal identifier instead.

    Test the trigger in GTM preview mode, confirm the event in GA4’s debugging view, and then verify that the live event carries the expected page and section labels. A text-fragment event only tells you that a targeted passage was opened. Treat it as corroborating evidence when it aligns with query visibility, a plausible referrer, and meaningful behavior.

    Read patterns without claiming more than the data proves

    Visibility rises while clicks stay flat

    Your page may be appearing for more searches without giving people a reason to continue. It may also be losing clicks for reasons unrelated to AI. Inspect the affected queries and search results before changing the page. If the page already answers the immediate question, make the next value clear: a decision framework, working example, template, calculator, or deeper explanation. Do not weaken the answer merely to manufacture a click.

    Traffic rises while useful outcomes stay flat

    Check whether the landing page matches the intent implied by its query or referral context. Then inspect the path after arrival. A strong answer with no relevant next step can earn attention without moving the visitor forward. Add a specific internal link or call to action beside the passage that resolves the initial question, and measure that action separately from generic page engagement.

    Text-fragment arrivals concentrate on one section

    Treat that section as a content asset. Give it a descriptive heading, keep its central answer self-contained, remove references that make no sense out of context, and place the most relevant deeper resource nearby. Watch whether later edits preserve fragment arrivals and downstream behavior. The event is a prioritization signal, not proof that every visit came from an AI answer.

    AI referrals appear without a matching Search Console change

    The visits may originate outside Google, or your referral grouping may be too broad. Validate the source values and landing pages before connecting the movement to search visibility. If the visits are legitimate, evaluate their behavior on their own terms rather than expecting Search Console to explain a different discovery surface.

    Turn the dashboard into an optimization workflow

    An analyst reviews an abstract dashboard beside a circular sequence of investigation, optimization, testing, and measurement steps.

    For each priority query group and landing-page family, record the visibility signal, arrival signal, engagement signal, business outcome, material content change, interpretation, confidence, and next action. This format forces you to distinguish an observation from an explanation.

    A defensible note might say that impressions increased after an answer block was revised, while clicks and qualified actions did not move in the same direction. That supports further inspection of search-result appeal and the page’s next step. It does not support a claim that AI visibility generated revenue.

    Use the weakest part of the chain to choose the work. Weak discovery calls for better intent coverage and clearer answer structure. Strong visibility with weak arrival calls for a more compelling continuation. Strong arrival with weak outcomes calls for closer intent alignment and a better next action. Concentrated fragment landings call for maintaining and extending the section people are being sent to.

    Start with your highest-priority query cluster and its landing-page family. Establish the baseline, confirm the instrumentation, annotate the next meaningful change, and wait for the full evidence chain before declaring success. You will get a smaller headline than an all-purpose “AI traffic” number, but a far more useful decision.

    References

  • How to Prepare Your SEO Strategy for Google’s Agentic Search

    How to Prepare Your SEO Strategy for Google’s Agentic Search

    If your organic traffic depends on Google sending a click for every useful answer, you have a planning problem. Search is becoming more capable of explaining options, narrowing choices and helping people act without following the familiar results-page journey.

    You don’t need to abandon SEO or guess at an entirely new playbook. You need to make your content easier for people and machines to understand, verify and use, then measure the business outcomes that remain after clicks become less predictable.

    Plan for a task layer, not just a results page

    The important change isn’t simply that Google can generate longer answers. Google’s stated direction brings Search, Gemini and agentic tools toward a more unified product capable of assisting with end-to-end tasks. An agent might help someone investigate a problem, compare possible solutions and take the next step within one continuous interaction.

    Treat that as a direction of travel, not a finished product or a release schedule. Your practical response is to examine the jobs your pages help visitors complete. A page that merely attracts a broad query is vulnerable when an AI interface can satisfy that query directly. A page that supplies distinctive evidence, decision criteria, current business information or a useful action remains relevant to a deeper journey.

    Start with your highest-value landing pages. Write down the decision each one supports and the action a qualified visitor should take next. If you can’t name either, the page probably has an unclear role. Tighten it before producing more content around the same keyword.

    Google continues to describe the open web as part of its search experience, even while acknowledging that some clicks may disappear. That combination should shape your strategy: stay accessible to discovery systems, but stop treating a click as the only proof that your information created value.

    Build pages around decisions an agent can support

    An abstract AI assistant compares several unlabeled options using visual symbols for evidence, timing, location and trust while a person observes.

    Traditional keyword planning often stops after identifying what someone types. Agentic search requires a fuller model: what is the person trying to decide, what facts would change that decision, and what could prevent the next action?

    Answer the immediate question without ending the journey

    Put a direct answer near the point where the question appears. Then add the conditions that make the answer vary. If you sell a service, that may include who it fits, who it doesn’t fit, what inputs affect price, what preparation is required and what happens after an inquiry. If you publish educational content, show how readers can apply the answer and recognize when another option is better.

    This gives an answer system a clear passage to interpret while giving a serious buyer reasons to continue. It also prevents a common failure: producing a concise answer that is technically extractable but too generic to establish why your brand deserves consideration.

    Expose the comparison criteria

    People rarely need more adjectives. They need dimensions they can compare. Replace claims such as “flexible,” “advanced” or “best for growing teams” with the facts behind them: compatible use cases, constraints, required inputs, available service areas, purchasing conditions and the tradeoffs between options.

    Use consistent labels across related pages. If one page calls an offering a plan, another calls it a package and a third treats it as a product, you create unnecessary ambiguity. A stable vocabulary helps readers compare choices and gives automated systems a clearer entity model.

    Make the next action explicit

    Inspect every conversion path from the perspective of someone who has already received a competent summary elsewhere. That person may arrive ready to verify one detail and act. Put eligibility, availability, price structure, required information and the next step where they can be found without restarting the entire education journey.

    Use descriptive action labels. “Check availability,” “request an assessment” or “compare plans” communicates more than “learn more.” Keep the destination aligned with the promise. An AI-assisted journey will not rescue a vague form, missing terms or a landing page that changes the subject.

    Make your meaning verifiable with content and schema

    A cutaway model shows visible webpage content aligned with an organized network of structured data and supporting evidence beneath it.

    Schema is useful when it expresses facts that are already clear on the page. It isn’t a substitute for missing information, and it doesn’t guarantee inclusion in an AI response. Think of JSON-LD as a machine-readable agreement with your visible content.

    Choose schema types that match the actual entity and page purpose, such as Organization, Person, Product, Service or Article. Connect entities consistently. Names, URLs, authorship, offers and other properties should agree with what a visitor sees. If the business changes a price, service name or availability condition, update both the page and its markup as one publishing task.

    Don’t add FAQ markup simply because question-shaped text looks attractive for search. Use it only when the page contains a genuine visible FAQ, and make every marked answer match the displayed answer. The same rule applies to reviews, offers and organizational details: describe what exists rather than decorating the page with attributes you hope a system will infer.

    Verification also happens in the prose. Show who created or reviewed consequential content. State the basis for recommendations. Identify where a claim applies and where it doesn’t. Keep time-sensitive facts maintained. Link related pages through meaningful relationships instead of publishing disconnected variations of the same target phrase.

    Finally, test the rendered page and the generated markup. A valid JSON-LD block can still describe the wrong entity, preserve an old value or conflict with visible copy. Your quality check should ask two separate questions: does the syntax work, and is the meaning accurate?

    Measure qualified outcomes when raw clicks decline

    Google has framed some disappearing traffic as low-quality or bounce-prone traffic. Treat that as a hypothesis to test in your own data, not permission to ignore falling visits.

    Segment performance by landing-page purpose and query intent. Separate broad informational discovery from product evaluation, branded navigation and action-oriented visits. Then compare impressions, visits, meaningful engagement, leads, sales, subscriptions and retained customer value where those measures apply. A smaller audience can be healthy if the lost visitors never progressed. It is a warning if qualified demand, revenue or brand discovery falls with it.

    Watch for mismatched signals. Stable visibility with fewer visits may indicate that answers are being consumed before the click. Stable traffic with weaker conversion may point to a page or offer problem. Falling non-branded discovery alongside stable branded demand may mean your existing audience still finds you while new prospects do not. Each pattern calls for a different response.

    Publishers should also decide which relationships they want to own. Google has highlighted support for subscription-oriented experiences as publishers adapt to changing traffic patterns. A subscription can be part of that response, but only when you offer recurring value worth returning for. Email, saved tools, accounts, communities and customer data can serve the same strategic purpose: turning rented discovery into a direct relationship.

    Annotate major content, template, schema and conversion changes so you can connect movement to a plausible cause. Don’t combine every AI-related metric into one visibility score. Keep enough detail to see whether you are being discovered, selected, visited and trusted to complete a business action.

    Key takeaways

    • Audit important pages by the decision and next action they support, not only by the keyword they rank for.
    • Give direct answers, then add constraints, comparisons and evidence that make your contribution distinctive.
    • Keep visible facts and JSON-LD aligned; valid syntax cannot repair inaccurate meaning.
    • Make conversion paths usable for visitors who arrive late in the journey and are ready to verify or act.
    • Measure qualified demand and owned relationships alongside traffic so fewer clicks don’t automatically produce the wrong conclusion.

    Your next move is small but consequential: choose one commercially important page, define the decision it helps a visitor make, correct its facts and schema, and remove friction from the next action. That work remains useful whether Google sends a traditional result, generates an answer or introduces an agent into the journey.

    References

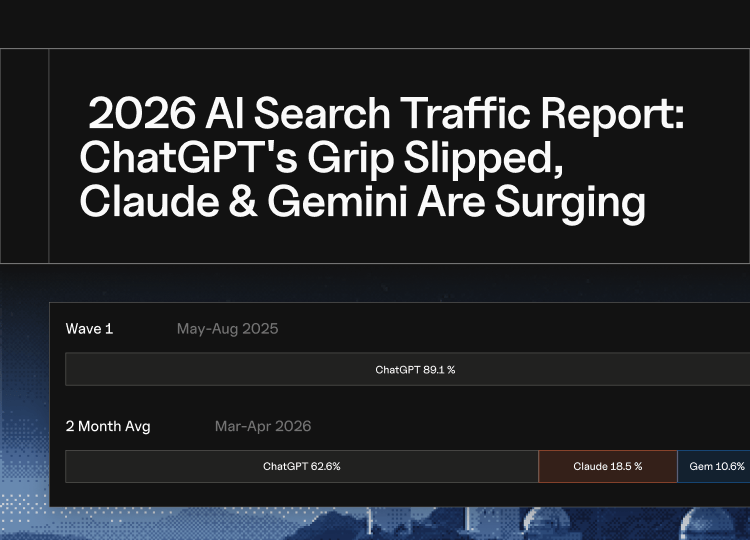
  • 2026 AI Traffic Insights: ChatGPT Fades as Claude & Gemini Rise

    2026 AI Traffic Insights: ChatGPT Fades as Claude & Gemini Rise

    I’ve just delved into Goodie’s enlightening AI search traffic report for early 2026, covering the period from January to April, and I’m excited to share my insights with you. This report dives into trends in usership, referral traffic, and marketing considerations, offering a comprehensive view of the shifting landscape.

    You’ll want to pay particular attention to how ChatGPT’s dominance is starting to wane, with some surprising contenders like Claude and Gemini making waves. This shift could significantly impact how marketers strategize their efforts in AI-driven search optimization.

    The data reveals fascinating patterns in user habits and referral traffic, which could inform future marketing strategies and the allocation of resources. For a full dive into these emerging trends and what they might mean for businesses, I encourage you to explore the detailed findings of the report.


    Inspired by this post on HiGoodie Blog.


    crushpress.ai community screenshot
  • How to Measure AI Discovery Traffic for B2B Pipeline Growth

    How to Measure AI Discovery Traffic for B2B Pipeline Growth

    You can see buyers using ChatGPT, Claude and Gemini to research vendors, yet your pipeline report may still reduce the result to organic, referral or direct traffic. If you cannot connect that activity to qualified demand, you cannot tell whether AI discovery deserves more investment or merely produces interesting charts.

    The practical answer is not a single AI metric. Build an evidence chain from visibility, to an identifiable site visit, to an onsite action, to an opportunity. Google Analytics can now cover the middle of that chain more cleanly. Your CRM, LinkedIn activity and measurement rules must cover the rest.

    Measure three layers instead of one AI traffic number

    Three connected translucent layers depict AI visibility signals, a website session and a conversion path leading to business account and opportunity nodes.

    AI discovery is not the same thing as AI referral traffic. A buyer can encounter your brand in an assistant without clicking, visit through an identifiable assistant link, or return later through another channel. Those behaviors create different evidence and should not be combined under one label.

    Measurement layerEvidence you can recordDecision it supports
    Discovery visibilityYour company, product or page appears for a controlled set of buyer questionsWhether assistants associate your brand with the right problem and category
    Identifiable trafficA supported assistant sends a visit that Google Analytics recognizesWhich assistants and cited pages generate site demand
    Business outcomeThe visitor completes a qualified action and the lead or account advancesWhether AI discovery contributes to pipeline, not just sessions

    For visibility, maintain a fixed set of questions that reflect how a buyer researches your category. Record the assistant, exact prompt, date, brands mentioned, cited URLs and whether your brand appears in the answer or only in a citation. Keep the prompt wording and access conditions consistent when you repeat the check. The result is an observation, not a universal ranking, because assistant outputs can vary.

    For traffic, use the native AI classification in Google Analytics. For business outcomes, use your existing definitions of a qualified action, lead, opportunity and revenue. This division prevents a common reporting error: treating a mention, a visit and a sale as interchangeable proof of success.

    Build a GA4 view your revenue team can trust

    Google Analytics now identifies supported assistant referrals automatically. Recognized visits can use the medium ai-assistant, the channel group AI Assistant and the campaign value (ai-assistant). This removes much of the custom filtering previously needed to isolate traffic from supported tools.

    1. Confirm that AI Assistant appears in your acquisition reporting. If it does not, check the date range and whether you have any identifiable assistant referrals before changing channel definitions.
    2. Break the channel down by source and landing page. The channel total tells you the size of the stream; the source shows which supported assistant sent it; the landing page reveals which answers or resources earned the click.
    3. Compare AI Assistant and organic search over the same date range. Use the same qualified actions and conversion definitions for both channels. Otherwise, the comparison answers a reporting question rather than a business question.
    4. Show counts beside rates. A high conversion rate based on a very small number of sessions is useful as an early signal, but it is not yet a dependable forecast.
    5. Keep unidentified traffic unidentified. Do not relabel direct visits as AI traffic merely because AI visibility increased during the same period.

    Your recurring report should include identifiable AI sessions, source, landing page, qualified action count, qualified action rate and any matched opportunities. Add the number of leads that explicitly named an AI assistant even when analytics did not record an AI referral. That last field exposes influence the channel report cannot see without pretending the attribution is certain.

    The pattern matters more than the channel total. If AI traffic is small but converts well, protect the pages earning those visits and expand the buyer questions they answer. If traffic grows while qualified actions remain flat, inspect the landing page promise, offer and next step. More assistant visibility will not repair a page that attracts one intent and presents a call to action for another.

    The AI Assistant channel is a measurement improvement, not complete AI attribution. It covers identifiable referrals from supported assistants. It cannot count an answer that satisfies the buyer without a click, and it cannot automatically recover an AI touch when the buyer returns later through direct traffic, branded search or a different device.

    Connect assistant referrals to leads, accounts and opportunities

    Anonymous referral streams pass through a website gateway and connect in sequence to a lead, a company account and a qualified opportunity.

    B2B attribution becomes difficult after the click because evaluation often continues across sessions and people. Solve that problem with explicit evidence labels rather than a more aggressive attribution claim.

    • Observed AI referral: Google Analytics placed the session in the AI Assistant channel.
    • Self-reported AI discovery: A lead named an assistant when asked how they found the company.
    • AI-influenced opportunity: the account has either form of documented AI evidence before opportunity creation.
    • AI-sourced opportunity: AI discovery met your narrower, written rule for the first known acquisition touch.

    Do not merge these labels. An observed referral has stronger click evidence than an inferred influence, while a self-reported answer can reveal discovery that analytics missed. Both are useful as long as the dashboard preserves the distinction.

    1. Choose the onsite action that represents meaningful intent for your sales motion. It might be a demo request, contact submission, trial start, pricing interaction or another event your team already treats as qualified.
    2. When a visitor becomes a lead, carry permitted acquisition fields into the CRM: original source, current source, landing page, campaign and the date of the qualifying action. Retain the original values rather than overwriting them on every return visit.
    3. Add a short, optional discovery question to the form or sales qualification process. Allow the buyer to name ChatGPT, Claude, Gemini or another route in their own words instead of forcing every answer into a fixed channel list.
    4. Join the evidence at the lead and account levels where your consent and data practices allow it. Account-level reporting matters when one person researches and another submits the form.
    5. Write the attribution rule directly in the dashboard. State which touch qualifies an opportunity as sourced, which touches count only as influenced, and whether the evidence must occur before lead or opportunity creation.

    Track progression as counts and rates: identifiable AI sessions, qualified actions, leads, opportunities and closed revenue. Keep pipeline value beside opportunity count because one large deal can otherwise make a small channel look predictably scalable. For the same reason, do not forecast from conversion rate alone while the denominator remains small.

    This model also gives sales a useful feedback role. When a prospect mentions an assistant, record the assistant, the question they were trying to answer and any page or claim they remember seeing. That information can reveal buyer language, missing content and attribution gaps without turning an anecdote into a performance benchmark.

    Turn LinkedIn activity into a measurable discovery loop

    LinkedIn can strengthen the public evidence around a B2B company, but activity alone is not a growth result. Treat the company page, employee expertise, long-form content and distribution as inputs. Measure assistant visibility, referral traffic and pipeline separately as outputs.

    Remove ambiguity from your company and expert profiles

    Start with factual consistency. Keep the business address, contact details and product descriptions accurate on your website. Update the LinkedIn company page’s About section and services, including relevant industry language. Treat the profiles of executives and active subject-matter experts as extensions of the same entity, with current roles and clear areas of expertise. These are core surfaces for B2B AI discovery work.

    Assign an owner to each surface and update all of them when the company changes a product name, category, service or positioning statement. If your site publishes corresponding organization or product structured data, include it in the same update. Consistency does not guarantee an assistant mention, but it removes avoidable uncertainty about what the company does and who represents it.

    Publish one complete answer for each valuable buyer question

    Use LinkedIn articles and newsletters for questions that require more than a short update. The 800-1,200-word range associated with stronger AEO mentions is a useful starting hypothesis, not a universal ranking requirement. A complete 700-word answer is more useful than 1,000 words padded to satisfy a target.

    Give each long-form asset a specific job:

    • Use the buyer’s question or decision in the headline.
    • Answer it directly near the beginning.
    • Name the product category, intended user and relevant constraints plainly.
    • Explain criteria and tradeoffs that help the buyer make a decision.
    • Link to the corresponding website resource when the reader needs evidence, implementation detail or a next step.
    • Connect the content to an identifiable expert whose profile supports the subject.

    Add campaign parameters to links you control from LinkedIn so you can measure LinkedIn visits accurately. Keep those visits classified as LinkedIn traffic. A tracked LinkedIn click is not an AI referral, even when the content was also designed to improve AI discovery.

    Use engagement thresholds as experiments, not ranking factors

    If your team needs an initial promotion checkpoint, start with at least 10 substantive comments or 60 reactions. These figures can guide a campaign test, but they are not verified causal ranking factors for every LLM. Record them as engagement outcomes, then look independently for changes in assistant mentions, AI Assistant referrals and qualified demand.

    Count comments that contribute a question, example, objection or informed response. A pile of generic replies may increase the visible total without improving the information around the topic. Employee participation, expert partnerships, boosted company updates, Thought Leader Ads and follower ads can expand distribution, but paid and organic exposure should remain separate in your campaign log.

    Test one topic cluster from publication to pipeline

    1. Choose one buyer question tied to a product or service that can create qualified demand.
    2. Record the current website answer, LinkedIn coverage, controlled prompt observations and identifiable AI traffic.
    3. Correct company and expert profile details before publishing, so entity changes and content changes happen in a documented sequence.
    4. Publish the complete website resource and its LinkedIn treatment. Record the URL, author, publication date, distribution method, paid support and engagement.
    5. Watch all three measurement layers through a reporting period appropriate to your traffic volume and sales cycle.
    6. Compare the result with a similar topic cluster you did not change. Treat the difference as directional evidence unless your test design supports a stronger causal conclusion.

    Read breaks in the chain literally. More LinkedIn engagement without more assistant visibility proves distribution, not AI discovery. More assistant visibility without referral growth may mean the answer resolves the question without a click or does not present a useful next step. More AI referrals without qualified actions points to the landing page or intent match. More qualified leads without opportunities points to qualification, offer fit or the sales handoff.

    Key takeaways

    • Measure AI discovery as visibility, identifiable traffic and business outcomes. No single metric covers all three.
    • Use GA4’s AI Assistant channel for recognized referrals from supported assistants, but do not relabel direct traffic to fill attribution gaps.
    • Preserve observed referrals, self-reported discovery, influenced opportunities and sourced opportunities as separate evidence classes.
    • Keep website facts, LinkedIn company details and expert profiles current before trying to scale content distribution.
    • Treat the 800-1,200-word content range and engagement thresholds as test inputs, not universal LLM ranking rules.
    • Scale a topic only after you can follow its path from buyer question to content, assistant visibility, qualified action and pipeline.

    Start with one revenue-relevant buyer question. Establish the baseline, publish a complete answer, track the assistant referral and carry the evidence into your CRM. The first broken link in that chain tells you what to fix next. Repair it before increasing content volume or promotion spend.

    References

  • How to Measure Brand Visibility in AI-Mediated Journeys

    How to Measure Brand Visibility in AI-Mediated Journeys

    You may already be appearing inside AI answers while your organic dashboard says little has changed. Or AI bots may be crawling your site without your brand ever making the shortlist. If you count only clicks, both situations become an attribution mystery.

    You need to separate machine access, brand selection, human handoff, and business outcome. That gives you a measurement system that can locate the weak point in an AI-mediated journey and tell you what to test next.

    Decide what brand visibility means before scoring it

    A visit is no longer the only useful sign that a brand won. Depending on how much of the journey a person delegates, a win can be a click, an AI recommendation, or an action completed by an agent. A single traffic metric cannot represent all three.

    Start by classifying the journey into search, assistive, and agentic modes. These modes can coexist within the same purchase. Someone might discover a category through search, ask an assistant to compare the options, and then let an agent find a qualifying seller. Your measurement should follow that movement instead of assigning the whole journey to its last observable click.

    Journey modeWhat visibility looks likePrimary evidenceCommon misreading
    SearchYour page or brand is presented as an option the user can inspect.Search impressions, result position, clicks, landing sessions, and subsequent actions.Treating a high position as proof that the result influenced a decision.
    AssistiveAn AI answer names, explains, compares, cites, or recommends your brand.Observed mentions, recommendation role, cited URLs, claim accuracy, and answer-engine referrals.Counting an incidental mention as a recommendation.
    AgenticAn agent recruits your brand as an eligible option, selects it, or completes an action through it.Selection records where available, agent referrals, API or commerce events, and confirmed business outcomes.Assuming a bot request means the agent selected your brand.

    Define a qualifying visibility event before collecting data. At minimum, the brand must be correctly identified and relevant to the prompt. Record whether it was merely named, used as supporting evidence, included in a shortlist, explicitly recommended, or selected for action. Those roles have different commercial meaning.

    Set an eligibility rule for the denominator as well. A prompt belongs in your visibility rate only if your brand could reasonably satisfy the stated need, market, audience, and constraints. Including irrelevant prompts depresses the score. Excluding difficult but commercially important prompts inflates it.

    Measure each layer from machine access to business outcome

    Four connected transparent chambers depict machine access, AI selection, human handoff, and a business outcome, with observation points between them.

    AI visibility is a sequence, not an isolated mention. A useful diagnostic model follows ten gates: discovered, selected, crawled, rendered, indexed, annotated, recruited, grounded, displayed, and won. The early gates make your information available to machines. The later gates determine whether the system can understand, use, present, and act on it.

    You will not observe every gate directly. Server logs can show that a crawler requested a URL, but they cannot prove that the page was indexed, understood correctly, or used in a response. A citation can show that a URL supported an answer, but it does not reveal every internal retrieval or ranking decision. Label each measurement as observed or inferred so your dashboard does not manufacture certainty.

    Measurement layerQuestion it answersUseful measuresWhat it does not prove
    Machine accessCan qualifying bots reach and process the pages that matter?Priority URLs requested, response status, rendered content availability, repeat access, and crawler identity confidence.That the information was indexed, trusted, or selected.
    Entity understandingDoes the answer associate your brand with the correct category, products, locations, capabilities, and constraints?Entity accuracy, attribute accuracy, category association, and contradiction frequency.That the brand will be recruited for a particular decision.
    Recruitment and groundingDoes the system use your brand or content when constructing an answer?Qualifying mention rate, citation rate, cited-page coverage, claim usage, and competitor co-mentions.That the user saw a meaningful recommendation.
    PresentationHow is the brand shown to the user?Recommendation rate, shortlist inclusion, order when a genuine ranking exists, description, caveats, and next action offered.That the user followed the recommendation.
    Handoff and outcomeDid the journey reach your property or produce a business event?Answer-engine referrals, engaged sessions, leads, account creation, purchases, bookings, and other confirmed outcomes.That one observed AI answer caused the outcome.

    Keep these layers separate before creating any composite score. A blended score can rise because crawler activity increased even while recommendation visibility fell. That looks like progress until you inspect the components.

    Use a small metric dictionary so everyone calculates the same thing:

    • Qualifying mention rate: eligible prompt runs containing a valid brand mention divided by all eligible prompt runs.
    • Recommendation rate: eligible prompt runs in which the brand is positively recruited as an option divided by all eligible prompt runs.
    • Citation rate: eligible prompt runs citing an owned or controlled page divided by all eligible prompt runs. Report third-party citations separately.
    • Claim accuracy rate: checked brand claims that are materially correct divided by all checked brand claims.
    • Priority-page bot coverage: priority URLs receiving a qualifying bot request divided by all URLs in the defined priority set.
    • AI referral engagement rate: qualifying answer-engine sessions that complete your chosen engagement event divided by all qualifying answer-engine sessions.
    • AI-attributed outcome rate: confirmed outcomes with an observable AI referral or another declared attribution signal divided by the applicable set of outcomes.

    Always display the numerator and denominator next to each rate. A clean percentage built from a tiny or changing prompt set is less informative than a modest rate calculated from a stable, representative panel.

    Build a prompt panel around real decisions

    A prompt tracker is useful only when its prompts resemble the decisions your audience delegates. A list of branded questions will tell you whether an engine can repeat known facts about you. It will not tell you whether the brand is discoverable when the user has not chosen it yet.

    Build the panel from intent and constraints:

    1. Map the decisions. Include discovery, comparison, validation, troubleshooting, and action-oriented needs. Connect each need to a product line, audience, market, or journey stage.
    2. Add realistic constraints. Use the factors that can change eligibility, such as use case, compatibility, location, availability, delivery requirement, organizational size, or risk tolerance. Do not add a constraint merely to make the prompt longer.
    3. Balance non-branded and branded prompts. Non-branded prompts measure discovery and recruitment. Branded prompts measure entity understanding, accuracy, and competitive positioning.
    4. Define matching rules. List the canonical brand name, legitimate variants, product names, and exclusions that could create false positives. Decide how acquisitions, resellers, and similarly named entities will be handled before scoring begins.
    5. Fix the test conditions. Preserve the prompt wording, engine, model label, account state, location, language, and personalization state when those variables are available. Record any condition you cannot control.
    6. Review the full answer. A string match cannot tell whether the brand was recommended, dismissed, confused with another entity, or mentioned only inside a citation title.

    Useful prompt templates include:

    • What are suitable ways to solve [problem] for [audience or situation]?
    • Which providers meet [requirement] and [constraint]?
    • Compare options for [use case], especially [decision factor].
    • Is [brand or product] suitable for [specific scenario]?
    • Find an option for [need] that can satisfy [action constraint].

    Do not average every prompt into one headline number. Segment results by intent, journey mode, market, product, and engine. A brand can be highly visible in informational answers yet absent when the prompt moves to comparison or action. That boundary is where the commercial problem usually becomes diagnosable.

    For every run, capture the prompt ID, intent cluster, test conditions, brand presence, mention role, recommendation strength, cited domains, cited URLs, claims made, claim accuracy, competitors named, caveats, and proposed next action. Preserve the answer itself when your governance rules permit it. Otherwise, retain a structured review and enough metadata to reproduce the test.

    Model outputs can vary with wording, context, model changes, and personalization. Treat an individual answer as an observation, not a stable market fact. Repeated runs and a fixed protocol help you distinguish a persistent visibility pattern from an isolated output. When an engine or model changes, mark the break in the time series instead of presenting the new results as a clean continuation.

    Join prompt observations, bot visits, referrals, and outcomes

    Four colored streams of prompt observations, bot activity, referral paths, and outcome signals converge in a transparent measurement hub.

    No single analytics system sees the entire AI-mediated journey. Prompt monitoring observes the answer. Server logs observe requests to your site. Web analytics observes some human handoffs. Product, commerce, and customer systems observe downstream outcomes. Your job is to connect those views without pretending they form a deterministic user-level trail.

    Some agent analytics workflows now make bot visits and human referrals available as separate inputs. Keep that separation in your own model. Bot activity is evidence of machine access. Human referral activity is evidence of a visible handoff. Neither is a substitute for the other.

    Evidence streamMinimum fields to retainBest useImportant limitation
    Prompt observationsTimestamp, engine and model label, prompt ID, intent, market, mention role, citation, recommendation, claims, and competitors.Measuring whether and how the brand appears in AI responses.The observed answer cannot reveal every internal retrieval step or every answer shown to other users.
    Server and edge logsTimestamp, requested URL, response status, user agent, verified bot classification where possible, and rendering outcome.Diagnosing whether relevant machines can access priority content.User-agent labels can be spoofed, and a request does not establish indexing or use.
    Referral analyticsReferral class, referring domain when exposed, landing URL, session ID, campaign parameters, and engagement events.Measuring observable human handoffs from answer engines.Not every app or handoff exposes a usable referrer, so measured referrals are not the whole audience.
    On-site behaviorLanding page, content path, engagement event, lead event, account event, and transaction event.Finding friction after an AI-mediated arrival.On-site behavior alone does not establish which answer or prompt influenced the visit.
    Business outcomesOutcome type, timestamp, product or service, market, value where appropriate, and declared acquisition signal.Connecting visibility work to decisions the organization values.Self-reported and last-touch signals are useful but incomplete attribution evidence.

    Join these streams at an aggregate level using the safest shared dimensions: time period, landing URL, product, market, intent cluster, and engine class. For example, you can compare a change in citation coverage for a product cluster with bot access to its priority pages, referrals landing on those pages, and relevant conversions. That creates a defensible sequence of evidence without claiming that an anonymous conversion came from a particular monitored prompt.

    Use explicit evidence labels in every analysis:

    • Observed: a monitored answer named the brand, a known bot requested a page, a referrer identified an answer engine, or a tracked session completed an event.
    • Inferred: a page probably contributed to an answer, a referral may have followed a particular prompt, or an AI mention may have influenced a later direct visit.
    • Unknown: the platform did not expose enough information to connect the events responsibly.

    This distinction matters most when direct traffic or branded search rises after AI visibility improves. That movement may support an influence hypothesis, but it does not identify the original answer or prove causation. A post-conversion question about how the person found you can add directional evidence, provided you keep self-reported responses separate from observed referrals.

    Use the dashboard to choose the next intervention

    Your dashboard should help someone decide what to change. Organize it by the measurement layers rather than by whichever tool supplied the data:

    • Access: priority-page bot coverage, response failures, blocked resources, and rendering problems.
    • Understanding: entity confusion, missing attributes, inaccurate claims, and contradictory descriptions.
    • Selection: qualifying mention rate, recommendation rate, citation rate, cited-page distribution, and competitor overlap.
    • Handoff: answer-engine referrals, landing-page distribution, engaged sessions, and return behavior.
    • Outcome: leads, registrations, purchases, bookings, and other confirmed business events by relevant cohort.

    Read combinations of signals rather than reacting to one chart:

    Observed patternLikely failure areaNext test
    Priority pages receive qualifying bot visits, but the brand is rarely mentioned.Entity understanding, recruitment, or grounding rather than basic access.Clarify who the brand serves, what it offers, where it operates, and the constraints it satisfies. Align structured data with visible page claims, then rerun the same prompt cluster.
    The brand is mentioned, but descriptions are inaccurate or inconsistent.Entity reconciliation and claim clarity.Consolidate canonical facts, remove contradictory copy, make relationships between the organization and its products explicit, and track the disputed claims individually.
    The brand is mentioned but seldom recommended for high-intent prompts.Weak evidence for the decision criteria used in comparison.Add verifiable information about fit, limitations, availability, compatibility, or policies on the most relevant pages. Do not present unsupported superiority claims.
    Owned pages are cited, but referrals remain low.The answer may satisfy the need without a click, or the brand may be functioning as evidence rather than the chosen option.Inspect the mention role and next action before treating this as failure. Strengthen the path to a useful next step where the user genuinely needs one.
    Answer-engine referrals rise, but conversions do not.Landing-page intent mismatch or on-site friction.Compare the answer’s promise and constraints with the landing page. Preserve context, answer the next likely question, and test the relevant conversion path.
    Conversions rise without identifiable AI referrals.An attribution gap rather than confirmed absence of AI influence.Improve referral classification, retain landing context, add a carefully worded self-report field, and analyze direct and branded-search cohorts without relabeling them as AI traffic.

    Run improvement work as a controlled diagnostic. Choose one intent cluster and one suspected failure layer. Preserve the prompt panel and test conditions. Record a baseline, make the narrowest relevant change, and then observe the nearest layer as well as downstream effects. If you changed entity and product facts, claim accuracy and recruitment should move before you expect a clean conversion effect.

    Possible interventions include correcting crawl barriers, consolidating entity information, adding decision-critical details, improving citation-worthy evidence, aligning JSON-LD with visible content, or repairing an AI referral landing path. Structured data can make explicit facts easier to interpret, but it does not guarantee retrieval, citation, recommendation, or display. Measure the relevant output after implementation.

    Record platform and model changes beside your experiments. If the engine changes during the test, you have a confound, not a clean before-and-after result. Keep the observation, mark the limitation, and repeat under the new condition rather than forcing the numbers into an unsupported success claim.

    Key takeaways

    • AI visibility has distinct access, understanding, selection, presentation, handoff, and outcome layers.
    • A brand mention, an owned citation, a recommendation, a referral, and a completed action are separate events.
    • A stable, decision-based prompt panel is the foundation of comparable visibility measurement.
    • Bot visits show machine access, not brand preference or human demand.
    • Aggregate evidence can support a journey hypothesis, but anonymous events should not be turned into deterministic user-level attribution.
    • The best next optimization is the one aimed at the first layer where the evidence weakens.

    Start with one commercially important journey and map its evidence from prompt to outcome. You do not need perfect attribution before acting. You need a clear boundary between what you observed, what you inferred, and which failure point your next change is designed to address.

    References

  • Discover Your AI Rankings with Profound’s Agent Analytics

    Discover Your AI Rankings with Profound’s Agent Analytics

    As a Profound customer, I’m excited to share that I can now clearly see where my site and pages stand in terms of AI citations compared to other peers in the Profound Agent Analytics Network.

    This feature empowers me with detailed insights, allowing for a competitive analysis that helps in enhancing my digital strategy and boosting my AI visibility effectively.


    Inspired by this post on Try Profound Blog.


    crushpress.ai community screenshot
  • How to Measure AI Search Visibility and Make It Actionable

    How to Measure AI Search Visibility and Make It Actionable

    You can have a healthy SEO dashboard and still be nearly invisible when a buyer asks an AI assistant what to choose. The difficult part isn’t collecting another visibility score. It’s knowing whether a change reflects stronger retrieval, a different mix of prompts, or noise in the answers you sampled.

    A useful measurement system starts with a repeatable prompt panel, distinguishes mentions from citations, checks whether your brand is represented accurately, and connects that evidence to business outcomes. Here is how to build one without turning a handful of AI responses into false precision.

    Measure what happens inside the answer, not just after the click

    Traditional search measurement follows a familiar sequence: query, ranking, impression, click, session, conversion. Generative search compresses much of that journey into an answer. A user can discover your brand, compare it with alternatives, absorb a claim about it, and make a decision without visiting your site.

    That makes traffic an incomplete visibility measure. Some studies cited in current GEO coverage put traditional-result clicks at only 8% when AI-generated summaries are present. Treat that figure as a warning about measurement gaps, not as a universal click-through benchmark for your site. The practical point is that an off-site answer can influence demand even when analytics records no session.

    Measure AI search visibility across four layers. Presence tells you whether the brand appears. Use tells you whether an owned page is retrieved or cited. Representation tells you whether the answer describes the brand accurately and in the right context. Impact tells you whether that exposure is associated with qualified visits, branded demand, leads, sales, or another business outcome.

    These layers prevent a common reporting error. A brand mention is not automatically an owned-content citation. A citation is not proof that the answer framed the brand correctly. Visibility is not proof of commercial influence. Each is useful, but each answers a different question.

    Key takeaways

    • Use a stable set of prompts so one reporting period can be compared with another.
    • Keep mentions, citations, observable retrieval, entity accuracy, sentiment, and conversions as separate measures.
    • Report results by platform, topic, intent, and prompt cohort before calculating an overall score.
    • Save the underlying answer and its citations. A percentage without evidence cannot be audited.
    • Use visibility metrics to choose an action, then judge that action by the specific metric it was intended to change.

    Build a prompt panel you can rerun without moving the goalposts

    A controlled grid of abstract prompt tiles feeds into parallel answer chambers, with one displaced tile showing a changed test condition.

    Your prompt panel is the measurement instrument. If the prompts change whenever a campaign changes, the resulting trend line cannot tell you whether visibility improved or the test simply became easier.

    Start with topics and decisions that matter

    List the topics your brand should credibly be associated with, then map the questions a real buyer asks while learning, solving, comparing, choosing, and validating. This creates a panel that covers informational discovery as well as decision-stage visibility.

    • Learn: What is the category, process, or concept?
    • Solve: How should someone handle a defined problem or constraint?
    • Compare: What are the meaningful differences between available approaches?
    • Choose: Which options fit a particular use case, audience, budget, or requirement?
    • Validate: Is a named brand suitable, credible, compatible, or known for the relevant capability?

    Include branded and unbranded prompts, but don’t blend their results. An unbranded prompt tests discovery and competitive consideration. A branded prompt tests entity recognition, factual accuracy, and reputation. A dashboard that combines them can look strong simply because the model answers direct questions about a brand that the user already named.

    Apply audience, industry, location, or product qualifiers only when they change the decision. Keep them in dedicated cohorts. Otherwise, an increasingly narrow prompt may manufacture visibility that does not exist for the broader market question.

    Create a prompt registry before collecting answers

    Give every prompt a permanent record. At minimum, store its ID, exact wording, topic, intent, audience qualifier, branded or unbranded status, platform and mode, relevant competitor set, target page, and the brand facts you expect an accurate answer to preserve.

    Freeze the wording used for your baseline. If you improve a prompt later, create a new version instead of overwriting the old one. Keep retired prompts in the registry so historical rates retain their original denominator. This is less convenient than editing a shared list in place, but it prevents an invisible change in the test from masquerading as an improvement in performance.

    Use a consistent collection protocol

    1. Run the exact registered prompt in the intended platform and mode, such as an answer with web search enabled rather than a model-only response.
    2. Record the platform, mode, timestamp, prompt version, full response, visible citations, cited URLs, and any named competitors.
    3. Score the answer with a written rubric. Preserve the raw response so another reviewer can check the decision.
    4. Repeat the panel on a fixed cadence. If resources permit, run prompts more than once so a single response is not mistaken for a stable pattern.
    5. Log failed captures, blocked responses, and unavailable features separately. Do not score a technical failure as brand absence.

    Keep platform results separate. Google AI Overviews, ChatGPT search, and other answer systems are different surfaces with different retrieval and citation behavior. You can create a portfolio view later, but first calculate each platform’s rate against its own eligible observations.

    If you do publish an aggregate, state its weighting. An unweighted average gives every prompt-platform pair the same influence. A business-weighted score gives priority cohorts more influence. Neither is inherently correct; an unexplained blend is the problem.

    Use a metric stack instead of one opaque visibility score

    A practical GEO measurement stack separates eight signals across presence, representation, retrieval, competition, and impact. The definitions below turn those ideas into auditable calculations. They are operational definitions, not universal standards, so document them and resist changing them midstream.

    MetricOperational definitionQuestion it answers
    Answer inclusion rateEligible answers containing a qualifying brand mention or traceable use of owned content, divided by all eligible answers in the cohort.Does the brand enter the answer at all?
    AI citation frequencyEligible answers containing a visible citation connected to the brand, divided by all eligible answers. Report any-brand citation and owned-domain citation separately.Is the answer visibly supported by material associated with the brand, and does it cite the brand’s own site?
    Share of model voiceThe brand’s unique inclusions divided by unique inclusions for the entire predefined competitor set. Count a brand once per answer so repetition does not inflate share.How much of the observable category conversation does the brand occupy?
    Entity recognition accuracyBrand-discussing answers that preserve the required facts divided by all answers that discuss the brand.Does the system understand who the brand is, what it offers, and how its entities relate?
    Sentiment and framingCounts of favorable, neutral, critical, or mixed descriptions, paired with issue codes and the exact claim being evaluated.How is the brand characterized before the user reaches its site?
    Prompt coveragePriority prompt cells with at least one qualifying inclusion divided by all eligible priority prompt cells.Across how much of the intended buyer journey is the brand visible?
    Observable retrieval successRuns in which a relevant owned page is visibly retrieved or cited, divided by runs where that page is an eligible answer source.Can the system access and use the content you expected it to use?
    Conversion influenceQualified visits, conversions, lead quality, revenue, branded demand, or other outcomes associated with AI referrals and visibility changes.Is AI visibility connected to business value?

    The denominator matters as much as the numerator. Show both on every metric card. A 50% inclusion rate based on two eligible answers carries very different weight from the same rate across a broad, repeated panel.

    Keep citation frequency and retrieval success distinct. A brand can be mentioned because a third-party page was retrieved. An owned page can be cited without the brand becoming a recommended option. A model may also name the brand without exposing any source. Consumer-facing outputs rarely reveal every internal retrieval step, so call the measure observable retrieval rather than claiming access to hidden model behavior.

    Share of model voice also needs a locked competitor set. Adding weak competitors lowers everyone’s apparent share; removing a dominant competitor raises it. Version the set just as you version prompts, and show absolute inclusion alongside share. If absolute visibility holds steady while share falls, competitors may be gaining rather than your brand disappearing.

    For entity accuracy, write the answer key before scoring responses. Include only facts the brand can substantiate, such as its official name, category, product relationships, supported markets, or current positioning. Record each error type separately. A single accuracy percentage will not tell your content team whether the problem is an outdated name, a category mismatch, a confused product relationship, or a claim that is too broad.

    Sentiment needs the same discipline. A neutral answer that omits the brand’s relevant capability is different from a critical answer containing a factual error. Save the exact sentence, its context, the issue code, and the affected prompt. Automated labels can help sort a large collection, but consequential or ambiguous cases still need human review.

    Read metric combinations as a diagnostic system

    No metric tells you what to change by itself. The useful signal comes from combinations. Start with the smallest cohort where the problem appears, then diagnose the layer most likely to be responsible.

    Low inclusion plus low observable retrieval

    Begin with access and extractability. Check whether the intended page can be crawled, whether the primary answer is available in parseable text, whether important information is current, and whether structured data accurately describes the visible content and entity relationships. Crawlability, schema use, freshness, and parsing quality all belong in a retrieval-success investigation.

    Do not add schema merely to produce more markup. Structured data can clarify supported facts; it cannot make a thin, contradictory, or inaccessible page authoritative. Validate the markup, align it with what users can see, and retest the affected prompt cohort after the page can be revisited.

    Inclusion without owned citations

    The system recognizes the category connection, but your site is not supplying the visible evidence. Inspect which domains are cited instead and what those pages make easy to extract. Then improve the relevant owned page with a direct answer, clear definitions, explicit comparison dimensions, supported claims, and enough surrounding context for a passage to stand on its own.

    Do not treat matching wording as proof that the model used your page. Unless the interface exposes a citation or retrieval record, hidden sourcing remains unknown. Score what you can observe and use citation gains as the validation target for this change.

    Strong visibility with weak entity accuracy

    This is a representation problem, not an awareness problem. Compare the wrong claim with the corresponding signals on your site, structured data, product pages, and corroborating profiles. Standardize names and relationships, remove obsolete descriptions, and make the canonical explanation explicit. Retest the prompts that produced the error rather than waiting for the global score to move.

    Informational coverage without decision-stage visibility

    The brand may be recognized as an educator but absent from the consideration set. Examine compare, choose, and validate prompts. If the cited pages answer selection questions that your pages avoid, create or improve content around fit, limitations, use cases, evaluation criteria, and meaningful alternatives. The goal is not to declare yourself the best. It is to supply the facts an answer system needs to explain when the offering is or is not a fit.

    Visibility gains without measurable business impact

    First check intent. More citations on broad educational prompts may be valuable without creating immediate demand. Next check whether the cited or visited page offers a sensible next step for that query. Then inspect referral classification, landing-page engagement, conversion quality, direct traffic, and branded search movement.

    Do not force a revenue claim from a coincident trend. Off-site AI interactions are often not connected to an identifiable user journey. Call the result influence unless you have instrumentation that supports stronger attribution.

    Change one measurement layer at a time

    Turn each diagnosis into a recorded experiment. State the affected cohort, observed gap, proposed change, page or entity being changed, metric expected to move, business guardrail, and next review point. If you rewrite the prompts, replace the target pages, and change the scoring rubric together, you will not know which change produced the new result.

    Keep a control cohort of unchanged prompts when practical. It gives you context when visibility moves across the platform rather than only on the pages you changed.

    Report evidence, decisions, and business influence in one workflow

    Abstract answer signals pass through a diagnostic prism and flow into content, source, customer-journey, and business-outcome elements.

    A dashboard should shorten the distance between an observed gap and the person who can address it. Clutch, for example, places Conductor-powered visibility analysis inside its AI Visibility Dashboard. The useful principle is workflow integration: a report creates more value when operators can move from the trend to the affected prompt, answer, citation, topic, and page.

    Give each audience the view it needs

    • Leadership view: priority-topic inclusion, share of model voice, entity accuracy, major reputation issues, qualified AI traffic, and conversion influence.
    • Operator view: platform, topic, intent, prompt, target page, cited domain, competitor, issue code, and experiment status.
    • Evidence view: exact prompt, full response, visible links, scoring decision, timestamp, reviewer, and prompt version.

    Every summary card should show the current value, comparison baseline, numerator, denominator, included cohort, and last collection date. Avoid a global visibility score that cannot be traced to those components. It may look tidy, but it cannot tell a content, technical SEO, brand, or analytics team what to do next.

    Keep the collection cadence and the decision cadence separate

    Collect on a consistent schedule that your team can sustain. Review urgent factual errors when they appear, but make strategic decisions only after you have enough comparable observations to distinguish a pattern from one answer. Annotate changes to prompts, pages, structured data, competitor sets, platform modes, and scoring rules directly on the timeline.

    When a platform introduces a materially different mode or answer experience, create a new cohort. Do not splice it into the old series as if the measurement environment stayed constant.

    Triangulate AI visibility with analytics and search data

    No single product captures the complete path. Combine controlled prompt testing with analytics, server or referral evidence where available, Search Console, traditional SEO tools, technical audits, and business data. This mixed approach reflects the reality that GEO measurement currently requires multiple tools and methods.

    In GA4, isolate known AI-platform referrals and compare their landing pages, engagement, conversion rate, conversion value, and lead quality with relevant baselines. Keep the referral rules documented because platforms and referrer behavior can change. Review direct and branded-search demand alongside those sessions, but present the relationship as supporting evidence rather than proof that every change came from AI exposure.

    Search Console still helps you see traditional query demand, page performance, and technical conditions around the topics in your prompt panel. It will not expose every AI interaction, but it can reveal whether a page has a broader indexing, relevance, or demand problem that also limits its usefulness to generative systems.

    Evaluate tools by the decisions they support

    Before buying an AI visibility platform, ask whether it supports the exact environments you need to measure and whether you can audit its results. A useful evaluation checklist includes:

    • Named platforms and modes rather than a generic claim of model coverage.
    • Exact prompt storage, prompt versioning, cohort management, and repeatable scheduling.
    • Preservation or export of full responses, citations, cited URLs, timestamps, and scoring evidence.
    • Transparent definitions and denominators for inclusion, citations, share of voice, sentiment, and coverage.
    • A configurable competitor set and the ability to retain historical versions of that set.
    • Segmentation by topic, intent, platform, geography where relevant, brand, competitor, and target page.
    • Human review, issue coding, annotations, ownership, and an audit trail for score changes.
    • Connections to analytics and business outcomes rather than visibility reporting alone.

    Do not compare vendor scores as though they were interchangeable. One may count every mention, another only cited mentions, and another may use a proprietary weighted index. Compare the underlying prompts, observations, scoring rules, and denominators before comparing the headline numbers.

    Start with one commercially important topic. Freeze its prompts, capture a baseline, and identify the largest localized gap: presence, citation, retrieval, accuracy, competitive share, or impact. Assign one change to that gap and name the metric that should respond. When the dashboard can tell your team what to inspect next, AI search visibility stops being a vanity score and becomes an operating system for better decisions.

    References

  • How to Restart Search Growth in the Age of AI Answers

    How to Restart Search Growth in the Age of AI Answers

    If your search impressions still look healthy while organic clicks and conversions have flattened, publishing more content may deepen the problem. AI answers have changed which searches produce a visit, but they have not removed the need for useful pages, credible evidence, or clear decisions.

    You need to find the exact layer where growth is breaking: discovery, answer visibility, click capture, on-page usefulness, or conversion. Once you separate those layers, you can stop treating every plateau as a rankings problem and make the change that the evidence supports.

    Reset what search growth means

    The familiar organic growth model is simple: rank for more queries, earn more clicks, and turn those visits into outcomes. AI-generated answers insert another possible stopping point. A search engine may resolve a narrow question on the results page, while a person with a more involved problem still needs to visit a website.

    Google’s stated view is that AI Overviews can filter low-value, single-fact visits while prompting people to search more frequently and in greater detail. That is a platform position, not proof that every publisher benefits. A lost click is still a lost opportunity unless the search creates some other measurable value for your brand.

    The practical change is to stop using total organic sessions as the only definition of growth. Evaluate four different outcomes:

    • Discovery: your pages appear for the questions and problems that matter to your audience.
    • Answer visibility: your brand, explanation, product, data, or page is represented when an AI answer is shown.
    • Qualified visits: people click because they need depth, proof, a tool, a comparison, or a next step that the results page cannot provide.
    • Business outcomes: those visits lead to the action the page was built to support, such as a signup, inquiry, purchase, or informed move to another page.

    This does not make clicks unimportant. A page does not become valuable merely because an AI system might summarize it. It means a click-through rate decline has more than one possible cause, and you should identify that cause before rewriting titles or adding pages.

    Start by labeling your important queries by the job they perform. A closed-answer query asks for a fact or definition. An exploration query helps someone understand a problem. A decision query compares options or constraints. An action query looks for a product, service, process, or implementation path. Closed answers are more exposed to instant resolution. Exploration, decision, and action queries give you more room to earn a meaningful visit, provided the page does more than restate a generic answer.

    Build a query map around complete problems

    An overhead strategy table shows blank tiles and glowing connections arranged around a three-dimensional problem-solving scene.

    AI-assisted search encourages people to express more of their situation in the query. Instead of reducing every topic to a short keyword, users can include their goal, constraints, experience level, and desired format. Google has observed longer, more conversational searches that describe the underlying need more clearly.

    Your keyword map should preserve that context. A broad term such as “schema markup” identifies a subject. A question such as “which schema should a service-area business use when it has no public storefront?” identifies a decision, a constraint, and the evidence the answer must contain. The second query is easier to turn into a useful content brief because it reveals what could make an answer wrong.

    Build each topic cluster from real language found in search performance data, site search, customer questions, sales conversations, support requests, and community discussions available to your team. For every meaningful query or prompt, record:

    • The exact question, including qualifiers rather than a cleaned-up head term.
    • The user’s likely stage: learning, evaluating, validating, or acting.
    • The constraint that changes the answer, such as business type, location, platform, audience, or implementation state.
    • The decision the person needs to make after receiving the answer.
    • The evidence or experience required to make the answer credible.
    • The page and section that should satisfy the need.
    • The next useful action you want the visitor to take.

    Do not turn every wording variation into a separate page. If several prompts have the same intent, require the same evidence, and lead to the same decision, they usually belong on one well-structured page. Split them only when the constraint materially changes the answer or when each audience needs a distinct path.

    Then inspect the live result for your priority prompts in a consistent setup. Record the exact query, search surface, date, location context, whether an AI answer appeared, which domains were cited, which brands were mentioned, and what conventional results remained visible. AI Overviews are not activated for every query, so testing a few broad keywords cannot tell you how an entire topic behaves.

    Treat this prompt set as a stable observation panel. Reuse the same important prompts when you review visibility, and add new ones only when customer language or search data reveals a genuinely different need. That gives you a comparable record instead of a collection of one-off screenshots.

    Make the page valuable after the instant answer

    The right response to AI answers is not to hide the answer deeper in the page. Give the reader a direct answer, then provide the judgment, evidence, and implementation help that a short synthesis cannot carry.

    A useful page can be built in layers:

    1. Answer the core question in plain language near the beginning.
    2. Name the conditions that would change the answer. This prevents an accurate general rule from becoming bad advice in a specific case.
    3. Explain the decision logic so the reader can apply the answer rather than merely repeat it.
    4. Provide evidence or utility that is difficult to replace with a generic synthesis: an original example, a documented process, a worked configuration, a template, a calculator, a comparison framework, or first-party data you genuinely possess.
    5. Offer the next action that fits the reader’s stage instead of forcing every visitor toward the same conversion.

    Use a replacement test during editing: if a generic answer box can reproduce the entire value of the page, the page is not finished. Add the constraint, evidence, or usable asset that a person needs after learning the basic answer. Do not add length for its own sake. More words do not create more value when they repeat the same conclusion.

    Machine readability matters, but it cannot rescue an undifferentiated page. Use descriptive headings, stable terminology, explicit relationships between entities, and internal links whose anchor text explains the destination. If you add JSON-LD, choose a valid type that accurately represents the page, keep names and other entity details consistent with visible content, and update the markup when the page changes. Structured data is a machine-readable description, not a relevance generator or a guarantee of inclusion in an AI answer.

    Credibility also has to be inspectable. Identify who created or reviewed the material when that identity helps the reader judge expertise. Link claims to the evidence you actually used. Distinguish observed results from editorial recommendations. Display a date when freshness affects the answer, not as decoration. Remove unsupported ratings, fabricated experience, and schema properties that are absent from the visible page.

    Mass-producing near-duplicate pages is especially weak in this environment. Google’s stated position is that generative AI has increased the volume of low-quality material while its ranking systems continue trying to suppress it. Whether those systems succeed in every result is a separate question. Your controllable advantage is to publish material that has a clear reason to exist: a different decision, better evidence, a useful tool, or a perspective grounded in real expertise.

    Diagnose the stalled layer before choosing a fix

    A technician examines a blockage inside one chamber of a transparent multi-stage pathway carrying streams of light.

    When organic search growth stalls, asking what to publish next is premature. First determine which part of the system stopped moving. Rankings, result-page behavior, content usefulness, conversion, and measurement can produce similar top-line charts while requiring completely different fixes.

    1. Validate the measurement. Confirm that analytics events, search reporting, consent behavior, and conversion definitions have not changed. A tracking break should not become an SEO project.
    2. Check technical access. Review indexing, robots directives, canonicals, redirects, rendering, internal links, and template changes on the affected pages.
    3. Segment the change. Break performance down by query group, page type, intent, device context, market, and brand versus non-brand demand where those dimensions are available. A sitewide total can hide a concentrated loss.
    4. Separate impressions from clicks. Falling impressions point you toward demand, coverage, indexing, or competitive visibility. Stable impressions with falling clicks point you toward the result-page environment, snippet appeal, or changed intent.
    5. Separate visits from outcomes. If qualified traffic is steady but conversions fall, inspect message alignment, page usability, the offer, and event tracking before changing the query strategy.
    6. Inspect representative results. Look for AI Overviews and other result features, note which needs they satisfy, and compare the remaining clickable results. Do this for the query groups that matter rather than whichever examples are easiest to find.

    Use the observed pattern to choose the first test:

    Observed signalStart by testingFirst useful action
    Impressions decline across established query groupsDemand, indexing, coverage, or competitive visibilityVerify technical access, then compare the affected queries and pages instead of rewriting every snippet.
    Impressions hold while clicks declineResult-page changes, instant answers, intent, or snippet appealInspect the live results, classify the lost queries, and strengthen both the search snippet and the page’s beyond-the-answer value.
    Visits hold while outcomes declineTracking, landing-page alignment, usability, or offer fitValidate events and compare each landing page with the promise and intent of its incoming queries.
    Important customer questions have no relevant visibilityContent coverage or insufficient evidenceRevise the best existing page or create a focused resource only when the question requires a materially different answer.

    Maintain a scorecard that matches those layers. Search performance data can show impressions, clicks, click-through rate, queries, and landing pages. A prompt observation log can show sampled AI-answer presence, citations, mentions, and competing domains. On-site analytics can show whether visitors continue to a useful next step or return. Business systems can show qualified inquiries, purchases, signups, or other outcomes where attribution is available.

    Keep the limits of each measure visible. Click-through rate without result-page context can mislead you. A brand mention without a citation may not create a visit. A citation may appear for a low-value prompt. A hand-checked prompt panel is a sample, not a complete census of AI visibility. Report the measures together so one flattering metric cannot conceal a broken path.

    Key takeaways for your next growth cycle

    • Classify important queries by the job they perform before assuming every lost click has equal value.
    • Map conversational prompts with their goals, constraints, required evidence, and next decisions intact.
    • Answer the core question early, then earn the visit with decision support, credible evidence, or practical utility.
    • Use valid, visible-content-aligned structured data to clarify meaning, not as a shortcut to rankings or AI inclusion.
    • Diagnose discovery, click capture, page usefulness, and conversion separately before choosing an intervention.
    • Measure search performance, sampled AI visibility, visit quality, and business outcomes in the same scorecard.

    Start with the query cluster most closely tied to a real audience decision. Record its current result environment, repair the page that should own the problem, and define the outcome you expect before making the change. Your next growth move should come from the failed layer you can see, not from a general fear that AI has made search traffic impossible.

    References


  • How to Turn AI Referral Traffic Into Bottom-Funnel Growth

    How to Turn AI Referral Traffic Into Bottom-Funnel Growth

    You may already see the awkward pattern: informational clicks are falling, AI assistants send a thin stream of referrals, and some conversions appear later under direct or branded search. If you judge that pattern with an organic traffic dashboard alone, the strategy can look weaker precisely when it is starting to influence revenue.

    Your job is not to replace every lost pageview. It is to publish the decision-stage answers that buyers and AI systems need, connect those answers to the rest of your site, and measure the journey beyond the first visible click.

    AI referrals are decision-assistance traffic, not replacement pageviews

    An informational search traditionally sent a person to several pages to assemble an answer. An AI interface can now do much of that assembly before the person visits a website. The resulting click is therefore more likely to represent validation, comparison, or purchase research than initial discovery.

    That changes the value of a session. A page that attracts thousands of definition-seeking visitors can produce less commercial movement than a comparison page attracting a much smaller group of people who are choosing between viable options.

    There is evidence that this difference can show up in conversion behavior, but it should not be turned into a universal benchmark. In an Adobe analysis covering more than one trillion visits to U.S. retail websites, AI-referred visits in March converted 42% better than non-AI visits. They also spent 48% more time on site and viewed 13% more pages per visit. A year earlier, AI visits in the same analysis had been 38% less likely to convert.

    Those figures describe U.S. retail traffic, not every market, business model, or AI platform. A retail purchase is not a B2B demo request, and a known brand is not in the same position as an unfamiliar one. Use the finding to form a hypothesis: AI referrals may be lower in volume but further along in the decision process. Then test that hypothesis against your own landing pages, conversions, lead quality, and sales outcomes.

    Key takeaways

    • Judge AI referrals by buying intent and conversion quality, not by whether they replace lost informational traffic.
    • For a pipeline-focused program, consider assigning 60% to 80% of new content effort to mid- and bottom-funnel needs, then adjust from your results.
    • Build comparison content with a disclosed method, consistent criteria, specific limitations, and recommendations for distinct buyer situations.
    • Keep top-funnel content, but give each useful page a clear route into a relevant evaluation or product decision.
    • Measure visible AI referrals alongside citations, branded search, direct visits, qualified leads, and total conversions.

    Rebalance content around the questions that delay a purchase

    A buyer stands among several symbolic decision stations as their branching research paths merge into one clear route toward a product pedestal.

    The strategic shift is not simply from educational articles to product pages. A product page explains what you sell. Bottom-funnel content helps a buyer decide whether it is the right choice, how it compares, where it fits, and what tradeoffs they would accept.

    Start with the questions that appear after a buyer understands the category:

    • Which options are suitable for my industry, company size, use case, or operating constraint?
    • How do two shortlisted products differ on the criteria that matter to me?
    • What are the strengths and limitations of each option?
    • Which product is the better fit for a specific situation?
    • What evidence would let me remove this option from my shortlist?
    • What should I verify before requesting a demo, starting a trial, or making a purchase?

    These are decision tasks, not just keywords. That distinction matters because buyers can express the same task through conventional search, a conversational AI prompt, a follow-up question, or a branded query after seeing a recommendation elsewhere.

    Audit your coverage by task. List your priority products, use cases, buyer groups, and serious alternatives. Then mark whether you have a useful answer for each relevant combination. Typical gaps include:

    • A broad category list with no version for a high-value industry or use case.
    • A product comparison that names features but never explains who should choose which option.
    • An alternatives page that treats every alternative as interchangeable.
    • A use-case page that makes claims without screenshots, expert explanation, or product evidence.
    • An educational page that attracts the right audience but offers no logical next step.

    Prioritize gaps where three conditions overlap: the question occurs close to a purchase, your product has a legitimate reason to be considered, and you can support the answer with specific evidence. A high-intent phrase is not useful if the resulting page would be evasive, generic, or unsupported.

    For teams measured on leads or revenue, a practical starting point is to put 60% to 80% of content effort into mid- and bottom-funnel work. Treat that as a portfolio choice to test, not a law. The right allocation depends on how complete your educational foundation is, how many decision-stage gaps remain, and whether your business has credible evidence for the pages it wants to publish.

    Build comparison pages that remain useful after the click

    A weak comparison page is an advertisement wearing an editorial title. It places the publisher’s product first, assigns vague praise to every option, hides meaningful drawbacks, and ends with an unrelated sales button. Buyers notice the bias. An AI system also has little precise material to reuse because the page never makes a bounded, supportable recommendation.

    A stronger page defines its scope, applies one review method to every option, and makes the tradeoffs visible. A construction-specific time-tracking comparison built this way became a frequently referenced page in LLM responses within weeks and outperformed a dozen earlier informational pages in pipeline impact. That is one documented outcome, not a promise that every listicle will perform the same way. The transferable lesson is the structure: answer a real purchasing question with enough specificity to guide a decision.

    A practical comparison-page blueprint

    1. Define the buyer and decision. State the industry, use case, operating constraint, and type of purchase covered. “Best time-tracking software” is broad; “best time-tracking software for construction” establishes a meaningful evaluation context.
    2. Publish the selection method. Explain how options qualified for inclusion and which criteria were applied. If you cannot explain why a product appears, the list will feel arbitrary.
    3. Give the short answer early. Identify which option fits which situation. Do not force a ready-to-buy reader through a long category lesson before providing the decision map.
    4. Use one comparison framework. Evaluate every option against the same relevant fields. Suitable columns might include best-fit use case, important strengths, material limitations, and the factor a buyer should verify.
    5. Separate fact from judgement. Product capabilities should be factual and current. Recommendations should show the reasoning that connects those facts to a buyer’s situation.
    6. Cover limitations directly. A useful limitation tells the reader who may be poorly served and why. Empty phrases such as “may not suit everyone” add no decision value.
    7. Recommend by situation. End with conditional guidance rather than a single universal winner. Different constraints can produce different correct choices.
    8. Place the next step in context. Put a demo, trial, pricing, or product link beside the point where it becomes useful. Do not rely on one generic call to action at the bottom.

    Credibility rules for including your own product

    You can include your own product when it genuinely meets the selection method. Disclose the relationship plainly, subject it to the same criteria, and resist the urge to make it the winner for every buyer. If an alternative is better for a particular situation, say so.

    Use screenshots, named features, and expert explanations where they help a buyer verify a claim. Keep each product section structurally consistent. A reader should not receive detailed drawbacks for competitors and only promotional language for your product.

    Write recommendations as complete, bounded statements. “Option A is the better fit for teams that need [capability], while Option B is more suitable when [different constraint] matters” is more useful than “Option A is best overall.” The bounded version exposes the reasoning, gives the buyer a usable distinction, and is less likely to be quoted outside its intended context.

    Update the page when the underlying facts change. A polished comparison built on stale capabilities is still unreliable. Record the last substantive review date, recheck each option using the published method, and remove claims you can no longer support.

    Give top-funnel content a direct route to the decision

    Top-funnel content still has an important job. It can establish the concepts a buyer needs, complete a topic cluster, attract relevant links, and pass internal link equity toward decision-stage pages. What has changed is the economics of publishing generic explanations that an AI result can answer without a click.

    Do not delete useful educational pages merely because their traffic has softened. Start with the pages that still reach the right audience and give each one a deliberate handoff:

    1. Identify the next decision. After reading the page, what question would a qualified buyer naturally ask? That question should determine the destination link.
    2. Add evidence where the subject touches your product. A relevant screenshot, implementation detail, or expert observation can turn an abstract explanation into practical understanding.
    3. Link to the closest evaluation page. Send the reader to a use-case comparison, alternatives page, product capability, or selection checklist rather than an unrelated homepage.
    4. Write a contextual call to action. Explain why the destination is useful at that moment. “Compare the options for construction teams” carries more meaning than “Learn more.”
    5. Place the handoff where the need appears. A relevant next step can sit beside the section that creates it. It does not have to wait until the final paragraph.
    6. Preserve the informational answer. The page should still solve the question that earned the visit. Turning every paragraph into a pitch will weaken trust and usefulness.

    This creates a simple content path: education establishes the problem, mid-funnel material frames the available approaches, and bottom-funnel material supports the choice. Internal links should reflect that progression in both directions. The comparison page can link back to definitions or methods a reader needs, while educational pages can point forward when the reader is ready.

    Specificity is the filter. If a top-funnel page merely repeats a general answer already available everywhere, adding a product button will not rescue it. Give the page a distinct expert perspective, a concrete example, a useful framework, or original product evidence before asking it to support a commercial journey.

    Measure the influence that last-click analytics misses

    A glowing thread connects an AI referral to several visits and a final purchase, while a narrow lens highlights only the last step and a wider lens reveals the full journey.

    An AI-assisted journey can cross several channels. A buyer sees your brand or page in an AI answer, does not click, returns through a branded search, and converts. Another buyer clicks an AI citation, leaves, and later returns directly. Standard acquisition reports may credit those outcomes to organic brand traffic or direct traffic even though AI visibility helped create the demand.

    Start by isolating the AI referrals you can see. In GA4, create a segment or channel definition that matches the AI referral domains actually present in your data. A regular-expression rule is useful because it can group multiple sources, but maintain the domain list instead of treating it as permanent. Validate the rule against raw source values so an overly broad match does not pull unrelated referrals into the channel.

    Break that segment down by landing page and intent. Mixing an educational visit with a product-comparison visit hides the question you need answered. Compare like with like: AI-referred visits to bottom-funnel pages against other visits to those same pages, using the same conversion definition.

    Your scorecard should combine directly observed traffic with directional indicators of influence:

    SignalWhat it can tell youHow to act on it
    AI referral sessions by landing pageWhich pages receive visible visits from AI platformsProtect, update, and expand pages attracting relevant evaluators
    Conversion rate by landing-page intentWhether decision-stage visits produce more commercial action than informational visitsAllocate effort according to qualified outcomes, not aggregate sessions
    Engagement and product-page progressionWhether visitors continue evaluating after arrivalImprove the page’s decision support or contextual handoff where progression stalls
    LLM citation frequency for a stable prompt setWhether your brand or page appears in relevant answers, even without a clickReview the cited passages and close factual or use-case gaps
    Branded search and direct-traffic trendsWhether discovery may be resurfacing through channels that obscure the first touchTreat the movement as directional evidence and examine it beside publication activity
    Qualified leads, purchases, and pipelineWhether the program contributes to business outcomesFavor pages and topics that produce valuable customers rather than raw volume

    None of the directional signals proves causation on its own. Direct traffic can move for many reasons, and a branded search increase can reflect activity outside content. Use publication and update dates as annotations, compare several signals together, and avoid assigning all subsequent growth to one page.

    Lead capture can close part of the gap. Preserve the original landing page and referral source where available, then pair them with a simple self-reported discovery field. A buyer who says an AI assistant introduced the brand gives you information that a last-click field may have lost. Keep self-reported and system-attributed sources separate so one does not overwrite the other.

    Report the channel in business language. Instead of stopping at “AI referrals increased,” show which decision-stage pages received those visits, how the visitors behaved, how many qualified conversions followed, and whether brand discovery moved in the same period. Stable or lower total traffic can still support a healthier strategy if conversion quality and pipeline improve.

    Your next move is small and concrete: choose one purchase-stage question that repeatedly blocks a decision. Build the most complete, candid answer you can support. Connect your strongest relevant educational pages to it, establish the measurement baseline, and watch referrals, citations, branded discovery, and qualified conversions together. Once that loop produces a useful signal, repeat it for the next decision your buyers need help making.

    References