Tag: AI Performance

  • Unified Content Performance Monitoring for AI Search

    Unified Content Performance Monitoring for AI Search

    A page disappears from the AI answers you monitor. Your search rankings look stable, server logs still contain crawler requests, and analytics shows no obvious break. Those signals do not tell you whether to repair the page, rewrite it, or leave it alone.

    You need one diagnostic record that follows the page from technical eligibility to automated access, answer-engine selection, and business outcome. Bringing citations, bot activity, and page health into a page-level view is the foundation. The real value comes from preserving the distinctions between those signals so that each change leads to the right action.

    Key takeaways

    • Monitor page health, bot access, citations, and outcomes as connected layers, not interchangeable measures of success.
    • Attach every observation to a canonical URL, defined monitoring scope, time window, and raw evidence.
    • Diagnose changes in order: measurement scope, page identity, technical health, bot access, citation selection, then outcomes.
    • Alert people only when a signal maps to an action. Keep ordinary fluctuations in a review queue instead of creating constant emergencies.
    • Annotate releases and content changes. Change one class of variable at a time when you want to learn what affected performance.

    Measure four layers without collapsing them

    Four separated translucent monitoring layers rise above a blank web page, with visual elements for technical health, crawler access, answer selection, and audience outcomes.

    A unified monitor is not a collection of charts placed on the same screen. The records must share the same page identity, observation period, and filters. Otherwise, you can easily compare a bot request for one URL variant with a citation of another and an analytics total covering the entire site.

    Use four layers. Each answers a different question and has a different failure mode.

    LayerQuestion it answersEvidence to retainWhat it does not prove
    Page healthCan the intended page be fetched and interpreted as configured?Final destination, response class, canonical target, access directives, render result, and structured-data validationThat an AI system visited, selected, or cited the page
    Bot activityDid an identified or claimed automated agent request this URL?Agent classification, verification method, requested path, time, response class, and resource typeThat the main content was processed, retained, or used in an answer
    Citation visibilityDid a monitored answer point to this URL or domain?Surface, query or prompt, market, language, observation time, answer capture, and citation typeVisibility across every possible query, user, model, or session
    OutcomeDid the exposure connect with a useful audience or business action?Landing-page visits, engagement, qualified actions, conversions, and attribution notesThat a citation caused the outcome when the journey cannot be observed directly

    Do not compress these layers into a single score too early. A composite score can fall while hiding the only fact your team needs: whether the page became technically unavailable, stopped receiving bot requests, lost citations within a monitored query set, or simply generated fewer visits. Keep the component states visible even if executives also receive a summary indicator.

    Define the denominator before reporting citation growth

    A raw citation count is not comparable when the monitored query set changes. Define citation coverage as cited observations divided by eligible observations within a named scope. That scope should preserve the answer surface, query set, language, market, and any other controllable setting. If you add queries or change the mix, mark a new baseline rather than presenting the result as uninterrupted growth.

    Separate direct URL citations from domain mentions, unlinked brand mentions, and citations of a different page on your site. They may all matter, but they are not the same event. Decide which types count toward each metric before a stakeholder asks why the number moved.

    Count bot requests as access evidence, not visibility

    Bot activity begins with a request in a log. It does not establish that the agent rendered the page, understood the primary content, stored anything, or used the page in a generated response. Check whether the request reached the canonical document or only an asset, redirect, parameterized variant, or error response.

    A user-agent label is also a claim, not automatic proof of identity. Record how the agent was classified and keep categories such as verified, claimed, and unknown separate. This prevents spoofed or ambiguous requests from making an access trend look more certain than it is.

    Build one operating record for every canonical page

    The canonical URL should be the join key for your monitor, but a URL alone is not enough. Your team also needs to know what the page is supposed to do, who owns it, and what changed before a signal moved.

    1. Identity: canonical URL, page identifier, template, content type, topic cluster, language, and market.
    2. Purpose: primary audience question, intended search intent, conversion role, and the monitored query set associated with the page.
    3. Lifecycle: publication state, original publication time if known, meaningful revision times, and planned review state.
    4. Health: destination resolution, access directives, canonical consistency, renderability, structured-data validity, and agreement between markup and visible content.
    5. Bot evidence: agent category, identity confidence, request time, requested resource, response class, and any relevant delivery or firewall decision.
    6. Citation evidence: answer surface, exact query or prompt, visible model or product label, locale, observation time, cited URL, citation type, and captured response.
    7. Outcome evidence: landing activity, meaningful engagement, qualified action, conversion, and the limits of the available attribution.
    8. Change history: content edits, schema changes, template releases, internal-link changes, redirects, access-control changes, and analytics modifications.
    9. Ownership: responsible person or team, current status, next diagnostic step, and the evidence required to close the issue.

    Store the raw observation beside the normalized status whenever practical. A label such as “citation lost” is easy to scan, but the captured answer, monitored prompt, cited URL, and observation context are what let someone verify it later. The same rule applies to health checks and bot logs.

    Preserve unknowns instead of filling them with assumptions

    Some answer surfaces do not expose every model, retrieval, personalization, or session detail. Mark unavailable fields as unknown. Do not silently substitute a product name for a model version or assume two sessions had identical conditions. Your trends become more credible when the monitor shows where comparability ends.

    Apply the same discipline to attribution. A citation and a later conversion may be associated in time without being causally connected. Use direct attribution where it exists, assisted attribution where the journey supports it, and an explicitly labeled association everywhere else.

    Diagnose signal changes in a fixed order

    A blank web page moves through four sequential inspection stations for structure, crawler access, answer selection, and audience response.

    When a metric moves, begin with the cheapest explanations to verify. Rewriting content before checking measurement scope, redirects, or access controls creates work and can erase a page that was not actually underperforming.

    1. Confirm comparability. Check that the answer surface, monitored queries, locale, page mapping, observation schedule, and classification rules are consistent with the baseline.
    2. Resolve page identity. Verify that the observed URL, final destination, and canonical target refer to the same intended page. Inspect redirects and duplicate variants.
    3. Check technical health. Look for delivery failures, unintended access directives, rendering problems, canonical conflicts, broken markup, or structured data that no longer matches visible content.
    4. Inspect bot access. Determine whether relevant agents requested the document, what response they received, and whether a firewall, cache, consent layer, or delivery change altered access.
    5. Evaluate citation selection. Within a stable monitoring scope, inspect whether the page is still cited, whether another page from your domain replaced it, and which answer contexts changed.
    6. Connect the result to outcomes. Only after the earlier layers are sound should you decide whether the movement affected useful visits, engagement, leads, sales, or another defined goal.

    Health fails and bot activity falls

    Treat this as a delivery or access problem first. Review recent releases, redirect rules, canonical changes, access directives, firewall decisions, and server failures. Do not commission a rewrite while the intended page cannot be reached or interpreted reliably. Confirm the technical repair from outside the content management preview before closing the issue.

    Health is clean and bots visit, but citations remain weak

    You do not yet have evidence of a crawl problem. Review the page against the questions in the monitored set. Check whether it answers the central question directly, names entities unambiguously, separates distinct claims, supports important assertions, and keeps relevant facts consistent across visible copy and structured data.

    Also inspect page fit. A broad category page may receive requests while a focused explanatory page is a better citation candidate for a specific question. Map each monitored query to the URL that should answer it. If several pages compete for the same role, consolidate or differentiate them before adding more copy.

    Citations appear, but traffic stays flat

    A citation is not a click. Verify whether the citation is prominent, directly linked, attached to your preferred URL, and presented in a context that gives the user a reason to continue. Then inspect the landing page: the next step should be obvious and should extend the answer rather than merely repeat it.

    Do not manufacture traffic attribution when referral data is incomplete. Report the citation as visibility, report observed visits and outcomes separately, and describe any relationship between them at the confidence level your data supports.

    Bot activity moves while citations remain stable

    A crawl spike or decline is not automatically a performance event. It may reflect recrawling, release activity, duplicated URL discovery, asset fetching, or a change in agent classification. Compare requested resources and response patterns before escalating. If citations, health, and outcomes remain stable, keep the change in observation rather than forcing a content task.

    Traffic changes without a citation change

    Investigate conventional search, referrals, campaigns, seasonality, tracking changes, and site experience before blaming AI visibility. Unified monitoring is useful partly because it shows when the explanation probably sits outside the AI citation layer.

    Turn the monitor into a calm operating loop

    A dashboard does not improve content. A decision rule does. Define which conditions trigger an immediate technical response, which enter a scheduled investigation, and which remain under observation.

    • Immediate exceptions: an important page becomes unavailable, resolves to the wrong destination, acquires an unintended access restriction, develops a canonical conflict, or repeatedly returns a server failure. Verify the condition before making a destructive rollback.
    • Weekly triage: repeated citation movement within a stable query set, meaningful changes in verified bot access, unresolved page-level health warnings, and newly detected overlap between pages targeting the same question.
    • Monthly portfolio review: patterns by template, topic cluster, market, content type, and owner. Use this view to identify systemic issues that page-by-page tickets would hide.
    • Release checks: annotate migrations, redesigns, schema deployments, content refreshes, analytics changes, firewall updates, and redirect work. Recheck the affected layer after deployment.

    Each investigation ticket should state the observed change, comparison scope, raw evidence, affected layer, plausible cause, next test, owner, and safe reversal path. “AI visibility is down” is not a usable ticket. “Citation coverage fell across the unchanged monitored query set while health and verified document requests stayed stable” gives the owner a real starting point.

    Use page-specific baselines instead of universal benchmarks

    A citation count has meaning only within its observation scope, and bot volume depends on page type, site architecture, releases, and crawler behavior. Compare a page with its own stable baseline first. Use cluster or template comparisons only after confirming that the pages were measured under compatible conditions.

    Require repeated evidence across scheduled observations before rewriting a healthy page, unless you have a confirmed technical break or factual error. Generated answers and crawler activity can fluctuate. A reaction to every isolated movement will fill your change log with noise and make later diagnosis harder.

    Change one layer when you need a causal answer

    If you rewrite copy, replace schema, restructure internal links, and change the template in the same release, an improvement will not tell you which intervention mattered. Group urgent fixes when necessary, but use controlled, separately annotated changes for optimization work. Preserve the prior version and its observation scope so a rollback or comparison remains possible.

    Start with a bounded set of pages tied to real audience demand or business value. Create one record per canonical URL, capture the current state of all four layers, and assign an owner. The next time a metric moves, follow the diagnostic order before touching the content. That small discipline is what turns disconnected visibility data into a performance system.

    References


  • How to Measure AI Search Visibility Across the Customer Funnel

    How to Measure AI Search Visibility Across the Customer Funnel

    Your AI visibility score may look healthy while your brand is absent at the exact moment a buyer narrows the shortlist. The reverse can happen too: you appear in brand-specific answers but never enter the conversation while people are still defining their problem.

    You need to know where your brand enters an AI-assisted buying journey, how it is represented at each stage, and what causes it to disappear. A funnel-based prompt map turns that broad visibility problem into content, authority, and measurement work you can actually prioritize.

    Define visibility differently at each funnel stage

    A single visibility percentage hides intent. A mention in an educational response is not equivalent to a place on a product shortlist, and a citation is not automatically a recommendation. Even a prominent answer to a branded prompt may tell you little about whether new buyers discover the brand.

    Prompt mapping extends keyword mapping by organizing the questions people may ask AI platforms according to topic, intent, persona, and buying stage. It also accounts for the context people add around company size, existing technology, use case, pain point, and purchasing priority. Those qualifiers can turn one broad keyword into many plausible prompts with materially different answers.

    Use four stages as a working model. Buyers will not always move through them in order, so classify the job being done in the prompt rather than trying to prove a perfectly linear journey.

    Funnel stageWhat the person is trying to resolveWhat useful visibility looks likeWhat you should inspect
    AwarenessUnderstand a symptom, risk, goal, or problemYour expertise helps frame the problem accurately, through a relevant brand mention or an owned-page citationProblem association, cited educational pages, terminology, and factual accuracy
    ConsiderationUnderstand possible approaches, categories, capabilities, or selection criteriaYour brand is associated with the appropriate solution and use caseCategory association, capability descriptions, fit criteria, and alternatives mentioned
    EvaluationReduce a set of options using specific requirementsYour brand makes an appropriate shortlist when it genuinely satisfies the stated constraintsRecommendation context, qualifying criteria, competitors, trade-offs, and cited evidence
    DecisionValidate a named brand before actingPricing, compatibility, implementation, strengths, and limitations are represented accuratelyClaim accuracy, objection coverage, outdated information, and unexpected competitor substitutions

    This distinction changes what you optimize. At awareness, forcing the brand into every answer is not the goal. You want a defensible association with the problem and credible educational material that can support the response. At evaluation, general educational authority is insufficient if the brand disappears as soon as the buyer names an integration, industry, company profile, or operational constraint.

    Decision-stage measurement requires another shift. The user has already supplied the brand name, so simple inclusion is a weak success metric. You should care more about whether the response is current, specific, fair, and useful enough to support a real decision.

    Build a compact prompt map around real buying decisions

    A central decision node connects to visual clusters representing problem discovery, exploration, comparison, and final selection prompts.

    You cannot track every sentence a buyer might type. Nor do you need to. A smaller, deliberately constructed prompt set is more useful than a large collection of loosely related questions because every prompt has a known purpose in the measurement plan.

    Start by defining your territory of authority. It sits where three things overlap: questions your audience needs help answering, knowledge your organization has earned through direct work, and subjects your products or specialists can credibly address. That boundary prevents your prompt map from becoming a list of every topic remotely connected to the category.

    1. Choose a commercially relevant problem. Write the central question your organization is qualified to answer. Keep it narrower than the whole market.
    2. Create a prompt family for every stage. Begin with the problem, move into approaches and criteria, introduce realistic qualification requirements, and finish with named-brand validation.
    3. Add only meaningful qualifiers. Include a persona, company profile, technology requirement, pain point, or priority when it could alter which answer is suitable. Do not generate variants merely by changing the wording.
    4. Record the expected association. State what a correct response should connect your brand with. This must be a supportable claim, not the answer you wish an AI system would produce.
    5. Freeze a benchmark set. Preserve the exact prompt wording and record the platform, date, and other test conditions available to you. Add exploratory prompts separately so the benchmark remains interpretable.

    For a company serving onboarding teams, one prompt family could progress like this:

    • Awareness: Why are new customers failing to complete onboarding?
    • Consideration: What approaches help a mid-market software company reduce onboarding delays?
    • Evaluation: Which onboarding platforms support our required workflow and integrate with our existing system?
    • Decision: What are the limitations of [Brand] for our onboarding use case?

    The point is not to predict the buyer’s exact wording. It is to preserve the change in intent. If you test only broad best-product prompts, you will miss whether the brand is understood before the shortlist forms and whether it remains eligible after the buyer applies real constraints.

    Give every benchmark prompt a record containing:

    • A stable prompt ID and funnel stage.
    • The underlying problem, persona, and meaningful qualifiers.
    • The exact prompt wording used for the benchmark.
    • The truthful brand association or fact being tested.
    • Brand inclusion, owned-page citation, and recommendation status.
    • How the brand is described, including strengths and limitations.
    • Competitors included and the criteria used to include them.
    • URLs or other evidence presented in the response.
    • Any inaccurate, incomplete, stale, or unsupported claim.
    • The platform, test date, and available test conditions.

    Establish this baseline before publishing a new wave of content or starting a community program. Review search results, repeat the fixed AI prompts, inspect community perception, and audit whether owned content answers the questions people actually ask. A useful baseline records descriptions, sentiment, recurring concerns, recommendation contexts, and cited evidence – not just mention volume. That is how you distinguish a familiar brand name from a brand that is correctly understood.

    Give every stage the evidence it needs

    A prompt map is diagnostic. It tells you where visibility fails, but the remedy depends on the stage. Publishing more generic content will not repair a missing integration fact in an evaluation response, just as adding another comparison page will not establish authority around an early-stage problem.

    • Awareness content should clarify the problem. Explain symptoms, causes, terminology, diagnostic questions, and reasonable next steps. Help the reader recognize the situation without forcing a product into every paragraph.
    • Consideration content should connect the problem to possible approaches. Explain how solution categories work, what capabilities matter, where each approach fits, and which criteria separate a useful option from an unsuitable one.
    • Evaluation content should establish eligibility. Cover supported use cases, relevant integrations, operational requirements, comparisons, alternatives, and meaningful trade-offs. A page that targets a qualifier your product does not satisfy creates misleading visibility rather than useful visibility.
    • Decision content should become the canonical factual layer. Keep pricing, compatibility, implementation requirements, limitations, and other validation details consistent wherever you publish them. Address uncomfortable objections directly instead of leaving third parties to define them.

    Do not reduce this work to page formats. A comparison page with vague claims supplies less decision evidence than a focused support page that states exactly what works, what does not, and under which conditions. The content job is to make the required evidence explicit and internally consistent.

    Community participation provides a different kind of evidence. Relevant Reddit discussions can reveal the language people use, the alternatives they consider, the objections polished marketing pages avoid, and the criteria that actually decide a purchase. Those observations should feed your website, while accurate owned resources should give community teams dependable material for complex answers. Search intent, community context, owned depth, and ongoing monitoring should reinforce the same credible territory.

    Reddit is not a shortcut to a citation. Promotional replies with little practical value are likely to weaken trust in the community you are trying to understand. Participate only where you can answer the question on its own terms. Disclose your affiliation, respond directly, acknowledge limitations and trade-offs, and link only when the destination adds information the reply cannot reasonably contain. This native, transparent approach to community authority is slower than distributing promotional messages, but it produces more useful interactions and better inputs for your content program.

    Use a simple evidence loop:

    1. Capture a recurring question, objection, misconception, or decision criterion from search and community discussions.
    2. Match it to the relevant stage and benchmark prompt cluster.
    3. Update or create the owned resource that can answer it completely.
    4. Give customer-facing and community teams a clear factual reference.
    5. Re-run the relevant prompts and record whether the answer, description, citations, or recommendation context changed.

    JSON-LD belongs after the evidence is sound. Structured data can make the entities and relationships on a page more explicit to machines, but it cannot manufacture an unsupported product fit, repair contradictory pricing, or replace the experience and context supplied by independent discussions. Treat schema as a precise representation layer for content you can already defend.

    Measure exposure without confusing it with traffic

    An AI sphere illuminates several product objects, while only a few light paths continue toward a website doorway.

    Your scorecard should preserve several different outcomes. Collapsing them into one number recreates the problem the funnel map was meant to solve.

    • Stage inclusion rate: the share of benchmark prompts in a stage where the brand appears in a relevant capacity.
    • Owned citation rate: the share of stage prompts where an owned page is cited or linked. Keep this separate from brand inclusion because an answer may use your material without recommending your brand.
    • Category association rate: the share of consideration prompts that connect the brand with the appropriate solution category or capability.
    • Qualified shortlist rate: the share of evaluation prompts where the brand is recommended after the stated constraints are applied.
    • Representation accuracy: the proportion of reviewed brand claims that are current, complete enough for the question, and supported by your canonical information.
    • Competitor context: which alternatives appear, for which criteria, and whether your brand is framed as a peer, specialist, fallback, or unsuitable option.

    Keep the denominator stage-specific. Awareness inclusion should not compensate for inaccurate decision answers. A high citation rate should not conceal a weak shortlist rate. A branded mention should not be counted as discovery when the user supplied the name in the prompt.

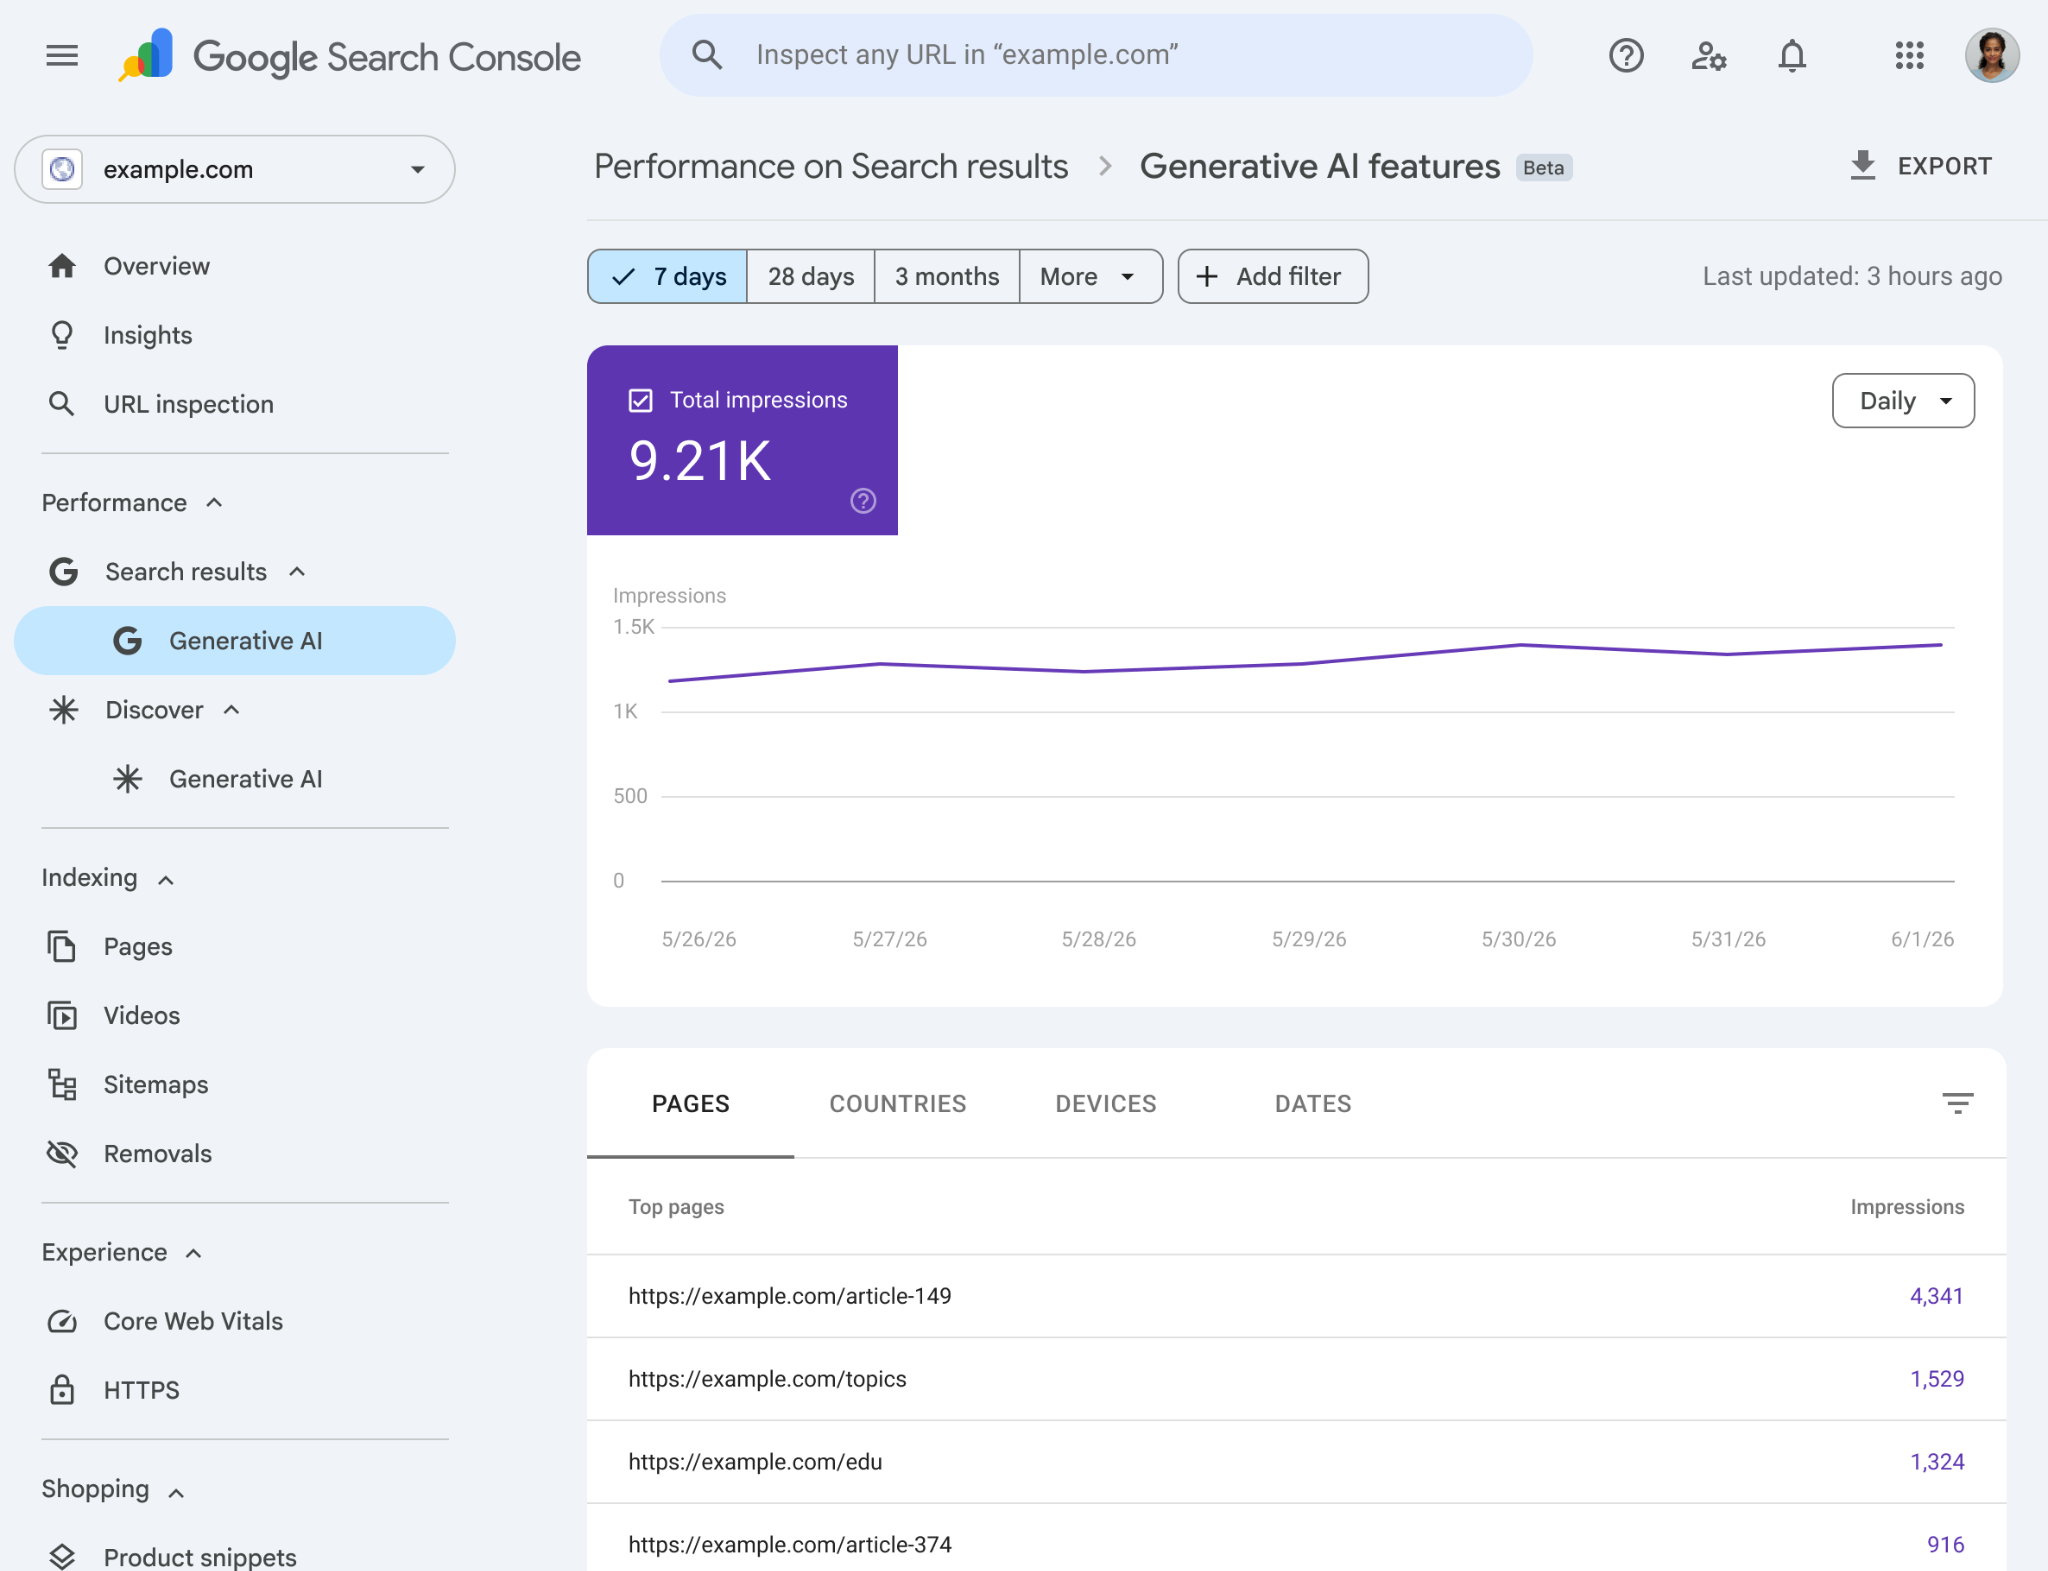
    Google Search Console now adds a second view of the problem. As of August 31, 2026, its AI performance reporting is available globally to Search Console accounts. It reports impressions for content appearing in AI responses, AI Mode, and AI Overviews, with breakdowns for pages, countries, devices, and dates. It does not include click data.

    Use that report as an exposure layer:

    • Identify which pages receive generative-search impressions.
    • Map those pages to the funnel stage they were designed to support.
    • Review changes across the available date, country, and device dimensions.
    • Compare exposed pages with the pages actually cited in your benchmark prompt checks.
    • Investigate why important stage-specific pages have prompt visibility but little reported exposure, or exposure without the brand representation you intended.

    Do not calculate an AI click-through rate from this report; the necessary click figure is not present. Do not infer visits or conversions from impressions either. Use your site analytics to evaluate any visits you can separately observe, and keep the claim narrow: Search Console tells you that exposure occurred, while prompt tracking tells you where and how your brand appeared within the buying journey.

    Search Console also provides a control for blocking content from Google’s generative search features, including AI Overviews, AI Mode, and AI Overviews in Discover. A site that opts out will not receive impressions or traffic from those generative features, while the choice is not used as a ranking signal for search results outside them. Treat this as a distribution and governance decision, not a way to repair weak content or inaccurate representation.

    Before changing that control, document the exact properties in scope, preserve your current baseline, and make sure the owner of the decision accepts the loss of generative exposure and possible traffic. If the problem is an outdated answer, correct the canonical facts and connected authority signals. Removing the site from the feature prevents participation; it does not improve the description buyers may encounter elsewhere.

    Turn each visibility gap into a specific action

    The funnel pattern matters more than the aggregate score. Read the pattern first, then choose the smallest intervention that supplies the missing evidence.

    • Strong decision visibility, weak awareness visibility: people who already know the brand can investigate it, but the brand is not entering earlier problem discovery. Build better problem education and participate in the communities where those problems are described in real language.
    • Strong awareness visibility, weak consideration visibility: your material may explain the issue without connecting your expertise to a suitable method or category. Add the bridge: approaches, mechanisms, capabilities, selection criteria, and explicit boundaries of fit.
    • Strong consideration visibility, weak evaluation visibility: the brand is associated with the category but disappears when requirements become specific. Identify the exact qualifier causing the drop, then publish evidence for supported integrations, use cases, customer profiles, or operating constraints. Do not create fit claims for criteria the product cannot meet.
    • Evaluation inclusion followed by inaccurate decision answers: the brand makes the shortlist, but validation material is stale, inconsistent, or incomplete. Correct canonical pages first, state limitations plainly, and address recurring misconceptions in appropriate community and support channels.
    • Owned pages are cited but the brand is not shortlisted: your content influences the explanation without proving supplier fit. Strengthen verifiable differentiation, use-case evidence, and transparent trade-offs instead of merely repeating the brand name more often.
    • The brand appears without owned citations: third parties may be carrying much of the representation. Monitor those descriptions closely and publish clear canonical facts that customers, communities, and answer systems can check.

    We would prioritize accuracy before reach. Incorrect pricing, compatibility, limitations, or implementation information in a high-intent answer deserves attention before a broad effort to increase awareness mentions. Next, address evaluation gaps that wrongly exclude a genuinely suitable product. Then expand early-stage authority where the brand has earned a reason to participate.

    For every intervention, create an action card with the funnel stage, affected prompt cluster, observed failure, missing evidence, planned content or community change, responsible owner, and next review date. This keeps a visibility diagnosis from dissolving into a generic instruction to publish more.

    Key takeaways

    • Measure awareness, consideration, evaluation, and decision prompts separately because a mention has a different meaning at each stage.
    • Track a compact benchmark set built around real changes in intent and meaningful buyer constraints.
    • Record citations, recommendation context, competitors, trade-offs, and factual accuracy instead of counting brand mentions alone.
    • Use owned content for depth, community participation for context, and structured data to represent evidence that already exists.
    • Treat Search Console’s AI report as exposure data, not click or conversion reporting, and treat its opt-out control as a distribution decision.

    Start with one important customer problem. Assign its existing pages and prompt families to the four stages, capture the baseline, and find the first point where a suitable brand disappears or becomes inaccurate. Fix that break with evidence you can defend, then measure the same prompts again.

    References


  • Google’s Generative AI Search Reporting Bug: What to Do

    Google’s Generative AI Search Reporting Bug: What to Do

    If your Google Search Console chart shows Generative AI impressions dropping sharply from August 13, 2026, don’t treat the line as evidence that your content disappeared from Google’s AI search experiences.

    Google has confirmed a logging error in the Generative AI in Search performance report. The affected impression data is unreliable, but Google says the problem is confined to reporting and does not represent a real change in Search visibility.

    What broke on August 13

    The problem affects impression logging in Google Search Console’s Generative AI in Search performance report. Data beginning August 13, 2026 may therefore show an artificial decline in impressions.

    That distinction matters. An impression decline normally invites questions about rankings, citations, eligibility, content quality, technical changes, or demand. This particular decline can originate inside the measurement system instead. Google described the logging problem as ongoing and said it was working on a resolution.

    Google also planned to add an annotation in Search Console. An annotation can explain the discontinuity, but it does not make the affected values suitable for trend analysis. Until Google confirms the outcome of the repair, regard impressions from the affected period as incomplete rather than as a new performance baseline.

    Check whether your decline matches the confirmed anomaly

    An analyst compares three abstract data panels, one with a disrupted signal and two with steady signals, beside a row of blank calendar tiles.

    A known reporting bug is not a reason to dismiss every decline automatically. Match the shape and timing of your data to the confirmed problem before changing how you report it.

    1. Open the Generative AI in Search performance report in Google Search Console.
    2. Choose a date range that includes several days before and after August 13, 2026. This makes the break easier to distinguish from an existing decline.
    3. Inspect impressions specifically. The confirmed problem is a decrease caused by impression logging, so don’t assume the notice explains an unrelated metric.
    4. Identify the first affected date. A conspicuous impression break beginning on August 13 fits the documented anomaly; a decline that began earlier needs a separate explanation.
    5. Record the affected property, report, metric, and start date in your own reporting notes. That prevents the anomaly from being mistaken for a genuine loss during a later review.

    If the timing or metric does not match, continue the normal investigation. Check the relevant Search Console views, analytics data, site releases, indexing signals, and demand patterns on their own terms. The confirmed bug has a defined scope; it is not a universal explanation for poor performance.

    Do not make SEO or AI visibility changes from this chart alone

    The immediate risk is not the faulty line itself. It is reacting to that line as though it measured a real loss.

    • Do not roll back content solely because affected impressions fell. The report cannot establish that the content change caused the decline.
    • Do not rewrite pages or alter structured data solely to recover the missing impressions. A logging failure is not evidence of a relevance, schema, or eligibility problem.
    • Do not declare an AI visibility loss to clients or executives. Label the period as affected by a confirmed reporting anomaly.
    • Do not compare the affected period with an earlier clean period as if both were measured consistently. The resulting percentage would mix valid and incomplete impression logging.
    • Do not set a new baseline from the depressed values. Forecasts, targets, and alerts built on an artificial trough will remain distorted even after reporting stabilizes.

    You can still investigate independent evidence if you have a broader reason for concern. The crucial point is causal discipline: the affected Search Console impression series cannot, by itself, justify a diagnosis or an optimization change.

    How to communicate the dip without overstating it

    An analyst calmly briefs three colleagues using a display that shows a disrupted measurement stream beside a separate steady signal.

    Use a short annotation that separates the observed chart movement from its meaning. For example: “Generative AI in Search impressions are incomplete from August 13, 2026 because of a confirmed Google Search Console logging error. Google says this is not representative of a Search visibility change.”

    That wording does three jobs. It identifies the affected metric, establishes the start date, and prevents an instrumentation problem from being reported as an SEO outcome. It also avoids claiming that traffic, conversions, or every other Search Console metric is unaffected; the confirmation specifically concerns the impression decrease in this report.

    Apply the same annotation anywhere the series is reused, including exported reports, dashboards, scheduled summaries, and client commentary. If you omit it downstream, a stakeholder may encounter the unexplained decline without the context visible in Search Console.

    Key takeaways

    • A logging error can reduce reported impressions in the Generative AI in Search performance report from August 13, 2026 onward.
    • Google says the anomaly affects data logging and does not represent a real visibility change in Search.
    • Treat the affected impression values as unreliable; don’t use them to calculate a clean before-and-after performance change.
    • Investigate separately if the decline began before August 13 or concerns a different metric.
    • Annotate every report that reuses the affected series, and wait for confirmation before rebuilding comparisons or baselines.

    Recheck the data after Google resolves the problem

    A resolution and a historical correction are not necessarily the same event. The available confirmation says Google is working on the logging issue, but it does not establish whether every affected impression will be restored later.

    When Google marks the issue resolved, first check whether the values for August 13 onward were backfilled or whether only new data begins logging normally. Keep the anomaly annotation if the historical gap remains. If Google corrects the affected dates, rerun any comparison, forecast, or alert that previously included the faulty values.

    For now, preserve your current optimization plan unless independent evidence supports changing it. Mark the measurement break, exclude unreliable impressions from performance judgments, and revisit the affected range once Google clarifies what was repaired.

    References


  • Choosing an AI Model in 2026: Performance, Cost and Fit

    Choosing an AI Model in 2026: Performance, Cost and Fit

    The strongest AI model on a leaderboard is not automatically the right model for a product, research program or engineering team. Cost, latency, deployment control and input formats can matter as much as raw reasoning performance.

    A comparison reported by First Page Sage Blog evaluated 42 large language models and ranked 15 of them using benchmark, pricing and technical data available in June 2026. Its findings offer a useful starting point, provided buyers treat the ranking as a decision aid rather than a universal purchasing order.

    How the source built its model ranking

    The source weighted eight factors: the Artificial Analysis Intelligence Index at 25%, SWE-bench Verified at 20%, GPQA Diamond at 15%, and context window, output speed and blended API cost at 10% each. Supported modalities and open-weight availability each accounted for the remaining 5%.

    Those measures address different questions. SWE-bench Verified tests the resolution of real GitHub issues in a standardized environment, while GPQA Diamond focuses on graduate-level science questions. Context size indicates how much material a model can accept in one call; it does not, by itself, prove that the model will use every part of a long prompt effectively. Speed affects interactive experiences, and open weights can support self-hosting or fine-tuning without dependence on a single API vendor.

    When public data was missing, the source applied a conservative below-average score. That choice makes a complete ranking possible, but it can also push models with incomplete reporting below models with more extensive published results.

    Key takeaways

    • Claude Fable 5 led the composite ranking. First Page Sage reported an Intelligence Index score of 60, 95.0% on its standardized SWE-bench source and a blended price of $7.70 per million tokens.
    • GLM-5.2 stood out among open-weight choices. It was reported at 82.8% on SWE-bench Verified, with a $0.90 blended cost and an MIT license.
    • Qwen 3.7 Max was the speed leader. Its reported output rate of 198 tokens per second makes it especially relevant to interactive products.
    • DeepSeek V4 Flash had the lowest estimated blended price. The source listed it at about $0.15 per million tokens, while noting that its Intelligence Index score was unavailable.
    • No single benchmark settles the decision. Capability, latency, price, modalities, context and deployment requirements need to be considered together.

    Match the model to the workload

    The most useful way to read the reported results is by operating constraint. A team paying for failed reasoning has different priorities from one serving millions of short customer interactions.

    Primary needModel highlighted by the sourceReported reason to consider it
    Maximum overall capabilityClaude Fable 5Highest composite and standardized coding scores in the dataset
    Long-running software agentsClaude Opus 4.8Strong coding and command-line results at a lower price than Fable 5
    One multimodal platformGPT-5.5Text, vision, audio and image generation in one model
    Low-cost open-weight codingGLM-5.2Strong reported SWE-bench performance, MIT licensing and a $0.90 blended price
    High-speed user interfacesQwen 3.7 MaxFastest confirmed output rate in the comparison
    Scientific and multimodal researchGemini 3.1 Pro94.1% reported GPQA Diamond performance and support for text, vision, audio and video
    Lowest API costDeepSeek V4 FlashLowest estimated blended price in the dataset
    Self-hosted multimodal deploymentLlama 4 MaverickOpen weights and compatibility with major inference frameworks

    Where benchmark comparisons need caution

    The source explicitly warned that SWE-bench Verified results above roughly 80% should be interpreted carefully because of debate about saturation and practical utility. It also noted that standardized harness results may differ from developer-published figures produced with proprietary tools.

    Several entries carry additional uncertainty. MiniMax-M3’s 80.5% SWE-bench result was flagged for possible training-data contamination. Grok 4’s Intelligence Index was estimated rather than officially confirmed, while Llama 4 Maverick lacked published SWE-bench Verified and GPQA Diamond figures in the materials reviewed. GPT-5.3 Codex also lacked a standardized SWE-bench Verified result, and the listed Intelligence Index figure was preliminary.

    Pricing deserves similar scrutiny. A blended figure depends on the assumed balance of input and output tokens, while self-hosting introduces infrastructure and operational costs that an API price does not capture. Latency can also vary by provider even when the underlying model is the same.

    A practical way to make the final choice

    1. Define the task and the cost of an incorrect result.
    2. Eliminate models that fail hard requirements such as data residency, modalities, context capacity or licensing.
    3. Shortlist options using benchmark results that resemble the actual workload.
    4. Run the same representative test set against every shortlisted model.
    5. Measure quality, latency and total cost together, including retries and human review.

    Model rankings will continue to move, but a repeatable evaluation process is more durable than any leaderboard position. The best deployment is the one that meets a clearly defined quality threshold at an acceptable operational cost.


    Inspired by this post on First Page Sage Blog.


    crushpress.ai community screenshot
  • GPT-5.6 in Profound: Tiers and Workflow Implications

    GPT-5.6 in Profound: Tiers and Workflow Implications

    Profound has announced support for GPT-5.6, giving its users access to the model family through the platform’s existing AI workflows. The announcement emphasizes a choice among Sol, Terra, and Luna tiers rather than presenting GPT-5.6 as a single configuration for every task.

    The practical significance is workload matching: teams can consider different tiers for demanding reasoning and production-scale activity while evaluating whether the reported gains in capability, reliability, and efficiency hold for their own use cases.

    What GPT-5.6 support changes in Profound

    According to Profound’s announcement, GPT-5.6 is now available directly within the workflows supported by the platform. Profound characterizes it as OpenAI’s newest flagship model family and identifies advanced AI performance as the central reason for adding it.

    This is an integration announcement, not an independent benchmark. The source reports improvements in capability, reliability, and efficiency, but it does not provide test results, pricing, latency figures, context limits, or comparisons with earlier models. Those omissions matter when deciding whether the new option should replace an existing model or serve only selected workloads.

    Sol, Terra, and Luna introduce a tier-selection decision

    Profound says its GPT-5.6 support spans the Sol, Terra, and Luna tiers. It presents this range as a way to cover work extending from frontier reasoning to high-throughput production workloads, although the announcement does not assign detailed specifications or a fixed use case to each named tier.

    For teams, the important shift is therefore operational: model selection can be treated as a workload decision. A demanding research or reasoning task may call for a different balance than a repeatable, high-volume process. Without tier-level measurements in the source, however, buyers should avoid assuming which option will deliver the best quality, speed, or cost for a particular application.

    The workflows Profound expects to benefit

    Abstract task objects travel along branching illuminated paths through three differently scaled processing chambers before converging into organized outputs.

    The announcement highlights four areas: agentic workflows, coding, research, and enterprise knowledge work. These categories share a need for dependable handling of instructions and context, but they create different evaluation requirements.

    • Agentic workflows: Evaluate whether the selected tier follows multi-step instructions consistently and handles failure conditions appropriately.
    • Coding: Test against the languages, repositories, review practices, and validation tools used by the organization.
    • Research: Check source handling, factual accuracy, uncertainty, and the usefulness of generated synthesis.
    • Enterprise knowledge work: Examine performance with internal terminology, access controls, document retrieval, and required approval processes.

    These checks are general implementation practices rather than performance claims about GPT-5.6. Profound’s post identifies the target workflow categories but does not publish evidence for individual tasks within them.

    Key takeaways

    • Profound reports that GPT-5.6 is supported within its AI workflows.
    • The integration includes the Sol, Terra, and Luna tiers.
    • Profound positions the model family for uses ranging from advanced reasoning to high-throughput production.
    • Agentic systems, coding, research, and enterprise knowledge work are the principal use cases named in the announcement.
    • The post reports capability, reliability, and efficiency improvements but supplies no benchmarks or tier-level specifications.

    How teams can evaluate the integration responsibly

    A sensible evaluation begins with representative tasks rather than a broad platform-wide switch. Teams can define the required output quality, acceptable error patterns, response-time needs, and operating constraints for each workflow, then compare the available tiers under the same conditions.

    1. Select a small set of real tasks from each intended workflow.
    2. Define pass criteria before comparing model outputs.
    3. Record quality, consistency, failure modes, and human-review effort.
    4. Compare tiers without presuming that the same option will suit every workload.
    5. Expand adoption only where the results support Profound’s reported benefits.

    GPT-5.6 support broadens the choices available inside Profound, but the integration’s value will ultimately depend on how clearly organizations match those choices to their own work. More detailed tier documentation and workload-specific evidence would make that decision easier.

    References

  • How AI Is Rewiring Advertising, Commerce and Measurement

    How AI Is Rewiring Advertising, Commerce and Measurement

    AI-powered advertising is developing along several connected fronts rather than following a single path. Reports about Amazon Alexa+, YouTube’s Gemini-powered tools, and Google Search Console show AI entering the transaction, campaign-planning, and visibility-measurement stages of marketing.

    Together, these developments offer marketers a useful framework for evaluating AI products: identify the decision each tool supports, distinguish an optimization signal from proven business impact, and determine which parts of the customer journey remain unmeasured.

    Key takeaways

    • Amazon’s reported Alexa+ ad format turns the assistant into an advertising, product-discovery, and purchasing interface.
    • YouTube’s new tools use AI and expanded data to support trend research, creator selection, and creative optimization.
    • Google Search Console’s AI performance report provides visibility data, but the reported version does not include clicks.
    • These products cover different stages of marketing, so their signals should not be treated as interchangeable measures of success.

    Conversational ads compress the path to purchase

    A person speaks to a home voice assistant as a glowing path connects the conversation to an unbranded product and a purchase token.

    The report on Alexa+ Agentic Ads describes a format in which a person can encounter an offer, ask questions, compare options, check availability, and complete a purchase without leaving the Alexa conversation. The reported initial applications include dining and live events on Echo Show devices, with Papa Johns involved in food ordering and promotions connected to artists including Beck, Jill Scott, and Omar Courtz.

    According to that report, concert tickets can be placed in a buyer’s Ticketmaster account after purchase. In the restaurant example, Alexa+ can use previous interactions and preferences when suggesting an order. These are reported examples of how the format operates, not evidence that it has already produced higher conversion rates.

    The strategic change is larger than the addition of voice controls. A conventional digital ad commonly hands the customer to a separate site or application. In the Alexa+ model, the assistant can become the ad surface, product guide, and transaction interface. Amazon reportedly aims to reduce the abandonment associated with that handoff, but the source provides no campaign results with which to assess the effect.

    This model changes what an advertiser must prepare. Creative still has to generate interest, but the experience also depends on structured product information, current availability, clear choices, and a reliable transaction process. Brands therefore need to evaluate the quality of the conversation as carefully as the initial promotion. They also need explicit rules for recommendations, confirmations, and situations in which the assistant cannot complete a request.

    YouTube is applying AI before campaigns reach the customer

    Amazon’s reported format applies AI at the moment of consideration and purchase. YouTube’s tools address an earlier set of decisions: what audiences are watching, which creators may be relevant, and how campaign creative might be improved.

    The YouTube report says Google Ads’ Insights Finder now supplies more detailed YouTube trend information in the United States. It also reports the addition of selected Brand Pulse metrics, intended to give advertisers a combined view of paid and organic activity. A Content & Creator Insights API is described as giving agencies and partners more information about creators and their audiences for planning and selection.

    Gemini-powered recommendations represent another layer. The source says these suggestions are expected to offer guidance on visuals and other creative elements for Demand Gen campaigns. The timing matters when evaluating the announcement: the reported trend, brand, and creator capabilities should be distinguished from the creative recommendations described as forthcoming.

    Used together, the tools could support a workflow that begins with identifying an emerging topic, continues through creator and audience research, and then informs media and creative decisions. That can shorten the distance between data and action. It does not, by itself, establish that a trend caused a result, that a creator produced incremental demand, or that an AI recommendation will improve performance. Those questions still require campaign-level evaluation.

    AI visibility reporting does not yet equal attribution

    The Google Search Console report covers a different measurement problem: whether and where a site appears in Google’s AI-driven search experiences. It says the AI performance report includes impressions as well as breakdowns by page, country, device, and date. The reported version does not include click data.

    Access was described as an incremental rollout. The source reported sightings for sites in the United States, India, Switzerland, and other markets beyond the United Kingdom. It also relayed Google’s statement that feedback was being reviewed as availability expanded. This makes the feature a developing reporting surface rather than a uniformly available measurement standard.

    The absence of clicks defines what the report can and cannot answer. Impressions can help a publisher monitor AI visibility, locate pages that are appearing, and compare patterns across the available dimensions. They cannot show whether exposure generated a visit, assisted a sale, or changed customer behavior. Visibility is an important diagnostic signal, but it is not a substitute for traffic, conversion, or incrementality evidence.

    This distinction also clarifies the relationship among the three reports. Search Console offers an exposure-oriented view, YouTube supports research and campaign decisions, and Alexa+ is designed to carry a consumer through a transaction. A single label such as “AI performance” can obscure those differences. Marketers should instead identify where each signal sits in the journey and avoid combining unlike measures into one headline indicator.

    A measurement model for AI-mediated advertising

    An isometric illustration shows audience and device signals passing through an AI system, with some paths reaching a purchase outcome and others fading.

    Connect every signal to a decision

    A metric is most useful when its operational purpose is clear. AI-search impressions may guide content diagnosis, creator data may inform partnership research, and conversational-commerce outcomes may inform offer or transaction design. Assigning each signal to a decision prevents visibility, planning intelligence, and sales evidence from being treated as equivalent.

    Treat recommendations as testable hypotheses

    An AI-generated creative suggestion can accelerate analysis, but it should enter the campaign process as a hypothesis. Established methods such as controlled comparisons and consistent success criteria remain necessary to determine whether a proposed visual, message, or format improves the intended outcome.

    Measure the complete journey where possible

    Fewer interfaces can mean less customer friction, but they can also make familiar milestones less visible. Teams assessing an assistant-led purchase experience should establish which stages can be observed, how completed transactions are reconciled with campaign activity, and where the available platform reporting stops. Gaps should be recorded rather than filled with assumptions.

    Review the experience as well as the dashboard

    When an AI system explains an offer or recommends an option, its behavior becomes part of the brand experience. Evaluation should therefore cover the accuracy and clarity of responses, the handling of unavailable choices, and the transparency of purchase confirmation in addition to campaign metrics. This is especially important when the assistant performs several roles that were previously divided among an ad, landing page, product interface, and checkout.

    As these systems mature, the most durable advantage will come from measurement discipline: knowing when AI is acting as an interface, when it is supplying a planning signal, and when there is enough evidence to support a business conclusion.

    References

  • From Search Intent to Citation Share: Measuring AI Visibility

    From Search Intent to Citation Share: Measuring AI Visibility

    AI search visibility is becoming easier to observe, but measurement alone does not explain what content should change. Bing’s emerging reporting describes where a site appears across intents, topics and citations; the next-question intent framework examines whether its pages contain enough detail to support the comparisons and decisions behind those appearances.

    Used together, these perspectives create a practical loop: identify the contexts in which a site is being cited, inspect whether the underlying content supports the user’s full decision path, and then monitor how citation visibility changes.

    Two layers of intent explain different parts of visibility

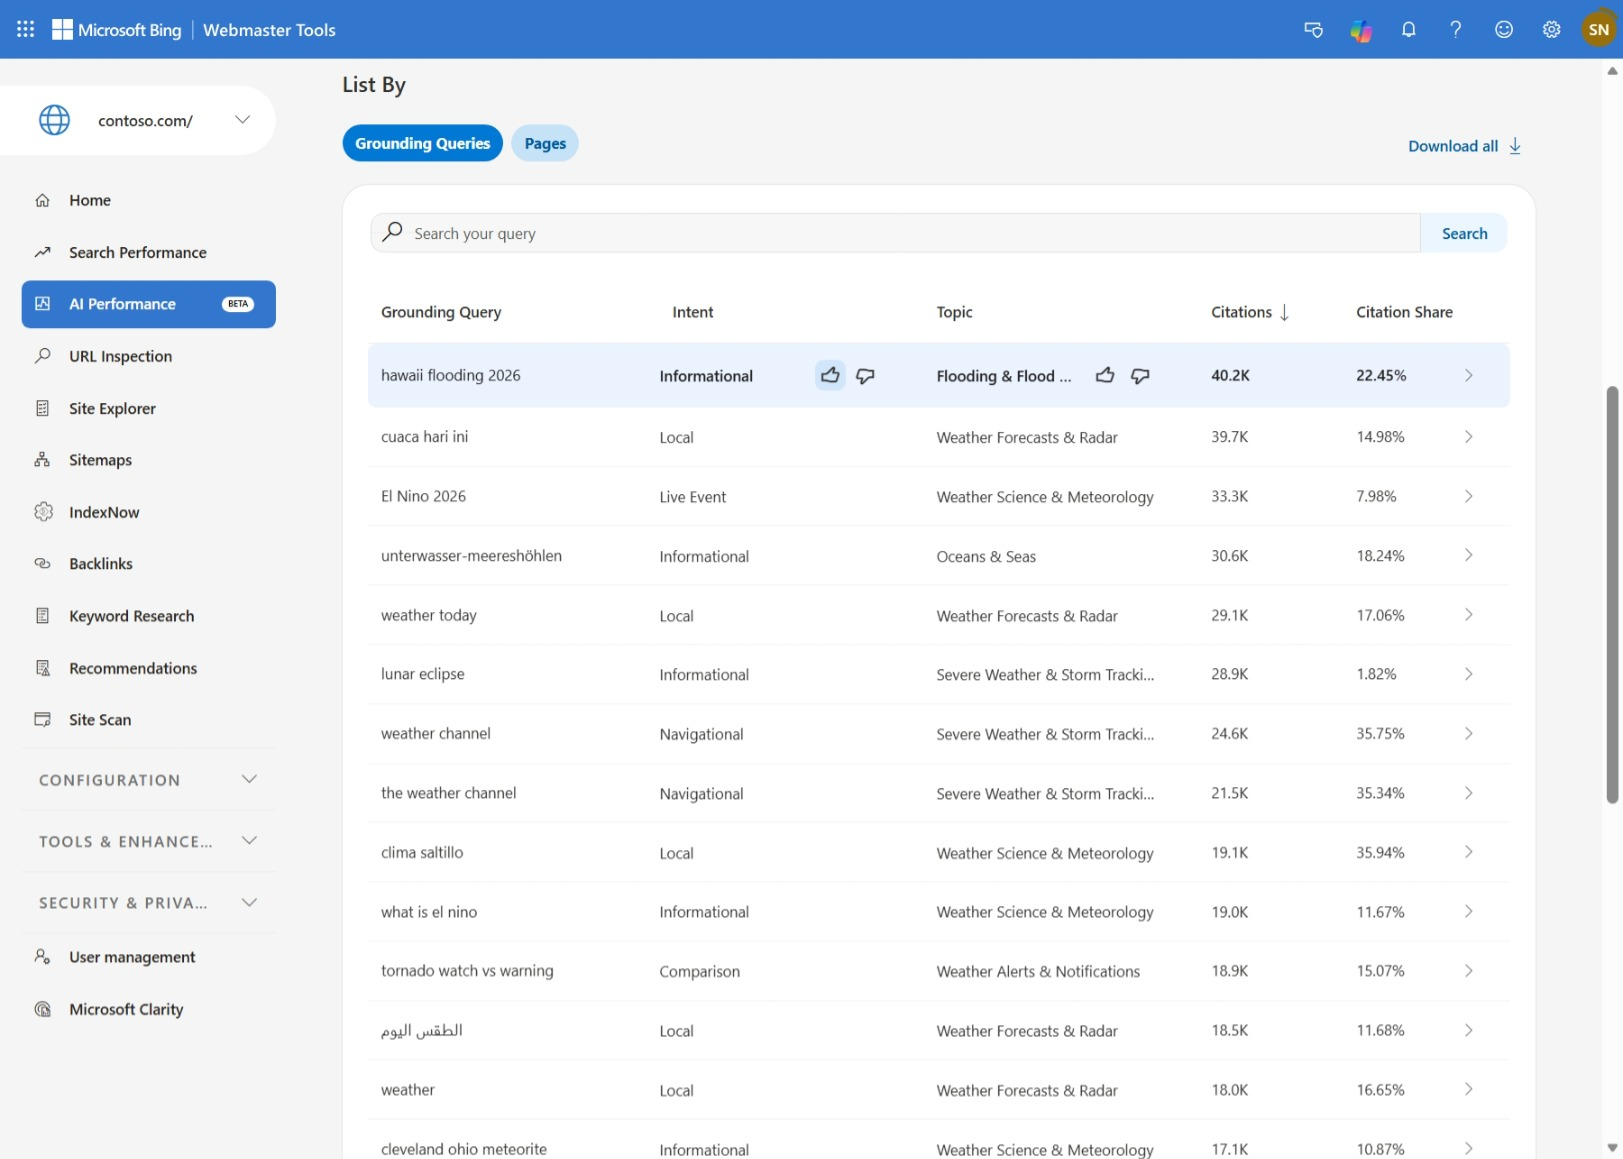
    The Bing reporting source says the preview of its enhanced AI performance report classifies grounding queries by intent, including Informational, Commercial and Navigational categories. This is a reporting layer: it helps publishers understand the broad purpose associated with the queries for which their content surfaces.

    Next-question intent is an editorial layer. The separate analysis defines it as the information a person will need after the opening query to compare options, establish trust or make a decision. A page can therefore match an initial commercial query while still failing to answer the more specific questions that determine which option is suitable.

    The distinction matters because the two concepts should not be treated as competing taxonomies. Reported intent describes an observed visibility context. Next-question intent helps diagnose whether a page has enough substance to remain useful as that context becomes more specific.

    Key takeaways

    • Bing’s reported intent and topic views organize AI visibility by user purpose and thematic context rather than isolated queries alone.
    • Citation Share and Compare provide directional evidence about visibility, but they are not rankings, quality scores or proof of business impact.
    • Next-question intent connects reporting to content decisions by identifying the follow-up information users need to trust, compare and choose.
    • The strongest workflow reads intent, topic and citation signals together, then validates the relevant pages for specificity, evidence and decision support.

    How Bing’s reporting dimensions fit together

    An isometric website tile connects to groups of intent gateways, topic spheres, and citation markers.

    According to the Bing reporting article, the new enhancements are being introduced globally as a preview. The source says Bing had launched its underlying AI performance report in February and that a similar Google Search Console feature arrived in June. Those dates and the characterization of Google’s release come from the source and are not independently verified here.

    Reporting dimensionWhat the source says it showsUseful question for publishers
    IntentsGrounding queries classified into broad purposes such as Informational, Commercial and NavigationalIn what kinds of user situations is the site appearing?
    TopicsRelated queries grouped into thematic clustersWhich broader subjects are producing visibility?
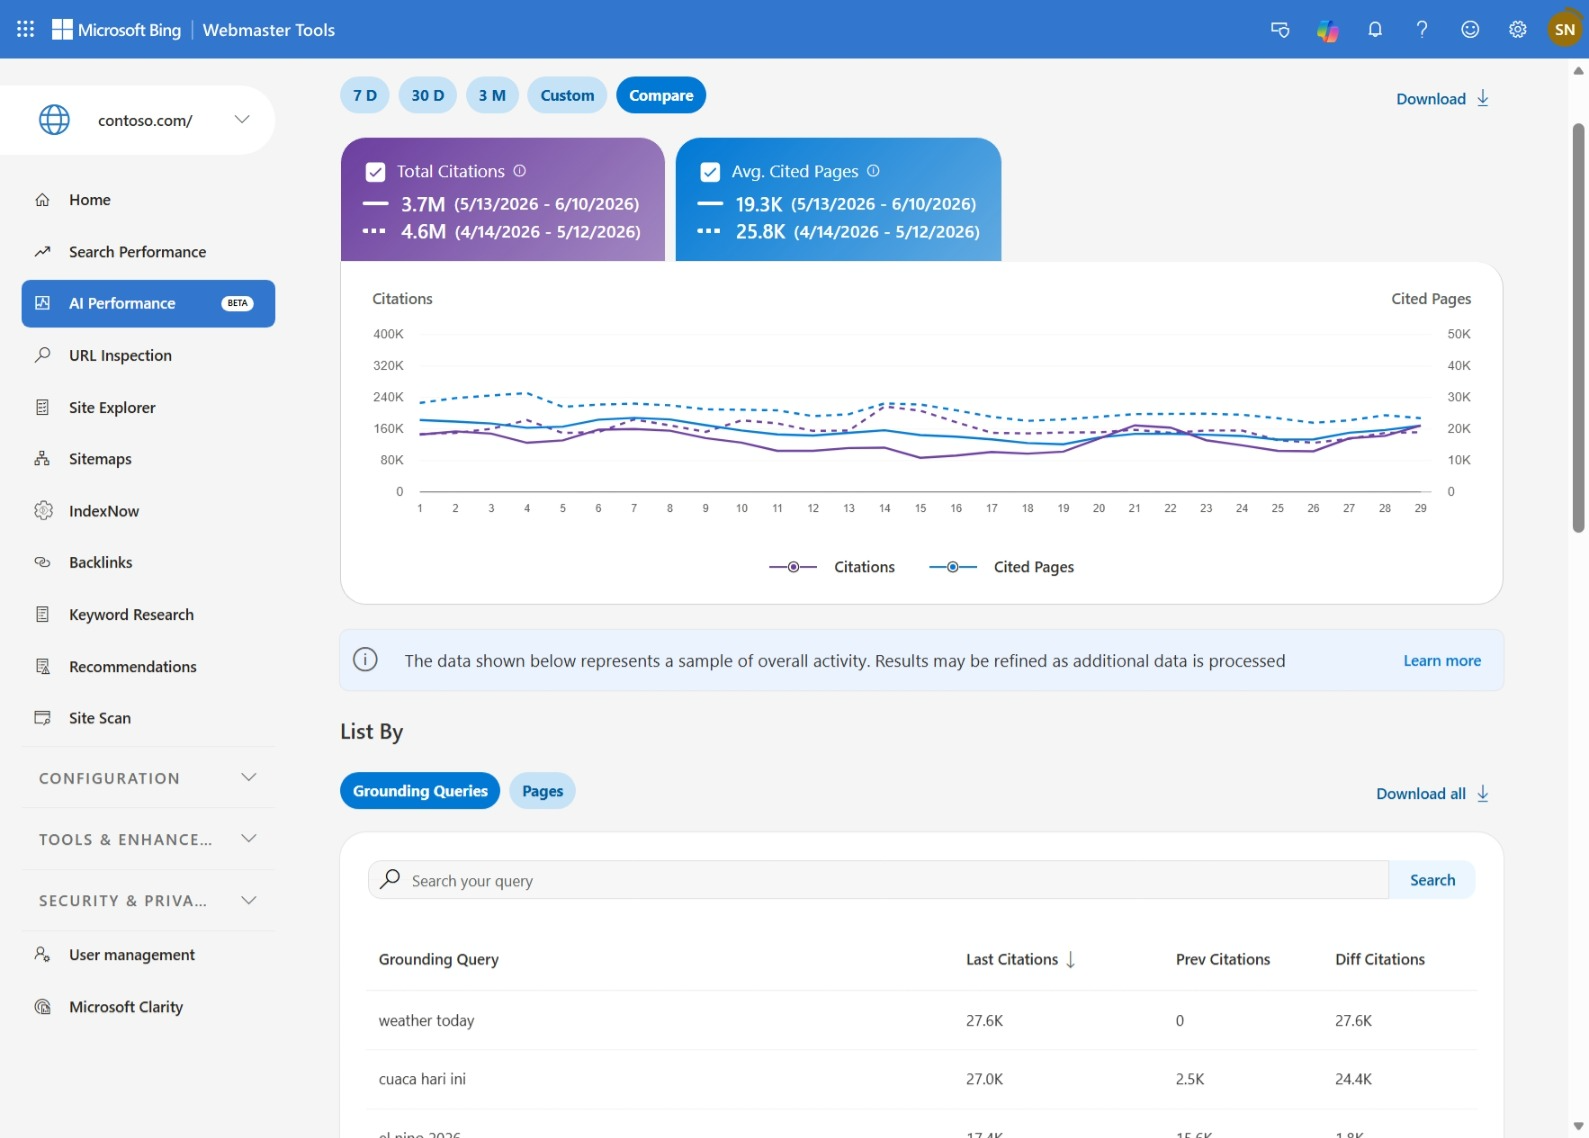
    Citation ShareThe site’s percentage of citation visibility relative to other sourcesIs the site’s presence expanding or contracting within the measured set?
    ComparePrevious data overlaid on current reportingHow has citation activity changed between the displayed periods?

    These dimensions become more informative when read as a sequence. An intent indicates the general task, a topic identifies the subject area, Citation Share supplies a relative visibility signal, and Compare adds a time dimension. No individual metric provides the whole explanation.

    The source illustrates topic clustering with queries about solar panels and solar energy efficiency being grouped under a broader Solar Energy theme. It also cautions that labels may remain broad for niche domains during the preview. Topic names should therefore be treated as navigational aids for analysis, not as exact descriptions of every underlying query.

    Next-question intent turns observations into content diagnosis

    A report might reveal visibility in commercial, comparison-oriented experiences, but it cannot by itself determine whether a page answers the questions that shape a purchase. The next-question analysis uses a search for the best customer relationship management software for a small business to make this problem concrete. The opening request does not settle which product fits a two-person team, integrates with QuickBooks, works without a formal sales department or suits a local service company.

    Those follow-ups expose the difference between category relevance and decision utility. A page can accurately describe several products yet give an AI system little usable material for distinguishing who each product serves, when it is appropriate, how it differs from alternatives or what supports its claims.

    The analysis applies the same test to broad brand language. Claims such as customized strategies, family safety or suitability for small businesses remain underspecified unless the page explains how the offer is customized, which family members are covered, or which kinds of small businesses are meant. This is not a call to make pages longer by default. It is a call to replace ambiguity with relevant conditions, distinctions and evidence.

    For an informational intent, the next question may concern method, limitations or applicability. For a commercial intent, it may concern trade-offs, compatibility or fit. For a navigational intent, it may concern the exact destination or action available there. These examples are an analytical extension of the source framework rather than categories reported by Bing.

    A reporting-to-content workflow for AI visibility

    A circular sequence links citation observation, branching questions, expanded content blocks, and ongoing monitoring.

    Start with the intersection of intent and topic rather than a sitewide citation total. A change within a particular context is more actionable than an aggregate movement because it narrows the pages and user needs that deserve investigation. Citation Share can then indicate whether the site’s relative presence in that measured environment is moving, while Compare provides the period-over-period view described by the Bing source.

    Next, inspect the pages associated with that context as decision resources. The relevant test is whether they explain what the offering or subject is, whom it applies to, when it is useful, how alternatives differ and what evidence supports consequential claims. The next-question source argues that this substantive layer gives AI systems material they can synthesize, compare and use in recommendations.

    Content changes should address identifiable gaps rather than chase a metric mechanically. If a page appears around a comparison topic but lacks selection criteria, the useful revision is to clarify fit and trade-offs. If a niche topic label is broad, analysis should begin with the underlying pages and their actual subject matter instead of assuming that the dashboard label precisely captures demand.

    Finally, monitor the same intent-topic context over time. The Bing source notes that citation activity can be affected by AI model updates, changes in user demand and other factors. A rise or fall after an edit is therefore a signal for further investigation, not automatic evidence that the edit caused the movement.

    What current visibility reporting cannot establish

    Citation visibility is not equivalent to a conventional ranking. The Bing article explicitly describes Citation Share as directional and says it does not provide a ranking or quality score. A citation also does not, on its own, show whether the user clicked, converted, trusted the source or ultimately selected the brand.

    The source further says click and click-through rate data were still awaited. Without those measures, the reported tools are best suited to visibility diagnosis and trend monitoring. They should not be presented as a complete attribution system or as proof of commercial performance.

    Next-question intent has a boundary as well: it is a framework for improving content utility, not a guaranteed formula for earning citations. Its value is in making pages more explicit and decision-ready while reporting supplies evidence about where visibility exists and how it changes.

    As AI reporting develops, the durable advantage will come from connecting clearer measurements to better editorial questions. Publishers that preserve the distinction between an observed citation, an inferred cause and a verified outcome will be better positioned to improve content without overstating what the dashboards prove.

    References

  • AI SEO Measurement: From Prompt Signals to Action

    AI SEO Measurement: From Prompt Signals to Action

    AI-era SEO measurement breaks down when a dashboard treats every generated answer as stable, every tracked prompt as representative, or every brand mention as a business result. A useful system must instead connect four questions: what people ask, how consistently AI systems respond, whether visibility changes user behavior, and what a team should do next.

    Together, the supplied reports point toward a practical operating model: observe real demand, sample variable responses systematically, connect visibility to outcomes, and convert findings into owned work. This approach extends established SEO measurement without pretending that AI answers behave like conventional rankings.

    Measure the demand behind AI visibility

    The first measurement problem occurs before an AI answer is generated: a tracking program must decide which prompts represent the audience. The prompt research summarized by CrushPress.AI suggests that the answer is not simply a library of elaborate, conversational questions.

    In a January 2026 Stella Rising survey cited by the publication, two-thirds of participants submitted prompts containing no more than 15 words, while about 12% produced what the researchers considered comprehensive prompts. The reported average for a basic shoe-recommendation scenario was eight words. The same article cited Semrush clickstream findings that placed average prompt length between 4.2 and 8.7 words. These reports indicate that short, keyword-shaped demand remains relevant even inside generative interfaces.

    Personal context creates a second demand layer. The January study reportedly found that 32% of users included details such as a role, situation, location, size, preference, or budget. Nearly a quarter used the word "best," while price language and "near me" phrasing also appeared. A brand may therefore be visible for a broad category prompt yet disappear when the request adds affordability, availability, suitability, or personal constraints.

    These results should be treated as directional. The article says the August 2025 research covered 178 members of a beauty-oriented community, whereas the January 2026 study covered 524 active AI users from a broader audience. Differences between the studies may reflect their samples as well as changing behavior. They do not establish a universal prompt distribution for every market.

    Design a prompt portfolio rather than a keyword substitute

    Hands arrange varied icon-based prompt tokens into several intent groups on a circular table.

    A representative prompt set needs several complementary inputs. Replacing a keyword list with synthetic questions merely changes the format of the same sampling problem. The stronger approach is a portfolio that covers distinct ways demand appears:

    • Short retrieval prompts: category, brand, location, price, comparison, and "best" queries that resemble conventional search behavior.
    • Context-rich prompts: requests that combine a need with personal attributes, constraints, use cases, or purchasing conditions.
    • Synthetic persona prompts: controlled scenarios used to test how representation changes across audience profiles.
    • Conversational journeys: linked turns that move from discovery through evaluation and selection.

    Real prompt language can be informed by customer inquiries, support tickets, on-site search behavior, sales conversations, and traditional search data. CrushPress.AI’s prompt-behavior article recommends combining such evidence with synthetic personas because a fabricated profile cannot fully reproduce the accumulated context of an ongoing AI interaction.

    The prompt-tracking report adds another distinction: a single-turn test shows whether a brand appears at one moment, while a sequence can reveal whether that visibility persists as the user narrows the decision. Persistence is especially important when an initial mention does not survive follow-up questions about requirements, competitors, pricing, or fit.

    The resulting portfolio should be segmented rather than collapsed into one visibility score. Short prompts, contextual prompts, personas, and journeys represent different questions about demand. Combining them without labels can make a change in the sample look like a change in brand performance.

    Quantify variable answers without manufacturing certainty

    AI responses vary, so one generated answer is an observation rather than a durable rank. CrushPress.AI’s prompt-tracking article argues that this variability can be managed through repeated runs, fixed sampling rules, and confidence intervals. It compares the emerging discipline with fields such as opinion polling, where uncertainty is measured rather than ignored.

    A repeatable measurement specification should identify the platform, prompt wording, conversational context, sampling schedule, number of observations, market conditions, and scoring rules. It should also preserve the underlying responses so that changes in a summary metric can be audited. When a platform or testing condition changes, the report should mark the break rather than present the series as perfectly continuous.

    Each run can record several observable outcomes: whether the brand was mentioned, whether it was recommended, which sources were cited, which competitors appeared, and whether the brand remained present in later turns. The appropriate output is a distribution, rate, or range across the sample, accompanied by its limitations. A movement based on repeated observations deserves more weight than an isolated favorable or unfavorable answer.

    Cross-platform reporting requires similar restraint. The tracking article notes that visibility can differ among AI services and uses brand performance across ChatGPT and Perplexity to illustrate the issue. Platform-level results should therefore remain visible even when an aggregate is provided; otherwise, strength in one environment can conceal weakness in another.

    Connect AI exposure to traffic, outcomes, and evidence

    Uneven light paths connect an abstract AI interface to a website, user behaviors, collected evidence, and prioritized work cards.

    Visibility is an intermediate signal, not the final business result. The prompt-behavior report says many surveyed users still clicked citations, presenting AI mentions as possible gateways to websites rather than automatic endpoints. It also reports that 68% of respondents trusted AI recommendations more than Google’s and that half of active AI users engaged with AI tools daily. Those figures come from the cited January 2026 survey and should not be generalized beyond its stated audience, but they explain why recommendation quality and referral behavior warrant measurement together.

    A practical measurement chain separates four levels. Prompt coverage shows whether the test set reflects meaningful demand. Answer visibility shows whether and how the brand appears. Referral and behavioral data show whether cited exposure produces visits or engagement. Conversion measures show whether those interactions contribute to leads, purchases, subscriptions, or another defined objective. Not every organization will be able to connect every level, so reports should distinguish observed outcomes from inferred influence.

    This distinction also improves prioritization. A visibility gap for a commercially important, frequently observed use case may justify content or technical work. A fluctuating mention for a speculative synthetic prompt may justify continued observation instead. Confidence, audience relevance, business value, and implementation cost all affect the decision.

    The Conductor post offers a vendor-side example of shortening the distance between insight and execution: it describes Conductor AEO intelligence integrated into Optimizely with pre-built agents intended to act on findings. The announcement demonstrates the direction of workflow integration, but it does not independently establish that automated actions improve visibility or business performance. Any such workflow still needs approval rules, outcome measurement, and a record of what changed.

    Convert findings into owned, decision-ready work

    The final failure point is organizational. The reporting article argues that research becomes useful only when stakeholders can see the priority, business rationale, responsible team, next action, and measurement plan. AI visibility data increases this need because its uncertainty can otherwise become a reason to delay every decision.

    1. State the finding and its evidence. Identify the affected prompt segment, platform, sample, observed range, and relevant citations or responses.
    2. Explain the business consequence. Connect the finding to an audience need, commercial page, reputation risk, or measurable journey stage.
    3. Choose the smallest meaningful action. Specify the content update, technical correction, authority-building task, product-data improvement, or additional test required.
    4. Assign ownership and timing. Name the responsible function and define when the work and its follow-up measurement should occur.
    5. Set an evaluation rule. Define which visibility, referral, engagement, or conversion signal would support continuing, revising, or stopping the intervention.

    The level of detail should change with the reader. Executives need exposure, risk, resource requirements, and expected business impact. Marketing leaders need the connection to demand and campaigns. Content teams need page-level briefs and audience context. Developers need reproducible technical requirements. Supporting exports and response logs can remain available without overwhelming the main decision document.

    Key takeaways

    • Preserve short, search-like prompts while adding personal, situational, and conversational variants.
    • Use real audience evidence and synthetic personas for different purposes; neither is a complete sample alone.
    • Measure repeated observations, uncertainty, platform differences, citations, and conversational persistence.
    • Treat visibility as one stage in a chain that ends with an assigned action and a defined outcome signal.

    As AI interfaces become more personalized and optimization tools become more integrated, the durable advantage will come from disciplined learning loops. Teams that preserve evidence, acknowledge uncertainty, and make each finding operational will be better positioned to adapt their SEO programs as user behavior and answer systems evolve.

    References

  • How to Prepare Your Store for Google’s AI Shopping System

    How to Prepare Your Store for Google’s AI Shopping System

    Your products can be easy to find in Google and still be poorly prepared for an AI-assisted purchase. Discovery is only the first test. A product must also be understood, matched with an eligible offer, placed in a cart, and purchased without its price, availability, or terms changing along the way.

    Google is connecting those jobs across Merchant Center, Google Ads, AI Mode, Gemini, Search, Maps, YouTube, Google Pay, and the Universal Commerce Protocol. If you manage ecommerce visibility, your work now extends from SEO and feed optimization to promotion rules, checkout integrity, and AI-specific measurement.

    Google’s shopping stack now connects four different jobs

    Google’s AI shopping ecosystem is easier to understand as a transaction path than as another search feature. At Google Marketing Live 2026, the company connected conversational product discovery, personalized promotions, cross-retailer carts, checkout, payments, and performance reporting.

    LayerWhat Google is addingWhat you control
    DiscoveryConversational Attributes and description updates for matching products to natural-language shopping requestsAccurate, complete, variant-specific product facts
    RecommendationDirect Offers selected with Gemini from eligible discounts, giveaways, local coupons, and bundlesOffer eligibility, commercial limits, exclusions, and campaign guardrails
    TransactionUCP connections among catalogs, carts, checkout, and paymentsReliable product, price, inventory, checkout, and order data
    MeasurementAI Performance Insights and competitive share-of-voice reportingThe business metrics used to judge whether visibility produces valuable orders

    This distinction matters because each layer can fail independently. A product can be eligible but never recommended. It can be recommended with an unsuitable promotion. The offer can be accepted, only for checkout to reject it. A high AI share of voice can also coexist with weak revenue or poor margins.

    Availability is uneven. Conversational Attributes are launching globally, while AI Performance Insights are expected in the United States, Australia, Canada, India, and New Zealand. Direct Offers remains a United States pilot. The new UCP-powered capabilities are rolling out in the United States, with wider expansion expected later. Account access and geography should therefore be go-or-no-go checks before you assign launch dates or forecast revenue.

    Make product data answer the shopper’s decision question

    A countertop appliance is surrounded by visual attribute tiles connected to symbols representing a shopper's needs.

    A conversational product description is not simply a conventional description rewritten in a friendlier tone. It should supply the facts an AI system needs when someone asks a question such as: Will this fit my situation? Which variant is appropriate? What limitation should I know about? What makes this option different from a similar one?

    Merchant Center’s Conversational Attributes let merchants add structured details and update descriptions that Google’s AI can use across AI Mode, Gemini, and other AI shopping environments. That makes factual coverage more valuable than decorative copy.

    1. Collect the questions that appear at the point of choice. Look at site search, product comparisons, support requests, sales conversations, and return reasons. Focus on questions whose answers would change which product or variant a shopper selects.
    2. Convert each answer into an atomic, verifiable fact. Useful areas can include intended use, compatibility, dimensions, materials, fit, included components, care requirements, prerequisites, and limitations. Include only the fields that genuinely apply to the product.
    3. Keep variant facts attached to the correct variant. If size, material, capacity, color, compatibility, or included components differ, a family-level description should not imply that every option has the same properties.
    4. Reconcile the value across Merchant Center, the product page, structured data, the cart, and checkout. Different wording is acceptable; a different factual answer is not.
    5. Remove unsupported superlatives and inferred use cases. An AI system should not have to decide what terms such as best, professional, safe, sustainable, or universal mean for your product.
    6. Record where each claim came from inside your business. Product specifications, policy owners, and approved commercial copy should be traceable so that outdated values can be corrected at their origin.

    Your JSON-LD should reinforce the same product identity and supported facts, but it should not be treated as a substitute for the Merchant Center feed. Use properties with literal, accurate values. Do not force conversational phrases into unsupported schema fields or create markup for claims that the visible product page cannot substantiate.

    A practical validation test is simple: choose a real pre-purchase question and follow its answer through the feed, landing page, selected variant, cart, and checkout. If the answer disappears or changes at any stage, you have a data-governance problem before you have an AI optimization problem.

    Put commercial guardrails around every AI-selected offer

    Direct Offers moves promotions closer to the recommendation itself. Advertisers can upload eligible promotions and campaign guardrails through Google Ads, after which Gemini can curate relevant bundles and discounts from the shopper’s query and browsing context.

    That does not make the AI your pricing strategist. Relevance can help choose among approved offers, but it cannot protect margins, inventory, channel commitments, or customer promises that you have not expressed as rules. Before making a promotion eligible, create an internal offer card that answers these questions:

    • Which offer type is this: discount, giveaway, local coupon, or bundle?
    • Which products and variants are included, and which are explicitly excluded?
    • Which locations, audiences, order conditions, or fulfillment methods qualify?
    • Can the offer be combined with another promotion, loyalty benefit, or payment incentive?
    • When does eligibility begin and end, and what happens to an in-progress cart after expiry?
    • Which inventory or fulfillment constraint should stop the offer from appearing?
    • What commercial boundary must the offer preserve, including margin and maximum exposure?
    • Where can the shopper verify the terms before committing to payment?
    • Has the exact offer been tested through the checkout route on which it will appear?

    AI-generated bundles deserve particular scrutiny. Define which items may be combined, how unavailable components are handled, whether substitutions are permitted, and which total prices are valid. If your rules cannot distinguish an attractive bundle from an unprofitable or unfulfillable one, do not make the components available for automated bundling yet.

    Native checkout increases the cost of an offer mismatch because there are fewer remaining steps in which to explain or correct it. The displayed promotion, cart calculation, checkout total, and payment amount must resolve to the same commercial promise. A silent price change at checkout is not an optimization issue; it is a customer-trust and revenue-control failure.

    Travel businesses should apply the same discipline to dates, inventory, inclusions, and cancellation terms. Booking and Expedia are expected to surface travel offers inside AI-assisted trip planning, where an appealing deal can become misleading quickly if its underlying availability or conditions are stale.

    Treat UCP readiness as a catalog-to-payment integration audit

    A cutaway commerce system connects a product catalog, guarded offer controls, a shopping cart, and a secure payment device on a workbench.

    The Universal Commerce Protocol is intended to connect product catalogs, checkout, and payment experiences across Google surfaces. Its Universal Cart can hold products from multiple retailers, with purchase completion through Google Pay or a retailer’s own checkout system.

    For a merchant, that creates more than one possible ending to the journey. You cannot assume that every shopper will pass through the same landing pages, cart interface, recovery messages, or payment presentation. The handoff itself needs to carry enough accurate state for each route to finish honestly.

    1. Confirm product identity. The catalog item, variant, cart line, checkout line, and order record should refer to the same purchasable thing.
    2. Confirm commercial truth. Price, currency, quantity, promotion eligibility, and final total should remain consistent as the shopper moves between systems.
    3. Test stale inventory. A newly unavailable variant should stop cleanly before payment, without being replaced by a different product or option unless the shopper explicitly approves it.
    4. Test expired and ineligible offers. Checkout should explain why an offer no longer applies instead of silently removing it or changing the total.
    5. Test every enabled payment route. Google has announced Affirm and Klarna buy now, pay later integrations with Google Pay, but you should not advertise a financing option until its availability and terms are confirmed for the actual transaction.
    6. Check the post-purchase handoff. Confirmation, customer support, order status, cancellation, and return instructions must still be available when the journey begins outside your normal storefront path.

    Test failure states as deliberately as the successful purchase. Use sold-out variants, expired promotions, rejected payment attempts, and transfers to the retailer checkout. The goal is not merely to prevent an error screen. It is to ensure that no failure produces a false product, price, entitlement, or order state.

    Google also expects UCP to expand into hotel bookings and food delivery. If you sell services or time-sensitive inventory, model dates, availability, fulfillment choices, and cancellation conditions as transaction data. Page copy alone cannot keep a changing reservation state accurate.

    Measure AI visibility without mistaking it for revenue

    AI Performance Insights is designed to show a brand’s performance across AI-driven environments, including share of voice compared with similar competitors. That is useful diagnostic information, but it is not a complete business outcome.

    Share of voice does not tell you by itself whether the right products appeared, whether an offer protected margin, whether a recommendation produced an order, or whether the order was later cancelled or returned. Build a measurement ladder that keeps those questions separate:

    • Data readiness: Track missing attributes, rejected items, variant inconsistencies, stale descriptions, and differences between the feed and product page.
    • AI visibility: Review AI share of voice and product presence by country and product family where reporting is available.
    • Offer performance: Separate eligible, surfaced, accepted, expired, and rejected promotions using the reporting and transaction data available to you.
    • Checkout integrity: Count price mismatches, inventory failures, promotion removals, payment failures, and transfers that do not complete successfully.
    • Business outcome: Evaluate completed orders, revenue, contribution, cancellations, returns, and support costs. A recommendation that creates a costly order is not a successful recommendation.

    Keep a change log for every material feed, attribute, offer, and checkout update. Record the affected products, markets, date, commercial rule, and transaction version. Compare equivalent segments before and after the change, and avoid combining a description rewrite, a new bundle, and a checkout migration into one untraceable launch.

    Ask Advisor is also expected to enter Merchant Center. Use advisory output to find questions worth investigating, not as proof that a diagnosis is correct. Your product records, promotion rules, checkout tests, and completed transactions remain the evidence.

    FAQ: Google’s AI shopping rollout

    Do you need UCP before optimizing for conversational discovery?
    No blanket dependency has been established in these launches. Conversational Attributes are Merchant Center discovery controls, while UCP connects carts, checkout, and payments. Run them as connected workstreams, but do not treat them as the same eligibility switch.

    Should you rewrite every product description in a conversational tone?
    No. Start with missing decision facts, variant accuracy, and consistency. Friendly prose cannot compensate for absent compatibility, fit, material, inclusion, or limitation data.

    Is AI share of voice a primary ecommerce KPI?
    It is better used as a visibility diagnostic. Pair it with offer acceptance, checkout integrity, completed orders, and unit economics before deciding that performance improved.

    Can Google decide which discount your store should offer?
    You supply eligible promotions and campaign guardrails. If an eligibility rule, exclusion, or economic boundary has not been defined and tested, keep that offer out of automated selection.

    Start with a commercially important product family that has clean variant data, dependable inventory, and an offer you can explain in one sentence. Complete its Merchant Center facts, define its promotion rules, test every enabled checkout route, and capture a performance baseline. Expand only after the full path remains accurate. In AI commerce, clear operational truth gives the system fewer opportunities to guess.

    References

  • How to Measure Realistic AI Productivity Gains at Work

    How to Measure Realistic AI Productivity Gains at Work

    An AI demo can collapse a visible task into a few prompts and still tell you almost nothing about productivity. The business question is whether the full workflow produces more accepted work, at the same or better quality, without quietly transferring effort to reviewers, managers, or downstream teams.

    If you need to set an AI target, evaluate a pilot, or defend an investment, measure the gain from the workflow boundary to the accepted result. That turns a promising time-saving claim into a decision you can trust.

    Key takeaways

    • A realistic AI productivity gain is net of preparation, prompting, review, correction, coordination, and failed outputs.
    • Measure labor per accepted output, not just generation time or the number of drafts produced.
    • Every percentage needs a named denominator, workflow boundary, baseline, and quality standard.
    • Released time becomes useful capacity only when the team can redirect it, remove a bottleneck, improve quality, or shorten delivery time.
    • Keep task efficiency, workflow efficiency, throughput, cost, and business value as separate claims.

    The usable gain is smaller than the visible time saving

    AI usually changes where work happens. Drafting may become quicker while context preparation, fact-checking, editing, escalation, and approval take more effort. A 25% efficiency gain can still matter, but its meaning depends on what became more efficient and whether the saved capacity survives the rest of the workflow.

    Separate the layers before you attach a productivity label:

    • Model speed: how quickly the system returns an output. This affects waiting time, but it is not a measure of human productivity by itself.
    • Task time: the active labor required for a bounded activity such as drafting metadata, classifying queries, or generating a first version of JSON-LD.
    • Workflow labor: all human effort from the request entering the process to the output passing its normal acceptance gate.
    • Accepted throughput: the amount of usable work completed within a defined period, after quality control and rework.
    • Business capacity: the additional work, faster delivery, lower operating burden, or higher quality the organization can actually use.

    Report the lowest layer you have genuinely measured. If your test covers only first-draft production, call the result a change in drafting time. Do not call it a change in content-team productivity. If you timed schema generation but excluded validation, page matching, deployment, and post-deployment checks, you measured generation rather than implementation.

    Use explicit calculations so hidden labor cannot disappear inside a headline:

    • Gross task saving equals baseline operator time minus AI-assisted operator time.
    • Net workflow saving equals gross task saving minus new preparation, review, correction, escalation, and coordination time.
    • Acceptance rate equals outputs passing the normal quality gate without material correction divided by outputs submitted for review.
    • Labor per accepted output equals total human labor across the workflow divided by the number of outputs that passed.
    • Cost per accepted output includes human labor, tooling, implementation, and rework rather than the AI subscription alone.

    The denominator matters as much as the result. Labor time per accepted brief, cost per validated schema deployment, and published pages per editor-hour are defined measures. AI productivity is not. It might refer to time, volume, cost, quality, or revenue, and those measures do not move in equal proportions.

    Measure the workflow, not the impressive task

    Isometric illustration of one work item moving through preparation, AI assistance, review, revision, and final handoff.

    Start by drawing a boundary around a unit of work that has a recognizable finish. A generated asset is not finished merely because the model stopped responding. It is finished when the person or system that normally receives it would accept it.

    Define the workflow in this order:

    • Name the unit. Examples include an approved content brief, a published landing page, a validated schema deployment, or a completed technical recommendation.
    • Mark the start. Use an observable event such as a complete request entering the queue, not the moment an operator opens the AI tool.
    • Mark the finish. Tie completion to the existing acceptance or publication gate.
    • List every role that touches the unit, including reviewers and specialists who handle exceptions.
    • Separate active labor from elapsed time. Waiting for an approval is different from the labor required to perform that approval.
    • Define rejection, material rework, and minor correction before the pilot begins.

    For a content workflow, the boundary may include intake, research, briefing, drafting, factual review, search optimization, brand review, CMS entry, quality assurance, and publication. For structured data, it may include identifying the entity, selecting appropriate properties, grounding claims in page content, generating JSON-LD, validating syntax, checking vocabulary use, confirming consistency with the visible page, deploying, and monitoring.

    This map exposes displaced effort. If AI reduces drafting labor but creates an editing queue, the drafting task improved while the workflow bottleneck moved. If the approval stage already limits throughput, sending it more drafts can increase work in progress without increasing published output.

    Choose a pilot workflow with repeatable units, a stable quality gate, and enough ordinary volume to show variation. A one-off strategy project may be valuable, but it is a poor first benchmark because the work changes from case to case. Repeated briefs, metadata updates, query classification, internal-link candidates, schema drafts, and standardized audit checks are easier to compare without pretending every unit is identical.

    Run a quality-adjusted before-and-after test

    Overhead view of two matched work lanes being evaluated with input folders, completed outputs, review materials, and timers.

    A credible baseline comes from normal work completed before the AI-assisted process begins. Use a representative mix rather than selecting unusually easy or painful cases. Record complexity in advance so a change in task mix cannot masquerade as a productivity gain.

    Build the test around the following controls:

    • Use the same workflow boundary, output definition, and acceptance gate in the baseline and assisted conditions.
    • Keep task categories and complexity bands visible. Compare like with like before combining results.
    • Record active labor for preparation, prompting, reviewing, correcting, coordinating, and escalating.
    • Track elapsed lead time separately so a faster task is not confused with a faster delivery process.
    • Log whether each output passed on first submission, required minor edits, required material rework, or was rejected.
    • Record the tool, model, configuration, prompt or template version, and human role involved. A material process change creates a new test condition.
    • Separate rollout costs from ongoing operating costs. Training and workflow design matter to the investment decision even when they do not recur for every unit.

    Do not let faster production lower the acceptance standard. Define quality in terms the workflow already understands. For SEO and AI-optimized content, that may include factual accuracy, completeness, intent fit, source traceability, brand compliance, internal consistency, and technical correctness. For JSON-LD, a syntax pass is necessary but not sufficient; the markup must also describe the visible content accurately and use the intended vocabulary appropriately.

    Make rework categories operational. A minor correction is something the reviewer can fix without reconsidering the approach. Material rework changes the argument, evidence, structure, entity model, implementation choice, or substantial portions of the output. Write those definitions before reviewers see pilot results. Otherwise, enthusiasm for the tool can turn serious revisions into minor edits after the fact.

    Your measurement sheet should include the workflow, accepted unit, task category, complexity band, owner, baseline active labor, assisted active labor, preparation time, review time, correction time, escalation time, elapsed lead time, first-pass status, final acceptance status, error class, tooling cost, and workflow version. Keep the raw observations. A single average hides whether the result is reliable across routine and difficult work.

    Use the median to describe a typical case and show the spread or range to expose variability. Segment results when complex work behaves differently from routine work. An overall improvement can conceal a serious decline in the cases where accuracy matters most.

    Convert released time into capacity the organization can use

    Net time saved is an operational input, not automatically a business result. The next question is what happened to that time. If it remains scattered across tiny fragments, sits behind another bottleneck, or appears in a role with no additional demand, it may not create more output.

    Decide which outcome you are targeting before the rollout:

    • More accepted output with the existing team.
    • Shorter lead time for the same output volume.
    • Higher quality, deeper analysis, or broader coverage without extending delivery time.
    • Lower overtime, fewer backlogs, or more resilience during demand spikes.
    • Capacity redirected to work that had been deferred or neglected.
    • Lower cost per accepted output after tooling and operating costs are included.

    These outcomes are all legitimate, but they are not interchangeable. Reduced labor per unit does not prove payroll savings. Claim a cash saving only when paid hours, contractor spend, hiring requirements, or another real cost changes. Otherwise, describe the result as released capacity and identify where that capacity went.

    Apply a bottleneck test before forecasting additional throughput:

    • Was the improved stage actually limiting the workflow?
    • Can the next stage absorb more volume without adding a queue?
    • Is there enough demand for additional accepted output?
    • Does the saved time arrive in usable blocks that can be scheduled elsewhere?
    • Does the team have authority and a plan to reassign that capacity?
    • Will higher volume create new review, publishing, governance, or maintenance work?

    If the answer to those questions is no, do not discard the gain. Classify it correctly. It may reduce interruptions, create a buffer, shorten a stage, or make quality work possible. Those benefits can matter even when total output stays flat. What matters is reporting the observed outcome rather than converting every saved minute into hypothetical production.

    A defensible result can fit into a single reporting sentence: In the named workflow and task category, the AI-assisted process changed median active labor per accepted unit from the baseline to the measured assisted level after preparation, review, and rework; first-pass acceptance changed from the baseline rate to the assisted rate; the team redirected the resulting capacity to the stated use; and tooling plus rollout costs were recorded separately.

    Start with a single bounded workflow. Pull a representative batch of completed work, define its accepted unit, map every human touch, and capture the baseline before introducing AI. Then run the assisted process through the same gate. A modest gain that survives review and becomes usable capacity is worth more than a dramatic demo that disappears in production.

    References