Recently, I’ve noticed that Google has started using Gemini 3 Pro to create AI Overviews on their search platform. This change primarily enhances the handling of more complex search queries.
Back in November, Google announced this improvement for AI Mode results. Then, in December, they began implementing Gemini 3 Flash for AI Mode. Now, it’s exciting to see Google integrating Gemini 3 Pro for generating AI Overviews.
Gemini 3 Pro is now crafting AI Overviews for complicated queries in English, accessible globally to all Google AI Pro & Ultra subscribers.
What Google Shared with Us. Robby Stein, VP of Product at Google Search, expressed this in his recent update:
“Update: AI Overviews now tap into Gemini 3 Pro for complex topics.”
“Behind the scenes, Search will intelligently route your toughest Qs to our frontier model (just like we do in AI Mode) while continuing to use faster models for simpler tasks.”
“Live in English globally for Google AI Pro & Ultra subs.”
Why It Matters to Me. The AI Overviews you see might look quite different than they did recently. Google’s consistent efforts to refine its Gemini models signify ongoing improvements in their AI technologies within Google Search, which includes both AI Overviews and AI Mode.
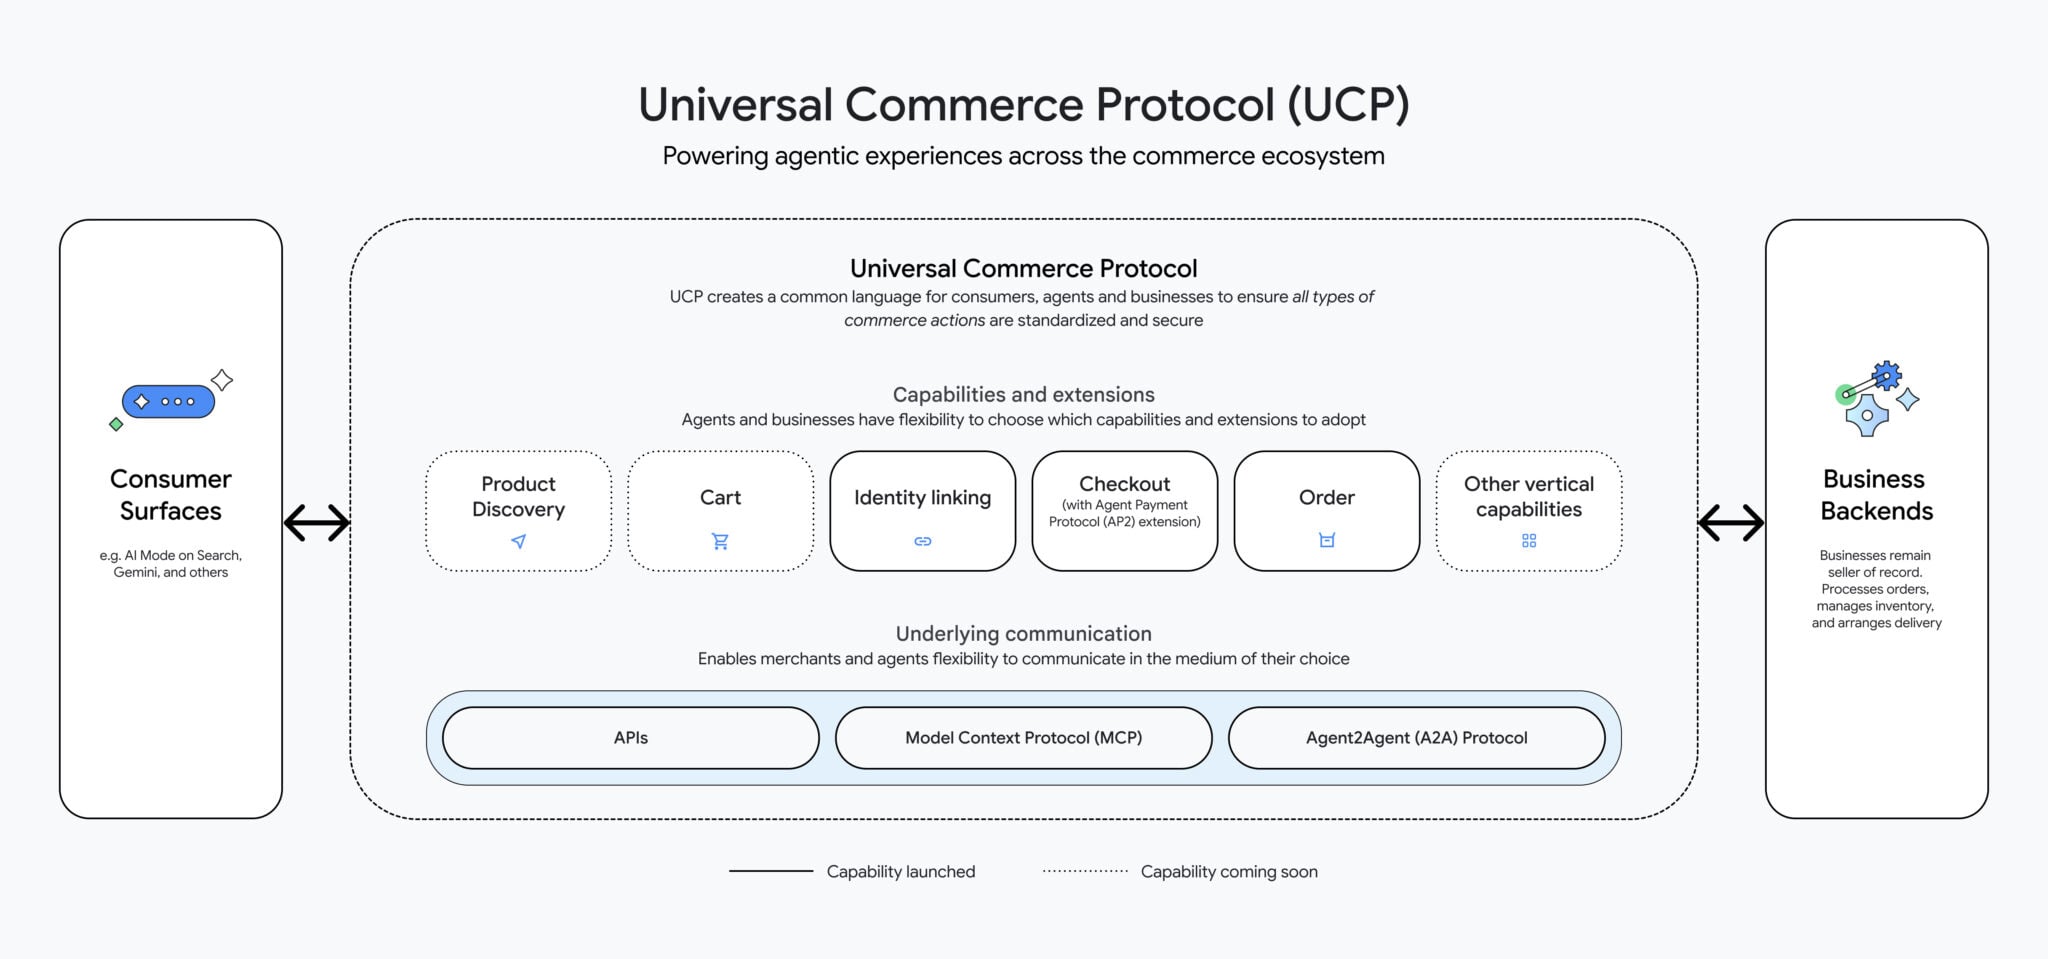
Have you heard the news? Google has just launched the Universal Commerce Protocol (UCP), an innovative open standard that integrates AI agents throughout the entire shopping experience. From discovering products to making purchases and even receiving support after the sale, UCP facilitates it all.
In exciting developments for retailers, Google is also rolling out new AI tools. These include branded shopping agents and ad formats that enhance AI-driven discovery, making the shopping experience more streamlined and engaging.
About UCP
This protocol offers a common language for AI agents and commerce systems, greatly simplifying the need for custom integrations across different platforms.
UCP is compatible with existing standards like Agent2Agent and the Model Context Protocol.
The protocol was co-developed with prominent partners such as Shopify, Etsy, Wayfair, and Target.
It’s already endorsed by over 20 additional companies in the retail and payments sectors.
What’s Changing
The UCP is set to enhance the checkout experience for Google product listings via AI Mode in Search and the Gemini app. Shoppers can make purchases through Google Pay, with options to use saved payment and shipping details. Integration with PayPal is also on the horizon.
Google aims to lower cart abandonment and provide retailers with tailored integration options suited to their needs.
Upcoming features include loyalty rewards and personalized shopping experiences.
Business Agent
In tandem with UCP, Google is unveiling the Business Agent, a branded AI assistant that provides shoppers with direct interaction opportunities on Search. Think of it as a virtual sales associate offering real-time responses in your brand’s own tone.
Major retailers like Lowe’s, Michael’s, Poshmark, and Reebok are already on board. Future capabilities may include deeper customization, data training, and a seamless agent-led checkout.
Direct Offer
Google is also testing Direct Offers, a fresh initiative within Google Ads tailored for AI adoption. When AI senses that a shopper is likely to make a purchase, a special discount can be presented.
This pilot will soon expand to incorporate offers such as product bundles, complimentary shipping, and more enticing incentives.
Why It Matters
The rise of agent-led shopping reshapes where and how buying choices are made. Google’s new AI tools and protocols are taking the lead, allowing advertisers to influence these pivotal moments during an AI-driven shopping journey.
Tools like Direct Offers and branded agents create new pathways for advertisers to finalize sales efficiently, all while safeguarding profit margins. The balance between conversion improvements and losses in direct site traffic remains an open discussion.
Bottom Line
According to Google, agentic shopping is unstoppable. With innovations like UCP and its complementary retail tools, Google ensures that AI-driven commerce remains inclusive and accessible, keeping retailers engaged as agents transform the buying landscape.
Google Ads has introduced exciting updates to its Creator Partnerships, making it easier for me to manage collaborations with YouTube talents on a larger scale.
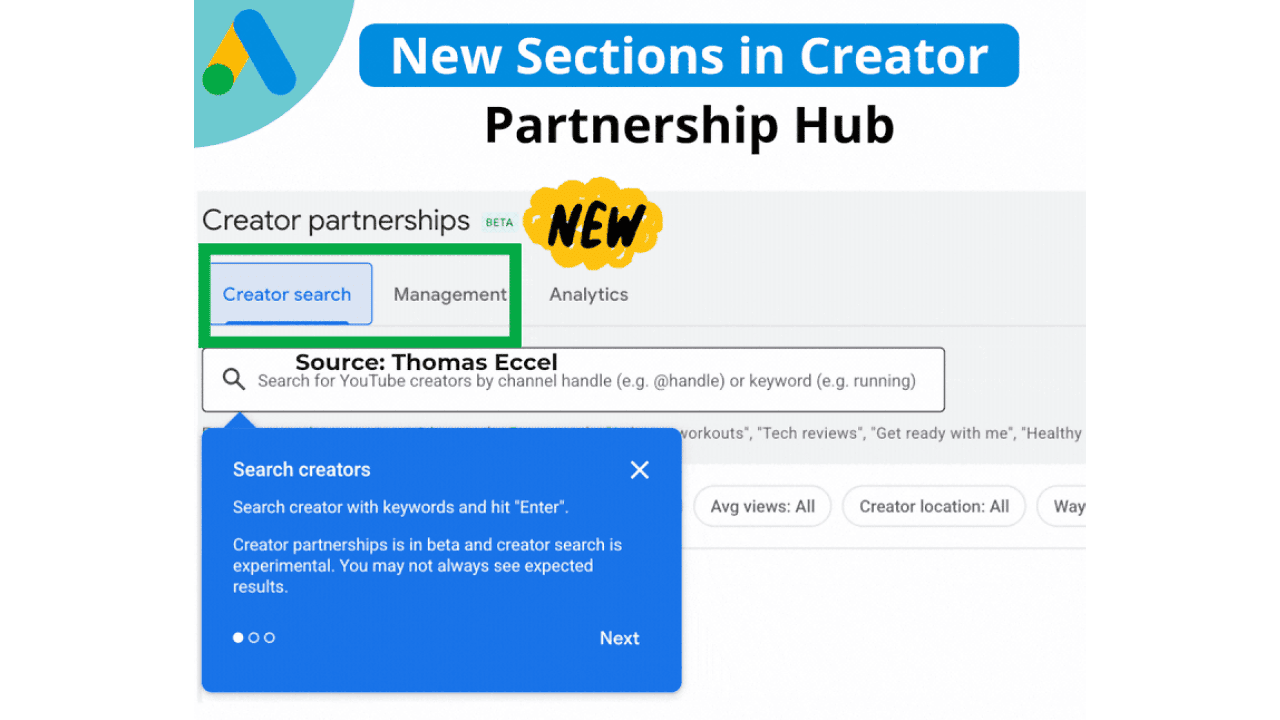
With the introduction of Creator Search, I can now effortlessly find YouTube creators by utilizing keywords or channel handles. This tool allows me to refine my search based on subscriber count, average views, location, and their availability for contact. It’s a game-changer, significantly cutting down the manual work involved in discovering and reaching out to creators.
In addition to the search feature, Google has unveiled a new Management section. This centralizes all communications with creators, allowing me to view their names, the status of inquiries, subjects, the latest updates, and scheduled response dates—all in one place with the convenience of direct email access.
Why this matters to me. As creator-led campaigns become a core aspect of media strategies, having better tools to identify the right collaborators and maintain organized partnerships is crucial. The latest enhancements to Google Ads’ Creator Partnerships (beta) cater to these needs perfectly.
First sightings. This update made headlines when Google Ads Specialist Thomas Eccel shared it on LinkedIn, making industry professionals eager to explore its capabilities.
The big picture. These upgrades are pushing Creator Partnerships closer to a comprehensive workflow tool, aiding teams like mine to manage creator collaborations with the same efficiency and accountability that we apply to other paid media endeavors.
Bottom line. By enhancing both discovery and organization, Google’s updates to Creator Partnerships empower me to execute creator campaigns at scale with ease.
As I type my search query in Google, I’ve noticed an interesting change. The usual AI Mode button is sometimes replaced by a striking blue ‘Send’ button right in the search box.
Google is currently testing this new feature. Traditionally, the AI Mode button appears on the right side of the search box, but it seems this might be changing. As soon as I start typing, the ‘Send’ button takes its place.
What it looks like. Recently, I came across a post by Shameem Adhikarath, who shared a video of this new feature on X.
From the video, it’s clear that when I start typing my query, the AI Mode, Lens, and Microphone buttons vanish, leaving behind this new blue ‘Send’ button.
Interestingly, the familiar plus sign remains unaffected, sticking around as always.
Why this matters. While this is currently just a test, it could have significant implications. If implemented, it might mean fewer users are directed to Google’s AI Mode, prompting more straightforward searches.
For those of us who rely on AI Mode, this change could make accessing it a bit more challenging, urging us to adjust how we initiate searches.
This past year, PPC has been anything but static – it has evolved. As I explored the insights from 2025, I found these articles resonated deeply. They addressed crucial questions like maintaining a competitive edge, eliminating wasteful spending, collaborating with automation, and gearing up for the future.
Join me as I take you through the links to the top 10 most-read PPC columns on Search Engine Land from 2025, crafted by our incredible experts.
Though it might seem challenging, even the smallest businesses can carve out their niche and captivate customers. Discover the strategies that make this possible. (By Sophie Logan. Published Sept. 16.)
Update your optimization techniques for 2025 with innovative approaches to keywords, Performance Max, and audience targeting. (By Pauline Jakober. Published Feb. 6.)
With increasing CPCs, understanding the pace of this inflation and comparing it to the consumer price index is essential for shaping your ad strategies. (By Mark Meyerson. Published April 16.)
AI is bridging the gap between organic and paid search. Learn how integrating SEO and PPC can enhance your visibility and brand presence. (By Jen Cornwell. Published Oct. 6.)
PPC scripts have limitations, but with vibe coding, you can remove obstacles and transform complex seasonal data into practical planning tools. (By Frederick Vallaeys. Published Aug. 21.)
Streamline your ad creation process without losing your core message. Leveraging generative AI can help craft engaging, personalized copy that truly connects. (By Jason Tabeling. Published Aug. 1.)
Discover filtering techniques that refine targeting, reduce unnecessary clicks, and reveal new keyword opportunities. (By Menachem Ani. Published July 22.)
Enhance your campaign management with Google Ads scripts. Uncover insights, actionable tips, and use cases for leveraging automation to improve performance. (By Frederick Vallaeys. Published Jan. 9.)
As clicks become scarcer, maintaining visibility requires precise targeting and value-based bidding. Achieving this ensures your prominence in both paid and organic searches. (By Sarah Stemen. Published Oct. 7.)
With Google’s environment becoming more automated, some PPC tactics are now obsolete. Discover what to eliminate and what to focus on for the coming year. (By Sarah Vlietstra. Published Nov. 4.)
2025 was a whirlwind year for those of us in the pay-per-click (PPC) marketing world, with changes coming fast and growing increasingly complex.
I noticed how significant many of Google’s updates were throughout the year, from the introduction of deeper automation with AI Max to ads being integrated directly into AI Overviews and more transparency and control being offered with Performance Max campaigns.
There were also key updates to Google Tag Manager and conversion tracking that really changed how I trust and collect data, not to mention the effects of policy shifts, automatic content extraction, and major advertisers like Amazon and Temu pulling back from Google Shopping, shaking up auction dynamics.
Now that 2025 is coming to a close, let me walk you through the headlines that caught my attention, ranked by pageviews.
10. Google changed how Tag Manager works with Google Ads
On March 10th, Google updated Google Tag Manager, ensuring that the Google tag would load before any events, thereby improving tracking accuracy and data collection from April 10th onwards. For me, this meant GTM automatically loaded the Google tag for containers with Google Ads and Floodlight tags, allowing simplified access to Enhanced Conversions and cross-domain tracking directly within tag settings.
9. Google Performance Max campaign API placement exclusions
On January 28th, Google revealed we can actually control Performance Max campaigns using API-based placement exclusions, overturning prior documentation and support guidance that stated otherwise. I found research from ad tech firm Optmyzr confirming that these API exclusions effectively blocked spending on excluded placements, providing stronger programmatic control over PMax campaigns.
8. Search Terms visibility in Google Performance Max campaigns
On March 21st, Google gave us the ability to see which search terms were triggering ads in Performance Max campaigns and introduced the option to add negative keywords directly from the Search Terms report, enhancing transparency and giving us more control.
7. Google Ads AI Max for Search campaigns beta
On May 6th, Google introduced AI Max, a one-click enhancement for Search campaigns, offering us the power of advanced AI to expand reach and dynamically generate ads, while adapting creative elements in real time.
6. Google AI Overviews ads
Starting May 22nd, Google began placing ads directly within AI Overviews, marking a significant shift in monetizing its generative search experience. This new feature was confirmed during Google Marketing Live 2025.
5. Google Ads allowed multiple ads for the same business on one results page
On March 31st, Google allowed the display of multiple ads for the same business on a single results page, provided they appeared in different locations, thereby opening up opportunities for larger brands to increase their visibility.
4. Google launched automatic marketing content extraction
On April 3rd, Google introduced a feature that automatically pulls existing marketing content from merchants to boost visibility across Search, Shopping, and Maps. Merchants were auto-enrolled, but could opt-out anytime?
3. Temu pulled its U.S. Google Shopping ads
On April 14th, Temu’s abrupt withdrawal of its U.S. Google Shopping ads revealed the heavy reliance on paid acquisition. This move, coinciding with increased tariffs and strict enforcement of import regulations, significantly impacted its market presence.
2. Amazon pulled out of Google Shopping ads
On July 25th, Amazon’s unexpected cessation of Google Shopping ads shook the market, given its historical role in driving auction competition and ad revenue. A month later, it resumed internationally but remained absent in the U.S.
1. Google Ads simplified conversion tracking with new tag manager feature
Google Ads, on February 5th, simplified conversion tracking within Google Tag Manager by introducing a wizard-style setup for creating conversion events without manual coding, revolutionizing my approach to tracking and optimization.
PPC in 2025 was undoubtedly dominated by major headline-worthy updates, largely centered around Google’s changes. Moving forward, I expect 2026 to bring even deeper AI integration. The real game-changer will be how expertly we can apply AI strategically.
Wow, what a whirlwind 2025 was in the ever-evolving world of SEO! I found myself constantly amazed at the pace of change, especially with the rise of GEO and AI-driven discoveries.
The incredible advances—from multi-platform searches to innovative AI applications—made this year truly groundbreaking. As I dove into these shifts, Search Engine Land remained my trusted guide, helping me navigate what’s happening, what’s on the horizon, and, most importantly, what really matters.
I’m thrilled to share with you the 10 most-read SEO columns of 2025. These pieces, penned by some of the best minds in the field, captivated and informed readers like never before.
Reflecting on another year in the world of search, I’ve seen how Google labeled 2025 as year three of a 10-year transformative shift. This change, centering on AI, became undeniably evident. No longer just an experiment, AI has now firmly integrated into the core processes of search.
Here, I’ll share the most significant SEO news stories of 2025 from Search Engine Land.
Note: This overview excludes Google algorithm updates, which Barry Schwartz has covered in a separate recap published today.
10. Perplexity Ranking Factors and Systems
Diving into the intricacies, independent researcher Metehan Yesilyurt examined browser-level interactions, revealing how Perplexity scores, ranks, and sometimes drops content. His findings uncovered a three-layer machine learning system reordering entity searches, manual authority whitelists, and many engagement signals.
He also observed that authoritative domains, early strong performance, and tech-focused topics received boosts. The ranking further mirrored time decay, interconnected content clusters, and trending YouTube content that amplified visibility.
In a move all about clarity, Google introduced Query groups to the Search Console Insights report. By employing AI, it groups similar search queries into distinct audience topics. These don’t influence rankings but make performance trends more apparent, especially for high-volume sites.
I was surprised to see HubSpot’s organic traffic plummet from 13.5 million to 8.6 million within a month, mainly impacting its blog. This followed several Google updates, with SEOs pointing to thin, broad content not aligned with HubSpot’s core expertise.
The ongoing identity debate in SEO continues as Google rejects new terminologies like GEO (generative engine optimization) and AEO (answer engine optimization). They maintain that strong SEO practices are also effective for GEO, underpinning AI Overview rankings’ fundamentals.
Yet, as AI answers replace clicks, traditional search still plays a vital role in discovery, despite search behavior evolving with users seeking AI for quick answers but relying on Google for extensive research.
The expansion of Google AI Mode from a trial to an almost default, comprehensive search experience was rapid. It incorporated more in-depth research, agentic activities, personalization, and the advanced Gemini 2.5—a drastic evolution toward complex search behaviors.
This AI Mode initially struggled with transparency, breaking referral tracking and merging its performance data with standard Search Console reports, sparking concerns over visibility and attribution in a more AI-centric search landscape.
When Cloudflare CEO Matthew Prince spoke about AI disrupting the web’s search-driven business model, it resonated with many. He highlighted the disproportionate relationship—Google and AI companies scrape extensive content while returning minimal traffic, jeopardizing original publishing unless the economic model adapts.
Seeing Google’s search share dip below 90% globally for the first time since 2015 was significant, driven by shifts in Asia and the U.S. This opened opportunities for Bing, Yandex, and Yahoo to capture some of Google’s shrinking share.
Google’s stricter stance on AI-generated content was clear when it instructed quality raters to assign the Lowest ratings to predominantly auto-generated pages. The expanded spam definitions targeted scaled, low-effort AI implementations.
Concurrent tests of AI-generated and AI-summarized search snippets indicated a future where AI not only critically examines content but also influences its presentation in searches.
I noticed analysis from various sources showing a troubling trend: Google Search offered more impressions and AI Overview visibility but resulted in fewer clicks. This was especially evident with non-branded, informational queries where AI Overview overshadowed classic results.
Brands mentioned in AI Overviews saw improved CTR, whereas those outside these features lost prominence, emphasizing that AI visibility is pivotal in driving successful outcomes.
Google’s removal of the &num=100 search parameter has widely impacted the SEO industry, disrupting rank-tracking tools and coinciding with a noticeable decrease in Google Search Console impressions and query counts.
Initial evaluations suggested that the majority of sites experienced reduced visibility, especially beyond Page 1, hinting at historic overreported metrics and a more realistic view of organic performance going forward.
As I delve into the intricacies of JavaScript and SEO, I came across a fascinating update from Google that caught my attention. It’s about how Google handles JavaScript execution on pages that don’t return a typical 200 HTTP status code.
Google recently updated their JavaScript SEO documentation to shed light on this topic. They explained that all pages with a 200 HTTP status code are automatically queued for rendering, irrespective of the presence of JavaScript.
However, if a page returns a non-200 status code, like a 404 error page, rendering might be bypassed, which is something Google emphasized in their updated guidelines.
Diving deeper, I discovered that Googlebot efficiently queues all pages with a 200 status code for rendering. This clarification came as a pleasant surprise to me as it paints a clearer picture of how Google handles such pages.
In fact, the specific section in the documentation that got an update provides a visual explanation, and I appreciated the added clarity it brings.
Google explained further that while pages with a 200 status code head to rendering, pages with other status codes might not meet the same fate.
Google’s weekly updates to the JavaScript SEO documentation also included other significant changes. Notably, they clarified aspects like JavaScript’s role in canonicalization and cautioned against using JavaScript for noindex tags directly in the original page code.
Why do we care about these updates? Well, understanding these nuances ensures I make informed decisions about my web pages. Ensuring my pages return a 200 status code is crucial; otherwise, Google might skip rendering them, which could negatively impact my website’s search ranking.
Recently, I’ve been exploring LinkedIn’s Reserved Ads feature, which is now open to all managed advertisers. This exciting update lets me secure the prized top-of-feed placement, fundamentally boosting visibility and engagement for my B2B campaigns.
LinkedIn has now made Reserved Ads accessible to all managed accounts, allowing me to grab the first ad slot in the feed. This prime location guarantees premium visibility for my advertising efforts.
What’s new. With Reserved Ads, I can secure top-of-feed placement at a consistent rate, ensuring predictable delivery and enhanced reach. According to LinkedIn, this format drives up to 75% higher dwell time, 88% higher view-through rates, and achieves 99% of forecasted impressions, making it a powerful choice for my marketing strategy.
How it works. These ads appear in the most visible ad slot on LinkedIn’s feed and support a variety of Sponsored Content formats like Video, Single Image, and Carousel Ads. My LinkedIn account representative assists me in reserving this valuable inventory and setting the pricing strategy.
Why we care. For me, LinkedIn Reserved Ads are a game-changer, providing guaranteed top-of-feed placement. This increases my campaign’s visibility and engagement, helping me stand out in the competitive B2B space. The premium positioning enhances brand recall and influences potential leads early in the funnel.
Explore the future of payments with Oustia's sleek new card reader! Secure, stylish, and efficient — the perfect tool for modern businesses.
The predictable delivery and fixed pricing models mean I can plan my campaigns with more certainty, while also building high-quality retargeting audiences for future conversions.
The big picture. By utilizing Reserved Ads, I’m effectively bridging brand awareness and demand generation. Anchoring my campaigns at the top of LinkedIn’s feed enables me to create higher-quality retargeting pools, with LinkedIn reporting up to a 101% increase in mid-funnel engagement as a result.
The bottom line. LinkedIn’s Reserved Ads provide me, as a B2B marketer, with a predictable way to command attention and transform it into significant demand.