Category: Google Search Console

  • Google Search Optimization and Reporting Without False Alarms

    Google Search Optimization and Reporting Without False Alarms

    Your Google Search numbers are down, AI search is changing how results appear, and someone wants an explanation before the data has finished arriving. The costly mistake is to edit pages first and investigate the measurement second.

    You need one operating system for both jobs: optimize content around durable search fundamentals, then report performance only after separating real movement from incomplete data. That keeps a reporting delay from becoming an unnecessary site-wide rewrite.

    Use one optimization foundation for traditional and AI search

    Google’s Nick Fox has been explicit that optimizing for Google’s AI experiences rests on the same fundamentals as traditional SEO: build an excellent site and publish content people genuinely want to use. His compact editorial test was, “Create what you’d want to read.”

    That guidance doesn’t prove that every Google interface selects, summarizes, or presents information in exactly the same way. It does give you a sound operating decision: don’t create a parallel content factory filled with lightly rewritten “AI pages.” Improve the page that should be the best answer, and make that page easy for both people and machines to understand.

    Before publishing or revising a page, make it pass these checks:

    • One primary job: define the question, task, or decision the page is meant to resolve. If the brief can’t state that job in one sentence, the page will usually drift across several intents.
    • An early answer: give the reader the central answer before asking them to navigate background material. Add qualifications where they change the decision, not as a wall of throat-clearing.
    • Clear evidence boundaries: distinguish documented facts, reasonable interpretation, and editorial advice. Name versions, platforms, or conditions when an instruction depends on them.
    • Useful structure: use descriptive headings that expose the page’s logic. A reader should be able to scan the headings and understand the route from question to decision.
    • Technical access: make sure the intended URL is accessible, indexable, internally linked, and canonically consistent. Excellent prose can’t perform in search if Google is directed away from the page.
    • A distinct contribution: add a useful explanation, decision rule, worked process, or clarification that isn’t already repeated across your own site. Consolidate overlapping pages instead of making them compete.

    Structured data belongs on top of that foundation. Use eligible schema to describe visible content accurately, keep the markup consistent with the page, and validate the implementation. Schema can clarify entities and relationships; it can’t supply missing evidence, repair a weak answer, or make an inaccessible URL useful.

    Give every meaningful optimization a measurement hypothesis before implementation. For example: this revision should increase visibility for a defined query group, improve clicks on an already-visible page, or replace several overlapping URLs with one stronger destination. A declared hypothesis tells you which Search Console dimensions to inspect later and prevents a vague traffic fluctuation from being credited to whichever change is most convenient.

    Build the report around decisions, not dashboard totals

    A useful performance report answers four questions in order: Is the dataset complete? What changed? Where did it change? What evidence would justify an action? A screenshot of total clicks answers only part of the second question.

    Use Search Console’s four headline metrics as diagnostic signals rather than four independent grades:

    • Impressions show how often pages entered measurable search-result visibility. A change can come from demand, eligibility, query mix, competition, or technical conditions, so impressions alone don’t identify a cause.
    • Clicks show visits sent from the measured search experience. Read them alongside impressions and the queries and pages responsible for the movement.
    • Click-through rate describes the relationship between clicks and impressions. It can change because of result presentation or query mix even when you haven’t changed a title or description.
    • Average position compresses many searches into one average. A different mix of queries can move it without producing an equivalent change in useful traffic.

    None of these metrics proves causation. Together, and at the right level of detail, they tell you where to investigate.

    Structure each reporting cycle in four layers:

    1. State the observation window. Show the dates included, whether the period is complete, and which comparison period you used.
    2. Describe the movement. Report the direction and location of the change without assigning a cause yet.
    3. Reduce the scope. Move from site totals to page groups, individual pages, queries, devices, countries, and relevant search appearances. Stop when one segment explains the material movement.
    4. Make the decision explicit. Say whether you will investigate, edit, consolidate, repair, test, or simply wait for complete data. Name the evidence required before the next action.

    Keep acquisition evidence and business evidence separate. Search Console can show how Google Search visibility and clicks changed. If the question is whether those visits produced leads, sales, sign-ups, or another outcome, pair the Search Console analysis with the appropriate analytics or business system. Don’t relabel a click increase as revenue impact when the report contains no revenue evidence.

    Record major publishing, migration, template, internal-linking, canonical, and robots changes on the same timeline as the metrics. The dates make those changes candidates for investigation; they don’t prove the changes caused the result. You still need a matching pattern, such as movement concentrated on the affected URLs rather than across unrelated sections.

    Check report freshness before explaining a rise or fall

    Glowing data packets move through a pipeline toward a console while the newest portion remains incomplete.

    Search Console reports don’t always refresh together. During one documented disruption, Performance data fell more than 70 hours behind and took about three weeks to return to an observed lag of roughly 2 to 6 hours. The Page indexing report remained delayed for nearly a month during the same broader period. A current Performance chart therefore didn’t make the aggregate indexing chart current.

    The practical lesson isn’t to adopt 2 to 6 hours as a guaranteed service level. It is to treat every report’s freshness as evidence that must be checked, recorded, and disclosed.

    Add this freshness protocol to every reporting run:

    1. Record the data-through date. Note the latest date represented in the Performance report, not merely the date you opened Search Console.
    2. Record each report’s status separately. Performance and Page indexing can have different update states. Never copy one freshness label across the entire report.
    3. Choose a complete cutoff. When a comparison depends on daily totals, end both periods at complete days. Don’t compare a partial latest day with a completed historical day.
    4. Label the conclusion. Use a simple state such as complete, preliminary, or delayed. Put it next to the finding rather than burying it in a footnote.
    5. Preserve the original snapshot. If delayed data later backfills, update the report while retaining the earlier version and its cutoff. Stakeholders can then see that the measurement changed, not the historical search activity.

    A compact freshness strip at the top of the report is enough: Performance data through, Performance update status, Page indexing update status, and reporting cutoff. This small block prevents a polished chart from implying more certainty than the underlying data supports.

    If a deadline arrives while data is delayed, don’t manufacture a trend. Report what is complete, identify the missing interval, and set a specific condition for revisiting the conclusion, such as the affected report clearing its backlog. “No conclusion yet” is a valid analytical result when the alternative is a confident claim built on missing observations.

    Use mismatched signals to choose the next check

    An analyst traces three conflicting streams of abstract indicators toward checks for delay, page changes, and connection problems.

    A disagreement between Performance and Page indexing isn’t automatically a contradiction. The reports answer different questions and may represent different update windows. Use the combination to decide what you can safely say.

    What you seeWhat you can concludeNext action
    Performance current; Page indexing currentThe reporting inputs are available through their stated cutoffs, but timing alone still doesn’t prove a cause.Segment the movement by page and query, then compare the affected scope with documented site changes.
    Performance delayed; Page indexing currentYou can discuss current coverage evidence, but you can’t make a complete search-performance claim for the missing interval.Move the performance cutoff back to complete data or hold the time-sensitive conclusion.
    Performance current; Page indexing delayedYou can discuss acquisition through the Performance cutoff, but the aggregate indexing report can’t prove current coverage.Label the indexing limitation and perform current URL-level checks on the small set of pages that affects the decision.
    Both reports delayedA fresh directional conclusion isn’t supported by those reports.State the last complete observation window, continue operational checks, and schedule the analysis after recovery.

    Once freshness is established, let the shape of the change determine the investigation:

    • Impressions fall across many unrelated sections: verify that the movement is genuinely broad before blaming one page edit. Review query and page distributions, then check whether a shared technical or template condition matches the affected scope.
    • Losses concentrate in one page group: inspect what those URLs share: intent, template, internal links, canonical treatment, or overlapping content. Don’t rewrite the rest of the site.
    • Clicks fall while impressions remain comparatively steady: inspect click-through rate, query mix, and the pages carrying the loss. A content rewrite is premature until you know whether the issue is relevance, presentation, or a different mix of searches.
    • Average position moves while clicks and impressions remain stable: inspect the underlying queries before escalating. The average may be describing a mix change that hasn’t materially affected acquisition.
    • A new or revised page has no usable performance data: confirm accessibility, indexability, canonical consistency, and internal discovery first. Then wait for a complete measurement window instead of repeatedly editing the page during the reporting gap.

    Apply the same discipline when a result looks positive. A rise that appears only in incomplete data, one country, one device class, or a newly added query group shouldn’t be presented as a site-wide optimization win. Locate the gain, verify that the comparison is complete, and connect it to a declared hypothesis before deciding what to repeat.

    Key takeaways

    • Traditional SEO and optimization for Google’s AI experiences share the same base: useful content, a strong site, clear structure, and reliable technical access.
    • Use schema to describe strong visible content accurately, not as a substitute for usefulness or indexability.
    • Start every report with the observation window and freshness state for each Search Console report you rely on.
    • Move from site totals to page and query detail before assigning a cause or changing content.
    • When reports are delayed or update at different times, narrow the claim, move the cutoff, or wait. Don’t turn missing data into a performance story.
    • Tie every optimization to a measurement hypothesis so the next report can support a decision rather than merely display movement.

    Before your next review, add the freshness strip, identify the pages and queries responsible for the largest material movement, and attach one evidence-based next action to each finding. That is enough to stop delayed data from triggering unnecessary edits and to turn Search Console reporting into a dependable optimization loop.

    References

  • Google Search Console Reporting Delays: What to Do Next

    Google Search Console Reporting Delays: What to Do Next

    You deploy an indexing fix, open Google Search Console, and find that the Page Indexing report still shows the old problem. Before you reopen tickets or change the site again, check the report’s data date. You may be looking at a stale measurement rather than a failed fix.

    A reporting delay changes what you can verify, not necessarily what Google is doing. The right response is to separate the age of the report from the state of the site, validate what you can independently, and give stakeholders an honest status without turning old counts into current facts.

    Read the report’s cutoff date before reading its numbers

    The Page Indexing report, also known by the older Index Coverage name, is a historical view. It shows which pages Google has found and indexed, identifies indexing problems, and lets you follow whether submitted fixes are recognized. When its processing is delayed, the interface can remain available while the newest underlying observations are missing.

    That makes the report’s last-updated date part of every conclusion. A current-looking chart with an old cutoff is still old evidence.

    1. Record the report date. Copy the last-updated date before exporting counts, taking screenshots, or comparing periods.
    2. Record the change date. Note when the fix became publicly available, which templates or URLs changed, and what condition you expected to disappear.
    3. Put the dates in order. If the report stops before the deployment, it cannot tell you whether the deployment worked.
    4. Limit the conclusion. Say that validation is pending because the reporting window has not reached the change. Do not label the fix successful or unsuccessful yet.

    In one confirmed incident, the Page Indexing data was delayed by about two weeks. That is an example, not a normal service-level expectation or a waiting rule for every future delay. Let the displayed cutoff, rather than an assumed timetable, determine what the report can support.

    Separate stale reporting from an actual indexing problem

    Split illustration showing website data delayed in an hourglass-shaped reporting pipeline while a separate indexing network remains active.

    A delayed report and an indexing problem are different conditions. They can also occur at the same time. You therefore need to identify what each observation proves instead of choosing the most reassuring explanation.

    Google confirmed during the documented delay that reporting was affected, not crawling, indexing, or ranking. That distinction matters: a frozen aggregate report is not evidence that Google stopped processing your site. It is equally important not to reverse the logic. A reporting delay does not prove that every affected URL is indexed correctly.

    What you observeWhat you can safely concludeWhat to do next
    The report’s cutoff predates your fixThe report contains no post-fix evidenceKeep the fix in place, validate the live implementation, and wait for the cutoff to advance
    The Page Indexing report remains stale across the propertyThe aggregate view is not currentDocument the cutoff and avoid presenting its totals as current-period results
    The cutoff advances beyond the fix, but the affected URLs still show the same exclusionFresh reporting still detects the conditionReopen the technical diagnosis using representative URLs
    A live URL has an unintended response, directive, canonical, or page stateA site-side issue exists independently of the reporting delayCorrect that implementation without waiting for the aggregate report

    Search visibility is not a clean substitute for the missing report. Rankings can change for reasons unrelated to indexing, and the absence of a result for one query does not isolate the cause. Use visibility as a separate performance signal, not as proof that the reporting pipeline is current.

    Use a verification workflow that does not depend on the stale chart

    Analyst workstation with a webpage, magnifying glass, server rack, and connected crawler nodes used to verify site status independently of a delayed dashboard.

    You cannot force an aggregate report to catch up, but you can determine whether the intended technical state is live. Work from a small set of representative URLs: one or more that received the fix, an unaffected control URL, and examples from each materially different template.

    1. Preserve the original evidence. Save the affected URL set, exclusion label, report cutoff, and pre-fix state. Without that baseline, it becomes difficult to tell whether a later change reflects your work or a different site change.
    2. Check the public response. Confirm that each representative URL loads as intended and that redirects or error responses are not sending Google somewhere unexpected.
    3. Check indexability controls. Review the rendered page and relevant directives for an unintended noindex instruction, robots restriction, or canonical target. Confirm that the live output, not merely the CMS setting, contains the intended value.
    4. Check discoverability where it matters. Verify that internal links and any relevant sitemap entries point to the preferred URL. A corrected page that is isolated from the site’s discovery paths can remain a separate technical problem.
    5. Use URL-level diagnostics carefully. Search Console’s URL Inspection tools can help you examine individual examples. Treat their findings as URL-level evidence, not proof that the aggregate Page Indexing report has refreshed.
    6. Stop changing the implementation if it is correct. Repeated edits made only to move a stale chart can introduce conflicting canonicals, directives, redirects, or deployment states. Preserve a technically sound fix until newer evidence justifies another change.
    7. Recheck when the data date advances. Once the report covers a period after deployment, review the affected group separately from the rest of the site. That is the first point at which the aggregate report can meaningfully validate the change.

    This workflow gives you two separate answers. The live checks tell you whether the implementation is currently correct. The refreshed Page Indexing report later tells you whether Google’s aggregate reporting recognizes the outcome. Do not collapse those answers into one status.

    Report the delay without turning stale data into a current KPI

    Reporting delays become most disruptive when a dashboard or client report expects a fresh number on a fixed date. The tempting shortcut is to copy the latest visible count into the current period. That makes the report look complete, but it silently changes an old observation into a new claim.

    If the data has not caught up, label it as pending. If a reporting template requires a value, carry forward the prior observation only with its original as-of date. Never place a stale count under the current period without a visible qualifier.

    A useful status update contains five elements:

    • Affected surface: Name the Page Indexing report rather than saying that all of Search Console is broken.
    • Data cutoff: State the last date represented in the report.
    • Change timing: State whether the cutoff falls before or after your deployment.
    • Independent checks: Summarize what you verified on the live URLs without claiming that those checks replace Google’s aggregate data.
    • Decision: Say what will remain unchanged and what event will trigger the next review, such as the report date advancing beyond deployment.

    Example status wording: The Search Console Page Indexing report is delayed, and its newest data predates our deployment. The intended response, canonical, and indexability directives are live on the sampled URLs. Aggregate validation remains pending until the report’s cutoff advances beyond the change date. We are keeping the current implementation in place and will reassess when newer data is available.

    This wording does not promise that every URL is indexed. It tells the reader what is known, what is not yet observable, and why waiting is a controlled decision rather than inaction.

    Key takeaways

    • Check the Page Indexing report’s last-updated date before interpreting any count, chart, or validation state.
    • If the report stops before your deployment, it cannot confirm or reject the fix.
    • A confirmed reporting delay is not evidence that crawling, indexing, or ranking has stopped.
    • Validate the live technical state with representative URLs while keeping aggregate validation marked as pending.
    • Do not repeat or reverse a correct implementation merely to make a stale chart change.
    • When the cutoff advances beyond deployment and the same exclusion remains, move from waiting back to technical investigation.

    Your next action is simple: put the report cutoff beside your deployment timestamp. If the data is older than the change, preserve the fix, document the gap, and set the next review for when Search Console finally shows post-change data.

    References

  • How to Use Google Search Console’s Branded Queries Filter

    How to Use Google Search Console’s Branded Queries Filter

    Your organic traffic changed, but the total line in Google Search Console can’t tell you whether more people discovered your site or simply searched for a brand they already knew. Those are different kinds of demand, and they call for different SEO decisions.

    The branded queries filter gives you that missing split. Used carefully, it can expose non-branded discovery growth, stop brand demand from inflating an SEO report, and show where your search visibility actually needs attention.

    What the branded query split actually measures

    A branded query can include your brand name, variations of that name, or brand-related products. The non-branded segment covers the queries Google does not classify that way.

    That makes the split useful for separating explicit brand demand from broader discovery. Someone searching your name is already navigating toward your brand. Someone searching for a problem, category, service, or product type gives you a clearer view of how often search introduces your site without requiring the brand name first.

    Do not translate those labels into “returning users” and “new users.” Search Console is classifying queries, not identifying the person behind each search. A first-time visitor can use a branded query after seeing your name elsewhere, while an existing customer can use a non-branded query. Treat the segments as types of search demand, not audience identities.

    This distinction also changes how you should judge click-through rate. Branded searches often carry stronger navigational intent, so they can produce a higher CTR than broad discovery searches. Comparing branded CTR directly with non-branded CTR usually tells you less than comparing each segment with its own previous performance.

    How to create a clean branded versus non-branded comparison

    An analyst sorts anonymous query tiles through a transparent funnel into two trays, with ambiguous tiles set aside for review.

    The filter sits in Search Console’s performance reporting as a query filter. The mechanics are simple, but the order matters. If you change dates, search types, countries, devices, or other filters between views, you no longer have a controlled comparison.

    1. Open the relevant Search Console property and go to its performance report.
    2. Choose the date range you want to analyze. If you are evaluating a change, set a comparison period before segmenting the queries.
    3. Select one search type. The branded query filter works with web, image, video, and news search, but each should be evaluated in its own context.
    4. Open the query filter and select the branded option. Record the clicks, impressions, CTR, and share of traffic shown for that segment.
    5. Switch to the non-branded option without changing any other setting. Record the same metrics.
    6. Inspect the queries and pages inside each segment. The aggregate split tells you what moved; the underlying rows show where it moved.

    If you do not see the option yet, that does not necessarily indicate a property or permission problem. Access is being rolled out gradually, so availability can differ between users or properties.

    Run the comparison separately for each property that represents a meaningful site or market. Combining unlike properties in your interpretation can hide whether the change belongs to one brand, language, product line, or regional site.

    Read absolute performance before you read traffic share

    Two pairs of glass vessels hold different quantities and proportions of cyan and coral spheres.

    A percentage can move even when the segment you are watching does not. Branded share rises when branded traffic grows, but it also rises when branded traffic stays flat and non-branded traffic falls. Those two situations look similar in a share chart and require opposite responses.

    Start with clicks and impressions for both segments. Then use CTR to understand whether visibility is turning into visits. Only after that should you interpret the percentage split.

    Pattern you seeWhat it may meanWhat to inspect next
    Branded clicks and impressions rise while non-branded performance stays stableExplicit demand for the brand may be increasingCheck which branded names or products account for the change, and note any campaigns, publicity, launches, or other activity that could have created demand
    Branded share rises, branded totals stay flat, and non-branded totals fallThe site has not necessarily gained brand strength; discovery performance has weakenedFind the non-branded queries and landing pages that lost impressions or clicks
    Non-branded impressions rise but clicks do not rise proportionallyThe site is appearing for more discovery searches without winning the same share of visitsReview the affected queries, search intent, page relevance, titles, and search-result descriptions
    Non-branded clicks rise while branded performance remains stableOrganic discovery is expanding beyond existing brand demandIdentify the pages, topics, and query groups producing the growth so you can reinforce them
    Branded impressions remain stable while branded CTR fallsSearchers still express brand demand, but fewer of those impressions become clicksInspect individual branded queries and their ranking pages before assuming the brand itself has weakened

    These patterns are diagnostic prompts, not automatic explanations. Search Console shows search performance, not the cause of brand demand. A branded increase may coincide with SEO work, but it can also reflect advertising, email, events, public relations, word of mouth, or product activity. Check the surrounding business context before assigning credit.

    Turn the split into better SEO reporting and prioritization

    The most useful reporting change is to stop presenting one organic total as if every click represents the same achievement. Give branded and non-branded performance separate lines in your scorecard. For each segment, show clicks, impressions, CTR, and the comparison with its own prior period.

    This makes three common reporting mistakes easier to avoid:

    • Calling brand demand an SEO discovery win. If total organic clicks increased because more people searched for the brand, report the gain accurately. It is valuable traffic, but it does not prove that category or problem-led visibility improved.
    • Missing a non-branded decline behind strong brand performance. A growing brand can keep the total trend positive while discovery queries and content-led entry pages lose ground.
    • Treating a lower non-branded CTR as a failure by default. Non-branded searches often cover broader intent. Judge their CTR against relevant prior performance and inspect the actual query mix before drawing a conclusion.

    The split can also sharpen content decisions. If non-branded impressions are growing around a topic but clicks lag, focus on the pages already earning those impressions. Check whether they answer the query directly, whether their titles describe the right outcome, and whether one page is being stretched across several different intents.

    If non-branded clicks are falling, do not respond with a site-wide rewrite. Use the filtered page and query rows to locate the loss first. A decline concentrated in one topic cluster calls for a different response from a decline spread across many page types.

    Branded data deserves its own review as well. Look for unexpected product terms, name variations, or branded queries landing on weak pages. A branded searcher usually has a more specific destination in mind, so a mismatch between the query and landing page can create friction even when the site still receives the click.

    Keep search types separate throughout this analysis. A rise in branded image visibility is not interchangeable with a rise in branded web clicks, and video or news performance may follow a different publishing cycle. The filter works across those surfaces; it does not make their metrics equivalent.

    Know what the filter cannot tell you

    The branded queries filter is Google’s classification, not a custom taxonomy built around your reporting rules. Because the definition can include name variations and related products, it may not match the exact list your organization uses for brand tracking.

    That matters when you manage several brands, share product names with generic terms, or need a contractual definition for client reporting. Use the native split for fast, consistent analysis. If the exact membership of the branded basket affects a formal target, inspect the included queries and apply your own documented classification outside the native filter.

    The filter also does not provide attribution. It cannot tell you which channel taught a searcher the brand name, whether the searcher is new or returning, or what happened after the click. Answer those questions with the appropriate campaign, audience, and conversion data instead of forcing Search Console to do work it was not designed to do.

    Finally, avoid turning the branded-to-non-branded ratio into a universal benchmark. The expected mix varies with business model, brand maturity, product naming, media activity, and the kinds of searches a site can satisfy. Your own trend, under consistent filters, is the defensible comparison.

    Key takeaways

    • Use branded and non-branded filters with identical dates, search types, and other report settings.
    • Treat the labels as query categories, not as proof of new versus returning users.
    • Read clicks and impressions before interpreting either segment’s percentage share.
    • Compare branded CTR with previous branded CTR, and non-branded CTR with previous non-branded CTR.
    • Report discovery performance separately so stronger brand demand cannot conceal weaker non-branded SEO.
    • Inspect the underlying queries and pages before assigning a cause or choosing an optimization task.

    Add the split to your next Search Console review, then choose one action from the segment that actually changed. That may be repairing lost non-branded visibility, improving a page with growing impressions, or correcting a branded landing-page mismatch. The filter earns its place when it changes the work you prioritize, not merely the chart you present.

    References

  • Google Shipping and Returns Policy Markup: A Setup Guide

    Google Shipping and Returns Policy Markup: A Setup Guide

    If you sell products online without using Merchant Center, Google does not have to infer your delivery charges, delivery expectations, or return terms from scattered pages. You can now provide shipping and return policy information through Search Console or site markup.

    The implementation is only reliable when the data matches checkout, customer-service rules, and the policy customers can read. Before touching JSON-LD, decide which rules are your store-wide defaults, which products are exceptions, and which system owns each value.

    Write down the operational policy before you encode it

    Structured data compresses a policy into machine-readable fields. It cannot resolve an unclear policy for you. If your shipping page, checkout, support team, and warehouse operate from different assumptions, markup will publish one of those inconsistencies more efficiently.

    Build a policy matrix with one row for every market whose terms materially differ. Record the answers to these questions:

    • Where do you ship?
    • Which shipping service does the policy describe?
    • What does the customer pay, and in which currency?
    • How long can handling take before the parcel enters the carrier network?
    • How long can transit take after handoff to the carrier?
    • Which countries are covered by the return policy?
    • Is the return window finite, unlimited, or unavailable?
    • If the window is finite, what event starts it: purchase, dispatch, delivery, or another event stated in your customer-facing terms?
    • Which return methods are allowed?
    • Who pays the return cost?
    • Which products or conditions are excluded?

    Keep handling time separate from transit time. Handling is under the merchant’s control; transit begins after carrier handoff. Combining them into an attractive but unsupported delivery promise creates a mismatch precisely where a shopper is looking for certainty.

    Use the policy customers can actually claim, not an aspirational service level. A lower shipping charge, faster delivery estimate, longer return window, or broader free-return promise can affect purchase decisions. If checkout or support will not honor it, do not publish it in structured data.

    Choose Search Console or Organization markup deliberately

    Search Console and structured data are two publishing routes for the same operational truth. Your choice should be based on ownership and maintainability, not on which route appears more technical.

    Publishing routeBest fitMain control to establish
    Search ConsoleYou want a no-code route and have a straightforward store-wide policy.Name the person responsible for updating the settings whenever operations or terms change.
    Organization JSON-LDYour team already manages structured data through code, a CMS, or a schema layer.Keep the values version-controlled or otherwise traceable to the policy owner.
    Merchant CenterYour shopping program already treats its account or feed data as the commercial source of truth.Do not add a separately maintained policy unless you can guarantee that the systems remain aligned.

    Search Console is often the smaller change when you do not use Merchant Center and do not want to alter templates. Organization JSON-LD is usually easier to audit alongside other website releases. Neither route improves a weak policy, and neither should become a forgotten copy of information maintained elsewhere.

    Avoid entering one version in Search Console while a plugin emits another version in the page source. Google may encounter both, but you should not assume it will resolve the conflict in the way you intended. Pick a primary owner, document any secondary output, and update both in the same change workflow if both must exist.

    Map your policy to the JSON-LD concepts

    Top-down illustration of shipping and return objects flowing through connected nodes into nested structured-data modules.

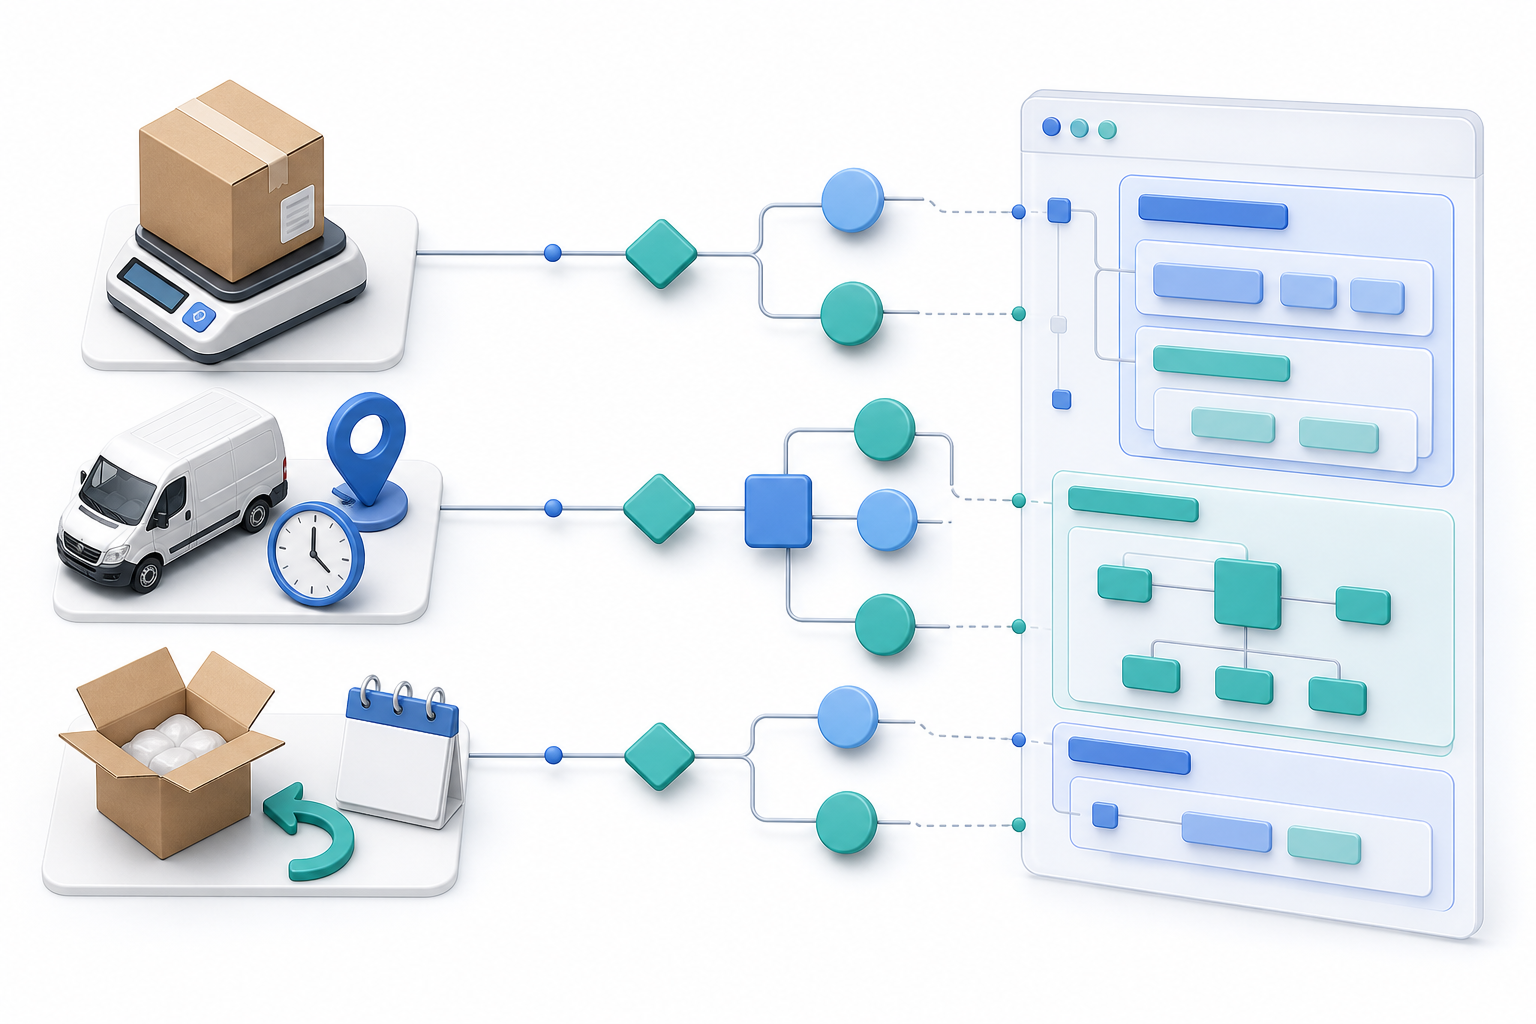
    At the Organization level, the conceptual structure has two branches. Shipping information is expressed through shippingDetails using OfferShippingDetails. Return information is attached through hasMerchantReturnPolicy using MerchantReturnPolicy.

    The following map is more useful than copying a generic snippet because it forces every machine-readable value back to an operational answer:

    Business questionStructured-data conceptWhat to verify
    Where does this shipping rule apply?shippingDestinationThe destination matches an area that checkout actually serves.
    What does shipping cost?shippingRateThe value and currency describe the selected service without hiding a condition that changes the charge.
    How long before carrier handoff?handlingTimeThe range reflects normal fulfillment commitments rather than the fastest observed order.
    How long after carrier handoff?transitTimeThe range belongs to the destination and service represented by this shipping rule.
    Where does the return policy apply?applicableCountryThe country is covered by the customer-facing terms.
    What kind of return window applies?returnPolicyCategoryThe category agrees with whether returns are finite, unlimited, or unavailable.
    How long is a finite window?merchantReturnDaysThe duration matches the policy page and the event from which your published terms calculate it.
    How can an item be returned?returnMethodThe encoded method is genuinely available to customers in the covered market.
    Who bears the return cost?returnFeesThe value reflects the ordinary case and does not erase important conditions or deductions.

    Use the defined Schema.org value expected by a category, method, or fee field rather than inserting promotional prose such as “easy returns.” JSON-LD describes the rule; the visible policy page explains qualifications, procedures, deadlines, item condition requirements, refund timing, and exceptions.

    Connect the policy to your existing canonical Organization entity instead of creating unrelated Organization objects in several plugins. A stable @id helps the graph refer to the same business, but it does not excuse conflicting values. Inspect the final rendered source because the output seen by a crawler can differ from what a CMS form displays.

    Do not let a store-wide default erase product exceptions

    Illustration of a general store policy covering most packages while separate policy paths lead to an oversized item and a sealed personal-care product.

    An Organization-level policy works as a default. It becomes misleading when a substantial set of offers follows different rules. Customized goods, clearance inventory, oversized products, subscriptions, perishable items, and digital products can all require different treatment depending on how your business operates.

    Do not encode the most generous policy as universal merely because it produces the cleanest markup. Decide how each exception should be handled:

    • If a different rule applies to a market, represent that market separately rather than blending incompatible destinations, currencies, charges, or delivery estimates.
    • If a product class has a different return rule, do not allow the organization default to make an unconditional promise that the product page later withdraws.
    • If your implementation supports properly scoped offer-level information, use it for genuine product exceptions and keep it synchronized with the offer.
    • If you cannot represent an exception accurately, narrow or omit the affected machine-readable claim instead of publishing a false universal rule.
    • Explain detailed conditions on a crawlable customer-facing policy page. Do not expect a compact structured-data object to carry the entire contract.

    Pay particular attention to conditional free shipping and conditional free returns. A rate that depends on basket value, membership, location, product class, or selected service is not simply a universal zero-cost rate. Encode only the condition your implementation can represent faithfully, and leave the full qualification visible before purchase.

    Validate the output and the promise

    Syntax validation is necessary, but it only proves that a machine can parse the data. A valid object can still describe the wrong destination, currency, service, timing, fee, or return window.

    1. Open the rendered page or server response that contains the Organization data. Confirm that the expected JSON-LD is present for an ordinary crawler and is not merely visible inside an administration screen.
    2. Parse the JSON-LD with a structured-data validator. Fix malformed JSON, unsupported value shapes, missing relationships, and duplicate entities.
    3. Compare every emitted value with the shipping page, returns page, checkout calculation, and current support instructions.
    4. Test representative destinations and product exceptions. A default that is correct for the easiest order may be wrong for the rest of the catalog.
    5. Check Search Console after publication for the status Google exposes, but do not treat the absence of an error as proof that the policy will be displayed.
    6. Add shipping and return data to your release checklist. Changes to carriers, fulfillment locations, service levels, charges, destinations, or return terms should trigger the same review.

    Structured data makes information eligible for machine use; it does not command a particular Search appearance or guarantee rankings. Judge the deployment first by accuracy, consistency, and maintainability. Any additional visibility is downstream of those basics.

    Key takeaways

    • You can provide shipping and return policy information through Search Console or website markup without using Merchant Center for the task.
    • Define destination, charge, handling, transit, return window, method, fees, and exceptions before encoding anything.
    • Use Organization-level data for a genuine default, not as a shortcut that conceals product or market differences.
    • Choose one operational source of truth and prevent Search Console, Merchant Center, plugins, templates, checkout, and policy pages from drifting apart.
    • Validate both the JSON-LD structure and the commercial promise represented by every value.

    Start with the policy matrix, assign an owner, and publish the smallest accurate default through the route your team can maintain. Once that default survives a comparison with real checkout scenarios and known exceptions, you have markup worth exposing to Google.

    References