As someone who eagerly follows Google’s updates, I was thrilled to learn about the latest developments in Google Search Console. Recently, Google has started to roll out new Search Generative AI performance reports. These reports, along with a feature to block your content in AI responses, are designed to give website owners more control.
Currently, these features are being introduced to a select group of website owners in the UK, but there are plans to expand access in the near future. This gradual rollout allows us to get accustomed to these changes before they become widely available.
Exploring the Search Generative AI Performance Report
The new AI performance report in Google Search Console is something I’ve been anticipating. Although it doesn’t cover everything, it does provide some important insights into how our content is performing within AI responses, AI Mode, and AI Overviews on Google Search. The report includes data on impressions, pages, countries, devices, and dates. However, a notable omission is click data, so we’re left guessing about the exact number of searchers clicking through to our sites from AI responses.
Google stated:
– We’re rolling out new insights for website owners regarding their pages’ appearances in generative AI Search features. These insights include impressions metrics and information on which pages appear in AI responses and in which countries. We’re working closely with website owners to determine what insights would be most helpful and will expand the metrics available over time.
Additionally, Google shared more details about the metrics we can expect:
– Impressions: Frequency of your site’s URLs appearing in generative AI features in Search and Discover.
– Pages: Identifying URLs that appeared within AI features.
– Countries: Understanding visibility on a country basis.
– Devices: Identifying the devices used to view your website. Available for Search results.
– Dates: Monitoring performance with hourly, daily, weekly, and monthly granularity.
I inquired about click data from a Google representative, who mentioned that they are exploring additional metrics that will help inform our strategies in the future.
Initially, this report is available to a subset of users in the UK, with plans to expand globally in the future.
Another exciting feature Google introduced is the ability to block your content from appearing in AI search features like AI Overviews, AI Mode, or AI Discover. Google described this as a “new toggle” within Google Search Console, allowing us to decide whether or not our site should be part of these AI search features.
Google notes that opting out will prevent your site from receiving traffic or impressions from these features. Importantly, this control won’t affect your ranking in standard search results outside of generative AI Search features, so there’s no risk of negatively impacting core web search visibility.
Again, like the performance report, this toggle is currently available to a subset of UK website owners, with plans to widen access as they complete further testing. Google had promised these controls after facing some backlash from the EU, and it’s promising to see them starting to roll out now.
One study even showed that 1/3rd of SEOs are willing to block Google from showcasing their content in AI search features.
Why It Matters
As site owners and publishers, many of us have been asking for control over how and if our content appears in Google’s AI features. Now, we have just that. Although it’s initially limited, I’m hopeful these features will eventually be available to all.
Moreover, we’ve been requesting AI Search reporting from Google from day one. With Google’s announcement following Bing’s release of its own AI performance report, we’re taking a significant step forward. While Google’s report currently targets UK site owners and lacks click data, it holds promise for a global rollout soon.
Your Google Discover chart drops sharply, a stakeholder wants an explanation, and someone points to a recent publisher-profile change. Before you change the editorial calendar or undo the profile work, separate what Google displayed from what Search Console recorded.
Discover profile controls, feed distribution, and performance reporting are connected surfaces, but they are not the same system. You need a different measurement plan for each one. This playbook shows you how to audit the controls you have, make profile links measurable, and keep unreliable reporting days out of consequential decisions.
Key takeaways
Treat a Discover publisher profile as a brand and navigation surface, not as a proven ranking control.
Most profiles are still generated automatically. A monitored set of 46,926 profiles contained only 54 U.S.-based, English-language publishers with enhanced controls.
If you can add profile links, give every destination a stable UTM convention before publishing it. Otherwise, you won’t be able to separate profile visits from other Google traffic.
Search Console Discover clicks and impressions for May 7–8, 2026 are unreliable because of a confirmed logging error. Mark those dates as invalid data rather than treating the reported decline as lost visibility.
Preserve raw Search Console data, add a validity flag, and use first-party site analytics only as corroborating evidence. Different tools do not measure the same thing.
Separate profile presentation, distribution, and reporting
A publisher profile can influence how someone understands and navigates your brand after encountering it. Search Console reports what its logging system captured. Discover distribution determines whether and where content appears in the feed. A change in one layer does not automatically prove a change in either of the others.
Layer
Question it answers
Evidence to use
What it does not prove
Publisher profile
What can a user see or select after interacting with your publisher identity?
Profile screenshots, available controls, tagged profile-link visits, and landing-page actions
That a banner, link, or pinned post improved Discover ranking
Discover distribution
Was your content shown and selected in the feed?
Valid Discover impressions, clicks, click-through rate, content-level patterns, and corroborating site outcomes
That every reported movement reflects an editorial or algorithmic change
Search Console reporting
What Discover activity did Google’s reporting pipeline log?
Search Console data with incident annotations and validity flags
That a logging gap represents a real loss of placement or audience
This distinction changes how you investigate. If a profile link receives fewer tagged visits, inspect the link, label, destination, and profile exposure. If Search Console falls on dates affected by a known reporting incident, quarantine those dates first. If valid Discover data and independent site outcomes decline beyond the incident window, then you have grounds for a broader distribution, content, or technical investigation.
Do not use correlation as a shortcut. Pinning a post shortly before a Discover increase does not demonstrate that the pin raised feed visibility. The pin may have changed profile engagement, while a separate distribution change affected the feed. Measure the outcome each control can plausibly produce.
Run the audit from the profile itself rather than from an internal assumption about what your organization should have. Save the date of the audit because access and profile presentation can change.
Open your publisher profile and record its exact URL.
Capture a full-page screenshot so you have a dated record of the banner, identity, links, social accounts, and visible posts.
Look for the label “Profile generated by Google.” Its presence indicates the standard, automatically generated profile rather than the enhanced publisher-controlled version.
Check separately for a customizable banner, a link shelf, pinned-post controls, and editable social links. Do not mark the profile as enhanced based on appearance alone.
Record who in your organization can access the controls. Profile availability is not operational control if nobody owns the account or publishing process.
Add the audit result to a simple register with four fields: profile URL, profile type, last checked date, and internal owner.
That pattern describes Google’s selected cohort; it is not a public eligibility rule. There is no documented public application process for the enhanced capabilities. If your profile has no claim or editing option, do not treat the absence as a technical failure, and do not build a business case around an assumed rollout date.
If you have a standard profile, verify what users see and retain evidence of any identity problem. Keep your publication name, visual identity, social destinations, and public site information internally consistent so the team can identify discrepancies without improvising a new brand treatment for Google alone.
If you have enhanced controls, assign a job to each element:
Banner: communicate recognizable brand identity. Use a production-ready asset and review it on the live profile rather than approving it only from the design file.
Link shelf: route users to a small set of intentional destinations. Choose pages that answer a clear next-step need, such as current coverage, a section hub, a newsletter, or a subscription page.
Pinned posts: prioritize content for profile visitors. Log the start date, end date, and reason for every pin so later analysis has a usable timeline.
Social links: verify account ownership and destination accuracy. A visible link to an abandoned or incorrect account creates a brand problem even if it has no effect on Discover distribution.
Professional banner treatments were common among the enhanced profiles, but link-shelf behavior differed by publisher type. Local television publishers frequently used links for site navigation, while national publishers used the feature less actively. Copying either pattern without considering your visitor’s next action misses the point. Your shelf should reflect the paths your audience actually needs.
Make profile traffic identifiable before you optimize it
A profile link without campaign tagging leaves you with an attribution problem. You may see traffic to the destination, but you cannot reliably distinguish a click from the profile shelf from another Google visit. Many publishers in the initial enhanced cohort did not add UTM parameters to their profile links.
Set one naming convention before the first link goes live. A practical pattern is:
utm_source: google
utm_medium: discover_profile
utm_campaign: publisher_profile
utm_content: a stable identifier for the shelf position or destination, such as latest, local, newsletter, or subscribe
A newsletter destination could therefore use: https://example.com/newsletter?utm_source=google&utm_medium=discover_profile&utm_campaign=publisher_profile&utm_content=newsletter.
This is a recommended internal convention, not a Google requirement. Its value comes from consistency. Keep the medium specific to the profile so you do not merge link-shelf traffic with referrals that may come from the Discover feed itself.
Create the final URL in your campaign register before entering it in the profile.
Use lowercase values and fixed separators. Newsletter, NewsLetter, and news_letter become separate values in many analytics workflows.
Open the live profile on a user-facing device and click the link. Confirm that it reaches the intended canonical destination without losing the UTM parameters during a redirect.
Verify the visit in your analytics debugging or near-real-time view. Do not assume that a correctly formed URL is being collected correctly.
Record the visible link label, destination, UTM values, publication date, retirement date, and owner.
When replacing a destination, create a new utm_content value if the user promise changes. Reusing one identifier for unrelated links corrupts the history.
Measure link-shelf work with profile-attributed sessions and the actions those visitors take on the landing page. Measure a pinned post with the same profile-specific evidence and its active dates. Do not use a change in overall Discover impressions as the success metric for either control unless Google establishes a ranking relationship that is not currently supported here.
The banner needs a different standard. It is primarily a brand asset, so review visual clarity, publication identity, and suitability within the live crop. Do not manufacture a performance claim merely because the asset cannot be tied neatly to a conversion.
Keep unreliable Discover data out of editorial decisions
Those two dates should be treated as invalid observations, not as zero-performance days and not as evidence of an editorial failure. The distinction matters because a monthly total that includes understated days is incomplete even when the rest of the month is accurate.
Preserve the raw values. Do not overwrite the export or dashboard table with an estimate. You may need the original record for auditability.
Add a data-status field. Mark May 7 and May 8, 2026 as invalid because of the Discover logging error. A blank status should mean no known incident, not that someone forgot to review the date.
Render the dates as a gap. On a trend chart, a gap communicates missing or unreliable information more accurately than a plotted zero.
Label every affected total. If a weekly or monthly number includes the two dates, describe it as incomplete. Do not publish a clean percentage change as though both periods had full data.
Avoid backfilling a guessed value. An interpolation may make the chart look continuous, but it converts an unknown measurement into invented performance.
Check corroborating signals. Review site sessions, relevant landing-page activity, and business outcomes for the same dates. Use them to judge whether a separate traffic change may also have occurred, not to recreate exact Search Console clicks or impressions.
Reopen the investigation when the pattern extends beyond the incident. A decline continuing on valid reporting days, especially when site outcomes also weaken, deserves content, distribution, and technical analysis.
Your stakeholder annotation can be direct: “Google Search Console Discover clicks and impressions for May 7–8, 2026 are understated because of a logging error. Google said the incident did not affect Discover positioning. Totals containing these dates are incomplete.”
Keep this note beside the chart, not in a separate document that viewers may never open. An anomaly ledger should also record the affected product, dates, metrics, stated impact, supporting link, dashboard owner, and decisions that must not rely on the compromised data.
For recurring reporting, maintain two views. The raw view preserves exactly what Search Console returned. The decision view carries the same values plus incident flags and excludes invalid dates from calculations that require complete observations. This gives analysts an audit trail while keeping executives from acting on a known measurement failure.
Do not let the reporting incident become a blanket explanation for every decline. If tagged profile visits fell because a shelf link broke, that is a profile implementation problem. If Discover performance weakens after May 8 on valid days, the logging incident does not explain the later movement. If only the two affected dates look abnormal, the responsible action is to annotate them and leave the editorial plan alone.
Start with three concrete changes: capture your current profile state, establish a profile-specific UTM convention, and flag May 7–8, 2026 in every Discover report that includes them. The next time a chart moves, you will know whether to inspect the profile, the feed, or the measurement layer before anyone turns an unreliable signal into a strategy change.
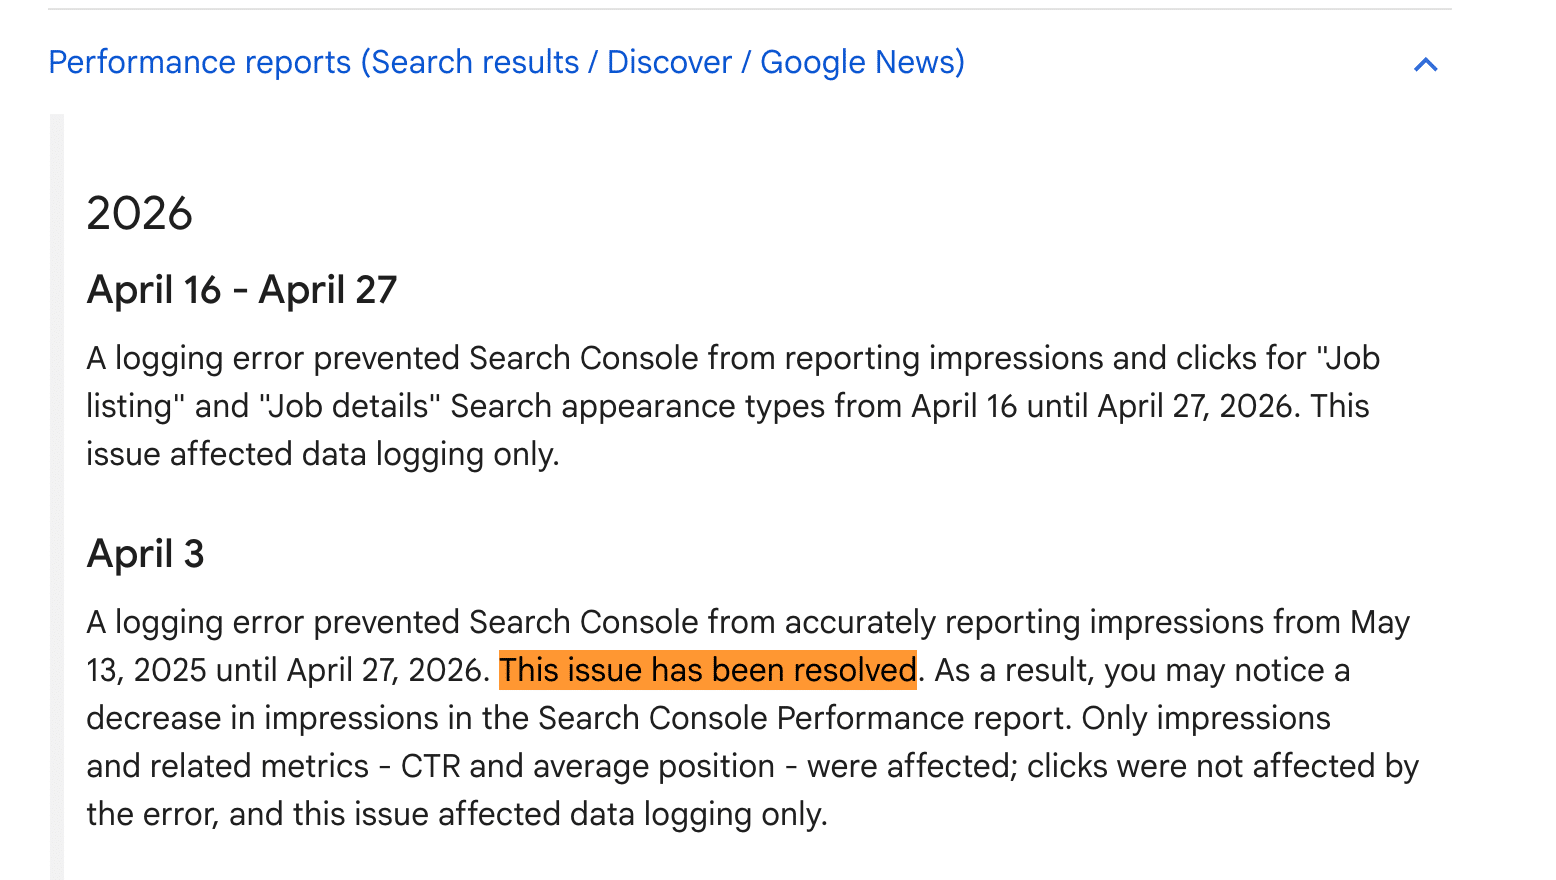
It feels like a moment of relief as Google recently announced a resolution to a longstanding data logging issue within Google Search Console. This glitch affected data between May 13, 2025, and April 27, 2026, spanning approximately 50 weeks. However, it’s important to note that while the root cause has been addressed, historical data from this period remains unfixed.
Google shared this update in a rather understated post, bringing light to a problem that many of us have been grappling with for quite some time. According to their post, “A logging error prevented Search Console from accurately reporting impressions from May 13, 2025, until April 27, 2026. This issue has been resolved.” It was a relief to hear, but also a bit frustrating knowing that impressions, CTR, and average position data were affected for such a significant period. Thankfully, clicks weren’t influenced by this error, which was some consolation.
As I sift through my Search Console data, I must remind myself of this anomaly, particularly when analyzing metrics from that problematic timeframe. The good news is that any data collected from this point forward should be accurate.
Further confirmation came from John Mueller on Bluesky, who reiterated that past data would not be retroactively corrected, but the issue has indeed been resolved going forward.
This development is crucial for all of us who rely heavily on precise data for SEO strategies. If your impressions appear lower and, consequently, your CTR and average position figures seem skewed during this period, this is likely why.
I’ve noticed that Google is currently investigating an issue with the Google Search Console. Specifically, this concerns the data logging and reporting of “Job listing” and “Job details” search appearance filters.
On April 16th, a bug began affecting how this data is logged, causing Google to report zero clicks and impressions for job-related reports. Although traffic is still being received, it’s not being recorded correctly.
What Google said. According to an update from Google, “A logging error is preventing Search Console from reporting impressions and clicks for ‘Job listing’ and ‘Job details’ Search appearance types from April 16, 2026 onward. We’re working to resolve this issue. This issue affects data logging only.”
Complaints. I’ve also seen numerous SEOs voicing their concerns on social media, as shared in a tweet by Max Peters. The bug seems to impact impressions and clicks, but the traffic still comes through other measurement methods like google_jobs_apply UTM.
Why we care. If you’ve noticed a decrease in search data for job listings, rest assured, it’s due to this bug on Google’s side. Your listings are likely still active and receiving traffic, although this isn’t reflected in Search Console at the moment.
A damaging result is ranking for your name or brand, and the obvious question is whether Google can take it down. Sometimes it can. The right route depends on who controls the page, whether the page has already changed, and what kind of information it contains.
Before you submit a request, decide what you actually need removed: the content itself, the URL from Google Search, or the result from a prominent ranking position. Those are different outcomes, and confusing them is the main reason removal efforts stall or create false confidence.
First decide what you need Google to change
Google offers specific removal routes for specific circumstances. It does not provide a general-purpose button for deleting any result that is inaccurate, embarrassing, critical, or commercially damaging.
Outcome
What changes
What remains
Removal at source
The publisher deletes the original page. Google can remove the URL from its index after recrawling it.
The result may remain visible until Google revisits the URL. Deletion also depends on the site owner taking action.
Deindexing from Google
Google stops showing the URL in its search results.
The page may still work for anyone who has its direct address, and other search engines are unaffected.
Suppression
SEO and reputation work moves more useful, accurate results above the unwanted result.
The original content remains online and may still be found through other queries or direct access.
Removal at source is the strongest outcome because it addresses the content, not merely its visibility. If you own the page, delete it when deletion is the intended result. If someone else owns it, request deletion or correction from that publisher before assuming Google can solve the underlying problem.
Deindexing is still valuable. It can sharply reduce discovery through Google, which may be the immediate reputation objective. Just do not describe it internally or to a client as deletion. The distinction matters when you assess remaining exposure.
Match the page state to the correct removal tool
Start with the current state of the page, not the severity of the complaint. A severe problem submitted through the wrong workflow is still the wrong request.
You control the site and need short-term containment: use the URL removal tool in Google Search Console. It can temporarily hide a URL or directory from search results for up to six months. Use that window to complete the permanent site-side change. A directory-level request can affect multiple URLs, so confirm its scope before submitting it.
The source page was deleted or changed, but Google still shows the old result: use the public outdated content removal tool. This workflow helps trigger a recrawl after the source has changed. It is not a way to remove an unchanged third-party page simply because you object to it.
The result exposes eligible personal information: use Results About You. Its covered categories include sensitive material such as government-issued identifiers and non-consensual explicit imagery. Eligibility depends on the type of information, not only on the distress or reputational damage it causes.
The case involves non-consensual explicit images or other sensitive personal material on a third-party site: evaluate Google’s separate personal content removal form. This route can overlap with the concerns handled through Results About You, but it remains a distinct request path. Neither route forces the third-party publisher to delete its copy.
The request depends on a legal right: use the relevant legal removal workflow. Available grounds can include copyright infringement and defamation, but a negative statement is not automatically defamatory and possession of a copy does not automatically establish copyright ownership. If the request depends on a legal conclusion, have a qualified lawyer assess it before you file.
If none of those descriptions fits, repeated submissions through unrelated forms are unlikely to create a new basis for removal. Shift the effort toward publisher outreach, a properly assessed legal escalation, or suppression.
Build a clean case before you submit anything
A removal request is easier to route when you can describe the problem without mixing several different outcomes. Prepare a short case brief even if the eventual form asks for less information.
Exact URL: record the page address appearing in search, not merely the site’s homepage or domain.
Current source state: note whether the page is live, deleted, inaccessible, or materially changed. Save a dated screenshot before further outreach if the original state may matter.
Affected query: record the name, brand, product, or other search that exposes the result, along with the visible title and snippet.
Control: state whether you own the website, can contact its owner, or have no relationship with the publisher.
Removal basis: classify the case as temporary hiding, outdated content, eligible personal information, sensitive imagery, or a specific legal claim.
Requested outcome: say whether you want the source deleted, Google’s stale result refreshed, or the URL excluded from Google Search.
Previous action: document deletion, correction, publisher outreach, and earlier Google requests so that your team does not repeat work or submit conflicting explanations.
Then use a simple sequence: change or remove the source when you can, submit the narrowest applicable Google request, record what you submitted, and check the source page and Google result separately. A request can succeed at the search layer while the content remains fully accessible at its original address.
Handle sensitive evidence carefully. Government identifiers, explicit imagery, and similar material should not be copied into routine internal messages or shared beyond the people who need it for the request. If preserving or submitting evidence could affect a legal dispute, ask counsel how it should be retained.
A removed result can still be a live reputation risk
Track four outcomes separately
A single completed status does not tell you whether the problem is resolved. Track the case at four layers:
Source status: is the original page live, corrected, or deleted?
Google status: does the exact URL still appear for the queries that matter?
Distribution status: is the same content discoverable through direct access or other search engines?
Reputation status: do searchers now see an accurate set of results, or does the unwanted URL still dominate nearby queries?
Do not wait for a removal decision before planning for the possibility that the request is ineligible, temporary, or narrower than expected. Continue appropriate publisher outreach while improving legitimate pages that should rank for the affected name or brand.
Suppression is not a euphemism for deletion. It means creating and optimizing accurate, relevant content so that searchers encounter better information first. It is often the practical route when a page violates no applicable removal policy, the publisher will not cooperate, or the same reputation issue appears across several discovery channels.
Escalate according to the real obstacle. A reputation specialist can help coordinate publisher outreach and search strategy. A lawyer is the appropriate professional when the case turns on copyright ownership, defamation, court orders, or another legal right. Neither should be treated as a guarantee that lawful third-party content will disappear.
Key takeaways
Deleting a page at its source removes the content; deindexing only removes its Google Search visibility.
Google Search Console’s URL removal tool is temporary, with hiding available for up to six months.
The outdated content tool is appropriate after a page has already been deleted or changed, not as a shortcut for an unchanged page.
Results About You and the personal content removal form cover defined categories of personal or sensitive material.
Legal removal requests require an applicable legal basis; reputational harm by itself does not establish one.
Source resolution, Google removal, monitoring, and suppression are separate workstreams and should be measured separately.
Start by writing one sentence that states whether the page is live, deleted, or changed; whether you control it; and which removal category applies. That sentence will usually identify the correct Google route. Submit it, document it, and open the source-side or suppression track without treating the search request as the whole solution.
Your page is indexed, technically sound, and even earns search impressions. Yet it rarely appears in AI answers, recommendations, or citation-style results. That usually isn’t a signal to add more keywords. It is a signal to find the exact point where discovery breaks.
Content visibility is a chain: access, extraction, intent matching, evidence, selection, and measurement. If you diagnose those stages in order, you can make a targeted change instead of rewriting a useful page on instinct.
Visibility is a chain, not a single ranking setting
A search engine or AI system must first reach the URL. It then has to extract the main content, determine what the page is about, match it to a user’s need, and decide whether the material is suitable to surface or reuse. A failure at any stage can look like the same outcome: no visibility.
This is why crawlability and AI visibility should be treated as related but separate requirements. Allowing a crawler through the door does not make an ambiguous page understandable. Clear writing and schema cannot compensate for a blocked, redirected, or non-indexable URL.
Distribution is also more fragmented than a conventional rankings report implies. A dataset covering 42 million Google Discover cards from December 2025 through February 2026 identified 20 selecting pipelines organized into six broad layers: core editorial, news urgency, trends, local or geographic content, social or video content, and commercial content. The sample came from hundreds of devices, so it is a substantial snapshot, but it is not a permanent map of every Google or AI system.
The practical lesson is narrower and more useful: different surfaces can select the same URL for different reasons. A traditional ranking, a Discover recommendation, and an AI citation should not be treated as three readings from one universal visibility score.
Key takeaways
If a system cannot fetch the final page, content changes will not solve the problem.
If the title, description, opening, headings, and structured data imply different purposes, the page’s intent is unclear.
If important claims lack context, dates, ownership, or supporting links, the material is harder to evaluate and safely reuse.
Google Search Console queries show the demand already reaching each page, making them a better starting point than a speculative keyword list.
Search, Discover, referral traffic, brand mentions, and AI answer citations need separate measurements.
Diagnose the earliest broken stage before rewriting
Start with the URL, not the copy. Work through the following checks in order and stop when you find a material failure. There is little value in polishing an answer that the relevant systems cannot reliably retrieve.
Confirm access. Open the public URL without an authenticated session. Check the response, redirects, canonical target, robots rules, and page-level indexing directives. Review any firewall, bot-management, or consent layer that could return a challenge instead of the article. If your organization blocks categories of crawlers, make that an explicit policy decision rather than an accidental side effect of a security preset.
Inspect the extractable page. Make sure the main answer, headings, lists, links, and evidence exist in the delivered document. Do not assume every retrieval system will execute a client-side application exactly as a human browser does. Remove overlays and template elements that obscure the opening or make navigation look like the main content.
Verify page identity. The title, meta description, visible heading, introduction, canonical URL, breadcrumbs, and structured data should describe the same resource. A page presented as a tutorial in one field and a product category in another creates unnecessary ambiguity.
Compare the promise with real demand. In Google Search Console, inspect the queries associated with this specific URL. Group them by the job the searcher is trying to complete, such as learning, comparing, troubleshooting, evaluating, or buying. Then compare the dominant job with what the page promises near the top.
Audit evidence and ownership. Mark claims that depend on a date, platform, version, dataset, or named organization. Add that context where it changes the answer. Identify the author or responsible publisher and link important factual claims to the material that supports them.
Check each outcome separately. Review organic search performance, Discover exposure where applicable, observable AI referrals, brand mentions, and citations in a controlled set of answer prompts. One healthy channel does not prove that the others are healthy.
The first failed stage determines the next action. Fix access before content. Fix a query-to-page mismatch before adding schema. Strengthen evidence and entity clarity when the page is reachable and relevant but difficult to quote or attribute. If all of those checks pass, improve distribution and measurement instead of forcing another rewrite.
Use Search Console to measure the intent gap
Most content briefs begin with the audience a business hopes to attract. Search Console shows the audience Google is already connecting to the page. The difference between those two groups is your intent gap.
That gap is about meaning, not merely shared words. Vector embeddings can place queries and page descriptions in the same semantic space, allowing their distance to be scored. A documented implementation compares page-level Search Console queries with the page’s meta description and uses the distance to identify weak alignment.
Treat such a score as a diagnostic proxy. It is not an official Google metric, it does not prove why a page ranks, and a high similarity score does not guarantee inclusion in an AI answer. Its value is prioritization: it helps you locate pages whose positioning is far from the demand already reaching them.
A query-to-page workflow that does not require a special tool
Export queries by page. Preserve impressions, clicks, position, page, and query so that demand remains attached to the URL receiving it.
Separate different kinds of demand. Keep branded or navigational searches distinct from problem, comparison, and transaction-oriented searches. They represent different reasons for reaching the page.
Cluster by user task. Group queries that ask for the same outcome even when they use different vocabulary. Do not create a separate intent simply because a synonym appears.
Write the demand in one plain sentence. Complete the statement: People reaching this URL mainly want to… If several unrelated endings carry meaningful demand, the page may be trying to do too many jobs.
Write the page promise. Read only the title, meta description, main heading, opening paragraphs, and section headings. Complete the statement: This page helps you… Use what is actually on the page, not what the content brief intended.
Choose a structural response. Keep the positioning when promise and demand agree. Refocus the opening and headings when the right answer is buried. Expand the page when it omits a necessary subproblem. Split the page when distinct audiences or tasks require incompatible answers.
Look for five common forms of mismatch:
Scope gap: searchers want an implementation answer, but the page stays at the strategy level.
Audience gap: the page addresses specialists while the queries come from beginners, or the reverse.
Stage gap: the page tries to sell while the dominant demand is educational, or teaches basics to people already comparing options.
Format gap: the query calls for steps, criteria, or troubleshooting, but the page provides a continuous essay.
Outcome gap: the copy describes a topic without resolving the decision or problem behind the query.
Do not rewrite the meta description in isolation just to improve semantic similarity. It is useful because it expresses the page’s promise compactly. If that promise changes, make the same intent visible in the heading, introduction, body, internal links, and structured data. Otherwise, you have improved the label while leaving the resource unchanged.
Build an answer asset without weakening the full page
An AI-visible page still needs to work as a page. Compressing everything into short definitions may make individual sentences easy to extract, but it can remove the qualifications and evidence that make the answer trustworthy. Build a clear answer core, then support it with the depth the decision requires.
Put the answer core near the top
Answer the main question in direct language before moving into background. State who the answer applies to, what conditions change it, and what the reader should do next. If the subject requires a sequence, expose that sequence in an ordered list. If it requires choosing among options, name the decision criteria before describing every option.
Use headings that identify an actual subproblem. A heading such as Diagnose the earliest broken stage tells a reader and a machine what the section resolves. Generic labels such as Overview or More information do not.
Use structured data as clarification, not decoration
Select the most accurate schema type for the visible resource. Mark up only information a visitor can verify on the page. Keep names, authorship, publisher identity, dates, breadcrumbs, and canonical references consistent across HTML and JSON-LD. When an organization or product appears across multiple pages, use stable identifiers and naming rather than creating slightly different versions of the same entity.
Schema cannot repair a blocked URL, substitute for a missing answer, or make unsupported claims trustworthy. Its useful role is disambiguation: it helps a system interpret the type of resource and the relationships already expressed in the visible content.
Make provenance part of the answer
Durable visibility in generative systems depends partly on consistent metadata, provenance, and trust signals. Give time-sensitive claims a date or version. Name the organization responsible for the content. Link to the originating evidence when a factual claim depends on it. Distinguish observed facts from your recommendation.
This is not a request to add a long author biography to every page. It is a request to remove uncertainty that matters. A reader should be able to tell who is making the claim, when it applies, what supports it, and whether it is a fact, interpretation, or recommendation.
Package the content for its genuine distribution context
The measured Discover environment separated selection into layers for editorial content, urgent news, trends, local material, social or video content, and commercial content. It also evaluated pipelines by reach, speed, exclusivity, and feed volume. Those dimensions explain why a URL can have broad reach, fast pickup, or exclusive distribution without performing identically across every surface.
Use only the attributes your content genuinely has. Preserve geographic specificity when the answer is local. Make publication and update context clear when timing changes the value. Treat an original video as a first-class resource when video is integral to the answer. Do not imitate urgency, locality, or trend relevance that the page cannot substantiate.
Measure search and AI visibility as a portfolio
A single visibility percentage collapses different systems, intents, and outputs into a number that is hard to act on. Use a small scorecard that keeps the stages separate:
Layer
What to record
What a weakness means
First response
Access
Public response, redirects, canonical, robots rules, indexing directives, and extractable main content
The resource may not be consistently retrievable or eligible
Fix the technical path before editing copy
Search demand
Page-level queries, impressions, clicks, and position from Search Console
Demand may be weak, changing, or attached to a different intent
Inspect query clusters and competing pages
Intent fit
Alignment between dominant query tasks and the title, description, opening, and headings
The page promise does not match the audience reaching it
Defend, refocus, expand, or split the page
Answer readiness
Direct answer, qualifications, evidence links, author or publisher, dates, and consistent structured data
The material may be relevant but difficult to interpret, attribute, or reuse
Clarify the answer and its provenance
AI presence
Mentions and citations from a versioned set of prompts, plus identifiable referral traffic where available
The page is not being selected consistently in the observed answer environment
Check intent, evidence, entity clarity, and competing answer formats
Discovery distribution
Discover or recommendation exposure reported separately from standard search
A distribution surface may value different timing, format, or contextual signals
Improve truthful packaging for that surface
For AI answer checks, record the full prompt, engine, date, locale, and any account state that could affect the output. Reuse the same prompt set when evaluating a change. A single answer is an observation, not a trend, and it should not trigger a site-wide rewrite.
Keep a change log for the URL. Record whether you altered access rules, positioning, the answer core, evidence, structured data, or distribution packaging. Then compare equivalent periods and inspect the metrics closest to the stage you changed. If you modify every layer at once, any improvement will be difficult to explain or repeat.
Choose one page with meaningful Search Console impressions and uncertain AI visibility. Run the diagnostic from access through measurement, fix the earliest material failure, and document that change. That gives you a defensible optimization process you can apply to the next page instead of another collection of AI SEO guesses.
If your Search Console impression line falls while clicks stay steady, don’t treat the chart as proof that your search visibility collapsed. Google confirmed that a logging error over-reported impressions from May 13, 2025 onward, so corrected reporting can produce a visible drop without removing any clicks you actually received.
The right response is to audit the measurement before changing your SEO. You need to separate the reporting correction from any genuine performance movement, rebuild affected comparisons, and explain why impression-based ratios may change even when user behavior does not.
What the correction changes and what it doesn’t
The confirmed problem was impression logging inside Google Search Console. It was not a change to how many people clicked your results, and Google said clicks were unaffected by the error. As fixes were implemented, the Performance report could therefore show fewer impressions without showing a corresponding loss of clicks.
That distinction matters because the metrics answer different questions. Impressions describe how often your result appeared in search results. Clicks describe visits initiated from those results. Conversions describe what visitors did afterward. A correction to the first metric does not retroactively remove the activity measured by the other two.
Click-through rate needs special handling because it is calculated from both affected and unaffected values:
CTR equals clicks divided by impressions.
An inflated impression denominator makes CTR appear lower.
If corrected impressions decrease while clicks stay unchanged, CTR can rise automatically.
That mathematical increase does not prove that titles, descriptions, rankings, or search intent improved.
The correction also isn’t a blanket explanation for every decline after May 13. A real SEO loss can occur during the same period as a reporting repair. Treat the bug as a measurement issue to test, not as a reason to dismiss contradictory evidence.
Use three signals before diagnosing an SEO decline
Don’t respond to the impression chart in isolation. Run the following check with the same Search Console property, search type, date range, country, device, page, and query filters throughout. Changing a filter halfway through creates another explanation for the difference.
Compare impressions and clicks on the same timeline. A sharp impression change accompanied by stable clicks is consistent with a reporting correction. If clicks also decline, the impression bug does not explain the entire movement.
Check an independent outcome. Review organic landing-page sessions, leads, sales, or another meaningful conversion in your analytics system. These numbers do not have to match Search Console clicks exactly because the systems measure differently; you are looking for corroborating direction, not identical totals.
Inspect where the change appears. A broad impression step across many pages and queries, with clicks remaining steady, fits a logging correction better than a decline concentrated in one directory, page type, country, device, or query group. A concentrated loss deserves a separate technical, content, or ranking investigation.
Google described the correction as a rollout taking several weeks rather than a single instantaneous rewrite. That means you should not expect every affected chart or saved report to change at exactly the same moment. Multiple movements during the correction window may still be reporting-related, but stable clicks remain the most useful first check supplied by this incident.
Hold off on reactive title rewrites, content deletions, internal-link changes, or technical deployments until this check identifies an independent problem. Those changes can introduce real performance movement and make an already messy reporting period harder to diagnose.
Rebuild comparisons around the May 13 boundary
May 13, 2025 is the important boundary. Impression data before that date was outside the confirmed error period. Impression data from that date onward was subject to over-reporting and subsequent correction.
May 2025 is therefore not a clean monthly baseline: it contains days before the confirmed start and days after it. Any longer reporting period that crosses May 13 also blends data from two measurement conditions. A smooth monthly or quarterly chart can hide that break unless you annotate it.
Add a visible annotation at May 13, 2025 in every dashboard that uses Search Console impressions or CTR.
Preserve exports created before the correction. Label them as pre-correction snapshots rather than silently replacing them; the old files will not update themselves.
Re-export affected date ranges from the current Performance report when you need a corrected analysis. Record the export date so another analyst can distinguish it from the earlier snapshot.
Recalculate every derived metric that uses impressions, including CTR, impression growth, impression forecasts, and custom visibility indices.
Prefer clicks and downstream conversions when an immediate business comparison is required, while still investigating any independent decline in those metrics.
Do not invent a flat correction factor. No reliable percentage was supplied for subtracting the overcount, and there is no basis here for assuming that every property, page, query, or day was inflated by the same proportion. Re-exporting corrected records is safer than multiplying old exports by an estimated adjustment.
Year-over-year reporting needs the same care. If one side of the comparison came from an inflated export and the other did not, the calculated growth rate is partly a measurement difference. Rebuild both sides from a consistent dataset before presenting the percentage as an SEO result.
Fix dashboards, forecasts, and the stakeholder narrative
The correction has different consequences for different reports. Update each one according to the metric it actually uses:
Impression dashboards: refresh affected ranges and retain a data-quality annotation.
CTR reports: recalculate the ratio after impression values are corrected, then avoid crediting the mechanical change to optimization work.
Click reports: keep using click totals, but investigate any genuine click movement on its own evidence.
Conversion reports: use them as an independent business check, while remembering that attribution rules can make them differ from Search Console clicks.
Forecasts: retrain or rebuild models that learned from inflated impressions. Otherwise, the model may set an unreachable impression baseline even if future search performance is healthy.
Your explanation to clients or leadership should distinguish a reporting change from an outcome change. It should also avoid promising that every unfavorable number is caused by the bug. The following status note keeps those boundaries clear.
Google confirmed that Search Console over-reported impressions from May 13, 2025 onward because of a logging error. Corrected reporting may reduce the displayed impression total, while clicks were not affected by this error. We are rebuilding impression and CTR comparisons and separately checking clicks and conversions for evidence of any real performance change.
Suggested stakeholder status note
That wording is more defensible than saying rankings definitely did not change. The correction proves that impression reporting was wrong; it does not prove that every site’s underlying search performance remained unchanged throughout the same period.
Google Search Console impression correction FAQ
Did my rankings drop when reported impressions fell?
The impression decrease alone cannot answer that question. If the drop appears as corrected reporting while clicks and independent organic outcomes remain stable, there is no evidence in that chart alone of a ranking loss. If clicks, conversions, or a specific group of pages and queries also decline, investigate that movement separately.
Can I compare CTR from before and after May 13?
Only after confirming that both sides use consistently corrected impression data. Clicks may be accurate on both sides while the impression denominator is not, producing an apparent CTR change that reflects data repair rather than different searcher behavior. Re-export the affected period and recalculate the ratio before drawing a conclusion.
Can I keep using an old Search Console export?
Keep it for the audit trail, but label it clearly if it includes impressions from May 13, 2025 onward and was captured before the correction. Do not combine its impression values with corrected exports or use it as an unqualified forecasting baseline. Create a new export for current analysis and retain the export date with the file.
When was the correction complete?
Google’s notice did not provide a precise completion date. It said the fixes would be implemented over several weeks. Avoid selecting an unsupported end date for the anomaly; document when each report was exported and verify affected historical ranges again before finalizing a high-stakes comparison.
Start with one report that crosses May 13. Annotate the boundary, place clicks beside impressions under identical filters, and relabel any earlier exports. Once the measurement history is clean, you can see whether anything remains that genuinely requires SEO work.
Your organic clicks increased. Before you call that an SEO win, find out who was searching. If the increase came almost entirely from queries containing your brand, organic search may be capturing demand created by advertising, public relations, product activity, or existing customer awareness. If non-branded queries grew instead, you may be reaching people who were searching for a problem or category rather than for you.
Contextual SEO keeps those situations separate. The goal is not to find one universal definition of good performance. It is to identify what changed, for which queries and pages, under which conditions, and what you should do next.
Key takeaways
Branded and non-branded search measure different relationships with demand. Do not judge them against the same CTR, position, or growth expectations.
Google Search Console’s branded-query filter gives you a native starting point, but its AI-generated classifications still need a human quality check.
A branded query is a query classification, not proof that the searcher is a returning customer or that SEO created the demand.
Report raw clicks and impressions alongside branded-share calculations. A changing percentage can hide which side of the ratio actually moved.
Segment by search type, page role, intent, market, and relevant business events before assigning a cause.
Use branded search to measure demand capture and non-branded search to measure discovery, then connect both to conversion data outside Search Console.
Context decides what an SEO number means
A click has no strategic meaning by itself. A branded click to a login page, a non-branded click to a comparison page, and an image-search click to a product page all appear in organic performance data, but they represent different needs and different opportunities.
This is why a responsible SEO answer so often begins with "it depends". Dependence is not an excuse to avoid a recommendation. It tells you which conditions must be defined before the recommendation becomes useful.
For branded search measurement, define these layers before interpreting a trend:
Business question: Are you evaluating brand demand, organic demand capture, category discovery, reputation, support demand, or revenue?
Query relationship: Does the query explicitly identify your company, a variation or misspelling of its name, or a distinctive product or service?
Search intent: Is the person navigating to a known destination, researching an offering, comparing alternatives, looking for help, or trying to complete a transaction?
Landing-page role: Is the result a homepage, product page, location page, editorial resource, support page, account page, or another type of destination?
Measurement scope: Which Search Console property, search type, country, device group, and comparison period are you using?
External context: Did a campaign, launch, news event, pricing change, public-relations effort, seasonal shift, site migration, or technical release overlap with the movement?
Without those boundaries, a sitewide average can combine unrelated behavior. Branded queries commonly carry stronger navigational intent than broad category queries, so comparing their CTRs directly does not reveal which segment is better optimized. Each segment should be compared with its own history and with similar query-page cohorts.
Average position needs the same care. It is an average across the queries included in the view. A change can reflect different queries entering the mix, not just an existing set of pages moving up or down. Use it to locate a question, then inspect the contributing queries and pages before making a decision.
Build a branded and non-branded baseline in Search Console
Google Search Console provides a native branded-queries filter in the Search results Performance report. It separates queries into branded and non-branded groups and applies the selected group to impressions, clicks, CTR, and average position. The filter works with Web, Image, Video, and News search types.
Use it to create a reproducible baseline rather than taking a single screenshot:
Choose one Search Console property. Record whether it is a domain property or a narrower URL-prefix property so the reporting scope is clear.
Select one search type. Do not combine Web, Image, Video, and News into one interpretation because each surface can respond to different content and user behavior.
Set a comparison period that covers the business event you are evaluating. Use the same dates, property, and filters for the total, branded, and non-branded views.
Export clicks, impressions, CTR, and average position for the total view. Repeat the export with Branded selected and then with Non-branded selected.
Break each segment down by the dimensions that matter to the question. Page groups, intent groups, country, and device are usually more useful than one sitewide total.
Save the filter scope, export date, classification notes, and known business events with the report. That record prevents a later analyst from comparing two differently defined datasets.
The four Search Console metrics answer different questions. Impressions indicate how often the included results were shown. Clicks show how much traffic those appearances produced. CTR describes clicks relative to impressions. Average position provides a directional view of visibility across the selected query set. None of them establishes why demand existed or whether the visit produced a business result.
Google uses an AI-driven system to classify branded queries. It can recognize brand variations, misspellings, multiple languages, and distinctive products or services associated with a brand. Contextual classification also creates the possibility of mistakes, especially where a term is ambiguous.
Audit the classification before presenting it as a clean split. Review the highest-impression and highest-click queries in both groups. Mark apparent false positives, false negatives, and terms whose meaning is genuinely ambiguous. You cannot rewrite Google’s classifier, but you can maintain an external exception list and disclose material ambiguity in your report. If questionable terms meaningfully affect the conclusion, create a separate ambiguous group in your exported analysis rather than forcing certainty.
The option is limited to eligible sites, and query or impression volume can affect eligibility. If the filter is unavailable, use a documented query list or regular-expression rule as a temporary substitute. Include the company name, known variations, misspellings, and distinctive product or service names. Version the rule whenever you change it so historical comparisons do not silently change definition.
The branded filter changes reporting, not rankings. Turning it on does not alter how a query or page performs in search.
Read brand demand, demand capture, and discovery separately
A branded query is a query-level signal. It does not identify the searcher as a loyal customer, prove that the person has visited before, or show which channel created the awareness. Someone can encounter a company elsewhere and then search its name for the first time. An existing customer can also use a generic query. Treat branded versus non-branded as a useful proxy for the wording and likely relationship of the query, not as an audience identity system.
With that limitation understood, the split gives you three useful views:
Observed brand demand: branded impressions show the search activity Google classified as explicitly connected to your brand. Call it observed demand because Search Console is not a complete brand-awareness survey.
Organic demand capture: branded clicks and branded CTR show how effectively your organic results captured those branded search opportunities.
Organic discovery: non-branded impressions and clicks show where you appeared and earned traffic without the query being classified as brand-led.
You can also calculate branded click share by dividing branded clicks by the combined branded and non-branded clicks in the same filtered scope. Use that percentage as a dependency indicator: it tells you how much reported organic traffic came through branded queries. It is not market share, brand awareness, or an SEO score.
Always place the share next to its raw numerator and denominator. Branded click share can fall because branded clicks declined, because non-branded clicks grew, or because both changed at different rates. Those scenarios lead to very different decisions.
Observed movement
Plausible reading
What to inspect next
Branded impressions rise while branded CTR is stable
More searches are being classified as brand-related, while organic capture remains proportionally similar.
Check which branded terms grew and compare the timing with campaigns, launches, publicity, seasonality, and other demand-generating activity.
Branded impressions are stable while branded clicks or CTR fall
Existing brand demand may be captured less effectively, although a changed query mix or search-results environment could also be involved.
Inspect the affected queries, ranking URLs, average position, result titles, page availability, indexation, and any migration or template changes.
Non-branded impressions rise while clicks lag
The site may be appearing for more queries without yet earning proportionate traffic. Weaker positions, poor intent alignment, or an expanded query mix are possible explanations.
Group the new visibility by query intent and landing page. Examine query-page fit, average position, and how accurately the result communicates the page’s value.
Non-branded clicks rise while branded activity is flat
Organic discovery improved, but the data does not yet show an accompanying increase in observed brand-query demand.
Identify the pages and topics driving discovery, then use analytics or customer data to evaluate engagement, conversion, and later brand interaction.
Branded activity rises while non-branded activity falls
Stronger observed brand demand may be masking weaker category discovery in the sitewide total.
Report the two movements separately. Diagnose non-branded losses by page group, intent, market, device, and search type before celebrating aggregate growth.
Both branded and non-branded clicks rise
Demand capture and discovery may both be improving, but common causes such as seasonality or broader market demand remain possible.
Find the query and page cohorts responsible for each increase, then compare them with known marketing activity and conversion outcomes.
These are diagnostic hypotheses, not automatic verdicts. Search Console shows patterns of visibility and traffic. It cannot by itself tell you that public relations caused branded demand, that a content change caused non-branded growth, or that an SEO campaign created awareness. The next check is part of the analysis, not an optional footnote.
Turn the split into a decision-ready SEO report
A useful report does more than label two lines on a chart. It connects a tightly defined observation to a decision. For every material change, write the analysis in this order:
Question: State what the analysis is meant to decide. For example, are you assessing non-branded discovery, branded-result capture, or the effect of a product launch?
Boundary: Record the property, dates, search type, market, device scope, query class, and page group.
Observation: Describe which raw metric moved and where. Avoid causal language at this stage.
Context: List overlapping SEO releases, technical incidents, campaigns, launches, publicity, pricing changes, seasonal conditions, and other events that could matter.
Interpretation: Offer the narrowest explanation supported by the segmented data. Preserve alternatives when more than one explanation fits.
Validation: Name the query, page, technical, analytics, campaign, or customer evidence that would support or weaken the interpretation.
Decision: Assign the next action, its owner, and the signal that will determine whether the action worked.
Suppose non-branded clicks increase on comparison pages while branded clicks remain flat. The defensible conclusion is that organic discovery improved within that page cohort. It is not yet evidence that brand awareness increased. Your next step is to inspect the gaining queries, confirm that the pages serve the intended comparison need, and evaluate downstream engagement or conversion in your analytics and customer systems.
The action should follow the diagnosed segment:
If branded impressions are healthy but capture weakens, verify that the correct official pages are indexed, available, and ranking for the relevant brand needs. Check whether titles and page purpose make the destination obvious.
If non-branded impressions grow without clicks, prioritize query-page alignment. Separate newly visible queries by intent before rewriting titles or content across the entire site.
If non-branded visibility declines in one page group, inspect that cohort for ranking, indexation, internal-linking, content-fit, and competitive changes. Do not redesign unrelated sections based on an aggregate loss.
If branded search rises after non-SEO activity, give the demand-generating channel appropriate context and evaluate SEO’s role as demand capture. Do not assign creation of the demand to SEO without additional evidence.
If the classification audit exposes material ambiguity, correct the exported reporting layer, disclose the rule, and keep the same definition in future comparisons.
On your next reporting cycle, export the branded and non-branded views before discussing total organic growth. Pick the segment that changed, inspect its query-page cohort, write one falsifiable explanation, and attach one action to it. That small discipline turns "it depends" from a vague qualification into a measurement method your team can use.
Your Google traffic dropped, but the aggregate line does not tell you what broke. Search and Discover can move for different reasons, and treating them as one channel can send you toward the wrong fix.
Separate the surfaces first. Then inspect timing, geography, impressions, clicks, queries, and affected page groups. That sequence will tell you whether to investigate distribution, content-market fit, measurement, or a broader site problem.
Start by separating Search from Discover
Google Search begins with an expressed query. Discover recommends content around a user’s inferred interests. A page can therefore lose Discover distribution while retaining Search demand, rankings, and clicks. The reverse can also happen.
Queries, landing pages, countries, devices, impressions, and clicks
Attributing a Search decline to a Discover-only update
Google Discover
A personalized recommendation based on interests
Discover pages, countries, devices, impressions, and clicks
Treating a feed-distribution change as a sitewide Search loss
Use the February scope only when interpreting that rollout window. Google said it planned to expand the update to other countries and languages later, so the original U.S.-English boundary should not be assumed for subsequent periods without verification.
Diagnose the change before editing content
Do not start by rewriting pages. First establish exactly where visibility changed. Otherwise, a Discover decline can trigger unnecessary Search edits, while a measurement fault can be mistaken for an algorithmic loss.
Verify the measurement. Compare your analytics platform with Search Console. If analytics traffic fell while Search Console impressions and clicks remained consistent, investigate consent, tagging, reporting, and attribution before changing content.
Split Search and Discover. Review each performance surface independently. Record the start of the change rather than relying on the combined organic traffic line.
Mark relevant rollout dates. If the movement began around February 5 through February 27, 2026, note that window. Timing creates a hypothesis; it does not prove a cause.
Segment the exposed audience. Compare the United States with other countries. Because Search Console does not give you a simple content-language diagnosis, also isolate the page groups serving your English-language U.S. audience.
Separate reach from response. Falling impressions indicate that the content was shown less often. If impressions are relatively stable but clicks fall, investigate placement, presentation, headline fit, and intent before concluding that visibility disappeared.
Find the affected page cluster. Group pages by subject, format, geography, creator, and publishing pattern. A concentrated decline is more actionable than a sitewide average.
If Search is stable and Discover falls, keep the investigation inside Discover until the evidence points elsewhere. Review which topics and geographic audiences lost impressions. Do not change title tags or Search-focused copy merely because the combined organic total declined.
If Discover falls mainly for U.S.-facing English pages around the rollout window while other markets remain steadier, the update is a plausible contributor. It is still not proof. Check whether the loss is concentrated in sensational headlines, thin coverage, non-local material, or topics where your site has little sustained expertise.
If Search declines but Discover remains stable, investigate Search demand, query visibility, landing pages, indexing, and technical conditions. The February Discover update is not an adequate explanation for that pattern.
If both surfaces decline, widen the scope. Confirm tracking, crawling, indexing, templates, site changes, demand, and the affected directories. A simultaneous decline may be broad, but the shared timing alone does not identify the cause.
Use long Search queries to expose conversational demand
Traditional keyword lists often miss the way people now phrase complex tasks, comparisons, and concerns. Search Console gives you a useful first-party proxy: the longer queries for which your pages already received impressions or clicks.
Open Search Console and go to Performance > Search queries.
Select Add filter > Query.
Choose Custom regex.
Enter ^(?:S+s+){9,}S+$.
Apply the filter and export the resulting queries with their available performance data.
The expression looks for at least 10 non-whitespace terms separated by whitespace. It is a practical threshold for finding prompt-like language, not a definition of an AI prompt.
That caveat matters. Search Console can contain data connected with AI Mode, and unusually conversational searches may resemble prompts used in an assistant. But a long query does not reveal where or how it originated. The user may have typed it directly into Google. Treat the data as evidence of conversational demand, not proof of ChatGPT, AI Mode, or another platform.
After export, cluster the queries by the behavior they reveal:
User job: planning, comparing, troubleshooting, learning, checking, or choosing.
Entity: your brand, a competitor, a product, a location, or a named problem.
Decision context: constraints, desired outcome, use case, audience, or risk.
Unresolved concern: reputation, an old incident, compatibility, trust, or a reason not to buy.
Current destination: the page that received the impression and whether it actually resolves the full request.
A spreadsheet works for a small export. A language model can accelerate a larger clustering task, but preserve every original query so you can audit its grouping. A useful instruction is: Group these queries by user job, entity, decision context, and concern. Preserve each original query, name the likely content gap, and do not infer which platform generated the query.
Treat query exports as potentially sensitive. Conversational strings can contain personal information. Remove or mask identifiable details before uploading the file to an external analysis tool, and follow your organization’s data-handling rules.
The result should not be an enormous list of literal sentences to monitor. Build a smaller prompt-tracking set around recurring themes. Prioritize a theme when it repeats, has a meaningful commercial or reputational consequence, intersects with a page already receiving visibility, and can be answered with credible content.
For example, several differently worded queries may all ask whether your company is a safe alternative to a better-known competitor. Track representative comparison and risk-objection prompts, then create or improve the page that should answer them. The theme is durable even when the exact wording changes.
Build the topical signals Discover is trying to reward
Discover’s expertise assessment can operate topic by topic. A broad publisher can establish a strong specialist section, while a site with one unrelated page offers much weaker evidence of sustained knowledge. You do not need to turn the whole domain into a single-topic publication, but the section you want recognized must be coherent.
Audit that footprint directly:
Name the subject for which you want the site or section to be recognized.
Label existing URLs as core coverage, genuinely supporting coverage, or unrelated material.
Connect related pages through clear navigation and internal links so the section is understandable as a body of work.
Use long-query clusters to find missing questions that belong naturally inside the subject.
Resist publishing a one-off page merely because a neighboring topic is popular.
The aim is not volume. It is continuity. Each new page should deepen the same audience’s understanding or help that audience complete the next related task.
Make originality, depth, and timeliness visible
Calling content original is not enough. The distinct contribution should be easy to identify. Before publishing, ask what the page adds that a competent reader could not get from a generic summary.
Originality: include your own reasoning, evidence, process, examples, or decision criteria rather than merely restating familiar advice.
Depth: answer the follow-up questions, constraints, tradeoffs, and failure cases implied by the main query.
Timeliness: explain what changed and why the change affects the reader. Do not refresh a date when the substance is unchanged.
Actionability: give the reader a next step, setting, filter, check, or decision they can actually use.
The conversational-query export can guide this work. If users repeatedly add the same constraint to a broad query, that constraint belongs in the content. If they keep asking about an old reputational issue, silence does not make the concern disappear; a current, factual answer may be necessary.
Treat local relevance as audience fit, not decoration
The update placed more weight on locally relevant content from domestic websites. A non-U.S. publisher serving a U.S. audience could therefore have experienced reduced Discover traffic during the initial U.S. rollout.
Segment that audience before reacting. If the decline is limited to U.S.-facing pages, examine whether the material genuinely reflects the market’s places, rules, products, terminology, and context. Do not disguise the site’s origin or add superficial location phrases. If your strongest expertise belongs to another market, preserve it and make the geographic scope explicit.
Remove the gap between the headline and the page
Discover’s move away from sensational content makes the headline-content relationship a practical audit point. The title should communicate the real value of the page without withholding the central fact or overstating the evidence.
Put the actual subject and consequence in the headline.
Remove unsupported superlatives, manufactured urgency, and curiosity gaps.
Deliver the promised answer near the beginning, then add context and depth.
Check that the headline still makes sense when separated from the image and surrounding feed.
If a restrained headline makes the content seem uninteresting, improve the substance instead of restoring the hype.
Google also said its systems would continue personalizing Discover around favored creators and sources. You cannot force that preference, but consistent subject expertise and dependable promises give readers a coherent reason to recognize and return to your work.
Key takeaways and your next move
Diagnose Search and Discover separately; a change in one surface does not establish a change in the other.
The February 2026 Discover core update ran from February 5 through February 27 and initially covered U.S. users viewing English content.
Use the 10-word Search Console regex to find conversational demand, but do not label every long query as an AI prompt.
Track recurring prompt themes rather than every literal query variation.
For Discover, strengthen sustained topic expertise, original depth, genuine timeliness, honest local relevance, and headline-content alignment.
Make changes only after you have identified the affected surface, audience, metric, and page cluster.
Your next visibility review should end with one explicit hypothesis. Write down the surface, change window, country, affected pages, impression pattern, click pattern, proposed change, and metric that would support or weaken the hypothesis.
Then change the smallest relevant layer. Fix measurement when the data disagrees, improve a page when conversational demand exposes an answer gap, or strengthen a coherent topic section when the Discover loss is concentrated there. Evaluate the result on the same surface and segment that led you to act.
Your Page indexing chart suddenly has no history before December 15. Before you change a canonical tag, edit robots.txt, or start requesting fresh crawls, stop. A missing reporting range is not the same thing as pages falling out of Google’s index.
The immediate job is to determine what the gap can and cannot tell you, protect your analysis from false conclusions, and document the limitation clearly. The same pre-December 15 gap appeared across Search Console users, with no explanation from Google at the time it was identified. That pattern makes a reporting problem the leading explanation, but it is not an official diagnosis.
First separate missing data from missing indexing
A reporting gap means Search Console is not displaying part of the historical record. An indexing loss means Google has stopped including pages that were previously indexed. Those conditions can look alarming in the same interface, but they call for very different responses.
The shape of the gap is your first clue. A clean cutoff at one calendar date, especially when the same cutoff appears in unrelated properties, is more consistent with a reporting-layer problem than with a coordinated technical failure across multiple websites. It still does not prove that every affected URL is indexed correctly. It tells you that the empty historical range cannot be used as evidence of an indexing loss.
Keep three statements separate in your notes and stakeholder updates:
The Page indexing report does not display data before December 15.
The cause had not been officially confirmed when the issue surfaced.
The missing range, by itself, does not show that pages were removed from Google’s index.
That wording prevents a common analytical mistake: turning an unknown into a negative result. Blank data is unavailable data, not zero indexed pages.
Audit the gap before touching the website
Use a short incident check instead of launching a full technical remediation project. The goal is to establish the scope of the reporting defect while independently checking whether the site has a current indexing problem.
Record the affected Search Console property, the report name, the missing date range, and the date you checked it. Save a screenshot so later viewers can see what was unavailable at the time.
Remove optional report filters and confirm whether the cutoff remains. This distinguishes a broad report gap from an empty filtered segment.
If you manage more than one property, check whether the boundary appears in another property. Matching cutoffs strengthen the reporting-incident explanation; different patterns warrant property-specific investigation.
Spot-check a small set of representative URLs with Search Console’s URL Inspection tool. Include important pages and several different templates. Treat those checks as evidence about current URL status, not as a reconstruction of the missing historical chart.
Review the operational evidence you already control: recent deployments, robots.txt changes, noindex directives, canonical changes, sitemap generation, server availability, and internal linking. Look for an event that actually coincides with a current indexing concern.
Compare other available signals without expecting them to reproduce the Page indexing report. Search visibility, crawl activity, server logs, and current URL status can reveal a real site problem even when historical report data is unavailable.
If the only abnormality is the uniform historical cutoff, do not manufacture a technical cause. If current URL checks and site-level evidence also deteriorated, investigate that separate problem on its own facts.
Do not let the gap corrupt your analysis
The most damaging response may happen outside Search Console. A dashboard, spreadsheet, or automated report can silently interpret missing rows as zeros, creating a false collapse in indexed-page counts. That false result can then flow into trend charts, alerts, forecasts, and client commentary.
Do not replace the missing period with zero. Use a null value or an explicit unavailable status if your reporting system supports one.
Do not interpolate the gap. A smooth line between the last historical value and the first visible value would be invented data.
Do not calculate percentage changes across the cutoff. The comparison would mix an unavailable observation with a real one.
Do not overwrite older exports that still contain historical values. Preserve them as dated snapshots and keep them separate from a new, incomplete extraction.
Exclude the affected range from automated anomaly alerts until the source data is usable again. Otherwise, the alert measures data availability rather than site health.
Add an annotation at the report level, not only in an email or chat thread. The limitation needs to travel with the chart when it is viewed later.
If you must deliver a report while the gap remains, show the unaffected period and label the unavailable interval. Do not hide the gap by changing the chart’s start date without explanation. A shorter clean-looking chart can imply that the omitted history was reviewed and intentionally excluded.
A reporting note you can use
Use language that identifies the limitation without claiming more than you know: “Google Search Console’s Page indexing report is not displaying history before December 15. We have treated that interval as unavailable rather than zero and have not attributed the gap to a website change. Current indexing checks are being assessed separately.”
Adjust the last sentence only if you have completed those checks. If you find a genuine technical issue, report it as a separate finding with its own evidence instead of presenting it as the explanation for the historical gap.
Changes that create more risk than information
A report anomaly does not justify changes to crawling or indexing controls. Editing robots.txt, removing noindex directives, changing canonicals, resubmitting sitemaps, or altering internal links may change how Google processes the site. Those actions can create a real indexing problem while you are trying to solve a display problem.
Make a technical change only when you can name the URL-level or template-level defect it corrects. A sound change request should identify the affected pages, the faulty directive or behavior, the expected result, and a way to verify it. “The chart is blank before December 15” does not meet that standard because a present-day site change cannot restore a missing historical series in Search Console.
The same restraint applies to executive conclusions. Do not describe the gap as a penalty, algorithm update, crawl-budget failure, migration error, or deindexing event without independent evidence. The interface is showing an absence of report history, not a cause.
Key takeaways
A blank historical range in the Page indexing report is not evidence that the indexed-page count fell to zero.
A shared December 15 cutoff points toward a reporting-layer issue, but Google’s lack of confirmation means the cause should remain unverified.
Check current indexing independently with representative URLs and site-controlled technical evidence.
Preserve nulls, annotate the affected range, and pause calculations or alerts that cross the gap.
Do not change crawl or indexing controls unless you have separate evidence of a specific website defect.
When the missing history returns
Restored data should be validated before it is allowed back into recurring reports. Check several dates around the previous cutoff, compare the restored range with any older export you preserved, and review derived totals or trend lines for discontinuities. Then refresh the dashboards and calculations that were paused.
Keep the incident annotation even after the chart looks normal. Record when the gap was first observed, what reporting was affected, when the data reappeared, and whether any historical values changed. That note protects future analysis from treating a repaired series as though it had always been continuously available.
For now, mark the range unavailable, preserve what you already have, and make website changes only when current evidence supports them. That keeps a Search Console reporting problem from becoming an SEO problem of your own making.