Lead totals can make a B2B paid search program look productive while obscuring whether it creates viable sales opportunities. The gap is especially important for complex, high-cost, regulated, or consultative purchases, where a website conversion begins the buying process rather than completes it.
A more useful measurement system follows prospects beyond the form, connects campaign activity with CRM outcomes, and gives Google Ads signals that better reflect commercial value.
Replace the lead scorecard with a business scorecard
Clicks, conversion rate, lead volume, and cost per lead remain useful diagnostic metrics. They show whether ads attract responses efficiently. They do not reveal whether those responses match the target customer profile, become opportunities, or produce revenue.
Search Engine Land illustrates the distinction with two hypothetical campaigns. The campaign with the cheaper leads generates less qualified pipeline and revenue, while the apparently expensive campaign produces the stronger commercial result.
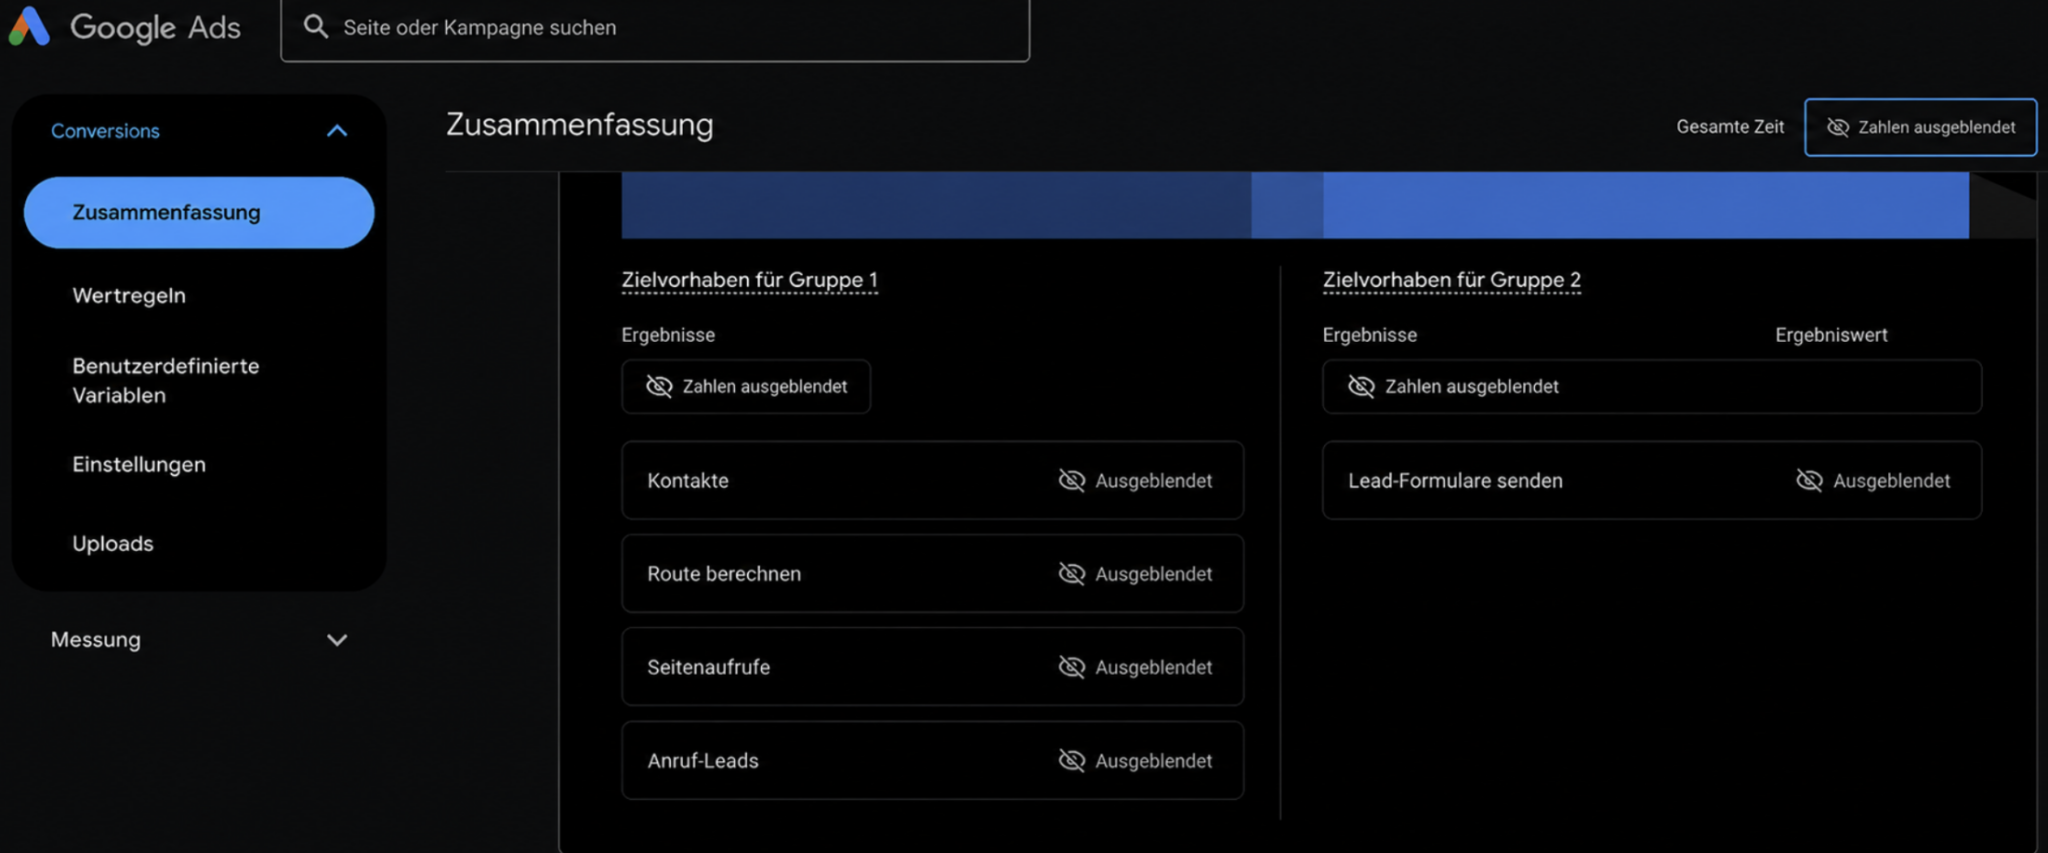
A German-language Google Ads conversion summary groups contacts, route calculations, page views, call leads, and lead form submissions, with all result figures hidden.
Metric
Campaign A
Campaign B
Leads
80
15
Cost per lead
$50
$200
Total spend
$4,000
$3,000
Qualified opportunities
2
8
Opportunity value
$20,000
$120,000
Revenue
$15,000
$95,000
ROAS
3.8x
31.7x
The example shows why a higher CPL is not automatically a problem. The relevant question is what the business receives for that cost. Cost per qualified lead, cost per opportunity, pipeline value, close rate, customer acquisition cost, revenue, and ROAS provide the missing context.
Give conversion actions a hierarchy
Not every action labeled as a conversion represents equal intent. A page view, route click, general form submission, direct contact request, sales-qualified lead, and closed deal occupy different positions in the commercial journey. Counting them together can inflate reported performance and blur the signal used for optimization.
This creates a predictable incentive problem: if an ad platform receives only a generic form-submission signal, automated bidding will seek more people likely to submit that form. It cannot infer which submissions came from serious business buyers and which came from consumers, students, competitors, or other poor-fit visitors.
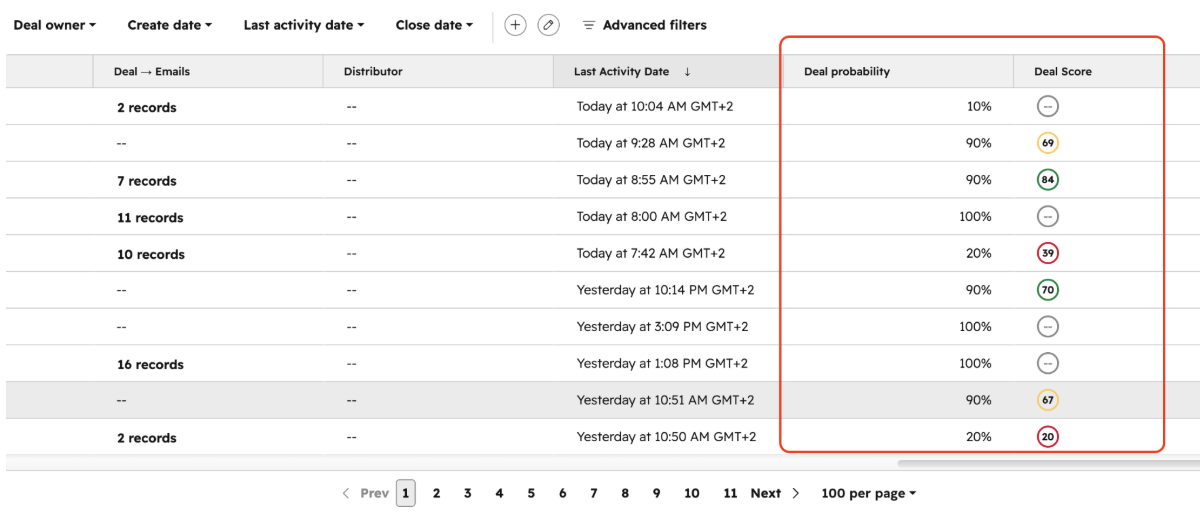
A deal list displays email record counts, recent activity times, probability percentages, and circular Deal Score indicators, with the final two columns outlined in red.
Teams should therefore define which actions are primary business outcomes, which are useful secondary indicators, and which exist only for observation. The classification should reflect buying intent and sales value rather than ease of tracking.
Use the CRM to connect acquisition with pipeline
The ad account explains how a prospect arrived and what the initial interaction cost. The CRM records what happened afterward. Combining those views makes it possible to compare campaigns by lead quality instead of response volume alone.
The source describes evaluating deals with two additional signals: a probability updated by sales according to conversations, budget, timing, and intent, and an AI-generated score based on available deal and engagement data. These are examples of downstream evidence, not universal scoring rules. Each business needs lifecycle definitions that match its own sales process.
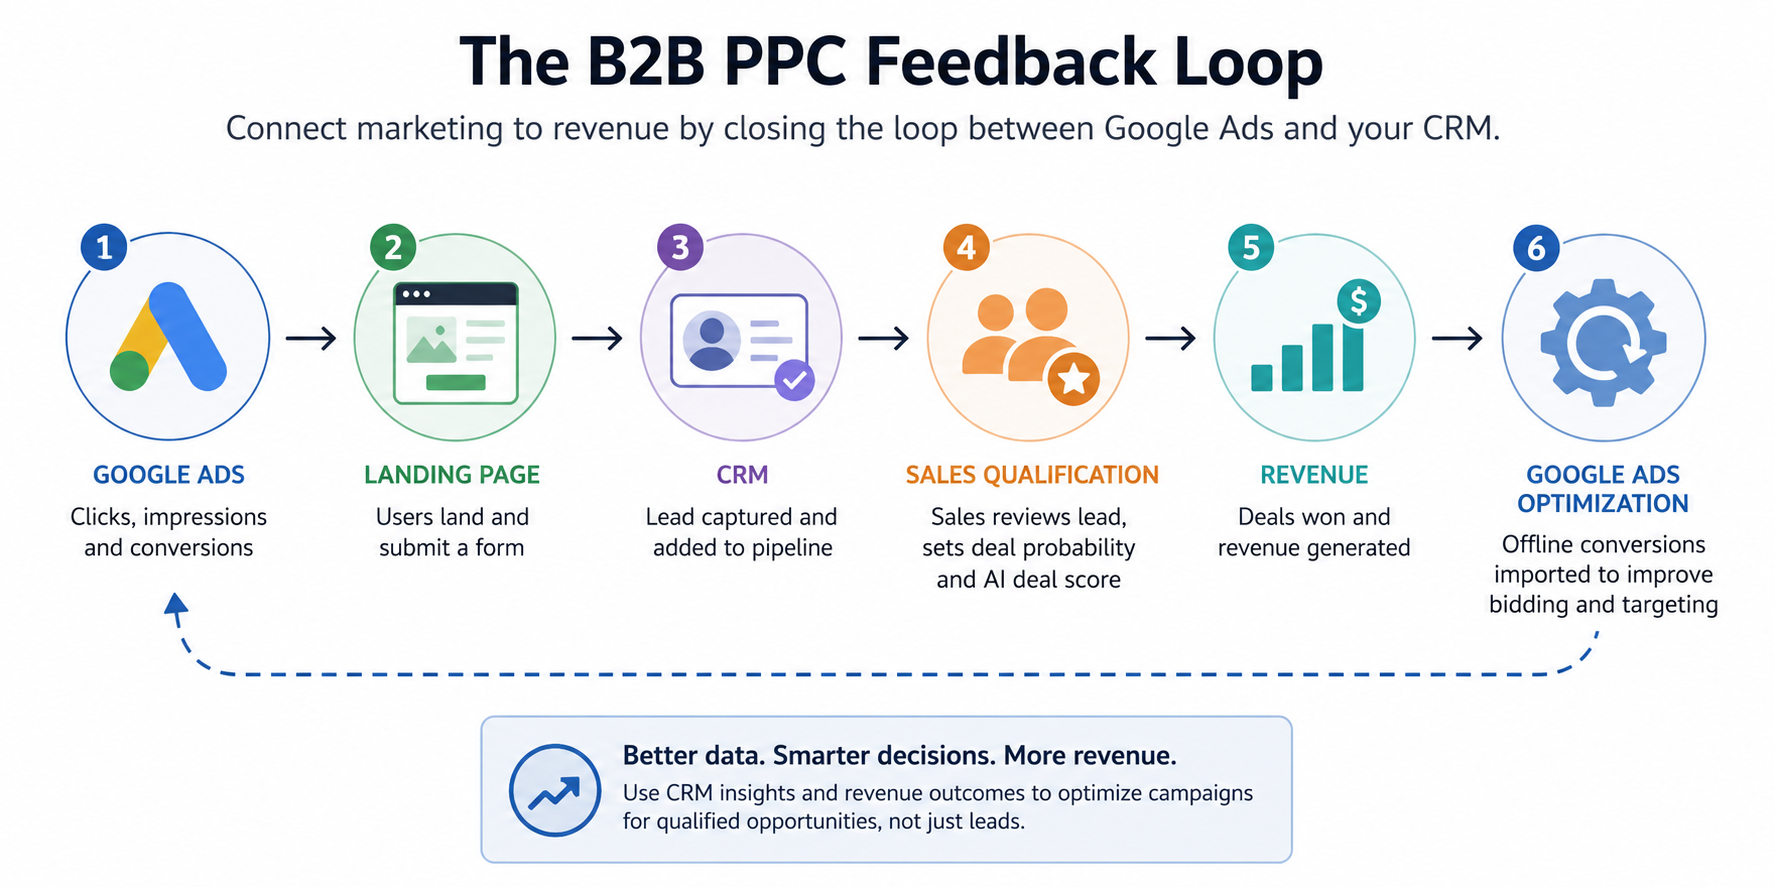
A six-step flow moves from Google Ads through form submission, CRM capture, sales qualification and revenue, then returns offline conversions for ad optimization.
A connected analysis should reveal which campaigns, keywords, and landing pages produce high-probability opportunities; which sources attract poor-fit inquiries; and which acquisition paths ultimately contribute revenue. GA4 and advertising data can support that analysis, but neither replaces the CRM record of qualification and sales progress.
Return qualified outcomes to Google Ads
Measurement becomes more actionable when lifecycle changes are imported as offline conversions. Depending on the sales process, useful events can include qualified lead, sales-qualified lead, opportunity created, deal won, and associated revenue value.
This feedback matters when automated bidding is in use because optimization follows the supplied signals. Better downstream data does not guarantee strong results, and long sales cycles can delay learning, but it gives the system a closer approximation of the outcomes the business actually wants.
Organic visibility, paid media and artificial intelligence merge into one connected search ecosystem, where vivid data streams link a creative website with a powerful analytics dashboard.
Implementation also requires data discipline. Campaign identifiers must survive the handoff into the CRM, lifecycle stages need consistent definitions, and duplicate or incorrectly assigned conversions can distort the feedback loop. Before changing bidding around deeper events, teams should confirm that those events are recorded reliably and occur often enough to support useful decisions.
Key takeaways
Use lead volume and CPL as diagnostics, not final judgments of B2B PPC value.
Separate weak engagement signals from qualified, opportunity, customer, and revenue outcomes.
Connect ad, analytics, and CRM records so campaigns can be assessed by pipeline quality.
Import reliable offline outcomes to move automated optimization closer to revenue.
Treat structured sales feedback as performance data that can inform targeting, search terms, landing pages, and budgets.
The practical shift is from asking how many contacts paid search produced to asking which investments created credible buying opportunities. As CRM feedback becomes cleaner and more consistent, budget decisions can follow commercial evidence instead of whichever campaign fills the top of the funnel fastest.
A freemium benchmark is only meaningful when its denominator is clear. Visitor-to-free-user conversion measures acquisition, while free-user-to-paid conversion measures monetization; neither rate alone describes the complete funnel.
The supplied 2026 report covers more than 80 SaaS clients observed between 2022 and 2026. It provides useful comparisons across industries and offer types, but it is the only benchmark study supplied here. The figures therefore represent one publisher’s dataset rather than a cross-publication consensus.
Two conversion rates define the freemium funnel
The report separates the journey into two stages. The first asks how many website visitors become free users. The second asks how many of those free users subsequently pay. This distinction prevents a strong signup rate from obscuring weak monetization, or a strong upgrade rate from obscuring limited free-user acquisition.
For traditional freemium, the report gives a 13.7% visitor-to-freemium rate and a 3.7% freemium-to-paid rate. Multiplying those stages produces an implied visitor-to-paid conversion rate of approximately 0.51%, or about 51 paid conversions per 10,000 visitors. That calculated figure is not a separately reported benchmark; it is a way to place both reported stages on a common denominator.
This full-funnel view changes how performance should be diagnosed. A company below the visitor-to-free benchmark likely has an acquisition, messaging, or signup issue. One attracting free users successfully but converting few of them to paid plans should examine activation, upgrade value, qualification, and the boundary between free and paid functionality.
Industry leaders change with the metric
The report’s industry results do not identify one universal winner. Healthcare/MedTech has the highest reported visitor-to-freemium rate at 15.2%, while Legal/LegalTech has the highest freemium-to-paid rate at 6.1%. Calculating the two stages together puts Legal/LegalTech first on implied visitor-to-paid conversion, at approximately 0.87%.
Industry
Visitor to freemium
Freemium to paid
Implied visitor to paid*
Advertising/AdTech
14.1%
3.8%
0.54%
Agriculture/AgTech
12.0%
4.6%
0.55%
Communications
12.4%
3.8%
0.47%
CRM
13.1%
3.7%
0.48%
Cybersecurity
12.2%
3.6%
0.44%
Education/EdTech
13.9%
2.6%
0.36%
Enterprise
12.2%
3.8%
0.46%
ERP
14.0%
5.2%
0.73%
Financial/Fintech
13.9%
4.1%
0.57%
Healthcare/MedTech
15.2%
3.9%
0.59%
HR
12.8%
3.3%
0.42%
IoT
15.0%
3.6%
0.54%
Legal/LegalTech
14.2%
6.1%
0.87%
Real Estate/PropTech
11.7%
2.9%
0.34%
RegTech
13.7%
5.3%
0.73%
*Calculated by multiplying the two reported stage rates, then rounding to two decimal places.
The calculation also surfaces patterns hidden by signup performance. EdTech’s 13.9% visitor-to-free rate matches Fintech’s and exceeds several other industries, but its 2.6% free-to-paid rate lowers its implied end-to-end result to roughly 0.36%. ERP and RegTech take different routes to nearly identical implied outcomes of about 0.73%: ERP combines 14.0% acquisition with 5.2% monetization, while RegTech combines 13.7% with 5.3%.
Free trials trade reach for stronger paid conversion
The report distinguishes three free-forever structures. Traditional freemium offers a functional but substantially limited product; Land & Expand supports individual use but requires payment at the organizational level; and Freeware 2.0 provides a fully functional free product with optional paid additions. It also compares opt-in and opt-out trials, with opt-out trials automatically becoming paid subscriptions when the trial ends.
Offer type
Visitor to free offer
Free offer to paid
Implied visitor to paid*
Traditional freemium
13.7%
3.7%
0.51%
Land & Expand
14.5%
3.0%
0.44%
Freeware 2.0
13.2%
3.3%
0.44%
Opt-in free trial
7.8%
17.8%
1.39%
Opt-out free trial
2.4%
49.9%
1.20%
*Calculated from the two reported stage rates and rounded to two decimal places.
The trial formats reach fewer visitors than the freemium formats in this dataset, but a much larger share of trial users become paid customers. The opt-out trial posts the highest second-stage rate, 49.9%, yet its low 2.4% visitor-to-trial rate produces a lower implied visitor-to-paid result than the opt-in trial: approximately 1.20% versus 1.39%.
That comparison shows why the highest rate at one stage is not automatically the best overall model. It also does not establish which format creates better customers. The supplied report does not provide retention, churn, revenue, acquisition cost, customer quality, or post-conversion cancellation data, so those outcomes cannot be inferred from initial paid conversion alone.
Key takeaways
Always identify the denominator: visitor-to-free and free-to-paid rates answer different questions.
Traditional freemium’s reported 13.7% and 3.7% stage rates imply approximately 0.51% visitor-to-paid conversion.
Industry ranking depends on the stage measured; Healthcare/MedTech leads free-user acquisition, while Legal/LegalTech leads free-to-paid and implied end-to-end conversion.
Free trials outperform the freemium formats on implied initial visitor-to-paid conversion in this dataset, but the report does not establish their retention or economic superiority.
Use benchmarks as diagnostic ranges, not targets
A useful benchmark comparison begins with aligned definitions. The start and end events, attribution window, treatment of returning users, eligibility rules, and meaning of a paid conversion should be consistent before an internal rate is compared with an external figure. Otherwise, apparent underperformance may be a measurement difference.
Teams should then compare each funnel stage separately and segment results by relevant acquisition and customer groups. The benchmark can indicate where investigation should begin, but product economics should decide what to optimize. More free accounts are not inherently valuable if they increase service costs without producing activation, durable revenue, or expansion.
As additional cohort data accumulates, the strongest operating benchmark will be the company’s own trend: consistently defined, segmented, and connected to retention and revenue rather than limited to the first payment.
IT, managed service provider, SaaS and growth marketing agencies are often presented as separate categories, but buyers are usually choosing among overlapping combinations of industry knowledge, channel expertise and commercial accountability. The useful question is not which label sounds most relevant; it is which operating model matches the company’s actual growth constraint.
Three agency reports published for 2026 provide a starting point for that decision. Read together, they show a broad and specialized market, while also illustrating why rankings should inform due diligence rather than replace it.
Agency labels describe different dimensions of the same decision
IT and MSP agencies are defined mainly by the markets they understand. SaaS agencies are similarly oriented around a business model and its associated buyer journey. Growth agencies, by contrast, are usually defined by an objective and an experimental way of working across acquisition, conversion and retention. These descriptions can coexist: a firm may be a SaaS specialist and still use a growth-marketing operating model.
The IT and MSP report makes the range of possible specializations especially visible. It associates agencies with GEO and SEO, branding and influencer marketing, full-service delivery, enterprise marketing, webinars, PPC, trade shows and WordPress design. That variety means two agencies in the same industry category may solve entirely different problems.
The growth-agency report says it reviewed 50 agencies spanning niche specialists and broader providers. Meanwhile, the SaaS report says it evaluated 57 contenders and selected eight. Together, the reports suggest that specialization is not a simple choice between a vertical expert and a generalist. Buyers must decide how much domain fluency, channel depth and cross-funnel coordination they need from the same partner.
What the 2026 rankings establish – and what they do not
The reports describe substantial candidate pools, but they expose different amounts of methodological detail. The IT and MSP article says it considered more than 53 candidates. Its stated weighting gives 25% each to notable clients and leadership experience, 20% to average review score, 15% to median employee tenure, 10% to founder involvement and 5% to year established. The growth-agency article identifies leadership experience as a 28% component of its analysis. The SaaS article reports its candidate and finalist counts, although the supplied account does not provide enough detail to compare its full scoring model with the others.
Report
Reported scope
Decision insight
IT and MSP agencies
More than 53 candidates; eight agencies listed
Shows how leadership, clients, reviews, staff tenure, founder involvement and longevity can be combined with service specialization
Growth marketing agencies
50 agencies
Frames the market as a mix of niche and broad-spectrum providers, with leadership experience carrying a reported 28% weight
SaaS marketing agencies
57 contenders; eight selected
Shows the selectivity of the publisher’s SaaS shortlist, but not enough disclosed detail here to compare every criterion directly
These measures are useful signals, not direct evidence that an agency will perform in a particular engagement. A recognizable client does not reveal the scope or outcome of the work. Review averages can conceal differences in project type. Employee tenure may indicate organizational stability, but it does not demonstrate expertise in the buyer’s market. Founder involvement can improve strategic continuity or create a bottleneck, depending on how delivery is structured.
Publisher incentives also matter. The IT and MSP article ranks First Page Sage, its own publisher, in first place and reports a 4.9 review score, 4.3-year median employee tenure and a 2009 founding date for the firm. Those details should be treated as vendor-published claims and independently checked. The same principle applies to every agency’s client logos, case studies, review summaries and performance assertions.
Key takeaways
Choose the specialization that matches the current constraint: industry fluency, a particular channel, cross-funnel experimentation or additional execution capacity.
Use agency rankings to discover candidates, then verify the evidence behind client names, reviews, staff stability and leadership credentials.
Compare the people who will perform the work, not only the executives and brands presented during the sales process.
Define commercial outcomes and measurement rules before comparing proposals, so agencies are evaluated against the same brief.
A better shortlist starts with the growth constraint
An IT or MSP business selling a technically complex service may benefit from an agency that can translate infrastructure, security or compliance topics into credible content. The IT and MSP report describes this approach in its profile of First Page Sage, which it says develops thought-leadership content around niche technical subjects and uses GEO and SEO to pursue authority and inbound leads. Because that description comes from the agency’s own publication, buyers should request representative work and attributable results before accepting the positioning.
A SaaS company may instead need help with the connections among acquisition, product education, conversion and retention. A growth-oriented partner can be relevant when the central challenge is not merely generating traffic but identifying and testing improvements across the customer journey. Neither category automatically guarantees those capabilities; the proposal and delivery team must demonstrate them.
Channel specialists make sense when the problem is already well diagnosed. The IT and MSP list, for example, associates ON24 Marketing with webinars, Alliance with trade shows, Seota Digital Marketing with WordPress design, and Yes& with PPC and branding for smaller IT companies. A broader agency is more defensible when channels must be coordinated, the internal team is thin or the company still needs to determine where its growth bottleneck sits.
The resulting brief should distinguish the business outcome from the marketing deliverable. A request for articles, paid campaigns or a website describes production. A request to increase qualified opportunities in a defined market describes the commercial problem. Agencies can then explain which deliverables they believe will influence that result, what assumptions the strategy depends on and how progress will be measured.
Due diligence should test evidence, delivery and fit
A strong evaluation process converts ranking criteria into questions that can be verified. For notable clients, the buyer should establish what the agency actually delivered, whether the engagement resembles the proposed work and whether outcomes can be discussed. For leadership experience, the relevant issue is how often senior leaders participate after the sale. For reviews and tenure, the agency should be asked to explain patterns, team continuity and who would own the account.
Case studies are most informative when they identify the starting condition, intervention, time frame, measurement method and agency contribution. Buyers should also separate leading indicators, such as visibility or engagement, from pipeline and revenue outcomes. Attribution rules, CRM responsibilities and reporting access should be agreed before work begins; otherwise, both sides may use the same words for different measures of success.
Operating fit is equally important. The evaluation should clarify the proposed team, specialist access, approval workflow, content-review process, reporting cadence, ownership of accounts and data, and the conditions for changing or ending the engagement. For technical B2B markets, subject-matter access and factual review deserve particular attention because marketing speed is valuable only when the material remains accurate and credible.
The most resilient choice will be the agency whose expertise, delivery system and evidence align with a clearly defined business problem. As search interfaces, buyer research habits and growth channels continue to change, that alignment will matter more than a permanent position on any annual list.
If AI seems unavoidable in your professional feed, it is easy to assume your customers have already moved their discovery and buying journeys into ChatGPT, Claude, or Gemini. That assumption can send budget toward the loudest channel rather than the audience you actually serve.
The useful question is not whether AI is popular. It is which audience uses which assistant for which job, and whether that behavior affects discovery, evaluation, or purchase. Once you separate those questions, you can make a defensible AI search plan instead of reacting to general enthusiasm.
Professional and consumer adoption are moving on different curves
The professional pattern looks different. Claude usage among B2B professionals was 373% higher than the U.S. average, while Claude and Gemini continued to gain users as ChatGPT’s desktop growth slowed. The 373% figure describes relative overrepresentation. It is not a market-share percentage, and it does not prove that most professionals use Claude.
This is not a clean split between people who use AI and people who do not. The same person can be a heavy assistant user at work and follow a conventional search, marketplace, or retailer journey when shopping. Adoption depends on context, task, and perceived value, not just demographics.
Key takeaways
Do not apply one AI adoption rate to professional and consumer audiences.
Separate assistant reach, frequency of use, task relevance, brand visibility, and commercial impact. They are different measurements.
If you market to B2B professionals, include Claude alongside ChatGPT and Gemini in your visibility testing.
If you market to retail shoppers, keep search, category, product, marketplace, and on-site discovery paths strong while you test AI as an additional layer.
Increase investment only when audience use and a relevant business outcome appear in the same segment.
Map adoption by audience and task before assigning budget
A market-wide AI number cannot tell you where to publish, what to optimize, or which assistant deserves attention. Build an audience-by-task map instead. It should distinguish what has been observed from what still needs to be tested.
Whether AI influences an earlier research step or a later purchase decision
Preserve conventional shopping journeys and test assistants selectively
Build the map before choosing a platform
Define audiences by commercial context. Separate professional users, procurement participants, existing customers, retail shoppers, and other materially different groups. Do not merge them merely because they can buy the same product.
Name the task. Record whether the person is trying to understand a problem, compare options, verify a claim, troubleshoot, create work, find a seller, or complete a purchase. A tool can be strong for one job and irrelevant to the next.
Collect audience-level evidence. Combine AI referral analytics with customer interviews, sales and support language, on-site search terms, and a direct attribution question. Ask which tool was used and what the person was trying to accomplish; a yes-or-no question about AI is too broad.
Label your confidence. Mark each audience-task-tool combination as observed, indicated, or unknown. A visible market trend can justify a test, but it should not be relabeled as proof about your customers.
Assign an action. Scale combinations supported by audience and outcome evidence, test combinations with a plausible signal, and monitor combinations supported only by general market attention.
The most common planning error is to start with a platform and look for reasons to fund it. Start with the audience and task instead. The platform should be the last column you fill in, not the first.
Adjust SEO, AEO, and GEO priorities to match the pattern
Adoption signals should change your priorities, not your technical standards. Pages still need to be crawlable, indexable, internally linked, consistent about named entities, and clear enough for a person to verify. Structured data must describe visible content accurately; it cannot compensate for a vague, unsupported, or inaccessible page.
For professional audiences, optimize around decisions
Where your audience resembles the measured B2B cohort, Claude belongs in the test set. That does not justify abandoning ChatGPT or Gemini. It means a ChatGPT-only visibility report can miss an assistant that is unusually prominent among professional users.
Give each important page a decision job. A page might explain compatibility, implementation requirements, operating constraints, use cases, or the difference between two approaches. Do not make one page answer every stage of the buying process.
Lead with a direct answer. Follow it with evidence, definitions, exceptions, and practical constraints. This gives human readers a fast answer while leaving enough context for an assistant to represent it accurately.
Keep entities unambiguous. Use consistent organization, product, feature, and category names in visible copy, titles, internal links, and applicable schema. If two names refer to the same thing, explain the relationship.
Test real professional questions. Run the questions your target roles ask through ChatGPT, Claude, and Gemini. Record whether your brand appears, whether the description is accurate, whether a citation is present, and which URL is surfaced.
Fix the underlying page before chasing mentions. If an assistant gives an incomplete answer, check whether your page actually states the missing fact clearly and supports it. Assistant-specific duplicate pages create more content to reconcile and can leave conflicting claims online.
For consumer audiences, treat AI as an added path
Lower ChatGPT incidence among retail shoppers and Claude’s absence from that audience’s top four do not make AI irrelevant. They do make an assistant-only discovery plan hard to defend. Keep the complete shopping journey usable without requiring an AI intermediary.
Protect category, product, marketplace, local, review, and on-site search paths that already help shoppers find and evaluate an offer.
Answer natural-language buying questions on the relevant category or product page instead of hiding useful details in promotional copy or disconnected FAQ pages.
Use applicable Product, Offer, or other structured data only when the corresponding information is visible, current, and internally consistent.
Test the assistants your audience actually mentions or sends traffic from. Do not give every platform equal budget merely because each one is growing somewhere.
Treat AI visibility as a supporting indicator until you can connect it to product discovery, qualified visits, assisted conversions, or purchases for that consumer segment.
The useful distinction is not B2B equals AI and B2C equals conventional search. It is that professional adoption currently provides a stronger reason to test multiple assistants aggressively, while consumer planning needs more segment-specific proof before AI becomes the primary route.
Measure adoption separately from visibility and revenue
A single AI traffic chart cannot tell you whether customers are adopting assistants, whether assistants know your brand, or whether visibility changes business results. Track those questions in separate layers.
Audience use: Ask which assistants people use, for what tasks, and at which point in the journey. Preserve an open-text option so your questionnaire does not force respondents into your platform assumptions.
Referral behavior: Break AI-referred sessions down by assistant, landing page, audience, and outcome. Treat this as a floor rather than a complete adoption count: copied answers and manually entered URLs will not preserve an AI referrer.
Answer visibility: Maintain a fixed set of audience-specific questions. For each check, record the assistant, date, answer, brand inclusion, factual accuracy, cited URLs, and competitors mentioned. Prompt tracking samples outputs; it does not measure how many customers saw them.
Commercial outcomes: Connect identifiable AI visits and self-reported AI use to qualified leads, sign-ups, assisted conversions, purchases, or the outcome your organization already values. Do not label correlation as causation when several channels touched the journey.
Technical access: Use server logs and crawl diagnostics to confirm whether relevant bots can reach important pages. Bot activity shows technical access or crawler interest, not human demand.
Use a simple decision rule. Scale when a defined audience uses an assistant for a relevant task, your visibility has a fixable gap, and improvement is associated with a qualified outcome. Run a contained test when audience and task are supported but commercial impact remains uncertain. Keep monitoring lightweight when the only evidence is broad market enthusiasm.
For your next planning cycle, choose one high-value professional segment and one important consumer segment. Build separate audience-task maps, test the assistants indicated for each, and move the next content investment only where audience, task, and outcome align.
You can see buyers using ChatGPT, Claude and Gemini to research vendors, yet your pipeline report may still reduce the result to organic, referral or direct traffic. If you cannot connect that activity to qualified demand, you cannot tell whether AI discovery deserves more investment or merely produces interesting charts.
The practical answer is not a single AI metric. Build an evidence chain from visibility, to an identifiable site visit, to an onsite action, to an opportunity. Google Analytics can now cover the middle of that chain more cleanly. Your CRM, LinkedIn activity and measurement rules must cover the rest.
Measure three layers instead of one AI traffic number
AI discovery is not the same thing as AI referral traffic. A buyer can encounter your brand in an assistant without clicking, visit through an identifiable assistant link, or return later through another channel. Those behaviors create different evidence and should not be combined under one label.
Measurement layer
Evidence you can record
Decision it supports
Discovery visibility
Your company, product or page appears for a controlled set of buyer questions
Whether assistants associate your brand with the right problem and category
Identifiable traffic
A supported assistant sends a visit that Google Analytics recognizes
Which assistants and cited pages generate site demand
Business outcome
The visitor completes a qualified action and the lead or account advances
Whether AI discovery contributes to pipeline, not just sessions
For visibility, maintain a fixed set of questions that reflect how a buyer researches your category. Record the assistant, exact prompt, date, brands mentioned, cited URLs and whether your brand appears in the answer or only in a citation. Keep the prompt wording and access conditions consistent when you repeat the check. The result is an observation, not a universal ranking, because assistant outputs can vary.
For traffic, use the native AI classification in Google Analytics. For business outcomes, use your existing definitions of a qualified action, lead, opportunity and revenue. This division prevents a common reporting error: treating a mention, a visit and a sale as interchangeable proof of success.
Build a GA4 view your revenue team can trust
Google Analytics now identifies supported assistant referrals automatically. Recognized visits can use the medium ai-assistant, the channel group AI Assistant and the campaign value (ai-assistant). This removes much of the custom filtering previously needed to isolate traffic from supported tools.
Confirm that AI Assistant appears in your acquisition reporting. If it does not, check the date range and whether you have any identifiable assistant referrals before changing channel definitions.
Break the channel down by source and landing page. The channel total tells you the size of the stream; the source shows which supported assistant sent it; the landing page reveals which answers or resources earned the click.
Compare AI Assistant and organic search over the same date range. Use the same qualified actions and conversion definitions for both channels. Otherwise, the comparison answers a reporting question rather than a business question.
Show counts beside rates. A high conversion rate based on a very small number of sessions is useful as an early signal, but it is not yet a dependable forecast.
Keep unidentified traffic unidentified. Do not relabel direct visits as AI traffic merely because AI visibility increased during the same period.
Your recurring report should include identifiable AI sessions, source, landing page, qualified action count, qualified action rate and any matched opportunities. Add the number of leads that explicitly named an AI assistant even when analytics did not record an AI referral. That last field exposes influence the channel report cannot see without pretending the attribution is certain.
The pattern matters more than the channel total. If AI traffic is small but converts well, protect the pages earning those visits and expand the buyer questions they answer. If traffic grows while qualified actions remain flat, inspect the landing page promise, offer and next step. More assistant visibility will not repair a page that attracts one intent and presents a call to action for another.
The AI Assistant channel is a measurement improvement, not complete AI attribution. It covers identifiable referrals from supported assistants. It cannot count an answer that satisfies the buyer without a click, and it cannot automatically recover an AI touch when the buyer returns later through direct traffic, branded search or a different device.
Connect assistant referrals to leads, accounts and opportunities
B2B attribution becomes difficult after the click because evaluation often continues across sessions and people. Solve that problem with explicit evidence labels rather than a more aggressive attribution claim.
Observed AI referral: Google Analytics placed the session in the AI Assistant channel.
Self-reported AI discovery: A lead named an assistant when asked how they found the company.
AI-influenced opportunity: the account has either form of documented AI evidence before opportunity creation.
AI-sourced opportunity: AI discovery met your narrower, written rule for the first known acquisition touch.
Do not merge these labels. An observed referral has stronger click evidence than an inferred influence, while a self-reported answer can reveal discovery that analytics missed. Both are useful as long as the dashboard preserves the distinction.
Choose the onsite action that represents meaningful intent for your sales motion. It might be a demo request, contact submission, trial start, pricing interaction or another event your team already treats as qualified.
When a visitor becomes a lead, carry permitted acquisition fields into the CRM: original source, current source, landing page, campaign and the date of the qualifying action. Retain the original values rather than overwriting them on every return visit.
Add a short, optional discovery question to the form or sales qualification process. Allow the buyer to name ChatGPT, Claude, Gemini or another route in their own words instead of forcing every answer into a fixed channel list.
Join the evidence at the lead and account levels where your consent and data practices allow it. Account-level reporting matters when one person researches and another submits the form.
Write the attribution rule directly in the dashboard. State which touch qualifies an opportunity as sourced, which touches count only as influenced, and whether the evidence must occur before lead or opportunity creation.
Track progression as counts and rates: identifiable AI sessions, qualified actions, leads, opportunities and closed revenue. Keep pipeline value beside opportunity count because one large deal can otherwise make a small channel look predictably scalable. For the same reason, do not forecast from conversion rate alone while the denominator remains small.
This model also gives sales a useful feedback role. When a prospect mentions an assistant, record the assistant, the question they were trying to answer and any page or claim they remember seeing. That information can reveal buyer language, missing content and attribution gaps without turning an anecdote into a performance benchmark.
Turn LinkedIn activity into a measurable discovery loop
LinkedIn can strengthen the public evidence around a B2B company, but activity alone is not a growth result. Treat the company page, employee expertise, long-form content and distribution as inputs. Measure assistant visibility, referral traffic and pipeline separately as outputs.
Remove ambiguity from your company and expert profiles
Start with factual consistency. Keep the business address, contact details and product descriptions accurate on your website. Update the LinkedIn company page’s About section and services, including relevant industry language. Treat the profiles of executives and active subject-matter experts as extensions of the same entity, with current roles and clear areas of expertise. These are core surfaces for B2B AI discovery work.
Assign an owner to each surface and update all of them when the company changes a product name, category, service or positioning statement. If your site publishes corresponding organization or product structured data, include it in the same update. Consistency does not guarantee an assistant mention, but it removes avoidable uncertainty about what the company does and who represents it.
Publish one complete answer for each valuable buyer question
Use LinkedIn articles and newsletters for questions that require more than a short update. The 800-1,200-word range associated with stronger AEO mentions is a useful starting hypothesis, not a universal ranking requirement. A complete 700-word answer is more useful than 1,000 words padded to satisfy a target.
Give each long-form asset a specific job:
Use the buyer’s question or decision in the headline.
Answer it directly near the beginning.
Name the product category, intended user and relevant constraints plainly.
Explain criteria and tradeoffs that help the buyer make a decision.
Link to the corresponding website resource when the reader needs evidence, implementation detail or a next step.
Connect the content to an identifiable expert whose profile supports the subject.
Add campaign parameters to links you control from LinkedIn so you can measure LinkedIn visits accurately. Keep those visits classified as LinkedIn traffic. A tracked LinkedIn click is not an AI referral, even when the content was also designed to improve AI discovery.
Use engagement thresholds as experiments, not ranking factors
If your team needs an initial promotion checkpoint, start with at least 10 substantive comments or 60 reactions. These figures can guide a campaign test, but they are not verified causal ranking factors for every LLM. Record them as engagement outcomes, then look independently for changes in assistant mentions, AI Assistant referrals and qualified demand.
Count comments that contribute a question, example, objection or informed response. A pile of generic replies may increase the visible total without improving the information around the topic. Employee participation, expert partnerships, boosted company updates, Thought Leader Ads and follower ads can expand distribution, but paid and organic exposure should remain separate in your campaign log.
Test one topic cluster from publication to pipeline
Choose one buyer question tied to a product or service that can create qualified demand.
Record the current website answer, LinkedIn coverage, controlled prompt observations and identifiable AI traffic.
Correct company and expert profile details before publishing, so entity changes and content changes happen in a documented sequence.
Publish the complete website resource and its LinkedIn treatment. Record the URL, author, publication date, distribution method, paid support and engagement.
Watch all three measurement layers through a reporting period appropriate to your traffic volume and sales cycle.
Compare the result with a similar topic cluster you did not change. Treat the difference as directional evidence unless your test design supports a stronger causal conclusion.
Read breaks in the chain literally. More LinkedIn engagement without more assistant visibility proves distribution, not AI discovery. More assistant visibility without referral growth may mean the answer resolves the question without a click or does not present a useful next step. More AI referrals without qualified actions points to the landing page or intent match. More qualified leads without opportunities points to qualification, offer fit or the sales handoff.
Key takeaways
Measure AI discovery as visibility, identifiable traffic and business outcomes. No single metric covers all three.
Use GA4’s AI Assistant channel for recognized referrals from supported assistants, but do not relabel direct traffic to fill attribution gaps.
Preserve observed referrals, self-reported discovery, influenced opportunities and sourced opportunities as separate evidence classes.
Keep website facts, LinkedIn company details and expert profiles current before trying to scale content distribution.
Treat the 800-1,200-word content range and engagement thresholds as test inputs, not universal LLM ranking rules.
Scale a topic only after you can follow its path from buyer question to content, assistant visibility, qualified action and pipeline.
Start with one revenue-relevant buyer question. Establish the baseline, publish a complete answer, track the assistant referral and carry the evidence into your CRM. The first broken link in that chain tells you what to fix next. Repair it before increasing content volume or promotion spend.
You have budget for another acquisition channel, but your dashboard cannot tell you whether growth needs more traffic, better traffic, or a landing page that converts more of the demand you already have. Choosing SEO because it compounds or PPC because it starts quickly will not solve that measurement problem.
You need to give each channel a specific job, compare conversion rates only across similar pages and calls to action, and follow every conversion far enough to see whether it becomes pipeline. Here is how to make that decision without turning a single benchmark into a forecast it was never meant to be.
Choose the channel that removes your current constraint
There is no universally best B2B SaaS acquisition channel. There is only a best fit for the constraint currently slowing your funnel. A company with little qualified search traffic has a different problem from one generating demo requests that sales rejects.
Build durable discovery around problems and searches your buyers already have
Results take time and require consistent, intent-matched content from a capable team
Qualified organic visits, primary landing-page conversions, and resulting pipeline
PPC and SEM
Capture high-intent demand quickly or test a market and offer
Traffic remains spend-dependent, and ongoing cost can be high
Search-term quality, qualified conversions, and cost per qualified opportunity
LinkedIn advertising
Reach professional audiences using role, company, or industry targeting
Paid campaigns can return less than organic strategies
Target-audience visits, qualified leads, and account-level progression
Account-based marketing
Concentrate sales and marketing effort on a limited set of valuable prospects
Concentrated effort creates concentrated risk, even though a major account can justify it
Engaged target accounts, meetings, opportunities, and account progression
Email marketing
Nurture known contacts and move existing interest toward a next step
A useful, permission-based list takes time to build
Qualified next-step conversions and pipeline influenced by the sequence
Trade shows
Create direct conversations and gauge interest in person
Attendance, travel, and presence are costly, while competing vendors make attention scarce
Qualified follow-ups, meetings, opportunities, and customers from event cohorts
Public speaking
Build authority and generate warmer conversations around expertise
The channel depends on a credible speaker and often involves travel expense
Attendee follow-ups, qualified meetings, and influenced opportunities
Webinars
Educate prospects and build trust without an in-person event
Preparation still takes time, and the host must hold attention
Attendance quality, next-step conversions, and influenced opportunities
Email illustrates why channel labels matter. If someone first found you through SEO, later attended a webinar, and finally booked a demo from an email, email completed the conversion but did not create the original demand. Calling every email conversion a new acquisition will overstate email and erase the channels that built the audience.
Before funding a channel, write down four decisions:
Name the constraint. Is the problem insufficient qualified reach, poor landing-page conversion, weak lead quality, slow nurture, or limited access to valuable accounts?
Define the channel’s job. Decide whether it should create demand, capture existing demand, nurture known leads, or accelerate specific accounts.
Name the business outcome. Choose the qualified lead, opportunity, account-stage change, or customer event that will determine whether the channel worked.
Set the decision rule before launch. Record what would make you continue, revise, expand, or stop the campaign. Base that rule on your economics and sales capacity, not on a generic click-through rate.
This prevents a common budgeting error: asking a slow, compounding channel to prove itself on the same timetable as paid search, or asking a nurture channel to produce net-new demand it never received.
Use the 1.1% SaaS benchmark as a diagnostic, not a quota
The available industry benchmark puts the B2B SaaS landing-page conversion rate at 1.1%. That is a useful reference point, but it is not a promise about your site, channel, offer, or sales cycle.
The underlying pool covered 83 companies in 27 industries from 2019 through 2026. Every included company used SEO, while 38 also used content creation, email marketing, or LinkedIn marketing. Home pages, About pages, and other general informational pages were excluded. Those boundaries matter: the 1.1% figure should not be presented as a benchmark for every SaaS website visit.
There is another important boundary. The B2B SaaS rate is an industry-level figure. The page-type rates below cover the broader B2B pool. They are not SaaS-by-page-type cross-tabulations, so you should not claim that every SaaS customer-type page ought to convert at 3.5%.
Benchmark scope
Page type
Conversion rate
How to interpret it
B2B SaaS industry benchmark
Included landing pages
1.1%
A directional reference for comparable SaaS landing-page traffic, not a sitewide target
Broader B2B page-type benchmark
Customer type
3.5%
Pages written for a well-defined client profile align closely with a specific audience
Broader B2B page-type benchmark
Application
3.1%
These pages connect a product or service to a problem the visitor needs solved
Broader B2B page-type benchmark
Product
2.9%
Product pages often receive more transactional intent
Broader B2B page-type benchmark
Service
2.7%
Service-page visitors are often further along in their buying journey
Broader B2B page-type benchmark
Industry
1.8%
These pages must show both sector understanding and relevant expertise
Broader B2B page-type benchmark
Location
1.1%
Generic or duplicated location copy can weaken relevance and conversion
Define one primary conversion for the page. Keep video plays, secondary link clicks, and other engagement events separate from the action that advances the buying process.
Segment before comparing. Break performance out by channel, campaign, page type, audience, and call to action. A sitewide average can conceal a strong product page and a weak location page.
Compare like with like. Evaluate demo pages against demo pages and educational offers against educational offers. Do not use a lower-friction newsletter rate to judge a demo page.
Check your own baseline. Your previous comparable cohorts tell you whether a change improved performance under your actual traffic mix.
Follow the conversion downstream. A higher form-completion rate is not an improvement if qualification, opportunity creation, or customer conversion deteriorates.
A sitewide conversion rate can even decline while acquisition improves. Adding more relevant educational traffic changes the denominator before those visitors are ready to request a demo. That is not a reason to ignore conversion; it is a reason to separate page intent and cohort maturity instead of demanding one blended number.
Match every channel to the right page and call to action
The landing page is part of the acquisition channel, not a handoff that happens after it. If an ad promises a solution for finance teams but sends visitors to a generic home page, the campaign has created its own conversion problem.
Send demand-capture traffic to the most specific relevant page
High-intent SEO and PPC traffic should land on the product, service, application, customer-type, industry, or location page that best matches the query and promise. Preserve that message from the search result or ad through the headline, supporting copy, proof, and primary call to action.
Product or service intent: lead with the problem solved, the relevant capability, and a suitable evaluation step.
Application intent: show how the product handles the named use case rather than repeating a generic feature list.
Customer-type intent: address the role or company profile directly, including the outcomes, objections, and proof that matter to that audience.
Industry intent: demonstrate sector knowledge with relevant language and evidence; changing only the industry name is not enough.
Location intent: explain why location changes delivery, coverage, compliance, availability, or service. If geography makes no meaningful difference, multiplying near-duplicate pages is unlikely to improve the visitor’s decision.
Not every organic visitor is ready for a demo. Educational SEO pages can offer a lower-friction next step, while transactional pages ask for a product conversation. Record those actions separately so the easier conversion does not make the channel look more commercially productive than it is.
Give targeted and relationship channels a continuous next step
LinkedIn advertising and ABM should carry audience specificity onto the destination page. If the targeting is built around a particular customer type or industry, the page should speak to that same group. Sending a narrow audience to broad copy discards the main advantage of the channel.
Trade shows, speaking engagements, webinars, and email need continuity of topic rather than a generic follow-up. The destination should remind the visitor what they engaged with, add the promised evidence or resource, and offer a next step consistent with their level of intent. A webinar attendee who requested education should not be treated as if they submitted a demo request.
Remove friction after you confirm message match
Form optimization cannot rescue irrelevant traffic or a mismatched offer. First confirm that the audience, promise, page, and call to action align. Then remove avoidable friction:
Do not remove fields merely to produce more submissions. If sales needs a field to identify fit or route the lead, deleting it can move work downstream and inflate an unqualified conversion rate. Test the field against qualified pipeline, not form completions alone.
Build a scorecard that connects acquisition to revenue
A landing-page conversion rate tells you where a visitor acted. It does not tell you whether the action was qualified, whether sales accepted it, or whether the channel created a customer. Your scorecard needs to preserve that chain.
Funnel measure
Definition
What a weak result usually tells you to inspect
Eligible landing-page visits
Relevant visits that had a genuine opportunity to complete the page’s primary action
Reach, targeting, search demand, tracking exclusions, and traffic quality
Visit-to-primary-conversion rate
Primary conversions divided by eligible landing-page visits
Message match, offer, proof, form friction, page type, and call-to-action clarity
Conversion-to-qualified-lead rate
Qualified leads divided by primary conversions
Targeting, qualification criteria, form design, and whether the conversion is too easy or too broad
Qualified-lead-to-opportunity rate
Created opportunities divided by qualified leads
Handoff speed, buyer readiness, sales follow-up, and offer-to-market fit
Opportunity-to-customer rate
New customers divided by opportunities
Commercial fit, evaluation process, competition, pricing, and sales execution
Cost per qualified opportunity
Full channel cost divided by qualified opportunities
Whether reach and conversion translate into economically useful pipeline
Customer acquisition cost
Applicable acquisition cost divided by new customers
Whether the complete channel economics support continued investment
Time to result
Elapsed time from cohort entry or channel investment to the chosen business outcome
Whether you are comparing channels over an appropriate decision window
For every primary conversion, retain the channel, campaign, landing page, page type, call to action, and form version. Connect that record to lead status, opportunity status, customer status, and the relevant dates. Without those dimensions, a redesign, new offer, or change in traffic mix can alter the blended rate without showing you why.
Keep first-touch acquisition and converting touch separate. First touch helps you understand where demand entered the measurable journey. Converting touch shows what prompted the recorded action. Assisted interactions explain how channels such as email, webinars, and retargeting helped between those points. None of those views is a complete truth by itself.
Use the scorecard as a diagnostic sequence:
Qualified visits are scarce, but comparable pages convert acceptably: work on acquisition reach and targeting.
Qualified visits are present, but the primary conversion rate is weak: inspect message continuity, page type, proof, form friction, and the call to action.
Primary conversions are healthy, but qualification is weak: tighten the audience, promise, conversion definition, or qualification step.
Qualified leads are healthy, but opportunities are weak: inspect readiness, routing, follow-up, and the sales handoff before buying more traffic.
Opportunities are healthy, but customers are scarce: the main constraint is now downstream of acquisition.
This sequence protects you from paying to amplify the wrong stage. More traffic into a weak page produces more leakage. More form fills with poor qualification create more sales work. A better headline metric is only valuable when the improvement survives the rest of the funnel.
Key takeaways
Choose a channel for a defined job: demand creation, demand capture, nurture, or account acceleration.
The 1.1% B2B SaaS landing-page benchmark is a directional reference with a specific sample and scope, not a forecast for every SaaS page.
Customer-type, application, product, service, industry, and location benchmarks describe the broader B2B pool; they are not SaaS-specific page targets.
Compare conversion rates only when page intent, traffic source, audience, and call to action are genuinely comparable.
Optimize forms and page elements against qualified pipeline, not raw submissions.
Connect channel, page, conversion, qualification, opportunity, customer, cost, and elapsed time before reallocating budget.
Start with your most recent complete acquisition cohort. Put each channel beside its intended job, destination page, primary conversion, qualified opportunities, customers, cost, and time to result. If you cannot trace that path yet, fix the measurement before changing the budget. Once the path is visible, fund the channel that removes the actual constraint and repair the stage where qualified demand is being lost.
Your Performance Max campaign can look efficient while your sales team rejects nearly every lead. That isn’t a contradiction. It means the campaign is succeeding against a conversion signal that doesn’t represent the business outcome you actually need.
You don’t need complete visibility into every automated bid to fix that problem. You need a reporting chain that connects platform activity to qualified pipeline, plus a disciplined way to intervene when the chain breaks. Here is how to build it.
Start with the business outcome, not the campaign CPL
Cost per lead is only useful when the word lead has a stable business meaning. A form submission, sales-accepted lead, opportunity and closed deal are not interchangeable outcomes. If PMax counts the first while your team values the third, a falling CPL can hide deteriorating performance.
Begin with a conversion inventory. List every action available to the campaign, then write down what each action proves. A form submission proves that someone completed a form. It does not prove that the person fits your market, has buying authority or represents a real organization. Treating those facts as equivalent gives automation an easy target and gives you misleading reporting.
Define the funnel stages your team can verify. Use the stages already applied consistently in your CRM, such as inquiry, accepted lead, opportunity and won business. Don’t create a more elaborate taxonomy than sales can maintain.
Choose the deepest dependable optimization signal. The ideal event is close to revenue, recorded consistently and available often enough to guide the campaign. If closed business is too sparse or delayed, use the nearest reliably graded stage rather than pretending a raw form fill is equally valuable.
Keep earlier actions for diagnosis. An inquiry can still reveal landing-page or creative behavior. It simply shouldn’t be allowed to masquerade as qualified demand in your business reporting.
Remove obvious form abuse before asking the algorithm to learn. Controls such as reCAPTCHA can reduce low-quality submissions. They don’t replace qualification, but they prevent some worthless activity from being treated as useful training data.
No tracking configuration can rescue an undefined lead. Sales and marketing must agree on the rule for accepting or rejecting one, and that rule must be applied consistently. Otherwise, imported outcomes encode internal inconsistency rather than buyer quality.
This also changes how you evaluate cost. A campaign with a higher form-fill CPL may be the better investment if more of those forms become accepted leads or opportunities. Compare cost at the deepest mature stage available, not merely at the fastest stage the ad platform can report.
Build a reporting chain that answers five different questions
No single PMax report can tell you whether a campaign is working. Placement data explains where ads appeared. Channel data shows how automated delivery was distributed. Intent reports add search context. Asset reporting helps you inspect messages and formats. Your CRM determines whether any of that activity produced business value.
Reporting layer
Question it answers
Evidence to inspect
Decision it can support
Business outcome
Did the lead progress?
CRM qualification, opportunities, won business and imported offline outcomes
Change the optimization signal, qualification process or lead controls
Campaign and channel
Where did automated delivery produce recorded conversions?
Campaign results, segmented conversion metrics and account-level channel reporting
Investigate channel mix and decide where a more focused follow-up test belongs
Publisher placement
Which inventory received spend and recorded conversions?
Microsoft’s Website Publisher URL report with spend and conversion data
Identify inventory worth studying, protect brand safety or add a justified URL exclusion
Intent and competition
What demand patterns surrounded performance?
Google search term insights, auction insights, search themes and brand controls
Refine intent guidance, separate branded demand or investigate a competitive change
Creative asset
Which messages and formats appear to attract response?
Asset-level reporting and controlled creative tests
Retire weak messages, add qualification or develop a stronger variant
Microsoft’s PMax reporting makes the placement layer more actionable by adding conversion and spend metrics to the Website Publisher URL report. That is materially better than a list of domains with no economic context. You can see which placements consumed budget and which were associated with recorded conversions.
But recorded conversions are still only as trustworthy as the conversion definition. A publisher with several form fills is not automatically a strong B2B placement if none of those people survive qualification. Conversely, a publisher with spend and no immediate conversion is not automatically waste if your evaluation window closes before leads mature. Join placement evidence to the CRM before making an efficiency judgment.
Google’s channel, search-term, auction and asset reporting answers different questions. Channel reporting can expose where reported results originate, while search term insights add context about demand. Auction insights help you notice competitive conditions. Asset reporting shows how creative components are being evaluated. None of these views, by itself, proves incremental revenue.
The practical rule is simple: use platform reporting to locate a pattern, then use downstream data to decide whether that pattern deserves action. A report is diagnostic evidence, not a verdict.
Apply PMax controls in the order that reduces uncertainty
When lead quality is poor, it is tempting to change audience signals, creative, themes and exclusions at once. That creates activity without producing a clear lesson. Apply controls from the bottom of the measurement chain upward.
1. Repair the conversion signal and form hygiene
First confirm that legitimate leads can be connected to later CRM stages and that obvious spam is filtered. If the campaign is rewarded for an event your business doesn’t value, every targeting adjustment rests on a faulty objective.
Inspect conversion metrics separately rather than blending every action into one total. A campaign that produces many shallow actions and few qualified outcomes should not receive the same interpretation as one that advances prospects through the funnel. Segmented conversion reporting and offline outcomes give you the distinction needed to see that difference.
2. Feed the system a clean first-party audience signal
A large CRM export is not automatically a useful audience input. It may mix customers, unqualified inquiries, inactive records, students, vendors and prospects at unrelated stages. That teaches the system that all records deserve equal attention.
Clean and segment the data before using it. Start with groups closest to a verified revenue event, provided each group has a consistent business definition. A list of accepted leads or opportunities usually carries clearer intent than an undifferentiated list of everyone who has ever completed a form. The value comes from the label, not the file size.
Treat audience signals as guidance to be validated. After launch, compare the resulting leads with the segment characteristics you intended to emphasize. If the campaign finds cheap conversions outside your real customer profile, the CRM outcome should overrule the attractive platform metric.
3. Use search themes and brand exclusions to clarify intent
Search themes can guide Google PMax toward the demand you want it to explore. Build them around the problems, use cases and buying situations your qualified prospects actually express. Avoid turning themes into a loose catalogue of every phrase related to your industry.
Brand exclusions solve a separate problem. If your objective is to assess incremental acquisition, branded demand can make an automated campaign look more efficient than its prospecting work really is. Search themes and brand exclusions provide useful control over those inputs and costs. Decide explicitly whether a campaign should capture existing brand demand or discover new demand, then configure and judge it against that purpose.
Review search term insights after the campaign has produced meaningful evidence. Look for patterns that indicate the wrong buyer, job seeker, student, consumer use case or research intent. Those patterns should lead to a specific hypothesis about themes, messaging or conversion quality. They shouldn’t trigger an indiscriminate attempt to block anything unfamiliar.
4. Treat placement exclusions as a precise control
Microsoft’s placement spend and conversion data can expose publishers that are clearly unsuitable for the brand or economically unproductive after downstream outcomes are considered. High-performing inventory can also inform a separate Audience Ads or remarketing strategy, while unsuitable inventory can be added to an account-level URL exclusion list.
Account-level exclusions have a wider blast radius than a campaign-specific observation. Before adding one, verify the exact domain, the reason for exclusion and the other campaigns that may rely on it. A clear brand-safety conflict can justify immediate action. An apparent performance problem needs more context: adequate spend relative to your economics, a review window long enough for lead grading and evidence that the recorded conversions did not progress.
Do not turn the placement report into a manual bidding console. Its best use is to find material exceptions: unsafe environments, obvious mismatch, persistent waste or inventory that deserves a focused follow-up strategy.
5. Make creative qualify the prospect
B2B creative should do more than generate attention. It should help the right buyer recognize relevance and help the wrong visitor recognize a mismatch. State the use case, intended role, business context or other genuine qualifier that distinguishes your offer. Vague creative may attract more interactions while making lead quality harder to control.
Video deserves deliberate treatment because YouTube is an important part of PMax inventory. Google also provides AI-assisted asset creation, creative testing and asset-level reporting. Use those capabilities to test a defined message difference, not merely to produce more variations. A useful test might compare problem-led positioning with outcome-led positioning, or broad language with a clear buyer qualifier.
Read asset results alongside lead quality. An asset that attracts many conversions but disproportionately weak prospects may be doing its job badly, even if the platform labels it positively. The next variation should address the mismatch in the message rather than simply changing the visual treatment.
Run a decision loop that sales can audit
PMax optimization becomes safer when every change starts with an observed business problem. Use the table below as a diagnostic map. The first column is a symptom, not a conclusion.
What you notice
What to verify
What to do next
Platform conversions rise while accepted leads stay flat
Which conversion actions increased, whether form abuse changed and whether offline outcomes are returning correctly
Correct the optimization signal or lead-quality controls before changing audience inputs
Form-fill CPL rises while opportunity creation improves
Cost per accepted lead and opportunity for a fully graded cohort
Judge the campaign on the deeper outcome rather than cutting it solely because the shallow CPL increased
A publisher consumes spend without qualified progression
Placement spend, recorded conversions, CRM outcomes, evaluation lag and brand suitability
Exclude a verified unsafe or persistently wasteful URL; otherwise gather enough context to distinguish delay from failure
One channel appears to overperform
Conversion mix and lead quality by channel
Use the pattern to design a focused channel or audience test instead of assuming every reported conversion has equal value
An asset attracts response but weak prospects
The CRM quality of leads associated with its message and offer
Add a buyer, use-case or business-context qualifier and test the revised message
Branded demand dominates the visible intent pattern
Whether the campaign’s job is brand capture or incremental acquisition
Use brand controls where appropriate and report branded and non-branded intent against separate expectations
Auction conditions change near a performance shift
Whether conversion quality, creative, landing experience or campaign inputs changed at the same time
Treat auction data as context and test the most plausible cause rather than declaring competition the cause automatically
Make the review window match your buying process. If sales has not yet graded the leads in a cohort, that cohort cannot support a final quality conclusion. Label it incomplete instead of filling the gap with the platform’s faster metrics.
Keep a short decision log for every material intervention. Record the observed problem, the evidence from each reporting layer, the change made, the downstream metric expected to move and the point at which the affected leads will be mature enough to review. This prevents the team from repeating tests or crediting an unrelated performance swing to the latest edit.
Change one major layer at a time where practical. If you replace the audience signal, add themes, exclude publishers and rewrite every asset together, you may improve results but learn very little about why. Sequencing changes turns automation from an opaque system into a set of testable business decisions.
Key takeaways
PMax optimizes the conversion definition you provide, so a cheap form submission is not evidence of efficient B2B growth.
Use offline outcomes and consistent CRM stages to evaluate cost per qualified result, not just cost per initial lead.
Placement, channel, intent, auction and asset reports answer different questions. Join them to downstream outcomes before acting.
Clean first-party audience segments, focused search themes and qualifying creative give automation better guidance.
Use URL and brand exclusions deliberately. Confirm the scope, business purpose and downstream evidence before restricting delivery.
Log each material change and wait until the affected lead cohort is mature enough to judge.
Start with the latest lead cohort that sales has completely graded. Compare its CRM outcomes with the campaign, channel, intent, placement and asset evidence available on your platform. Find the largest break in that chain and change that layer first. The goal is not to control every automated decision. It is to make sure automation is learning from, and being judged by, the same definition of value your business uses.
You paid to reach the buyer, earned the sales conversation, and got commercial agreement. Then the invoice stalled, the transfer became a support ticket, or the customer discovered that paying you would require an expensive international route. The campaign looked successful, but the revenue never completed the journey.
That gap is where global B2B payment optimization belongs. Your goal is not to offer every currency or payment method. It is to give each qualified buyer a clear, appropriate, measurable path from agreement to received funds – without weakening security, compliance, or financial controls.
Put the payment event inside your acquisition funnel
Many acquisition dashboards end at a form submission, booked meeting, signed contract, or closed-won opportunity. Finance begins its work after that point. When those systems do not share identifiers and status events, payment friction becomes an invisible conversion loss: marketing counts a win while accounts receivable waits for money that may never arrive.
For this audit, define the final acquisition event as the first payment received and reconciled. That does not replace your accounting rules or normal sales attribution. It gives growth, sales, and finance a shared operational endpoint.
The difference can materially change how you read customer acquisition cost. In one illustrative scenario, a campaign appears to acquire customers for $500 before payment. If 25% fail to complete the payment stage, the effective cost per paid customer becomes about $667: $500 divided by 0.75. The $500, 25%, and $667 figures illustrate the hidden-CAC mechanism; they are not a benchmark for your business.
Build a funnel that reflects the transaction you actually run. A sales-assisted journey might contain these events:
Commercial terms accepted
Invoice issued
Invoice delivered or viewed
Payment instructions viewed
Payment attempt initiated, when the provider can verify that event
Funds received
Funds matched to the correct account and invoice
A self-service product may substitute checkout events for the proposal and invoice steps. Do not manufacture precision your systems do not have. Opening bank-transfer instructions is not the same as initiating a transfer, and an unverified buyer statement that payment was sent is not the same as funds received.
Make the identifiers persistent. The campaign or lead ID should connect to the account, opportunity, invoice, payment, and reconciliation record. Store only the references needed for analysis. Sensitive card, bank, identity, and authentication data should remain inside appropriately controlled payment systems rather than being copied into marketing analytics.
Match your payment footprint to your demand footprint
A translated landing page does not make a campaign operationally local. If a buyer reaches localized messaging but receives domestic-only banking instructions, unfamiliar currency terms, or an avoidable international-transfer burden, the localization stops before the transaction. This mismatch between campaign geography and payment infrastructure is the first place to look when one market produces interest but weak paid conversion.
Create one market-to-payment matrix for every country you actively target. For each market, record:
The currency used in the proposal and displayed price
The invoice currency
The currency from which the buyer is likely to fund the payment
The currency your business ultimately receives or settles
The available payment routes and the eligibility conditions for each
Which party may bear provider, transfer, intermediary, or conversion costs
What payment timing you communicate and whether it is guaranteed or only expected
The buyer-facing instructions, support path, and failure-recovery process
The internal owner for payment exceptions in that market
Do not collapse price currency, invoice currency, funding currency, and settlement currency into a single field. They can be different. A buyer may accept your quoted price yet stop when the invoice reveals an unexpected conversion, a fee allocation they did not anticipate, or a route their accounts-payable process cannot use.
Evaluate total payment cost rather than the provider’s most visible fee. Your working model can include the provider charge, foreign-exchange spread, possible sender or intermediary charges, recipient charges, and the internal work needed to trace or reconcile the transaction. Some components will not apply to every route. The point is to expose them before you compare options.
Possible routes include SWIFT, ACH, local bank rails, and stablecoins. A longer list is not automatically a better experience. The right route must fit the buyer, transaction, jurisdiction, settlement needs, and your control environment. Before enabling a new money-moving method – particularly one involving stablecoins – have qualified finance, treasury, legal, tax, security, and compliance personnel assess eligibility, custody, settlement, reporting, contractual, and jurisdiction-specific consequences. Faster movement is not a reason to bypass those reviews.
When you compare providers, require written answers about supported countries, currencies, payer eligibility, settlement behavior, failure handling, fee disclosure, reconciliation data, and support escalation. Treat phrases such as local, instant, or fee-free as claims that need precise definitions. Ask what each term includes, excludes, and depends on before you repeat it to a customer.
Design the quote-to-cash handoff as conversion UX
The payment experience begins before the buyer reaches a checkout or receives an invoice. Commercial terms create expectations about price, currency, timing, and responsibility for charges. If the operational payment path contradicts those expectations, the customer has to reopen a decision they appeared to have finished.
Use a consistent handoff from proposal to payment:
State the transaction currency and accepted payment routes before agreement. If options depend on the buyer’s location or legal entity, say so.
Explain how applicable payment or conversion costs are handled. Do not promise an exact buyer-side total unless you can substantiate it for that route.
Issue the invoice from the expected legal entity and make the payer, beneficiary, amount, currency, due terms, invoice reference, and support contact easy to identify.
Give the buyer one authoritative set of payment instructions. Remove stale attachments, duplicated bank details, and conflicting versions.
Tell the buyer what acknowledgement they will receive after initiating payment, after funds arrive, and after the payment is matched to the invoice. Those are separate events.
Provide a specific recovery path for a rejected, delayed, duplicated, underpaid, overpaid, or unmatched transaction.
Changes to beneficiary or bank details carry a serious fraud risk. Do not ask buyers or employees to trust a change solely because it arrived by email. Your finance and security teams should maintain an approved, independently verified procedure for validating payment-instruction changes, and customer-facing material should explain that procedure without exposing sensitive controls.
Internally, assign responsibility at each handoff. Sales should know where to send a buyer with a currency or payment-method question. Finance should know which campaign, account, and invoice a payment belongs to. Support should have an escalation route that does not require the buyer to repeat the transaction history. Marketing should receive status events without receiving sensitive payment data.
Provider notifications are useful only when they map to meaningful states. An alert that an invoice was opened is not a payment. A transfer initiation is not settlement. Funds received may still require matching. Reliable, timely notifications can shorten follow-up and improve attribution, but each notification must retain its exact meaning as it moves into your CRM and analytics tools.
Measure settled revenue and diagnose the point of friction
Do not begin with a provider replacement. Begin with a failure map. Separate buyer abandonment, provider rejection, compliance review, processing delay, invoice error, support delay, and reconciliation failure. They happen at different stages and require different owners.
What you observe
What to inspect next
First useful action
Accepted deals do not reach a payment attempt
Invoice delivery, currency clarity, available route, fee disclosure, and accounts-payable requirements
Review stalled deals by market and record the buyer’s stated blocker instead of assuming price resistance
Separate fixable usability errors from risk or compliance decisions that must not be bypassed
Funds arrive but remain unmatched
Invoice reference, account identifier, remittance data, and reconciliation mapping
Use a durable payment reference and preserve it across the provider, bank, finance system, and CRM
One market requires repeated manual intervention
Currency mismatch, route availability, local payer requirements, instructions, and support ownership
Update the market-to-payment matrix and remove the recurring handoff defect
Marketing reports customers that finance cannot verify
Conversion definition, event timestamps, duplicate records, refunds, and payment status
Create a paid-customer view based on received and reconciled first payments
Your core metrics should answer different questions rather than compressing the whole journey into one conversion rate:
Payment-start rate: accounts reaching a verified attempt divided by accounts presented with a payable invoice or checkout.
Payment completion rate: successful first payments divided by verified first-payment attempts.
Paid-customer CAC: acquisition spend divided by new customers whose first payment was received under your defined measurement rule.
Agreement-to-payment time: elapsed time from accepted commercial terms to received funds.
Reconciliation time: elapsed time from funds received to the payment being matched and available to downstream systems.
Manual-intervention rate: payable accounts requiring human correction or escalation divided by all payable accounts in the cohort.
Failure mix: the share of unsuccessful journeys assigned to each documented reason.
Define every numerator, denominator, timestamp, and status before publishing the dashboard. For example, decide whether a successful payment means initiated, received, settled, or reconciled. Use the same definition across growth and finance reporting. Keep accounting recognition separate where your accounting policy requires it.
Segment the funnel by buyer country, invoice currency, funding currency when known, payment route, customer type, campaign, and sales-assisted versus self-service journey. Aggregate performance can conceal a severe problem in one market. At the same time, small segments can produce unstable rates, so inspect the underlying transactions before acting on a percentage.
Do not label every unpaid invoice as payment friction or lost revenue. Contract disputes, procurement delays, credit terms, buyer cash constraints, and deliberate risk controls can also prevent or delay payment. Mark unresolved first invoices as at risk, assign a reason when evidence becomes available, and reserve causal claims for cases you can support.
Once a recurring friction point is documented, test the smallest safe change that addresses it. Candidates include clearer fee language, a more appropriate default currency, reordered payment options, fewer duplicative fields, better invoice references, improved instructions, or faster operational notifications. Hold the eligibility, security, fraud, compliance, and approval requirements constant. A conversion test is not permission to weaken a financial control.
Judge the result on received, reconciled first payments and agreement-to-payment time. Also check manual workload, transaction cost, support demand, disputes, and risk outcomes. A change that moves more buyers into an expensive exception queue has not solved the underlying problem.
Key takeaways for your payment-friction audit
Extend acquisition measurement to the first received and reconciled payment; a signed deal is not the final payment event.
Map price, invoice, funding, and settlement currencies separately for every market you actively target.
Compare payment routes on eligibility, buyer effort, total cost, settlement behavior, reconciliation data, and controls – not on the headline fee alone.
Treat proposals, invoices, instructions, status messages, and exception handling as one quote-to-cash experience.
Diagnose the exact failure stage before changing a provider, adding a method, or redesigning the interface.
Never trade away fraud, security, legal, tax, treasury, or compliance controls to produce a cleaner conversion metric.
Start with the active market showing the clearest gap between commercial agreement and received funds. Trace one successful deal and one stalled deal from campaign record to reconciliation. Find the earliest meaningful difference, fix the largest recurring and avoidable obstacle, and then measure the next cohort against the same definitions. That gives your next global campaign a payment path designed to finish the conversion it starts.
You can have a full content calendar, capable writers, strong subject-matter experts, and an AI workflow that produces drafts in minutes, yet still sound interchangeable with every competitor. The problem usually sits upstream: nobody has made a firm decision about what the market should believe about the brand.
A human-led strategy fixes that without discarding AI. People retain the decisions with commercial consequences: what the brand should mean, which evidence deserves emphasis, what not to claim, and which trade-offs are acceptable. AI handles bounded work around those decisions, including organization, drafting, transformation, consistency checks, and distribution.
Brand strategy begins with a decision, not a prompt
AI can generate dozens of plausible positioning statements. That abundance is useful for exploration, but it is not a strategy. A position becomes strategic when you choose one interpretation of the business, support it, and reject adjacent messages that would weaken it.
The distinction matters because your preferred position may not be the most obvious conclusion available from the facts. AI can connect known information and propose possible narratives, but it does not carry responsibility for choosing the narrative that serves your company, customers, and long-term direction. A named human must make that choice.
A practical way to structure the decision is the claim-frame-prove discipline. It separates three elements that teams often collapse into one vague brand statement.
Element
Question it must answer
Human decision
Required output
Claim
What do we want the market to believe?
Choose a specific, defensible proposition instead of a collection of benefits.
A sentence that can be tested against evidence.
Frame
Why does this claim matter, and how should the evidence be interpreted?
Select the commercially useful conclusion and the alternative view you are challenging.
An explicit logical bridge from accepted facts to the desired association.
Proof
Why should a buyer or an answer engine believe us?
Set the evidence threshold, boundaries, and caveats.
Named, accessible support for every material assertion.
Write the claim so it can succeed or fail
Statements such as trusted partner, innovative platform, and customer-first company are difficult to disprove, which also makes them difficult to value. Replace them with a proposition that has an identifiable audience, problem, outcome, and reason to believe.
Use this working structure: For a specific buyer facing a specific decision, the brand represents a defined approach or advantage because named evidence supports it. This matters because the evidence leads to a useful conclusion the buyer may not have considered.
Do not publish the template itself. Use it to force the internal decision. If the team cannot complete it without broad adjectives, multiple audiences, or unsupported outcomes, the positioning is not ready for production.
Treat the frame as strategy, not decoration
A frame is not a clever slogan placed above the same old product copy. It tells the reader what the evidence means. Two companies may have similar capabilities, but the company that explains the consequence of those capabilities can own a more useful association in the buyer’s mind.
Pressure-test a proposed frame with five questions:
Would a relevant competitor be equally comfortable making this claim?
Does the proof establish the promised outcome, or merely show that a feature exists?
Does the frame add a meaningful conclusion rather than restating the claim?
Can a skeptical reader follow the path from evidence to conclusion without filling in a missing step?
Have you stated the conditions or use cases in which the claim does not apply?
If the competitor can copy the entire argument without changing the evidence, you have a category description, not a position. If the conclusion requires a leap that the proof cannot support, you have promotion, not a position. Human judgment is the work of finding the narrow territory between those failures.
Turn positioning into a content operating system
A positioning document has little value if every writer interprets it differently. Your content system must carry the same claim, frame, and proof into landing pages, executive viewpoints, product education, case material, sales enablement, and answer-focused content without forcing every asset to repeat identical wording.
Start with a claim ledger rather than a topic calendar. The calendar tells you when something will be published. The ledger tells you what the business is prepared to assert, why it is true, where the evidence lives, and who is accountable for approving it.
Each ledger entry should contain:
Approved claim: the exact proposition content may communicate.
Intended audience and decision: who needs the information and what they are trying to decide.
Strategic frame: the conclusion the evidence should help the audience reach.
Proof: the product fact, operational evidence, customer evidence, expert knowledge, or other support available for the claim.
Evidence location: the page, record, or internal owner that can substantiate the assertion.
Scope limits: markets, use cases, products, or circumstances the claim does not cover.
Approval owner: the person authorized to accept, narrow, or reject the claim.
A claim without an evidence location or owner is not ready to enter an AI prompt. Marking it as unverified is safer than allowing a drafting system to fill the gap with language that merely sounds credible.
Brief content around a buyer decision
Topic-only briefs produce topic-shaped content: broad, informative, and hard to distinguish. A decision brief tells the writer what must change for the reader. It should identify the question that brought the reader to the page, the misconception or uncertainty blocking progress, the approved claim, the frame, the evidence, and the next sensible action.
Before drafting, require the content owner to finish this sentence: After reading, the intended buyer should be able to decide whether or how to do something specific. If the answer is merely understand the topic, the brief is probably too broad.
Then assign the page one primary job. It might define a problem, establish a fact, compare approaches, resolve an objection, substantiate a brand claim, or help the buyer act. A page may support secondary jobs, but letting every asset do everything usually produces a long page with no clear purpose.
Give AI bounded responsibilities
AI is most useful after the decision architecture exists. Give it approved material and a defined transformation, then require it to expose gaps instead of inventing bridges.
Suitable AI responsibilities include:
Grouping buyer questions by intent or stage.
Turning approved interviews and notes into candidate outlines.
Producing channel-specific versions of an approved argument.
Checking drafts for contradictions against the claim ledger.
Finding assertions that lack attached evidence.
Suggesting alternative explanations while preserving the approved position.
Identifying where the relationship between a claim and its proof remains implicit.
Keep these responsibilities human:
Choosing the market association the brand will pursue.
Deciding which audience or use case takes priority.
Judging whether the available evidence is strong enough.
Resolving disagreements between subject-matter experts.
Approving external claims, comparisons, and conclusions.
Deciding what the brand will deliberately decline to say.
The boundary is simple: AI may generate options and transformations, but it does not receive decision rights. Record the human decision before generation begins so the team can distinguish deliberate strategy from wording that appeared during drafting.
Make the brand legible to buyers and answer engines
Having evidence somewhere on the website is not the same as communicating an evidence-backed position. A person may infer the connection after visiting several pages. A search or answer system may not make the same connection, and it has no obligation to choose the interpretation most favorable to your brand.
Brand evidence typically becomes more usable through three levels:
You can find US B2B SEO agency candidates for 2026 quickly. The expensive part is deciding which one can understand your market, earn trust from technical buyers, and connect search visibility to qualified pipeline.
The right agency is not necessarily the largest, the most visible, or the one offering the longest list of services. It is the team whose operating model fits your buyers, internal resources, website, sales process, and evidence requirements. Use the framework below to make that fit visible before you sign.
Define the commercial job before you contact an agency
A weak agency search usually begins with a weak brief. If you ask candidates to increase traffic, each agency can tell a plausible story while solving a different problem. One may pursue high-volume informational queries, another may rebuild technical foundations, and another may publish comparison pages. All of those activities can be legitimate, but they do not produce the same commercial result.
Start with the buying motion. Your brief should give every candidate the same operating context:
Your priority products or services, including which offers matter most commercially.
The industries, company types, account sizes, and buyer roles you want to reach.
The problems buyers recognize before they know your category or brand.
The questions, objections, security concerns, integration requirements, and proof requests that appear during sales.
The actions you treat as meaningful conversions, such as a qualified demo request, assessment, trial, application, or sales conversation.
Your website platform, analytics setup, CRM workflow, approval process, and technical constraints.
The subject-matter experts, developers, designers, legal reviewers, and sales staff the agency can realistically access.
The work that must remain internal and the work you expect the agency to own.
Be precise about what US-based means to you. A US headquarters, experience selling into the US market, working-hour overlap, a US legal entity, and an entirely onshore delivery team are different requirements. If procurement, security, or customer commitments restrict where work can be performed, state that before agencies prepare proposals.
Then write the commercial assignment in plain language: improve discoverability for a defined set of buyers, move those buyers toward a defined action, and show how organic work contributes to qualified opportunities. This gives agencies a problem to solve rather than a traffic target to decorate.
Look for an operating system, not a service menu
Most credible proposals contain familiar components: technical SEO, content, digital PR, reporting, and some form of AI search optimization. The labels tell you little. What matters is how the agency connects those disciplines and makes decisions when data, buyer needs, and internal constraints conflict.
Buyer-led search architecture
A B2B content plan should reflect the decisions buyers make, not just the keywords an SEO tool can export. Ask the agency to map search demand to recognizable buyer jobs:
Understanding a problem and its business consequences.
Learning the available approaches to solving it.
Defining requirements and evaluating fit.
Comparing categories, methods, or vendors.
Checking implementation, integration, security, and operational implications.
Finding evidence that reduces perceived risk.
Preparing a recommendation for colleagues, procurement, or leadership.
Each proposed page should have a clear buyer, decision, next action, and relationship to the rest of the site. If an agency cannot explain why a page belongs in the journey, publishing it will probably add inventory rather than influence.
Technical and entity foundations
A useful technical audit does more than list warnings. It establishes which pages search systems can discover, render, index, interpret, and connect. It should distinguish defects that suppress important pages from housekeeping that has little commercial effect.
Expect the agency to examine crawling and index controls, canonical signals, redirects, internal links, page templates, duplicate or competing pages, structured data, navigation, and the relationship between your organization, people, offerings, evidence, and editorial content. Ask how each recommended change affects an important page group. A severity label without an affected business area is not prioritization.
Structured data should describe what is genuinely present on the page and remain consistent with visible content. It can improve machine interpretation, but it does not guarantee rankings, inclusion in an AI answer, or a citation. Be wary of any proposal that treats JSON-LD as a substitute for clear information, credible evidence, or sound site architecture.
Subject-matter expertise turned into usable evidence
Your strongest B2B knowledge often lives in sales calls, implementation teams, product specialists, technical documentation, and customer questions. The agency needs a repeatable way to extract that knowledge without turning every draft into a burden for your experts.
Ask to see the workflow from interview or internal input through briefing, drafting, fact review, optimization, approval, publication, and refresh. The agency should define what it needs from an expert, what its writers can resolve independently, and how unsupported claims are flagged. A writing sample alone does not prove that this system exists.
Useful content makes definitions explicit, separates similar concepts, states assumptions, answers the next likely question, and supports claims with evidence a reader can inspect. Those qualities help a human evaluator and also make passages easier for search and answer systems to retrieve accurately.
Authority beyond your own website
An agency should be able to explain how it will build recognition outside your domain. Depending on your market, that may involve expert contributions, original data, useful tools, partner content, relevant industry publications, public documentation, or digital PR. The method should fit how your buyers establish credibility.
Ask where links, mentions, and citations are expected to come from, why those environments matter, and what editorial value earns placement. A large outreach count is not the same as relevant authority. You need a defensible acquisition method, quality controls, and a clear boundary around tactics the agency will not use.
Measurement across search, AI visibility, and pipeline
Traditional search performance and visibility in AI-generated answers overlap, but they are not identical. Your measurement plan should keep them distinct while connecting both to commercial outcomes.
For search, define how the agency will monitor priority query groups, important landing pages, branded and non-branded demand, conversions, assisted journeys, and changes in lead quality. For AI visibility, define the questions or buying scenarios that matter, which brands and pages appear, whether your company is represented accurately, and where observable citations or referrals point. Where a platform does not expose reliable data, the report should label the limitation instead of converting an estimate into a fact.
The agency should also show how website and search data will connect to CRM stages. Perfect attribution is rarely a reasonable promise, especially across long and multi-person journeys. A practical model records what can be observed, separates leading indicators from business outcomes, and makes uncertainty visible.
Make every agency prove its claims the same way
Polished pitches are difficult to compare because each agency controls the frame. Give shortlisted teams the same evidence request and evaluate the people who would actually work on your account.
Ask for a live walkthrough of your website. The team should identify a meaningful opportunity, show the evidence behind it, explain what remains uncertain, and name the information needed before acting.
Request redacted working artifacts, not just finished success stories. Useful examples include a technical backlog, buyer-journey map, content brief, editorial review, reporting view, or prioritization document.
Choose one proposed page or campaign and ask the agency to trace it from buyer problem to search demand, production workflow, distribution, conversion path, and measurement.
Ask the agency to map a sample report from query and landing-page behavior through your accepted conversion and CRM stages. Confirm which connections already exist and which require implementation.
Meet the strategist, technical lead, content lead, and account owner who will do the work. Clarify responsibilities, availability, approval authority, and any planned subcontracting.
Ask about a program that underperformed. A credible answer should distinguish the initial assumption, the evidence that challenged it, the decision that changed, and what the team would now do earlier.
Use direct questions that expose the agency’s decision process:
Which assumption about our market would you test first?
What would make you recommend against publishing a page that has measurable search demand?
Which deliverables depend on our subject-matter experts, developers, or sales team?
How will you separate awareness traffic from buying intent and branded demand?
How will you report AI visibility when a platform does not provide complete referral or citation data?
Which activities are explicitly outside your scope?
Who can change priorities, and what evidence justifies that change?
Several warning signs should lower your confidence immediately:
Guaranteed rankings, traffic, leads, or AI citations without control over the systems that produce them.
Success stories that omit the starting condition, work performed, commercial context, or agency responsibility.
A content commitment defined mainly by publishing volume.
A large audit with no method for converting findings into an owned, sequenced backlog.
Reporting that stops at rankings and sessions even though the stated goal is pipeline.
Plans to publish at scale before the team understands your evidence, approval rules, brand constraints, and buyer journey.
Proprietary language used to avoid showing deliverables, methods, or measurement definitions.
Compare proposals with a decision scorecard
A scorecard prevents presentation quality, brand familiarity, or executive chemistry from quietly becoming the selection method. Use the same decision areas for every agency, record the evidence you saw, and distinguish a demonstrated capability from a promise.
Decision area
What strong evidence looks like
What should lower confidence
Commercial alignment
The agency connects priorities to buyers, offers, conversion events, sales stages, and qualified pipeline.
The plan treats traffic or keyword movement as the final outcome.
Buyer understanding
The team maps problems, evaluation questions, objections, stakeholders, and proof needs to page roles.
The strategy is primarily a list of high-volume keywords.
Technical execution
Findings include affected page groups, business impact, dependencies, owners, and validation steps.
The audit produces warnings without a defensible order of work.
Content operations
The workflow shows how expert knowledge becomes reviewed, evidence-backed, maintained content.
The proposal emphasizes output volume without explaining fact review or refreshes.
Authority development
The agency names relevant environments, editorial value, quality controls, and acquisition methods.
The pitch relies on link quantities or vague relationship claims.
AI search readiness
The plan covers extractable answers, entity clarity, supporting evidence, independent mentions, and observable visibility.
The agency promises citations or treats schema markup as a shortcut to authority.
Measurement
The model separates leading indicators from outcomes and documents attribution limits.
The dashboard cannot connect important pages and conversions to CRM stages.
Delivery governance
Named practitioners, dependencies, approvals, priority rules, escalation paths, and scope boundaries are clear.
The sales team disappears after signing or delivery depends on unspecified resources.
Do not let the scorecard become false precision. Its purpose is to expose missing evidence and tradeoffs. Record a short reason beside each judgment, then discuss material disagreements among the people who will fund, support, and evaluate the engagement.
Once you select a preferred agency, translate the pitch into a statement of work. For every important workstream, specify the intended outcome, required artifact, acceptance condition, owner, client dependency, approval path, reporting method, and change-control process. Define who owns accounts, data, briefs, written work, code, creative assets, and reporting configurations.
Protect access as carefully as scope. Grant only the permissions required for the current work, use named accounts where possible, document publishing and rollback authority, and remove access when responsibilities change. Do not hand over unrestricted production or administrative access simply because implementation will be faster.
Contract language about confidentiality, data use, intellectual property, termination, liability, and subcontracting can create material exposure. Have the person responsible for your vendor contracts review those clauses before signing; an SEO evaluation is not a substitute for legal or procurement review.
Key takeaways
Define the buyer, commercial outcome, internal constraints, and meaning of US-based before requesting proposals.
Evaluate how an agency connects technical SEO, expert content, authority, AI visibility, and pipeline measurement.
Ask every shortlisted team for the same working artifacts, live diagnosis, delivery-team access, and attribution explanation.
Treat guaranteed rankings or AI citations, volume-led content plans, and traffic-only reporting as warning signs.
Put deliverables, dependencies, ownership, access controls, measurement definitions, and change rules into the agreement.
Your next step is to write the internal brief before opening another agency website. Give each candidate the same commercial problem, run the same evidence review, and score what the delivery team can demonstrate. The best choice is the agency whose methods still make sense after the pitch deck is closed.