Tag: Optimization

  • Google Business Profile Ranking Factors: What to Fix First

    Google Business Profile Ranking Factors: What to Fix First

    Your Google Business Profile can look finished and still be poorly aligned with the searches that matter. If it is not appearing where you expect, resist the urge to rewrite every field. Start with a narrower question: does the primary category accurately describe the service behind the query you want to rank for?

    Category relevance, category specificity, and basic Profile completeness give you a practical order of operations. They do not guarantee a top-three Maps position, but they can help you correct clear mismatches before you spend time on less certain changes.

    Key takeaways

    • Your primary category should be the most specific accurate match for the main service or business type you want Google to associate with the Profile.
    • Specific primary categories were associated with a 12.5% top-10 presence, compared with 9.2% for generic categories.
    • Relevant additional categories can clarify real secondary services, but broad filler categories do not provide the same advantage.
    • A claimed Profile with a website, description, hours, and photos has a stronger baseline than an incomplete Profile, although completeness alone is not enough to secure visibility.
    • The available numbers are correlations. Use them to prioritize your audit, not to predict an exact ranking gain.

    Start with the query, then choose the primary category

    A category is a classification of the business, not a place to list every service you might sell. The primary category has to do two jobs at once: represent what the business genuinely is and align with the customer need behind the target query.

    The distinction between generic and specific categories is substantial. Across 1.8 million Google Business Profiles spanning 4,209 categories, businesses using specific primary categories had a better average rank and appeared in the top 10 more often than businesses using generic categories.

    Primary category typeProfilesAverage rankTop-10 presence
    Generic55,09150.09.2%
    Specific1,664,73345.812.5%

    Lower average rank is better in this table. The relative increase from 9.2% to 12.5% is about 36%, but the more important lesson is not the percentage. It is the direction of the decision: when an accurate specialist category exists, defaulting to a broad umbrella category can weaken the match between your Profile and a specific search.

    The pattern becomes clearer at the query level. For searches related to hair salons, the exact primary category Hair salon appeared in the top 10 in 11.3% of observations. Adjacent categories performed less well: Hairdresser reached 6.0%, Beauty salon 3.2%, Barber shop 1.3%, and Nail salon 0.0%. Those labels may all sound relevant to a human, but they describe different entities to the ranking system.

    Competition also matters. A specific category usually puts the business into a smaller and more relevant competitive set. A plumber is competing as a plumber rather than as every possible type of contractor. That does not make a specific category an automatic shortcut; it makes the business-to-query relationship clearer.

    Use this decision process when reviewing your primary category:

    1. Write down the single local query that represents the most important customer need you can genuinely satisfy.
    2. Identify the business type that most directly answers that need. Focus on what the business is, not a phrase you merely want to rank for.
    3. Choose the narrowest available category that remains fully accurate for the core business.
    4. If two categories are accurate, reserve the primary position for the service or business type you most need the Profile to represent. Consider the other for an additional category.
    5. Reject any category that would create the wrong expectation when a customer calls, books, or arrives.

    Do not treat category performance tables as a leaderboard. A restaurant cannot become a tapas restaurant because that category has less competition, and a general contractor should not select plumber unless plumbing accurately describes the business. Ranking alignment is useful only when the category is truthful.

    Use additional categories to sharpen the Profile

    Illustration of a storefront with one large primary category card and three smaller supporting category cards.

    The primary category establishes the main identity. Additional categories can cover distinct services or specialisms that are genuinely part of the business. Their purpose is to extend the entity without blurring it.

    Profiles with carefully aligned additional categories were associated with better rankings than single-category Profiles. Across the broader dataset, the difference was commonly between 6 and 17 ranking positions. The examples below show how a specific secondary category compared with no additional category and with the broad Service establishment category.

    Primary categoryRelevant additional categoryAverage rank with relevant additionAverage rank with no additionAverage rank with Service establishment
    VeterinarianEmergency veterinarian service33.951.275.6
    ElectricianEV charging station contractor38.247.563.5
    PlumberDrainage service47.354.062.3
    RoofingGutter service47.152.170.3
    DentistCosmetic dentist47.657.653.7

    The specific additional category produced the best average rank in every combination shown. The generic category did not. That does not prove that adding a category caused the entire difference. Businesses that maintain thoughtful category selections may also be more diligent about reviews, Profile maintenance, and local SEO outside the Profile.

    Even with that limitation, the decision rule is useful: add a secondary category when it names a real and meaningful part of the business. Do not add categories merely because they are adjacent to your industry or broad enough to sound harmless.

    • Add a category when it represents an established service line, specialty, or operating identity that customers can actually choose.
    • Keep it secondary when it is accurate but less central than the business represented by the primary category.
    • Leave it out when it describes an aspiration, an occasional exception, or a service you cannot consistently deliver.
    • Question generic labels when a more precise category communicates the same part of the business.

    Read the complete category stack as one statement. A primary category of Plumber with Drainage service as an additional category describes a coherent business. A long collection of loosely related categories makes the entity harder to interpret and gives you no reliable basis for diagnosing which query each category is meant to support.

    Complete the five measured basics without overreading them

    A Profile cannot communicate much if its essential fields are absent. Five basic elements provide a useful completeness check: claimed status, a website, a business description, operating hours, and photos.

    This five-point checklist is an analytical index, not an official Google completeness score. One point was assigned for the presence of each element. It did not measure the accuracy, depth, freshness, or persuasive quality of the information.

    Completeness scoreAverage rankTop-10 presence
    0 of 5624%
    1 of 5585%
    2 of 5547%
    3 of 5509%
    4 of 54711%
    5 of 54313%

    Moving from zero to five completed elements was associated with an average-rank improvement of about 19 positions. Top-10 presence rose from 4% to 13%, more than tripling. The progression is consistent at every step, which makes basic completion an obvious part of a Profile audit.

    It also shows why completeness should not be mistaken for a complete ranking strategy. Even among Profiles scoring five out of five, only 13% appeared in the top 10. Completion removed obvious deficiencies; it did not erase competition or make every business relevant to every query.

    Check the five elements for both presence and usefulness:

    1. Claimed status: confirm the business controls the Profile rather than leaving it unclaimed.
    2. Website: make sure a working, appropriate business page is connected.
    3. Description: explain the actual business and its important services plainly. Presence earned the point in the index; repetition and keyword density were not measured.
    4. Hours: provide the operating hours customers need in order to make a visit or contact decision.
    5. Photos: include images that genuinely represent the business. The index recorded whether photos existed, not how many were uploaded.

    The distinction between presence and quality matters. The numbers do not establish that a longer description ranks better, that adding more photos produces a ranking increase, or that repeated edits create an advantage. They support completing the fields, not inventing an optimization formula inside each one.

    The index also did not include every field available in a Google Business Profile. Services, products, attributes, and other Profile data were outside its scope. You can maintain those fields for accuracy and customer usefulness, but this particular evidence cannot tell you what ranking weight they carry.

    Separate a ranking signal from a ranking promise

    Ranking-factor discussions become misleading when an association is converted into a guarantee. The category and completeness patterns are useful because they are large, consistent, and operational. They still come from observational data.

    The primary-category result has the clearest practical mechanism. An exact, specific category describes a closer match to a specific query and often competes within a narrower group. That gives you a strong reason to correct a generic or mismatched primary category. It does not tell you that changing the category will move your Profile a fixed number of positions.

    The evidence for additional categories requires more caution. A business owner who selects a precise set of additional categories is also more likely to maintain the rest of the Profile, seek reviews, and work on local visibility elsewhere. Some of the observed ranking difference may come from that broader effort.

    Completeness has the same limitation. Complete Profiles ranked better on average, but completion may also identify businesses that take local search more seriously. The five-point index measured whether fields existed, not whether Google treated each field as an independent ranking signal.

    Average rank is not a forecast for your business either. It combines businesses operating in categories with different levels of competition. Use the averages to decide which obvious problems deserve attention first. Judge your own result against the query, category, and competitive market you actually face.

    • Strongly supported action: replace a generic primary category with a more specific category when the specific category accurately represents the core business.
    • Reasonable action with a caveat: add relevant secondary categories for genuine specialties, knowing that broader optimization habits may account for part of the ranking difference.
    • Foundational action: claim the Profile and add its website, description, hours, and photos.
    • Unsupported leap: assume that one category change, a longer description, or a higher photo count guarantees a particular Maps position.

    Run your Google Business Profile audit in this order

    Isometric audit path with checkpoints for a search query, primary category, supporting categories, five profile details, and map visibility.

    A useful audit begins with search intent and ends with a clean record of what you changed. This order prevents basic category problems from being buried under cosmetic edits.

    1. Select one priority query. Choose a customer need that matters to the business and that the business is fully qualified to satisfy. Do not begin with a vague goal such as ranking for everything in the industry.
    2. Compare the query with the current primary category. If the category is generic while a truthful specialist category exists, evaluate the specialist category first.
    3. Map secondary lines of business. List the distinct services or specialties that deserve representation, then match only those to relevant additional categories.
    4. Remove ambiguity. Question broad filler categories, unsupported specialties, and combinations that make the Profile describe several different businesses at once.
    5. Complete the five-field baseline. Confirm claimed status, website, description, hours, and photos. Correct inaccurate information instead of merely filling empty fields.
    6. Keep a change log. Record the target query, old and new primary categories, additional-category changes, and missing fields you completed. If you need to understand what made a difference, avoid changing every available field in the same batch.
    7. Evaluate the result query by query. A stronger match for one service does not mean the Profile will improve for every adjacent search. Measure the outcome against the intent that drove the category decision.

    If the Profile still uses a broad category such as Contractor while the business is specifically an electrician, plumber, roofer, or HVAC contractor, begin with the primary category. Generic contractors had an average rank of 57.7 and an 8.0% top-10 presence, while the specific contractor categories in the same comparison produced better average ranks and top-10 rates ranging from 10.4% to 12.6%.

    If the primary category is already precise but the business has a meaningful specialty, review additional categories next. A plumber offering drainage work has a clearer reason to consider Drainage service than to add Service establishment.

    If the categories are coherent but one or more of the five basic elements is absent, complete the Profile before interpreting disappointing visibility as a subtler ranking problem. An unclaimed or nearly empty Profile introduces a preventable weakness.

    If the primary category is accurate, additional categories are relevant, and all five basics are present, stop endlessly rewriting fields that were measured only for their presence. Your remaining visibility problem may sit outside this narrow set of Profile variables and requires a broader local SEO diagnosis.

    Begin with one valuable query. Give the Profile the narrowest truthful primary category for that need, add only categories that represent real specialties, and complete the essential fields. The goal is not to make the Profile look busy. It is to make the business unmistakably clear.

    References


  • Why I Run Each Prompt Once Daily: The Data Behind It

    Why I Run Each Prompt Once Daily: The Data Behind It

    I often get asked why I “only” run each prompt one time per day.

    For me, the answer comes down to signal quality. Running a prompt once daily gives me enough consistent data to understand performance without overloading the process with unnecessary repetition.

    The statistics show that a single daily run is plenty. It gives me a reliable view of how prompts behave over time, while keeping the workflow focused, efficient, and easier to interpret.


    Inspired by this post on Try Profound Blog.


    crushpress.ai community screenshot
  • PPC Budget Mastery for 2026: Smart Adjustments and Data Optimization

    PPC Budget Mastery for 2026: Smart Adjustments and Data Optimization

    In 2026, PPC budgeting goes beyond simply setting spending levels. It’s about understanding when to adjust budgets, scaling campaigns effectively, and how data informs Google’s automation in these decisions.

    Over the years, Google’s automation has been driven by the signals supplied to it. In 2026, these signals are processed faster and more precisely, making clean signal architecture more crucial than ever.

    While the fundamentals of budget management remain constant, the speed at which a poorly structured account can drain your budget has increased significantly.

    Two Budget Mechanics You Must Grasp Now

    Before tweaking targets, audiences, or bid strategies, it’s essential to comprehend how these two budget controls operate.

    The Ad Scheduling Pacing Change

    Google now paces campaigns with ad scheduling towards the full 30.4x monthly billing cap, regardless of how many days your ads run. Previously, a $100 daily budget targeted around $2,200 across 22 weekdays. Now, it targets $3,040 in the same period, and the billing ceiling remains unchanged.

    If your campaigns utilize ad scheduling, you need to recalibrate your daily budget based on your total monthly spend rather than active days, setting it by dividing your monthly target by 30.4. For example, a $2,200 monthly target becomes a $72 per day budget if calculated this way. However, 24/7 campaigns remain unaffected.

    See exactly how your competitors win.

    Uncover the keywords, ads, landing pages, and strategies driving your competitors’ paid search success—and find your next opportunity to outperform them.

    Analyze your competitors

    Campaign Total Budgets

    Available for Demand Gen, Search, Standard Shopping, Performance Max, and YouTube campaigns, campaign total budgets let me set a fixed spending ceiling over a defined period instead of managing a daily limit. This window is from three to 90 days for some campaigns, while others can extend up to a year.

    While there is no daily spend cap, allowing flexibility, it’s crucial to monitor these closely, especially when running alongside ongoing campaigns. Additionally, the budget type cannot be altered post-campaign creation, making committed decisions at setup vital.

    What Actually Governs Google Ads Budget Spending

    Efficiency Targets Usually Constrain Spend Before Budgets

    In Smart Bidding strategies, efficiency targets often restrict spending before budget caps do. With a set tCPA of $50, if leads cost $80, the system reduces bids to avoid surpassing your target. It appears as if there’s a budget problem, but it’s actually a target problem.

    I must initially set targets closer to the market conversion rates and then fine-tune them to align with my true goals. When close, the 10%-20% margin aids in navigating those final conversion opportunities effectively.

    Performance Max Decides Where Your Budget Goes

    Performance Max automatically allocates budget across various channels like Search, Shopping, and YouTube, with Google determining the split, not me. Excluding my brand can prevent paying for redundant conversions from Search campaigns.

    Checking my negative keyword lists ensures clarity in branding and budget allocation. This helps avoid misallocation and focuses resources effectively.

    AI Max Expands Ad Appearances

    AI Max, available since April, expands query matching beyond my keyword list, generates ad copy from existing assets, and dynamically targets landing pages. Monitoring the initial spend distribution closely helps maintain alignment with intended strategies.

    Get the newsletter search marketers rely on.


    The Signal Problem Impacting Budget Allocation

    An insurance broker using Smart Bidding faced a disconnect: a 416% rise in conversion volume didn’t reflect in revenue due to form starts mistaken for completions. The system optimized for interactions, but the alignment with Cyrillic-language spam was costly without benefiting the pipeline.

    This reflects a broader issue in lead generation: equal weight is assigned to all form fills, leaving Smart Bidding unable to distinguish high-value leads from irrelevant submissions.

    Primary conversions must be meaningful actions that properly guide Smart Bidding. Secondary engagements belong in reports to avoid skewing bidding data.

    For accounts outside the current beta, extending conversion windows to 90 days and assessing performance over these periods can help counteract issues arising from longer sales cycles.

    Using First-Party Data for Budget Guidance

    Customer Match, with a 540-day max membership duration, remains crucial in guiding automation toward valuable traffic. For effective budget allocation, I focus on exclusion before expansion, targeting acquisition budgets toward new prospects.

    Retention strategies should be run separately to maintain consistency in conversion goals. It’s vital that exclusions, available from the start, streamline acquisition efforts effectively.

    Every click they win is a customer you lose.

    See where competitors are investing, which keywords drive their results, and how to capture more of the market.

    See who’s stealing your traffic

    Strategic Scaling in 2026

    For ongoing daily budget campaigns, weekly increases of 10-20% are still relevant. For scheduled campaigns, I focus on monthly targets divided by 30.4 instead of daily adjustments.

    Using Smart Bidding Exploration in open beta for Performance Max can increase unique conversions by exploring new queries. I evaluate results over 60-day windows to make informed decisions.

    Demand-led pacing, complementing daily management, tracks predicted high demand periods to optimize spend within budgetary limits. For B2B accounts, longer evaluation periods safeguard against undervaluing long cycle campaigns.


    Inspired by this post on Search Engine Land.


    crushpress.ai community screenshot
  • Boost Team Efficiency: Overcome GTM Barriers with Storyblok

    Boost Team Efficiency: Overcome GTM Barriers with Storyblok

    I’ve recently stumbled upon some fascinating global research data that highlights a tech gap silently draining team speed, revenues, and competitive edge. The Storyblok Global Speed-to-Market Benchmark Report explores these issues comprehensively.

    This rapidly evolving world demands a new pace, driven by cutting-edge AI and technology, and constant shifts in digital trends have redefined how we handle go-to-market (GTM) strategies.

    In today’s marketplace, everyone, from customers to organizations, expects top-notch deliveries with speed. Unfortunately, only 22.5% of teams consistently meet these soaring speed-to-market expectations, revealing a disconcerting gap between ambition and actualization.

    One might ask, what’s holding us back?

    The Global Speed-to-Market Benchmark survey involved several GTM teams who shared insights on where processes are stalling or facing delays and what steps would truly improve speed-to-market in today’s fast-paced business environment.

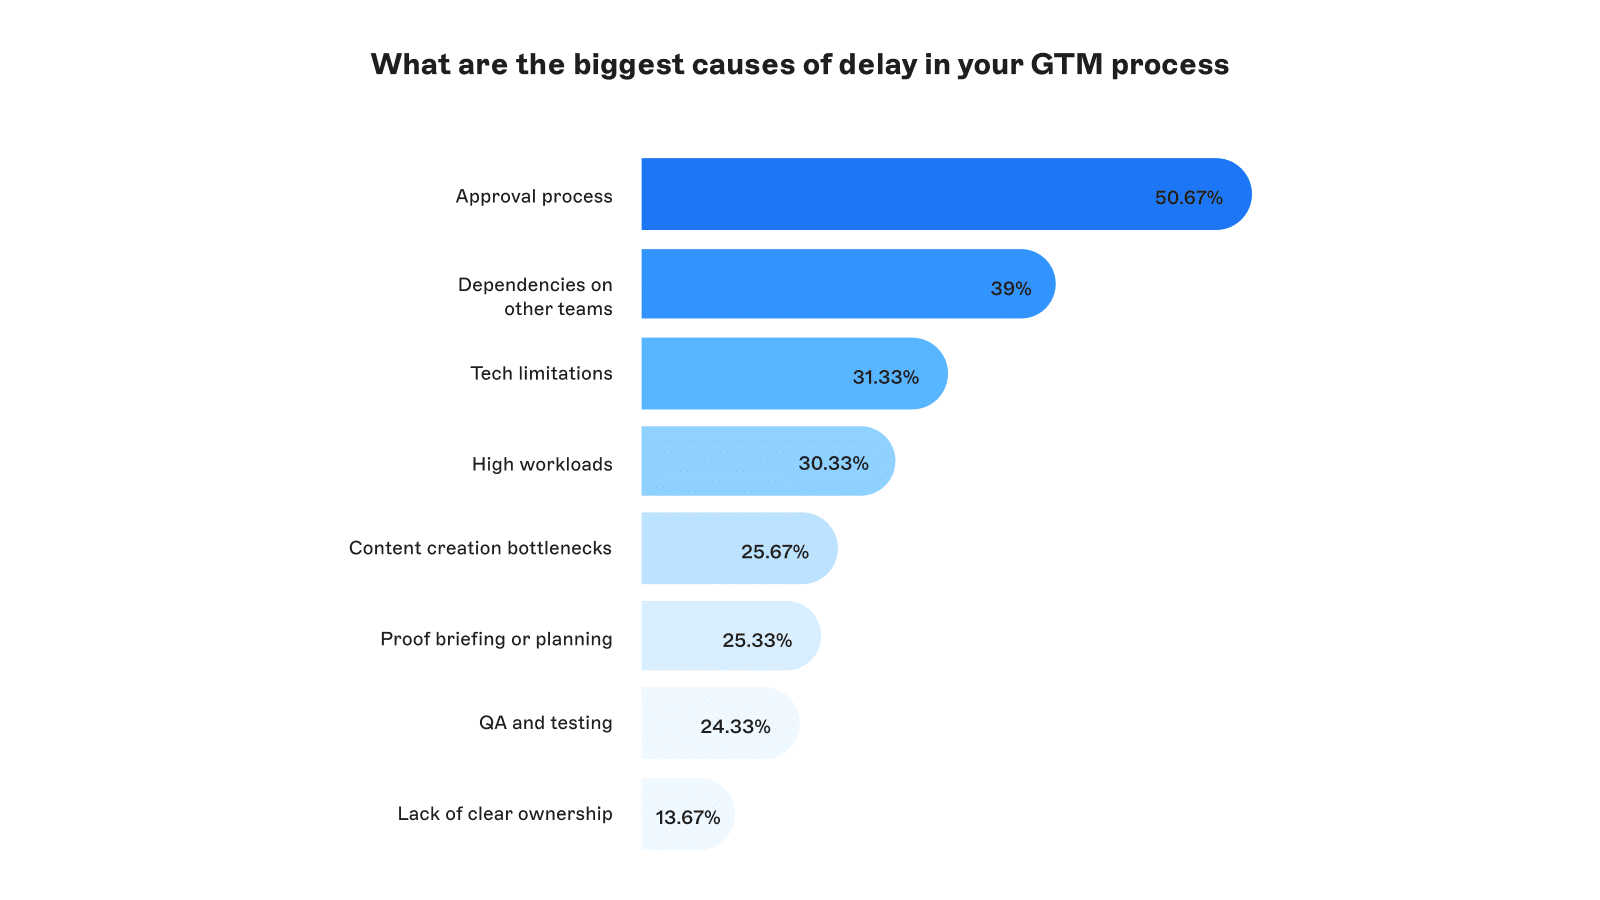
    The survey uncovered four significant bottlenecks largely tied back to technological hiccups or dependencies. The approval process, for instance, emerged as the most substantial bottleneck, with over 50% of teams identifying it as a major hurdle. This includes enduring multiple rounds of content revisions largely driven by disorganized feedback systems, exacerbating inefficiencies.

    The practical solution? A well-configured CMS, particularly a headless one, allows for an organized and efficient content review process by decoupling content from presentation. This ensures stakeholders have access to a central content repository, thereby minimizing review confusion and delays.

    Equally problematic is the overreliance on developers, where 38% of teams require developer input for most GTM operations. This not only slows marketers but also distracts developers from more critical tasks. A modern tech stack enabling team autonomy can mitigate this issue, allowing each team to concentrate on their core functions.

    ```json
{
  "alt": "Bar chart showing biggest causes of delay in GTM processes, with approval process at 50.67% as the top cause.",
  "caption": "Discover what's slowing down your GTM process. Approval processes top the list at over 50%, impacting efficiency and timelines.",
  "description": "This image features a horizontal bar chart highlighting the primary reasons for delays in go-to-market (GTM) processes. Leading the chart is the approval process, causing 50.67% of delays. Following are dependencies on other teams at 39%, tech limitations at 31.33%, and high workloads at 30.33%. Additional factors include content creation bottlenecks, proof briefing, QA and testing, and lack of clear ownership. This breakdown provides insight into operational challenges within marketing strategies. Keywords: GTM process, delay causes, approval process, marketing efficiency."
}
```

    Moreover, compounding tech limitations, including complex deployment and outdated systems, further warrant an overhaul. Tech bottlenecks often operate silently, but they demand attention and timely solutions for improved GTM cycles.

    I also noticed how post-launch firefighting issues are rampant, affecting 79% of teams. This inefficiency stems from fragmented systems, where constant developer intervention is necessary, further delaying launch processes.

    Addressing these challenges involves refining the tech stack, especially choosing a CMS that aligns with modern delivery needs. This results in smoother launches, improved efficiency, and fewer post-launch issues.

    The cost of slow GTM delivery is undeniable, leading to lost revenue and missed market opportunities, while also impacting team morale and increasing turnover risks. Interestingly, there’s a visible discrepancy between executive priorities and the requisite support for improved speed-to-market capabilities.

    Armed with data, teams can make a compelling business case for change, drawing attention to specific bottlenecks and their ramifications, thus bridging the leadership alignment gap.

    Overall, overcoming GTM challenges requires adopting adaptive technology stacks that align with today’s fast-paced demands. By doing so, we not only keep up with competition but also foster a resilient, engaged team poised for success.

    For the complete analysis and strategies, the full Storyblok Global Speed-to-Market Benchmark Report is an invaluable resource.


    Inspired by this post on Search Engine Land.


    crushpress.ai community screenshot
  • Unlock More with Microsoft’s Customizable Conversion Metrics

    Unlock More with Microsoft’s Customizable Conversion Metrics

    As someone exploring the ins and outs of Microsoft Advertising, I’ve discovered an update that’s sure to enhance our campaign analysis. Microsoft is now allowing us to customize columns with all conversion metrics, providing us with deeper insights and aligning reports with our unique business goals.

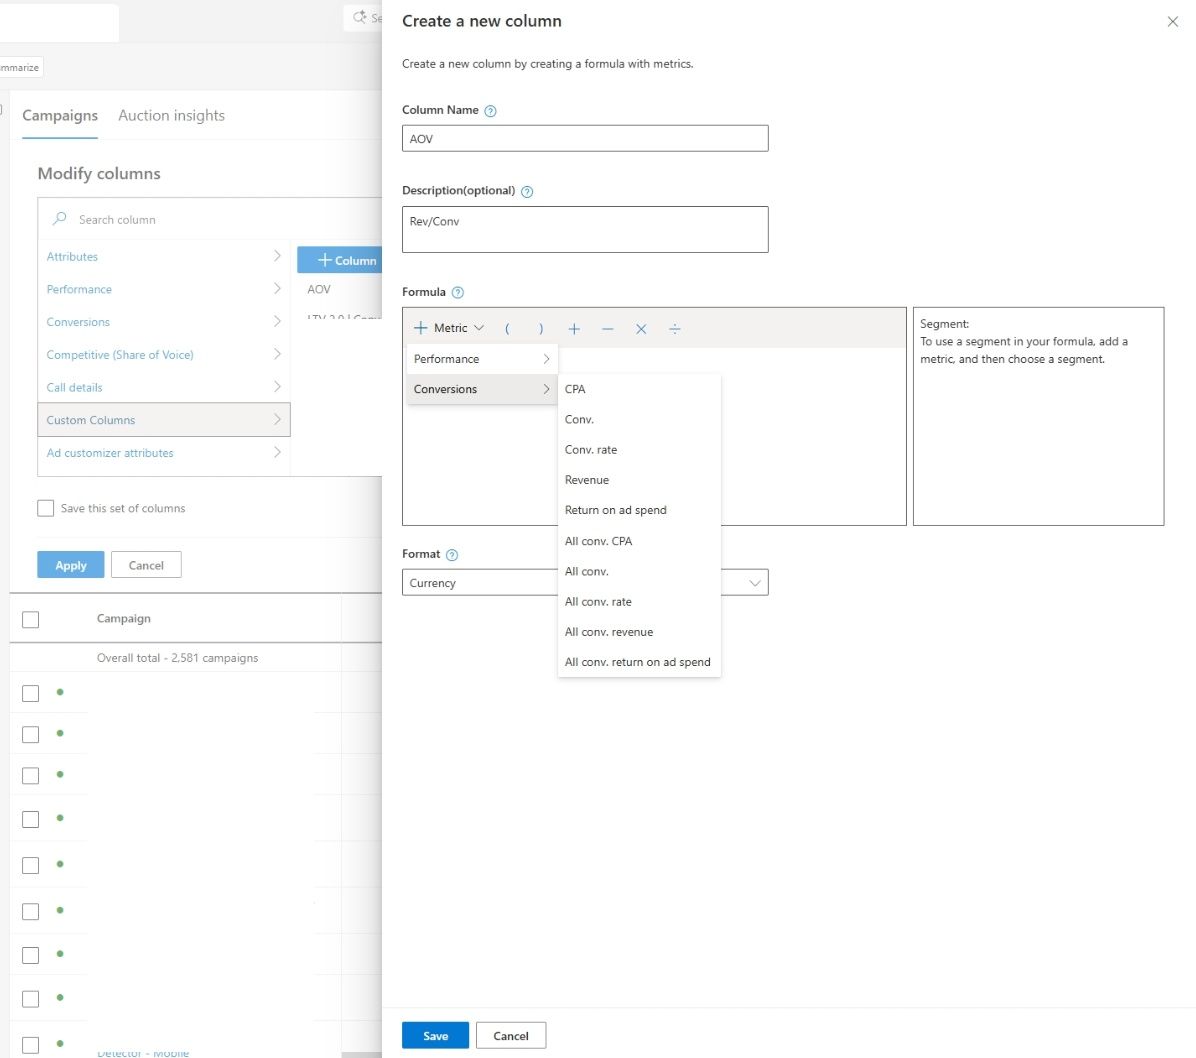
    What does this mean for us? Well, according to Navah Hopkins, our go-to expert at Microsoft, we can now build custom metrics by leveraging the full spectrum of conversion data available in the platform. This means we can track all conversions and primary conversions, enabling us to tailor our reporting to meet our specific objectives more closely.

    Please note the new image showcasing Microsoft’s enhanced custom columns feature. It’s a visual reminder of how these updates can transform our analytical capabilities.

    Why am I excited about this? Because the standard reporting often doesn’t mirror how we truly measure success. By giving us the tools to expand custom columns, Microsoft allows us to define metrics that truly matter—be they lead quality, revenue, or a combination of conversion actions.

    This flexibility is crucial for managing a variety of conversion types or navigating complex marketing funnels. Now, I can create custom columns, using ratios and metric combinations such as cost per qualified lead or conversion rates focused on primary goals.

    Moreover, I appreciate that the revenue and ROAS calculations will now reflect the values that align with my conversion goals, providing more accurate insights directly linked to business outcomes.

    ```json
{
  "alt": "Screenshot of a campaign management interface showing options for creating a new column with metrics and performance criteria.",
  "caption": "Exploring campaign metrics has never been easier with this detailed interface for customizing columns and viewing performance data.",
  "description": "This image displays a campaign management interface used for customizing and modifying columns. It includes options to name a new column, add an optional description, and formulate its metrics. The interface allows users to select metrics such as CPA, conversion rates, and revenue, as well as specify the format, in this case, currency. A list of campaigns is visible on the left, indicating a total of 2,581 campaigns, with options to apply saving or cancelling at the bottom."
}
```

    What does this change imply for us in a broader sense? It represents a shift toward a more flexible and advertiser-defined measurement approach, instead of relying solely on standardized platform metrics.

    This update highlights the ongoing demand for improved reporting customization as campaigns become increasingly automated and intricate.

    So, what should we keep an eye on? I’ll be observing how advertisers like us utilize these custom metrics to guide optimization decisions, whether consistency in reporting improves across teams, and if similar flexibilities will roll out in other areas of the platform.

    Bottom line? With Microsoft giving us more control over how we measure success, custom columns are evolving into a vital asset for campaign analysis. Read more about this update here.


    Inspired by this post on Search Engine Land.


    crushpress.ai community screenshot
  • Boost Your Website’s AI Visibility: Overcome Crawling Hurdles

    Boost Your Website’s AI Visibility: Overcome Crawling Hurdles

    Have you ever wondered why your site isn’t getting the attention it deserves from AI crawlers? I know how frustrating it can be to feel overlooked in the digital world. Often, Cloudflare might be the culprit blocking access.

    Let me guide you through diagnosing these issues, providing solutions, and optimizing your site for better LLM (Large Language Model) visibility. Together, we’ll ensure your site is primed for the AI-age and ready to capture its rightful place in search rankings.


    Inspired by this post on HiGoodie Blog.


    crushpress.ai community screenshot