Tag: Brand Recognition

  • Google Search Favicon Bug: Diagnose It Without Guessing

    Google Search Favicon Bug: Diagnose It Without Guessing

    Your branded search result suddenly shows a generic globe instead of the favicon people associate with your site. The natural reaction is to change the icon, edit the site template, or start looking for a technical SEO failure. During a confirmed Google-side incident, those changes can create a second problem without fixing the first.

    Your immediate job is to determine whether the failure is on your site or inside Google Search. A short, evidence-based check will help you preserve a clean baseline, avoid unnecessary production changes, and measure any click impact without jumping to conclusions.

    A default globe can be Google’s failure, not yours

    Google has confirmed that improperly displayed favicons were caused by an issue on its end. Affected results showed Google’s default globe icon when Search could not display the site’s proper favicon.

    It’s an issue on our end. We identified the issue and we’re addressing it as quickly as we can.

    Rajan Patel, Google VP, Engineering for Search

    The recovery was uneven. Some favicons returned while other sites, including LinkedIn, still showed the generic icon. That matters when you diagnose your own result: one remaining broken favicon does not necessarily mean your implementation is faulty, and one recovered result does not prove the incident has ended everywhere.

    A globe icon is a search-presentation symptom. By itself, it does not establish that your rankings, content, structured data, or crawling have failed. The immediate concern is visual recognition. A distinctive favicon can help your result stand apart, while a generic icon could make the listing less recognizable and potentially reduce clicks. No quantified click loss has been established for this incident.

    Run a scope check before changing the site

    An isometric diagnostic scene shows a healthy website and favicon path on one side and a separate search indexing cloud producing a generic globe on the other.

    Do not begin with a fix. Begin by recording exactly where the symptom appears. That distinction protects you from replacing a working favicon merely because Google is temporarily displaying it incorrectly.

    1. Capture the affected search result. Save the query, result URL, visible icon, observation time, and a screenshot. This gives you evidence to compare against later instead of relying on memory.
    2. Open the site normally and confirm that its favicon still appears where you expect it, such as in the browser tab. This does not prove Google can retrieve or display it, but it tells you whether the icon has obviously disappeared from the site itself.
    3. Sample more than one result from your domain. Check the homepage and representative internal pages when they appear in Search. Record whether the globe affects every observed result or only a subset.
    4. Look at unrelated domains in the same search environment. Generic icons appearing across several sites make a platform-side display problem more plausible. A symptom confined to your domain deserves closer site-side investigation.
    5. Review recent deployments before assigning a cause. Note any changes to the favicon file, document head, theme, site framework, domain configuration, or asset delivery. A coinciding deployment does not prove responsibility, but it prevents you from overlooking your own change while a wider incident is underway.

    The browser check and the search-result check answer different questions. A favicon that works in a browser shows that an icon is available to ordinary visitors. It does not guarantee that Google’s search interface has processed and displayed it correctly. Treat it as one piece of evidence, not a complete validation.

    Choose your next move from the pattern you see

    The safest response depends on the combination of symptoms, not on the globe icon alone.

    What you observeWhat it indicatesWhat to do next
    The favicon is missing on the site and in SearchA site-side problem remains possibleInvestigate the favicon asset and the site changes that control it before treating the issue as Google’s bug
    The favicon works on the site, while your result and unrelated results show globesThe pattern is consistent with the acknowledged Google-side incidentDocument the evidence, keep the working implementation stable, and monitor representative results
    Only some URLs from your domain show the globeSearch may be displaying or recovering favicons unevenlyTrack the same URL sample and avoid a sitewide change based on one result
    The correct favicon returns without a deploymentThe recovery is consistent with a platform-side resolutionPreserve the before-and-after evidence and continue checking until the result is stable
    Your domain remains affected while broader results recoverThe general incident no longer explains the whole patternReopen the site-side investigation and compare the persistent failure with your recorded baseline

    Do not change JSON-LD because of a favicon-only symptom. A generic search icon is not evidence that your schema markup is broken. The same restraint applies to page titles, descriptions, content, and unrelated technical settings. Changing several search-facing elements at once destroys the baseline you need to tell whether Google’s recovery or your intervention produced the result.

    Google’s statement also did not provide a firm completion time. Treat “as quickly as we can” as an acknowledgement of active work, not as a recovery deadline. Recheck at a consistent interval that suits your reporting cycle, but do not promise stakeholders a date Google has not supplied.

    If you need to brief a client or internal team, use language tied to facts you have verified: “Google has confirmed a Search-side favicon issue. Our favicon remains available on the site, and the current symptom matches the acknowledged incident. We are keeping the implementation stable while monitoring representative results and search performance. We will investigate site-side causes if the evidence begins to diverge from the broader recovery.” Remove any sentence you have not personally verified for that property.

    Measure click risk without inventing a causal story

    Two streams of anonymous visitors pass unlabeled search results with different favicon symbols while an observation lens and surrounding device and position shapes suggest multiple influences on clicks.

    The practical business risk is a possible reduction in recognition and clicks. “Possible” is important. The incident does not come with a universal click-through loss, and your aggregate traffic can move for many reasons while the favicon is broken.

    Annotate when your team first observed the globe and when the proper icon returned. Then compare like with like in your search performance data: the same queries, the same pages, and broadly similar visibility. Review impressions, position, click-through rate, and clicks together. A click decline accompanied by lower rankings or a different query mix cannot be assigned cleanly to the favicon.

    Separate branded queries from non-branded queries where your reporting allows it. The favicon’s role in recognition makes branded results a sensible place to look, but even there, correlation is not proof. Record the observation as a possible presentation effect unless your own controlled evidence supports a stronger conclusion.

    Most importantly, do not rewrite titles, descriptions, or page content in response to a favicon-only change. Those edits can alter click behavior independently and make the incident impossible to evaluate. Preserve the current snippet components while Google resolves the display problem.

    Key takeaways for site owners and SEO teams

    • Google acknowledged that the broken-favicon incident originated on its side.
    • A default globe in Search does not, by itself, prove that your favicon file, rankings, schema, content, or crawling are broken.
    • Confirm that the favicon still works on the site, sample multiple search results, review unrelated domains, and record recent deployments before deciding what failed.
    • Keep a working implementation stable while the observed pattern matches the wider incident. Unnecessary changes remove your diagnostic baseline.
    • Track possible click effects with comparable query and page data. Do not claim a favicon-driven loss when rankings, impressions, or query mix also changed.
    • Google did not provide a firm recovery deadline, so communicate the confirmed status and your next monitoring step without promising a date.

    Capture your baseline now and monitor the same representative results. If the proper icon returns without a deployment, close the incident only after the recovery remains stable. If the favicon also fails on your site, or your domain stays broken as the broader issue clears, you then have a sound reason to investigate the implementation rather than guess.

    References


  • Google’s Mobile Search Ad Test: A Practical Response Plan

    Google’s Mobile Search Ad Test: A Practical Response Plan

    If you manage paid search, Google’s mobile ad presentation test creates an awkward question: should you change campaigns now, or wait until the format becomes more than an isolated experiment? The right answer is to prepare the brand elements the layout exposes, preserve your measurement baseline, and avoid auction-level changes that the available evidence cannot justify.

    The test changes what a mobile searcher may notice first. That could matter for recognition and trust, but it does not yet establish a new campaign rule. Your immediate job is to separate the visible interface change from the performance effects you can actually demonstrate.

    The test adds an identity layer before the ad copy

    In the observed mobile layout, Google places a list of advertisers, including their favicons and domain names, at the top of a sponsored-results block. The individual ads appear below that list. A searcher therefore encounters the participating companies before reaching the first complete ad.

    That is more than a cosmetic rearrangement. The standard ad-reading sequence starts with a specific advertiser’s message. This test inserts a preliminary identity check: which companies are present, which ones look familiar, and which domains appear credible enough to consider.

    Three practical implications follow, although none has been proven as a performance outcome:

    • Recognition may arrive before relevance. A familiar favicon or domain could attract attention before the searcher compares headlines and descriptions.
    • Unfamiliar advertisers may face a sharper trust test. If your domain does not clearly map to your brand, the user may have little reason to remember you when the full ad appears.
    • Ad copy remains important, but it may no longer make the first impression. The advertiser list can frame the choice set before any individual value proposition is read.

    Do not turn those possibilities into conclusions. The test does not show that recognized brands will necessarily gain clicks, that unfamiliar brands will lose them, or that inclusion in the list conveys an endorsement. It only gives you a credible set of hypotheses to examine.

    Treat this as a presentation test, not a new campaign rule

    Google has not publicly explained the experiment, and it remains unclear whether the layout will move beyond limited testing. That uncertainty should govern your response. A screenshot is evidence that a format exists; it is not evidence that your account is consistently exposed to it or that the format changed your results.

    Use this response sequence if someone on your team encounters the layout:

    1. Capture the entire mobile results block. A cropped advertiser row is not enough to understand its position relative to the Sponsored results label, individual ads, and nearby organic results.
    2. Record the observation context. Save the query, date and time, market, device type, browser, and whether the search was performed while signed in. These details will not reveal Google’s test assignment, but they make repeated observations comparable.
    3. Check whether the layout appears again under controlled conditions. Look for a pattern across relevant queries and devices. Do not treat one person’s result as universal.
    4. Annotate the observation in your reporting. Keep it separate from campaign launches, budget changes, promotional periods, landing-page releases, and other events that could affect performance.
    5. Delay structural campaign changes. Bids, budgets, match types, targeting, and creative rotation all introduce new variables. Changing them in response to an unconfirmed interface test makes later diagnosis harder.

    The distinction is simple: prepare for the format where preparation is low-risk, but require performance evidence before altering how you buy traffic.

    Audit the two brand assets users may see first

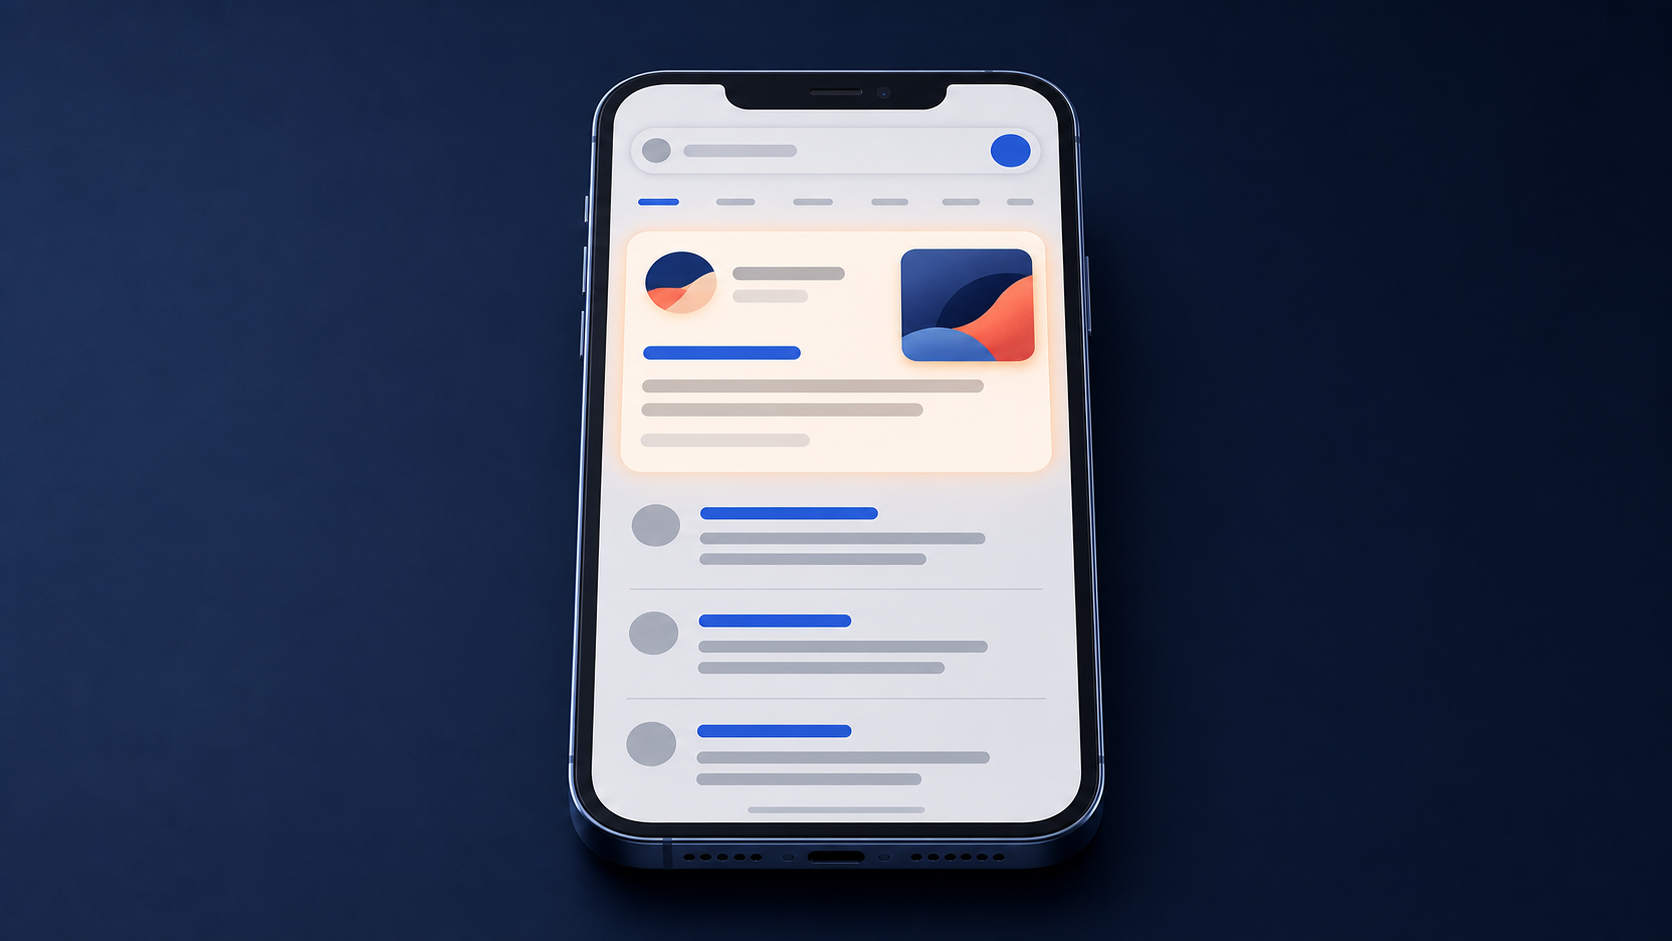
    A specialist compares a circular identity mark and a rectangular brand image in small mobile interface previews.

    The observed advertiser list emphasizes two compact identity cues: the favicon and the domain. You can review both without rebuilding a campaign or assuming the experiment will become permanent.

    • Inspect the favicon at a genuinely small size. A detailed logo can become an indistinct shape when reduced. Look for strong contrast, a recognizable silhouette, and freedom from tiny text that disappears on a phone.
    • Check the domain as a brand signal. Read the domain without the surrounding ad. It should be easy to associate with the company a user expects to find. Document confusing abbreviations, legacy names, unexpected subdomains, or other mismatches before deciding whether any change is warranted.
    • Compare identity across the journey. The favicon, domain, ad language, and landing-page branding should feel like parts of the same company. A mismatch can be especially costly when a compact advertiser list prompts users to evaluate identity before the offer.
    • Review ad differentiation after the identity check. Once the user reaches the full ads, your message still needs to explain why your option fits the query. Brand recognition cannot substitute for a relevant proposition.
    • Make landing-page verification immediate. An unfamiliar advertiser should not force visitors to hunt for the company name, product relationship, or reason to trust that they reached the intended destination.

    Keep this audit within its proper scope. Nothing disclosed about the experiment establishes that JSON-LD, organic structured data, or an SEO schema change controls the advertiser list. Do not modify markup merely because the interface displays a favicon and domain. That would connect two systems without supporting evidence.

    Measure the effect without confusing visibility with causality

    Two identical smartphones display generic ad layouts with and without an identity layer, separated for controlled comparison.

    The central measurement problem is exposure. Unless Google identifies test participation in reporting, you may know that the layout was observed without knowing which impressions used it. Any account-level analysis is therefore directional, not a clean experiment.

    Build the analysis around the part of the journey the layout can plausibly influence:

    1. Preserve a baseline. Retain mobile performance from a comparable period before the first confirmed observation. Use a window long enough to reflect your normal buying cycle rather than selecting dates because they produce a convenient result.
    2. Separate mobile from desktop. The observed format is a mobile Search test. A blended device report can hide a mobile movement or incorrectly attribute an account-wide change to the layout.
    3. Split branded and non-branded intent. Brand recognition is one of the clearest hypotheses created by the advertiser-first presentation. If branded and non-branded queries move differently, that difference deserves investigation.
    4. Start with click-through rate, then follow the click. Presentation acts before the visit, so CTR is the nearest directional signal. Conversion rate, cost per acquisition, return on ad spend, and lead quality tell you whether any additional clicks were commercially useful.
    5. Use stable comparisons where possible. Compare query groups, markets, or campaigns with similar conditions rather than placing all traffic in one before-and-after total. A comparison is useful only if it was not changed by a different promotion, bid strategy adjustment, budget constraint, or creative release.
    6. Keep a confounder log. Record every material account and site change during the observation period. Without that log, a mobile CTR shift can easily be credited to the interface when a new ad, offer, competitor, or landing page changed at the same time.

    Interpret patterns conservatively. A mobile CTR increase while desktop remains stable would be consistent with a mobile presentation effect, but it would not prove one. A larger branded than non-branded shift would fit the recognition hypothesis, but other brand activity could produce the same pattern. If clicks rise while conversion quality weakens, the format may be attracting attention without improving intent. If nothing meaningful changes, the correct action may be no action at all.

    Only consider campaign changes after you can state the decision rule in advance. For example: if a repeatable mobile-only movement persists while comparable traffic remains stable, review creative or budget allocation in the affected segment. Defining the rule first prevents ordinary volatility from becoming a story after the fact.

    Key takeaways for paid search teams

    • Google’s test places advertiser favicons and domains before the individual mobile Search ads, potentially changing the first cue a user evaluates.
    • The format remains a limited experiment with no confirmed broad rollout, so one sighting should not trigger changes to bids, budgets, targeting, or campaign structure.
    • Audit favicon legibility, domain recognition, ad-to-landing-page consistency, and message differentiation now because those checks are useful even if the test ends.
    • Measure mobile separately, preserve branded and non-branded segments, and treat CTR as an early signal rather than the final business result.
    • Do not assume structured data or schema markup controls the paid advertiser list; no such connection has been established.
    • Without impression-level test identification, performance analysis can support a hypothesis but cannot cleanly prove causation.

    Your next move should be small and reversible: document any sightings, complete the favicon-and-domain audit, and protect a clean performance baseline. If the presentation expands, you will be ready to measure it. If it disappears, you will not have disrupted a working account in pursuit of a temporary interface.

    References


  • How to Build AI Search Visibility Through Brand Recognition

    How to Build AI Search Visibility Through Brand Recognition

    Your pages rank, your traffic reports look respectable, yet your brand disappears when a prospect asks an AI assistant for options. That gap is not just a reporting curiosity. Your content may be discoverable while your brand remains absent from the answer that shapes the decision.

    Fixing that gap starts by changing what you measure. You need to know whether AI systems recognize your brand in the right unbranded conversations, describe it accurately, and do so often enough that one lucky mention cannot fool you.

    Recognition is the outcome; rankings are one input

    Traditional rank tracking asks whether a page earned a particular position for a query. AI visibility adds a harder question: when a system assembles an answer, does it connect your brand with the category, problem, product attribute, or recommendation context that matters?

    That distinction matters because brand recognition increasingly matters alongside conventional rankings. A strong organic position can help people and machines discover your information, but it does not guarantee that an AI response will name your brand, frame it correctly, or use it as a preferred example.

    Recognition is more specific than general awareness. For AI search measurement, treat it as the repeated and accurate association of your brand with a relevant topic or decision. A mention is useful only when the surrounding answer helps the user understand why your brand belongs there.

    • Topical fit: The brand appears for a problem or category it genuinely serves.
    • Accurate framing: The response describes what the brand does without confusing its audience, offer, or positioning.
    • Decision relevance: The mention appears where a user is discovering, evaluating, or selecting an option, not in an unrelated aside.
    • Credible support: The response connects the claim to a useful citation or supporting context when the interface provides one.
    • Repeatability: The result survives repeated runs instead of appearing in one favorable screenshot.

    This is why a mention count by itself is weak. A brand can be named frequently but described as the wrong type of company. It can appear in a long list without any explanation. It can also be cited as an information source while a competitor receives the actual recommendation. Record those outcomes separately.

    Rankings still matter, but their role changes. They are part of the evidence and discovery layer, not the final visibility score. The practical endpoint is whether your brand becomes a clear, trusted part of the answer, especially when users can receive an answer without visiting a result page.

    Build a prompt panel that represents real decisions

    A research team arranges illustrated scenario cards around a compass on a large table.

    You cannot measure AI visibility with whichever prompt happens to come to mind during a meeting. A useful baseline needs a fixed prompt panel: a time-stamped collection of exact questions that represent the situations in which you want to be recognized.

    Start with unbranded prompts. If the prompt already contains your name, the resulting mention says little about discovery. Keep branded prompts in a separate diagnostic set for checking factual accuracy, positioning, and direct brand understanding.

    Organize the unbranded panel into three intent buckets:

    • Category discovery: Questions asking which tools, companies, services, or approaches exist for a defined need.
    • Requirement-led research: Questions built around a feature, constraint, audience, use case, or product specification.
    • Evaluation and selection: Questions asking for suitable options, trade-offs, or criteria before a decision.

    A practical coverage panel can contain 25 exact prompts in each bucket, producing 75 queries. That is a testing design, not a universal minimum. If 75 prompts are too costly to repeat, preserve the three-bucket balance and select a smaller experimental cohort from the full panel. For a focused change, a cohort of 5-10 target prompts run daily across seven consecutive days gives you a more defensible baseline than a single session.

    Do not rewrite prompts between the baseline and measurement periods. A change from a broad category question to a product-specific question is not a harmless variation; it changes what the system is being asked to retrieve and compare. Save alternate phrasings as separate prompt records.

    For every run, record the exact prompt, model, displayed model version when available, date, environment, login state, location or locale, and response. Use a consistent testing environment. A logged-out browser with a cleared cache is one option; an API or synthetic testing platform can provide tighter control where available. The aim is not to create a perfectly sterile laboratory. It is to keep avoidable differences from becoming explanations for the result.

    Then label each response using the same fields:

    SignalWhat to recordWhat it tells you
    InclusionWhether the brand appears in the responseHow often the model associates the brand with the prompt context
    Position in responseWhere the first substantive mention appearsWhether the brand is central to the answer or peripheral
    FramingRecommended, neutral, compared, cautioned against, or merely citedWhether visibility is helping the intended positioning
    AccuracyCorrect or incorrect category, audience, capabilities, and limitationsWhether the model recognizes the right entity and facts
    CitationThe linked or named supporting page, when citations are exposedWhich evidence appears to support the mention

    Calculate inclusion rate as the number of eligible runs that mention the brand divided by the total number of eligible runs. Keep the raw labels as well as the percentage. A single combined score can conceal an important failure, such as higher inclusion paired with inaccurate framing.

    Break results out by model and prompt bucket. An average across every system and intent can make a brand look moderately visible when it is actually strong in category discovery, absent during evaluation, and misrepresented by one model. That is not one problem; it is three different problems requiring different changes.

    Strengthen the signals that make your brand understandable

    Linked pages, profiles, books, seals, and network nodes converge to form one clear blue geometric object.

    AI recognition is not created by repeating a brand name more often. It grows when the web contains clear, consistent evidence about what the brand is, which topics it belongs to, what it offers, and why it is relevant in a particular context.

    Make the visible content answer a precise question

    Generic claims leave little for a system to connect with a detailed prompt. Replace vague category language with facts that resolve a real requirement: the product type, intended user, model, offer, relevant specifications, supported use case, and meaningful constraints. The goal is not maximal detail on every page. It is enough detail for the page to answer the prompt it is meant to support.

    For example, if your prompt panel contains requirement-led questions and the relevant page never states those requirements explicitly, that is the first gap to fix. Add one self-contained paragraph that connects the brand, product, and requirement in plain language. Do not simultaneously rewrite the introduction, change the page template, and add schema if you want to know whether that paragraph mattered.

    Keep core entity facts consistent across your own pages. The canonical brand name, category, audience, product naming, and relationship between the company and its offers should not shift according to which team wrote the copy. Consistency reduces ambiguity; mechanical repetition does not.

    Use structured data to clarify, not to invent

    Structured data can make relationships such as brand, model, and offer explicit in a machine-readable layer. Its effect on AI answers should still be tested rather than assumed. Schema is not a guarantee of selection, and it cannot create authority or factual support that the visible page lacks.

    Markup should describe information that users can already verify on the page. If a page has a visible question-and-answer section, adding the corresponding FAQ markup creates a clean experiment: the visible answers stay fixed while the explicit structured-data signal changes. Likewise, brand, model, or offer properties can be added without rewriting the HTML copy when you want to isolate the machine-readable layer.

    Do not add unsupported claims to JSON-LD because you want an AI system to repeat them. At best, the test becomes uninterpretable because the markup and page disagree. At worst, you make inaccurate information easier to reproduce. Treat structured data as a precise description of the page, not a hidden promotional channel.

    Build recognition beyond your own domain

    Your website can define the entity, but self-description is only one part of recognition. Brands become easier to identify when they appear consistently in meaningful external contexts and are cited for topics they genuinely cover. That makes public relations, content distribution, industry participation, and reputation work part of AI search strategy rather than separate activities.

    Audit external mentions for context, not just volume. A mention is more useful when it associates the right brand with the right category and a concrete area of expertise. Repeated mentions that use obsolete product names, vague descriptors, or the wrong category can reinforce confusion instead of authority.

    For each important prompt cluster, create an evidence map with four lines:

    <!– wp:list {
  • Contextual SEO: A Practical Branded Search Measurement Guide

    Contextual SEO: A Practical Branded Search Measurement Guide

    Your organic clicks increased. Before you call that an SEO win, find out who was searching. If the increase came almost entirely from queries containing your brand, organic search may be capturing demand created by advertising, public relations, product activity, or existing customer awareness. If non-branded queries grew instead, you may be reaching people who were searching for a problem or category rather than for you.

    Contextual SEO keeps those situations separate. The goal is not to find one universal definition of good performance. It is to identify what changed, for which queries and pages, under which conditions, and what you should do next.

    Key takeaways

    • Branded and non-branded search measure different relationships with demand. Do not judge them against the same CTR, position, or growth expectations.
    • Google Search Console’s branded-query filter gives you a native starting point, but its AI-generated classifications still need a human quality check.
    • A branded query is a query classification, not proof that the searcher is a returning customer or that SEO created the demand.
    • Report raw clicks and impressions alongside branded-share calculations. A changing percentage can hide which side of the ratio actually moved.
    • Segment by search type, page role, intent, market, and relevant business events before assigning a cause.
    • Use branded search to measure demand capture and non-branded search to measure discovery, then connect both to conversion data outside Search Console.

    Context decides what an SEO number means

    A click has no strategic meaning by itself. A branded click to a login page, a non-branded click to a comparison page, and an image-search click to a product page all appear in organic performance data, but they represent different needs and different opportunities.

    This is why a responsible SEO answer so often begins with "it depends". Dependence is not an excuse to avoid a recommendation. It tells you which conditions must be defined before the recommendation becomes useful.

    For branded search measurement, define these layers before interpreting a trend:

    1. Business question: Are you evaluating brand demand, organic demand capture, category discovery, reputation, support demand, or revenue?
    2. Query relationship: Does the query explicitly identify your company, a variation or misspelling of its name, or a distinctive product or service?
    3. Search intent: Is the person navigating to a known destination, researching an offering, comparing alternatives, looking for help, or trying to complete a transaction?
    4. Landing-page role: Is the result a homepage, product page, location page, editorial resource, support page, account page, or another type of destination?
    5. Measurement scope: Which Search Console property, search type, country, device group, and comparison period are you using?
    6. External context: Did a campaign, launch, news event, pricing change, public-relations effort, seasonal shift, site migration, or technical release overlap with the movement?

    Without those boundaries, a sitewide average can combine unrelated behavior. Branded queries commonly carry stronger navigational intent than broad category queries, so comparing their CTRs directly does not reveal which segment is better optimized. Each segment should be compared with its own history and with similar query-page cohorts.

    Average position needs the same care. It is an average across the queries included in the view. A change can reflect different queries entering the mix, not just an existing set of pages moving up or down. Use it to locate a question, then inspect the contributing queries and pages before making a decision.

    Build a branded and non-branded baseline in Search Console

    A laptop with an abstract query interface sits beside two trays that separate search tokens into familiar-demand and discovery groups.

    Google Search Console provides a native branded-queries filter in the Search results Performance report. It separates queries into branded and non-branded groups and applies the selected group to impressions, clicks, CTR, and average position. The filter works with Web, Image, Video, and News search types.

    Use it to create a reproducible baseline rather than taking a single screenshot:

    1. Choose one Search Console property. Record whether it is a domain property or a narrower URL-prefix property so the reporting scope is clear.
    2. Select one search type. Do not combine Web, Image, Video, and News into one interpretation because each surface can respond to different content and user behavior.
    3. Set a comparison period that covers the business event you are evaluating. Use the same dates, property, and filters for the total, branded, and non-branded views.
    4. Export clicks, impressions, CTR, and average position for the total view. Repeat the export with Branded selected and then with Non-branded selected.
    5. Break each segment down by the dimensions that matter to the question. Page groups, intent groups, country, and device are usually more useful than one sitewide total.
    6. Save the filter scope, export date, classification notes, and known business events with the report. That record prevents a later analyst from comparing two differently defined datasets.

    The four Search Console metrics answer different questions. Impressions indicate how often the included results were shown. Clicks show how much traffic those appearances produced. CTR describes clicks relative to impressions. Average position provides a directional view of visibility across the selected query set. None of them establishes why demand existed or whether the visit produced a business result.

    Google uses an AI-driven system to classify branded queries. It can recognize brand variations, misspellings, multiple languages, and distinctive products or services associated with a brand. Contextual classification also creates the possibility of mistakes, especially where a term is ambiguous.

    Audit the classification before presenting it as a clean split. Review the highest-impression and highest-click queries in both groups. Mark apparent false positives, false negatives, and terms whose meaning is genuinely ambiguous. You cannot rewrite Google’s classifier, but you can maintain an external exception list and disclose material ambiguity in your report. If questionable terms meaningfully affect the conclusion, create a separate ambiguous group in your exported analysis rather than forcing certainty.

    The option is limited to eligible sites, and query or impression volume can affect eligibility. If the filter is unavailable, use a documented query list or regular-expression rule as a temporary substitute. Include the company name, known variations, misspellings, and distinctive product or service names. Version the rule whenever you change it so historical comparisons do not silently change definition.

    The branded filter changes reporting, not rankings. Turning it on does not alter how a query or page performs in search.

    Read brand demand, demand capture, and discovery separately

    A branded query is a query-level signal. It does not identify the searcher as a loyal customer, prove that the person has visited before, or show which channel created the awareness. Someone can encounter a company elsewhere and then search its name for the first time. An existing customer can also use a generic query. Treat branded versus non-branded as a useful proxy for the wording and likely relationship of the query, not as an audience identity system.

    With that limitation understood, the split gives you three useful views:

    • Observed brand demand: branded impressions show the search activity Google classified as explicitly connected to your brand. Call it observed demand because Search Console is not a complete brand-awareness survey.
    • Organic demand capture: branded clicks and branded CTR show how effectively your organic results captured those branded search opportunities.
    • Organic discovery: non-branded impressions and clicks show where you appeared and earned traffic without the query being classified as brand-led.

    You can also calculate branded click share by dividing branded clicks by the combined branded and non-branded clicks in the same filtered scope. Use that percentage as a dependency indicator: it tells you how much reported organic traffic came through branded queries. It is not market share, brand awareness, or an SEO score.

    Always place the share next to its raw numerator and denominator. Branded click share can fall because branded clicks declined, because non-branded clicks grew, or because both changed at different rates. Those scenarios lead to very different decisions.

    Observed movementPlausible readingWhat to inspect next
    Branded impressions rise while branded CTR is stableMore searches are being classified as brand-related, while organic capture remains proportionally similar.Check which branded terms grew and compare the timing with campaigns, launches, publicity, seasonality, and other demand-generating activity.
    Branded impressions are stable while branded clicks or CTR fallExisting brand demand may be captured less effectively, although a changed query mix or search-results environment could also be involved.Inspect the affected queries, ranking URLs, average position, result titles, page availability, indexation, and any migration or template changes.
    Non-branded impressions rise while clicks lagThe site may be appearing for more queries without yet earning proportionate traffic. Weaker positions, poor intent alignment, or an expanded query mix are possible explanations.Group the new visibility by query intent and landing page. Examine query-page fit, average position, and how accurately the result communicates the page’s value.
    Non-branded clicks rise while branded activity is flatOrganic discovery improved, but the data does not yet show an accompanying increase in observed brand-query demand.Identify the pages and topics driving discovery, then use analytics or customer data to evaluate engagement, conversion, and later brand interaction.
    Branded activity rises while non-branded activity fallsStronger observed brand demand may be masking weaker category discovery in the sitewide total.Report the two movements separately. Diagnose non-branded losses by page group, intent, market, device, and search type before celebrating aggregate growth.
    Both branded and non-branded clicks riseDemand capture and discovery may both be improving, but common causes such as seasonality or broader market demand remain possible.Find the query and page cohorts responsible for each increase, then compare them with known marketing activity and conversion outcomes.

    These are diagnostic hypotheses, not automatic verdicts. Search Console shows patterns of visibility and traffic. It cannot by itself tell you that public relations caused branded demand, that a content change caused non-branded growth, or that an SEO campaign created awareness. The next check is part of the analysis, not an optional footnote.

    Turn the split into a decision-ready SEO report

    A strategist organizes three color-coded streams of search signals into separate stacks of blank reporting cards.

    A useful report does more than label two lines on a chart. It connects a tightly defined observation to a decision. For every material change, write the analysis in this order:

    1. Question: State what the analysis is meant to decide. For example, are you assessing non-branded discovery, branded-result capture, or the effect of a product launch?
    2. Boundary: Record the property, dates, search type, market, device scope, query class, and page group.
    3. Observation: Describe which raw metric moved and where. Avoid causal language at this stage.
    4. Context: List overlapping SEO releases, technical incidents, campaigns, launches, publicity, pricing changes, seasonal conditions, and other events that could matter.
    5. Interpretation: Offer the narrowest explanation supported by the segmented data. Preserve alternatives when more than one explanation fits.
    6. Validation: Name the query, page, technical, analytics, campaign, or customer evidence that would support or weaken the interpretation.
    7. Decision: Assign the next action, its owner, and the signal that will determine whether the action worked.

    Suppose non-branded clicks increase on comparison pages while branded clicks remain flat. The defensible conclusion is that organic discovery improved within that page cohort. It is not yet evidence that brand awareness increased. Your next step is to inspect the gaining queries, confirm that the pages serve the intended comparison need, and evaluate downstream engagement or conversion in your analytics and customer systems.

    The action should follow the diagnosed segment:

    • If branded impressions are healthy but capture weakens, verify that the correct official pages are indexed, available, and ranking for the relevant brand needs. Check whether titles and page purpose make the destination obvious.
    • If non-branded impressions grow without clicks, prioritize query-page alignment. Separate newly visible queries by intent before rewriting titles or content across the entire site.
    • If non-branded visibility declines in one page group, inspect that cohort for ranking, indexation, internal-linking, content-fit, and competitive changes. Do not redesign unrelated sections based on an aggregate loss.
    • If branded search rises after non-SEO activity, give the demand-generating channel appropriate context and evaluate SEO’s role as demand capture. Do not assign creation of the demand to SEO without additional evidence.
    • If the classification audit exposes material ambiguity, correct the exported reporting layer, disclose the rule, and keep the same definition in future comparisons.

    On your next reporting cycle, export the branded and non-branded views before discussing total organic growth. Pick the segment that changed, inspect its query-page cohort, write one falsifiable explanation, and attach one action to it. That small discipline turns "it depends" from a vague qualification into a measurement method your team can use.

    References

  • B2B Video Sales Strategy: Win the Shortlist Before the Demo

    B2B Video Sales Strategy: Win the Shortlist Before the Demo

    Your sales team gets the meeting, sends a polished demo, and still hears that the buyer is leaning toward a familiar competitor. That is often not a demo problem. The vendor list may have hardened before the buyer ever filled out your form.

    LinkedIn and Bain & Company found that 86% of buyers had preferred vendors in mind on Day 1, while 81% eventually chose from their initial list. Without a disclosed sample and method, those percentages should guide prioritization rather than forecast your pipeline. The practical point is still hard to ignore: your B2B video strategy has to create recognition before demand appears, reduce risk while the buying group evaluates you, and make the next step easy when intent arrives.

    Build recognition across the buying group before intent appears

    Day 1 is not necessarily the day an inquiry reaches sales. It is the point at which people inside an account begin forming a mental shortlist. By the time they search for a category, download a comparison, or request a proposal, familiar vendors already have an advantage.

    That advantage belongs to the buying group, not just your internal champion. A functional leader may like your product and still fail to move the deal when finance, procurement, security, or an executive approver encounters an unfamiliar company. In the reported buying data, a vendor known across the group was more than 20 times likelier to be selected on Day 1. Treat that figure as directional platform evidence, not a guaranteed multiplier. It is a strong reason to stop defining reach as contact with one lead.

    Start your strategy with a buying-group map. Do not begin with a list of video formats.

    1. Name one buying situation. Describe the moment that makes the account reconsider its current approach, not merely the category you sell.
    2. Write one memory sentence. It should connect that situation to the change your company enables without trying to explain every feature.
    3. List the roles that can advance, fund, review, use, or block the purchase. Remove roles that do not participate in this specific buying situation.
    4. Give each role one question to answer. A user may ask whether the workflow will improve. A functional leader may ask whether the change can be implemented. A budget owner may ask whether the choice is defensible. A reviewer may ask what new exposure it creates.
    5. Create role-specific cuts from the same narrative. Keep the central promise consistent, but change the proof, language, and next step for the viewer.
    6. Distribute those cuts through paid media, executive and employee channels, relevant website pages, and sales follow-up. The story should travel across channels even when the individual video files differ.

    This approach prevents a common failure: one broad brand video reaches many people but gives none of them a reason to remember you. Recognition requires both reach and a usable memory. The viewer should be able to repeat what problem you understand and why your approach belongs on the shortlist.

    Measure this stage at the account and role level. Total impressions can hide the fact that you repeatedly reached users while missing economic buyers and approvers. Track which target accounts saw the campaign, which relevant roles were represented, whether those accounts returned, and whether later opportunities contained prior video exposure. You are looking for buying-group coverage, not a large anonymous view count.

    Give every video one job in a three-play portfolio

    Three connected scenes show an executive noticing a phone video, a buying group reviewing product proof, and a buyer joining a sales meeting.

    A demo is not an awareness asset, and a memorable brand clip is not a substitute for implementation proof. Trying to make one video perform every sales job usually produces a slow introduction, a rushed product section, weak evidence, and an abrupt request to book a meeting.

    Build a connected portfolio instead. Each play should answer a different buyer question and earn a different next action.

    PlayBuyer momentQuestion to answerVideo jobAppropriate next step
    Reach and primeBefore active evaluationHave I heard of this company, and what is it known for?Create a memorable association between a buying situation, a point of view, and your brandWatch, visit a focused page, or remember the brand
    Educate and nudgeWhile options are being exploredCan I trust and defend this approach?Explain the change, show expertise, and reduce perceived professional riskReview proof, understand the process, or share the asset internally
    Convert and captureWhen the group is ready to actWill this work here, and how difficult will the next step be?Resolve a specific objection and remove friction from the handoffSubmit a form, request an assessment, or begin a sales conversation

    Play 1: Reach and prime

    Your first-play video is a memory device. It does not need to present the interface, introduce every service line, or prove the full business case. It needs to make one relevant idea easy to notice and easy to retrieve later.

    A useful script sequence is: recognizable buying situation, sharp point of view, credible promise, brand cue. For example, the situation should be concrete enough that the right viewer recognizes their work. The point of view should reveal how you think. The promise should name the direction of improvement without making an unsupported result claim. The brand cue should arrive while attention is still present, not after a long cinematic reveal.

    The call to action should match that modest job. Asking a cold viewer to schedule a complex consultation can create unnecessary friction. A focused page, a related explanation, or simply a clear branded ending may be enough. The purpose is to improve the odds that your company feels familiar when the account begins evaluating vendors.

    Play 2: Educate and nudge

    Once viewers recognize you, the task changes from getting noticed to becoming buyable. Capability matters, but a technically strong product can still lose if the person recommending it expects to be blamed for a poor outcome. Only two of five leading buyer considerations centered on product capability, while 34% prioritized confidence that they could defend the decision if it went wrong.

    Your evaluation videos should therefore answer the questions a buyer will hear in an internal review:

    • Why should we change the current approach?
    • What makes this method credible rather than merely different?
    • What has to be true for it to work?
    • What will our team need to contribute?
    • What are the likely objections from finance, procurement, operations, or leadership?
    • What evidence can the champion forward without having to reinterpret it?

    Strong assets at this stage include an executive explaining a category change, a practitioner walking through the operating process, a customer describing a comparable decision, and a direct response to a recurring objection. The goal is not to overwhelm the viewer with information. It is to give the buying group language and evidence it can reuse when you are not in the room.

    Play 3: Convert and capture

    A conversion video should stop broad persuasion and help the viewer complete one next step. State what will happen after the click, who will be involved, what information is needed, and what the buyer will receive. If the form opens onto an unexplained sales process, the video has not removed the important friction.

    On LinkedIn, combining video ads with immediate lead-generation forms was reported to triple form open rates. That platform benchmark is a testable hypothesis, not a promise. Compare the full path in your own campaign: form opens, completed submissions, accepted meetings, qualified opportunities, and progression after the first call.

    Match the handoff to sales-cycle length. For a cycle under 30 days, the suggested starting pattern is a direct video-and-form combination that captures intent immediately. For a longer cycle, retarget engaged viewers with expert-led material and invite a useful conversation rather than forcing an early transaction. In either case, define what the next step gives the buyer. Learn more is not a value proposition.

    Make the first frame work with the sound off

    B2B video is often reviewed in a quiet office, between meetings, or inside a fast-moving feed. If meaning begins only when a speaker finishes an introduction, much of the audience never reaches the point.

    On LinkedIn, 79% of users were reported to browse without sound. The same platform data associated bold colors with 15% higher engagement and clear, process-oriented steps with 13% better retention. Those figures do not mean every brand should use the same palette or turn every message into a numbered list. They show why visual contrast and immediate structure deserve a place in the brief.

    Use this silent-first production check before approving a cut:

    • The first frame identifies a relevant situation, tension, or outcome. A logo by itself does not do that job.
    • Captions begin with the first meaningful spoken line. Do not make the viewer wait for context.
    • On-screen text carries the essential nouns and verbs. Keep supporting detail in the narration, caption track, or destination page.
    • Each visual beat advances one idea. Decorative motion should not compete with the claim.
    • The brand appears while the central idea is being communicated, not only on an end card that many viewers will never see.
    • The last frame names a specific next action and the value of taking it.

    For awareness on LinkedIn, videos in the 7-to-15-second range produced stronger brand lift than shorter or longer alternatives. Keep the qualifier attached: that is an awareness finding from one platform, not a universal length for demos, customer stories, webinars, or sales follow-up. An evaluation video should be as long as necessary to answer its assigned question and no longer. Cutting a complex proof point to fit an awareness benchmark can make the asset less useful.

    Use repeatable storyboards instead of one universal template

    • For recognition: show the buying situation, introduce a counterintuitive point of view, connect it to a credible promise, and close on a brand cue.
    • For evaluation: state the buyer’s question, make the claim, show the mechanism or process, supply proof, address the strongest objection, and offer a deeper resource.
    • For conversion: identify the peer or use case, show the relevant outcome, clarify what the buyer must do, explain what happens next, and present the form or conversation as a useful exchange.

    Use cultural references and memes carefully. They were associated with 41% and 111% higher engagement, respectively, in the reported platform data. Engagement is not the same as trust, buying-group coverage, or revenue. A reference earns its place only when your audience understands it, your brand can carry it naturally, and it sharpens the commercial point. If the joke is more memorable than the problem you solve, it has taken over the asset.

    Resolve execution, decision, and effort risk with proof

    Three business decision-makers review a product workflow, a finished deliverable, and an implementation kit with a technical specialist.

    Late-stage buyers do not need another general claim that your solution is powerful, seamless, or innovative. They need evidence that addresses the downside they are trying to avoid. Separate that anxiety into three practical categories before choosing the speaker or format.

    • Execution risk: Will the solution produce the expected result in an organization like ours? Use a credible peer, comparable context, and a clear explanation of what changed.
    • Decision risk: Is this a choice I can recommend and defend? Use expert reasoning, transparent decision criteria, and visible people who can support the account.
    • Effort risk: How difficult will adoption be? Show the implementation process, responsibilities, dependencies, first milestone, and the support available after purchase.

    Social proof is especially important here. A reported 90% of buyers rely on social proof, but a wall of customer logos gives the buying group little material to evaluate. A recognizable logo may signal familiarity. It does not explain whether the customer faced the same constraint, made the same tradeoff, or completed a comparable implementation.

    Build a customer proof video around information the viewer can actually use:

    1. Identify the customer’s role and relevant operating context.
    2. Describe the prior condition without inflating the problem.
    3. Explain the criteria used to choose an approach.
    4. Show what implementation required from both sides.
    5. Present only outcomes the customer has verified and approved for publication.
    6. Name an important condition, limitation, or lesson so the story does not sound frictionless.
    7. Point to a page or conversation where the buyer can examine the proof in more depth.

    Real people also make the vendor easier to evaluate. On LinkedIn, ads featuring executive experts were associated with 53% higher engagement, rising to 70% for executives shown speaking on conference stages. The useful lesson is not to manufacture stage footage. Put credible subject-matter experts in situations where their expertise is visible: explaining a tradeoff, challenging a weak assumption, or walking through a decision.

    Employee distribution can extend that trust beyond a corporate account. Regular posting by only 3% of employees was associated with a 20% lift in lead generation. Do not turn 3% into a staffing target or pressure employees to repeat approved slogans. Start with people who already have useful expertise and a credible relationship with the audience. Give them a clear topic, factual guardrails, captions, and room to speak in their own voice.

    For effort risk, show enough of the process to make the work legible. Explain the first meeting, the information the buyer must supply, the teams typically involved, and the ownership on each side. Do not claim implementation is effortless if it is not. Visible complexity can be managed; hidden complexity damages confidence after the contract is signed.

    Run one always-on system and measure movement, not views

    A three-play strategy fails when brand, demand generation, sales, and customer marketing operate separate video libraries. Brand buys broad reach. Demand generation asks for form fills. Sales records one-off explainers. Customer marketing owns the usable proof. The buyer then encounters different claims, visual identities, and promises at each stage.

    Create one shared brief for every asset. It should contain the buying situation, target roles, assigned play, risk being addressed, claim, approved proof, channel, next action, and success metric. Give every video an identifier that follows it into campaign reporting, landing-page analytics, and the CRM. That makes it possible to see which asset introduced an account, which one deepened evaluation, and which one preceded a qualified handoff.

    Consistency matters more than occasional bursts. Always-on campaigns were associated with 10% higher conversions than campaigns that repeatedly stopped and restarted. Always-on does not mean running one creative indefinitely. It means preserving continuous buying-group coverage while rotating messages, speakers, proof, and formats as performance or buyer questions change.

    Measure each play against the movement it is supposed to create:

    • Reach and prime: target-account reach, role coverage, frequency, qualified visits, and later opportunity exposure.
    • Educate and nudge: repeat engagement from target accounts, completion of substantive proof assets, visits to customer or implementation pages, internal sharing where observable, and influence on open opportunities.
    • Convert and capture: form open-to-submit rate, accepted meetings, qualified-opportunity rate, progression after the meeting, and time to the agreed next step.

    Views, watch time, and engagement remain useful creative diagnostics. They are not interchangeable with commercial progress. If an asset earns attention but reaches the wrong roles, produces no deeper evaluation, and never appears in opportunity journeys, decide whether it needs a different audience, message, or place in the portfolio.

    Companies that connected video across the buying journey were reported to generate up to 1.4 times as many leads. That relationship does not prove that integration alone caused the lift. Use it as a reason to test a connected system against your current fragmented approach, with the same commercial definitions on both sides.

    Key takeaways

    • Enter the buying process before active demand by building recognition across the full buying group, not only the likely user or champion.
    • Assign every video one job: create memory, make the choice defensible, or remove friction from the next step.
    • Design awareness video for silent viewing, immediate context, and fast brand association; do not force its length rules onto proof-heavy assets.
    • Sell buyability as well as capability by answering execution, decision, and effort risk with verifiable proof.
    • Use experts, customers, and employees because of the specific questions they can answer, not merely because a human face tends to attract engagement.
    • Connect brand and demand measurement at the account level so views can be related to buying-group coverage, evaluation, and pipeline movement.

    Start with one buying situation and one account segment. Build three connected assets: a silent recognition cut, a risk-answering expert or customer explanation, and a conversion video that makes the next step explicit. Give each asset its own audience, action, and metric, then distribute them as a sequence rather than three unrelated campaigns.

    Your next sales video should not begin with a camera choice. It should begin with a buying-group role, a risk, and a next action. If the brief cannot name all three, do not shoot yet.

    References

  • A Practical Scorecard for AI-Era Digital Visibility

    A Practical Scorecard for AI-Era Digital Visibility

    Your rankings can hold steady while your brand quietly falls off the buyer’s shortlist. A prospect may ask ChatGPT, Gemini, or Claude for options, encounter you in a comparison without visiting your site, see a social post, and convert long after the first interaction. Traffic and last-click conversions record only fragments of that journey.

    You don’t need another all-purpose visibility score. You need a measurement system that separates business results, early intent, channel reach, AI perception, and volatility. That separation tells you whether to fix discoverability, positioning, conversion, or the metric itself.

    Key takeaways

    • Keep business outcomes, validated proxy events, channel visibility, and AI perception in separate layers. They answer different questions.
    • Measure AI visibility as a current state, a change from the previous baseline, and a pattern of stability over time.
    • Use a fixed prompt library and consistent test conditions. Otherwise, changes in your test can masquerade as changes in brand perception.
    • Promote a micro-conversion into reporting or bidding only after it predicts a downstream outcome, occurs early enough to be useful, and remains dependable.
    • Treat every unusual metric pattern as a diagnosis to test, not an automatic instruction to publish more content or increase spend.

    Build a layered scorecard instead of one blended score

    Five distinct transparent measurement layers align around a central axis, with blocks, pulses, nodes, prisms, and ribbons representing different metric types.

    A single score is attractive because it makes reporting look simple. It also hides the reason performance changed. An increase in AI mentions cannot compensate for declining qualified pipeline, just as revenue alone cannot tell you whether a recent visibility initiative is starting to work.

    Build the dashboard in layers. Let each layer retain its own denominator, time horizon, and decision owner.

    Measurement layerWhat to trackQuestion it answersDecision it supports
    Business outcomesQualified opportunities, pipeline, revenue, or the final outcome your organization acceptsDid marketing contribute to valuable demand?Budget allocation and commercial priorities
    Validated leading indicatorsEvents shown to precede the business outcome, such as a qualified demo request or meaningful product evaluationAre high-intent behaviors moving before revenue appears?Campaign optimization and faster testing
    Search and social discoveryImpressions, query coverage, clicks, referrals, and channel-specific engagementWhere can people encounter the brand?Distribution, content coverage, and channel investment
    AI perceptionMentions, recommendations, prominence, category associations, factual accuracy, and cited supportHow do AI systems recall and represent the brand?Entity clarity, positioning, documentation, and third-party evidence
    Signal stabilityChanges in inclusion, recommendation, position, and associations across comparable snapshotsIs visibility persistent or fragile?Investigation, monitoring, and risk prioritization

    The business-outcome layer remains the truth layer. The other layers shorten your feedback loop or explain how the outcome developed. Calling an AI mention, a scroll, or an impression a conversion erases that distinction and encourages the team to optimize activity instead of value.

    Channel data is also becoming less isolated. Google has begun integrating social channel data into Search Console Insights. That can make discovery reporting more convenient, but placement in one interface doesn’t turn social exposure into search performance or revenue. Preserve the channel label and follow the signal downstream.

    Make AI visibility a repeatable measurement

    AI visibility deserves its own layer because buyers are using generative systems during vendor discovery. A Responsive survey found that 80% of tech buyers use generative AI to research vendors as often as traditional search. That figure describes one surveyed market rather than every buyer, but it is strong enough to make AI recommendations relevant to B2B measurement.

    The difficult part is that an AI answer isn’t a fixed search result. Output can vary with the model, prompt, access mode, available context, underlying data, and model updates. A screenshot proves what appeared once. It does not establish durable visibility.

    Freeze a core prompt library

    Start with the decisions a buyer asks an AI system to help make. Keep a frozen core for period-over-period measurement and a separate exploratory set for new questions. Your core can cover:

    • Non-branded category discovery: which products address a defined problem or use case?
    • Shortlisting: which options fit a specified company type, constraint, or workflow?
    • Comparison: how do named alternatives differ on criteria buyers actually evaluate?
    • Risk and suitability: when is a product a poor fit, and what limitations should a buyer consider?
    • Implementation: which products integrate with the relevant ecosystem or operating environment?

    Record the exact prompt, model, date, access mode, language, location when relevant, repeat count, and full response. Keep these conditions consistent across snapshots. If you revise a prompt, preserve it as a new series instead of splicing its results into the old one.

    Run the same prompt more than once within each measurement window. Repeated runs help you distinguish answer variability from a broader shift. Keep the number of runs consistent so that a larger sample in one period does not create an artificial change.

    Score representation, not just mentions

    Define an eligible prompt before calculating any rate. A prompt is eligible when your offering could reasonably satisfy the stated need. Counting irrelevant prompts in the denominator suppresses the score and encourages category sprawl.

    • Mention rate: the share of eligible responses that name your brand.
    • Recommendation rate: the share that presents your brand as a suitable option rather than mentioning it incidentally.
    • Prominence rate: the share that places the brand in the opening recommendation set or another consistently defined prominent position.
    • Category-association rate: the share that connects the brand to the category, use case, audience, or capability you intentionally target.
    • Representation accuracy: the share of evaluated claims that match your current, verifiable product information.
    • Source-support rate: among answers that provide citations, the share that supports the brand description with an appropriate first-party or credible third-party page.

    A commercial AI brand score may combine visibility and rank in one number. Keep the underlying components accessible. A brand can be mentioned more often while becoming less prominent, or remain prominent while being associated with the wrong use case. Those situations demand different fixes.

    Separate state, drift, and stability

    Your current score is the state. The change between comparable snapshots is drift. The persistence of the signal across several snapshots is stability. Report all three.

    • Express rate changes in percentage points so the size and direction of movement remain visible.
    • Track which brands entered or left the recommendation set, not merely the average number mentioned.
    • Log association gains and losses. A brand may remain visible while moving from a core category into an adjacent one.
    • Compare models separately before calculating any aggregate. Agreement across models is stronger evidence than a gain confined to one system.
    • Measure persistent inclusion by checking which core prompts continue to mention or recommend the brand in adjacent periods.

    A September-to-October 2025 project-management snapshot recorded Atlassian gaining prominence while Slack declined. The same dataset showed category boundaries extending into operations, digital transformation, workflow orchestration, enterprise productivity, and IT consulting. This is one case, not a universal benchmark or proof of causation. It demonstrates why rank alone is insufficient: the conceptual neighborhood around a category can move along with the brands inside it.

    When an association changes, audit the evidence available across your site, technical documentation, integration material, reputable directories, GitHub repositories where relevant, reviews, and community discussions. These environments can reinforce different parts of an entity’s identity. The goal is not to manufacture mentions. It is to make the same accurate category, audience, capabilities, and limitations legible wherever people genuinely evaluate the product.

    Validate proxy metrics before algorithms optimize them

    Long B2B sales cycles create an uncomfortable gap: the team needs feedback before enough opportunities or revenue mature. Proxy metrics can fill that gap, but only if they predict the result you care about. A frequent event isn’t automatically a useful signal.

    Use four tests when deciding whether a candidate event belongs in your scorecard:

    • Correlation strength: people or accounts that complete the event should reach the downstream outcome more often than comparable ones that do not.
    • Timeliness: the event must occur early enough to change a live campaign, audience, message, or budget decision.
    • Actionability: your team must know which lever to adjust when the metric changes.
    • Stability: the relationship should persist across reporting periods and relevant audience segments rather than appearing in one temporary spike.

    Validate the event in a defined sequence:

    1. Name the downstream outcome precisely. Do not mix raw leads, accepted opportunities, and revenue in one target.
    2. Identify candidate events that happen before that outcome and can be joined to the same person or account without breaking your consent and data-governance rules.
    3. Compare downstream outcome rates for entities that completed each event with suitable entities that did not.
    4. Check the lead time. A strongly related event that occurs immediately before the final outcome may explain performance but still arrive too late for optimization.
    5. Repeat the comparison by period, channel, and meaningful audience segment. Promote the proxy only when its direction remains dependable.

    Keep events in three operational tiers. Business outcomes belong in executive reporting. Validated proxies can support campaign learning and, when appropriate, bidding. Diagnostic engagement events such as time on site or scroll depth should remain investigative until you demonstrate a downstream relationship.

    This matters when supplying early signals to Google or Meta optimization systems. Micro-conversions can help an algorithm learn when final-conversion volume is sparse, but the system will pursue the behavior you define. If scroll depth is cheap and loosely related to qualified demand, optimizing for it can produce more scrolling rather than more customers.

    Context changes the quality of a proxy. A newsletter signup may indicate continuing interest, while an add-to-cart event can mislead when abandonment is common. Neither event should inherit value from its name. Let its observed relationship with your own accepted outcome determine how you use it.

    Read cross-metric patterns before choosing a fix

    A strategist examines separate glowing signal forms whose connecting beams lead toward a compass, tuning dial, and open gateway.

    The scorecard becomes useful when you read movement across layers. The combinations below are working diagnoses, not conclusions. Use the next check to confirm or reject each interpretation.

    Observed patternWorking diagnosisWhat to check next
    AI mentions fall while search visibility holdsBrand perception, model behavior, or category association may have shifted without a traditional ranking lossCompare models, inspect lost prompts, review association changes, and verify that the test conditions stayed constant
    AI mentions hold but recommendation rate fallsThe brand remains known but appears less suitable or less prominentExamine stated limitations, comparison criteria, audience fit, and the brands now recommended ahead of it
    Search impressions fall while AI visibility holdsThe problem may sit in traditional search demand, coverage, ranking, or technical visibilitySegment branded and non-branded queries, inspect affected pages, and keep the AI series separate
    A proxy rises while qualified outcomes remain flatThe proxy may have weakened, the audience mix may have changed, or a later handoff may be failingRecalculate the proxy-to-outcome relationship and trace the journey after the event
    AI visibility rises while referral traffic stays flatThe gain may represent exposure rather than visitsCheck recommendation quality, branded demand, assisted journeys, and downstream outcomes before declaring success or failure
    Social discovery rises while search remains flatDistribution may be broadening in one channel without changing search demandPreserve channel attribution and test whether the added audience reaches a validated proxy or business outcome
    Discovery improves across channels but pipeline does notThe constraint may be message fit, offer fit, conversion, qualification, or the sales handoffInspect landing behavior and stage-to-stage progression before buying more reach

    At each reporting review, identify the largest meaningful movement, write down the most plausible explanations, and assign a check that can distinguish among them. Record the decision and its expected effect in the next comparable snapshot. That decision log prevents the team from retrofitting a success story to whichever metric happened to rise.

    Start your next dashboard revision by adding the missing layer, not by adding more charts. If you already report revenue and search traffic, build a fixed AI prompt baseline. If you already monitor AI mentions, add representation accuracy and stability. If micro-conversions drive optimization, revalidate their relationship with qualified outcomes. The next useful metric is the one that resolves a real decision your current reporting leaves ambiguous.

    References