In a significant move, Google Ads has launched a beta feature that allows advertisers like me to connect additional data sources directly to website conversion actions. This innovative step gives us a chance to enhance tag-based measurements using our backend conversion data.
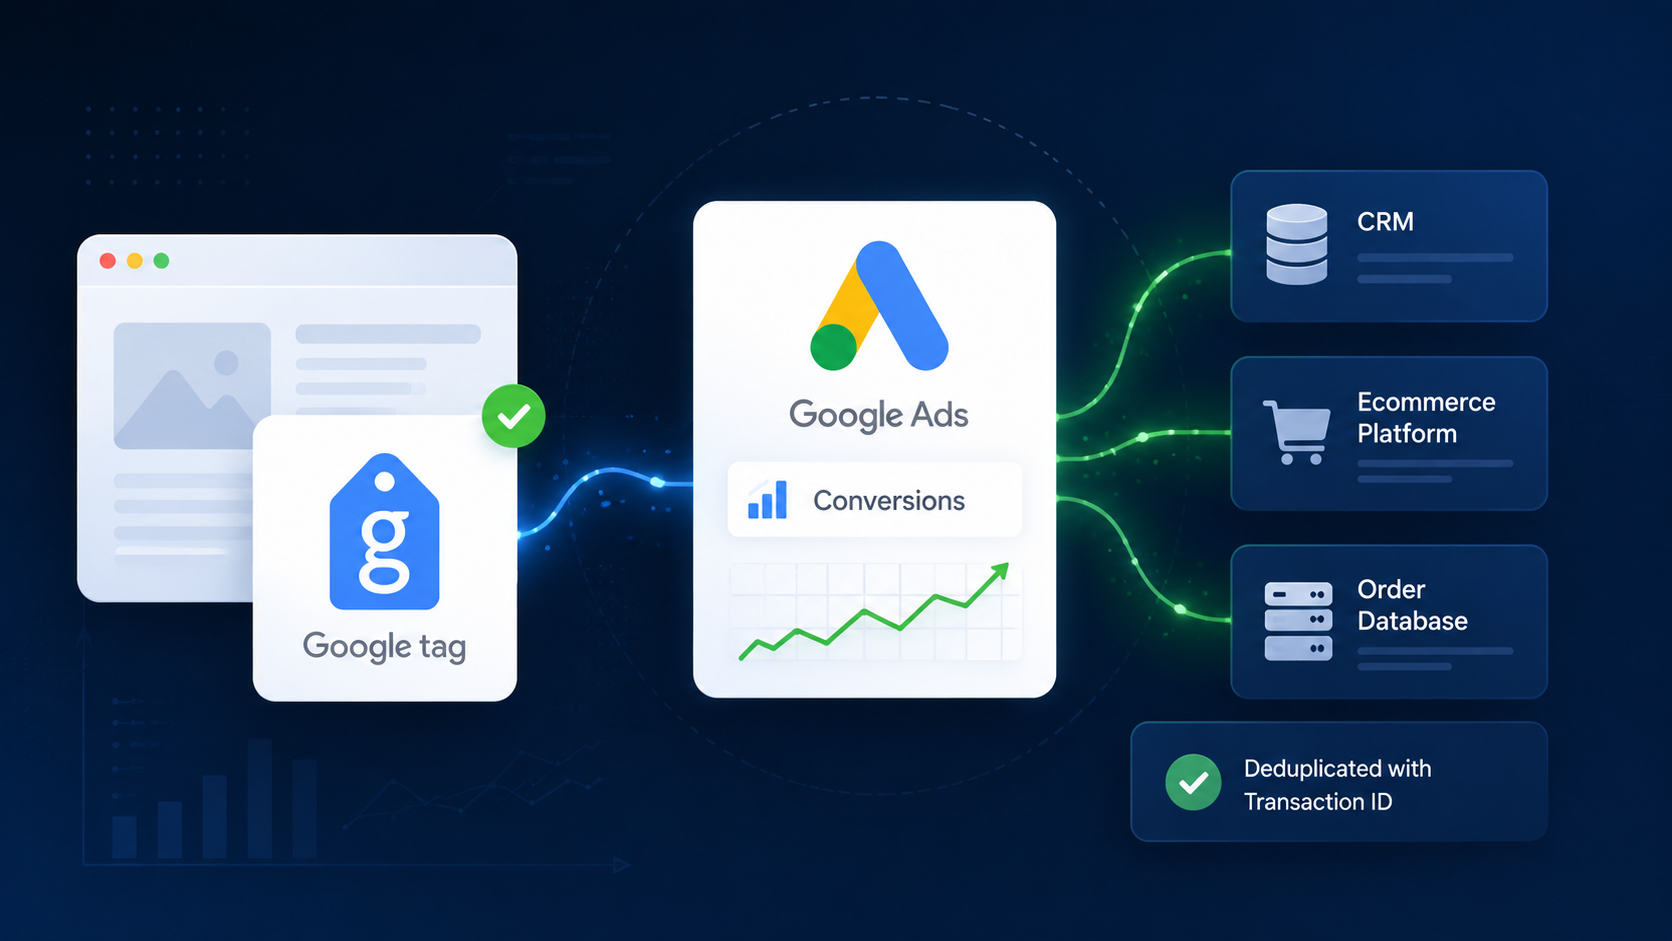
The new feature equips advertisers to merge conversion signals gathered through Google tags with transactional data from various platforms, such as CRMs, order databases, and e-commerce systems.
What’s new. Now, I can append an additional data source to an existing website conversion action via Google Ads Data Manager or through the Data Manager API.
Designed to enhance—not replace—website tagging, this beta allows us to send conversion data from backend systems into the same conversion action utilized for campaign measurement and optimization.
Why we care. This beta is crucial for filling conversion measurement gaps by fusing Google tag data with our first-party data from backend structures like CRMs. It helps us capture conversions that might be overlooked due to browser limits, privacy settings, or ad blockers, providing a fuller view of campaign performance.
Why Google launched it. Google indicates that combining tag-based measurement with backend conversion data allows advertisers to construct a more comprehensive picture of conversions, subsequently boosting campaign performance.
Here’s what this feature helps achieve:
Recover conversions that may escape website tags.
Enhance measurement resilience.
Deliver more exhaustive data for automated bidding.
Simplify data integration through the Data Manager.
How it works. The system combines website conversion data captured by Google tags with conversion records uploaded from an advertiser’s backend systems.
To avoid duplicate reporting, Google utilizes transaction IDs to identify and de-duplicate conversions between the tag and the supplementary data source within the same conversion action.
What advertisers need to know. The beta is currently restricted to website conversion actions that implement Google tags or Google Tag Manager.
It’s not available for:
Google Analytics imported conversions.
URL-based conversion actions.
Google advises attaching an additional data source to an existing conversion action rather than initiating a new one to eschew potential double-counting across campaign goals.
Data requirements. Each upload must encompass:
Transaction ID.
Conversion date and time.
Advertisers need to supply at least one attribution identifier, like hashed customer data or a Google click identifier.
Google suggests that I upload conversion data as swiftly as possible and ensure the conversion values match the currency format utilized by website tags.
Bottom line. This beta signifies Google’s ongoing effort to bolster conversion measurement by integrating backend transaction data directly into Google Ads. As we seek more comprehensive performance insights, this feature provides a streamlined means to enhance website measurement using first-party business data.
I’m excited to share Microsoft Ads’ latest tool—Product Explorer. It’s a remarkable addition that helps advertisers like us quickly spot catalog issues that might be hindering ad performance.
The introduction of Product Explorer represents Microsoft’s effort to create a central hub where advertisers can effortlessly monitor product catalog health and performance. Navah Hopkins, the Microsoft Product Liaison, highlighted its potential to revolutionize how we handle large product feeds.
Managing these expansive feeds often means struggling to pinpoint which items are ready to serve, which are capturing impressions, or which are missing vital data. Product Explorer steps in to make this task significantly more manageable.
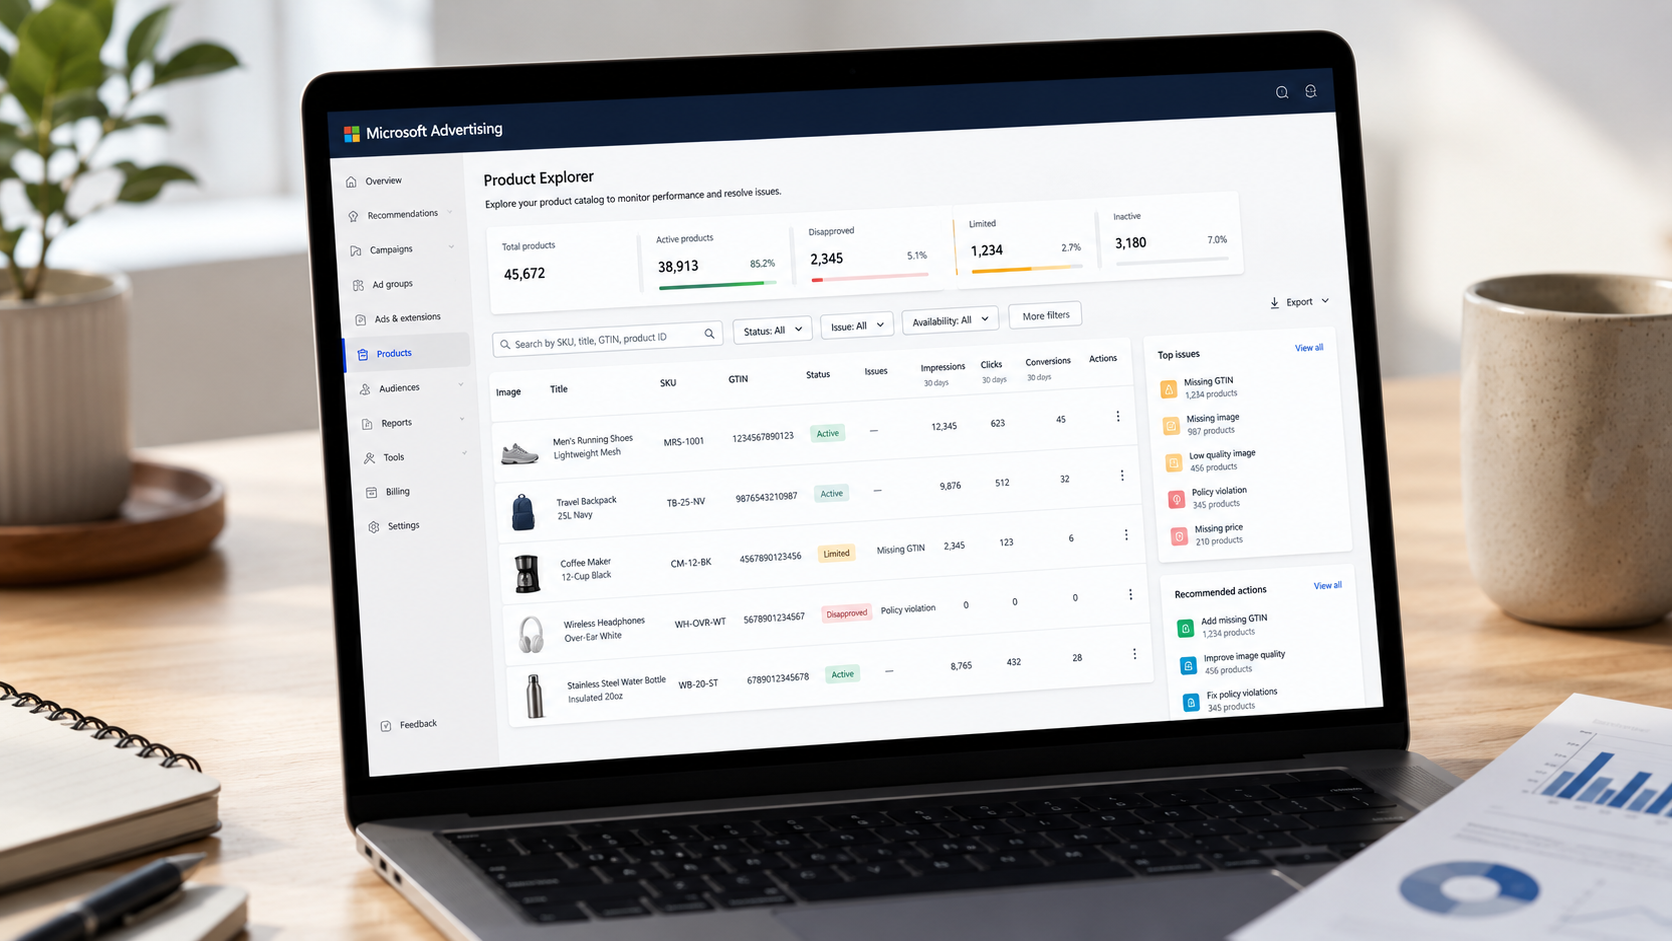
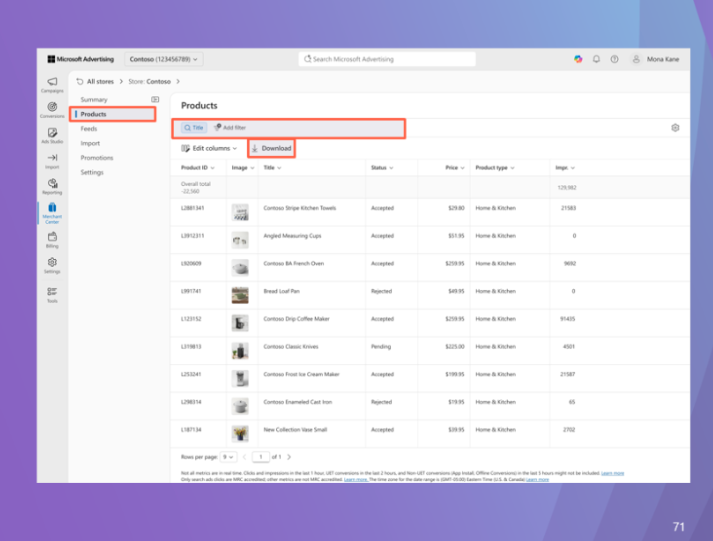
What’s new? Now, I can explore my entire product catalog through a searchable interface. This tool allows for filtering by SKU, title, GTIN, and product ID, helping to quickly identify active products that are delivering performance results.
What it does. Product Explorer is designed to highlight eligibility issues and metadata gaps, along with other elements that might prevent products from serving. Plus, it offers recommended actions and the option to export filtered product lists for deeper analysis.
Why we care. As advertisers, having diagnostics and performance reporting combined in one interface means we can move more products into a servable state while identifying underperforming inventory more efficiently.
From searchable catalog reporting to gaining product-level performance insights covering the last 30 days, this tool offers issue detection and actionable recommendations to enhance feed quality.
The big picture. As retail advertising becomes more automated, focusing on feed quality is increasingly essential. Accurate visibility into catalog issues can significantly impact the reach and performance of our campaigns.
Availability. According to Navah Hopkins, the tool is live and ready for use in our accounts.
Planning PPC budgets was never straightforward for me, especially when facing differing data from Google Ads, Meta Ads, GA4, and my CRM/CMS. I often ask myself, what numbers should I actually report, and how can I ensure I’m optimizing for a genuine impact?
Like many, I believed better tracking, cleaner UTMs, or a refined analytics setup might solve the problem. But often, it’s something else entirely—the attribution trap.
We’ve been taught to rely on data-driven marketing. Ideally, analytics tools clarify what’s effective if configured right. But is it enough to just follow the data?
Attribution can be misleading. Without a solid framework, I find myself making budget decisions based on incomplete insights, potentially damaging the business.
Let’s consider: Attribution assigns conversion credit to channels, which is useful, but it doesn’t reveal which channels actually drove those conversions.
This may sound academic, but understanding it is crucial for solving the measurement puzzle. I’ll explore why attribution fails, how to use existing data effectively, and if incrementality testing is necessary.
Why ads, analytics, and CRM numbers never match
Aligning ad networks, GA4, and CRM data seems impossible. These systems serve different purposes, follow different methodologies, and measure distinct moments in the customer journey.
Your customer journey as a framework
Picture someone clicks on a Meta ad, sees retargeting on YouTube, then Googles the brand before buying—all in a week.
With standard attribution windows, both Meta and Google Ads report one conversion. GA4 and my CRM also show one, likely crediting Google Ads paid search.
Did Meta create a “duplicate” conversion? No. Meta can’t see Google Ads interactions, so it can’t detect duplicates.
GA4 and CRM probably ignore Meta Ads. Should I move Meta Ads budget to Google Ads branded search based on that? Probably not.
Structural differences as diagnosis enhancers
It doesn’t end there:
Attribution date: Ad platforms credit conversions on the click day, whereas GA4 and CRMs report based on conversion day, leading to discrepancies with long customer journeys.
Cross-device behavior: Different devices for interactions lead to CRM discrepancies if users aren’t merged correctly.
Privacy restrictions: Ad blockers and cookie consents prevent some conversion tracking, and ad networks use modeled conversions to fill these gaps, unlike CRMs.
Some issues are fixable with better configuration, such as server-side tagging, offline conversion imports, and consistent UTMs. However, structural differences mean expecting full correlation is unrealistic.
Once I accepted the number disparities, my next temptation was choosing a single source of truth, often GA4 or CRM, and relying on it. That’s where the attribution trap snaps shut.
Every tool uses an attribution model. Regardless of model—be it first-click, last-click, linear, time decay, or data-driven—they all have limitations.
Every attribution model has blind spots
Last-click. Although easy to understand, it’s easy to exploit by rewarding the final touchpoint and undervaluing demand generation.
First-click. It rewards discovery but ignores what convinces a customer to convert.
Linear and time-decay. While they seem balanced, they’re quite arbitrary, as customer journeys don’t follow strict rules.
Data-driven. Despite its sophistication, its mechanisms remain opaque, perpetuating a “black box” issue.
What happens depending on your source of truth
Hopefully, you now grasp the deeper issue: attribution addresses which touchpoints deserve credit once a conversion occurs. Relying solely on one tool means you can’t escape the attribution model’s blind spots.
If I depend solely on my CRM, I fall into the last-click attribution pit, often focusing on branded search. Over time, I might see demand decline despite strong results from my chosen source of truth.
Conversely, depending only on ad platform data means inflated results reporting, showing 2x to 4x more revenue than finance actually sees, resulting in increased marketing budgets while finance calls for cuts.
GA4 seems mature, but it only captures on-site customer journeys, missing awareness campaigns that might not result in website visits.
Realizing each tool’s fundamental flaws will lead someone to suggest incrementality testing — Did this campaign drive otherwise impossible conversions?
Incrementality tests: The perfect solution?
Incrementality measures results from your campaign — conversions that wouldn’t have existed without it.
Think of two worlds: one where the ad ran, the other where it didn’t. The difference between these worlds is your incremental impact. Everything else is baseline activity.
Attribution vs. incrementality
This distinction is crucial. Many reported conversions, especially from retargeting and branded search, are from individuals who would have converted anyway.
An ad followed by a conversion doesn’t guarantee the ad caused it. Incrementality testing measures the real credit.
For budgeting, distinguishing between true conversion drivers and illusions is vital.
A retargeting campaign showing strong ROAS might deliver little incremental value. If I cut it, conversions barely change; keeping it means paying for illusory performance.
How to test for incrementality
Testing incrementality involves experiments with two groups: one exposed to the ad and one that isn’t. Here are some typical methods:
Geo holdout. Compare regions where campaigns run versus those where they don’t and observe conversion differences.
Audience holdout. Platforms like Google and Meta allow excluding portions of the target audience from ad exposure, then measuring outcome differences.
Time-based testing. Temporarily halt campaigns to assess changes in conversion volumes, though this method carries risks like seasonal effects blurring results.
Is incrementality right for you?
For those managing large budgets — say €1 million per month — you’re likely familiar with these tests. But what if you’re running a smaller operation?
At this scale, incrementality can be impractical as reliable tests demand meaningful test and control group distinctions, necessitating significant data and spend.
Nonetheless, I can use shortcuts, particularly around branded search, to spot potential problem areas.
Triangulation: The actionable decision-making process
Considering attribution limitations and incrementality tests for big advertisers only, I rely on triangulation.
Utilize existing tools, acknowledging their imperfections, and educate clients or leaders on not sticking to a “single source of truth.”
Start with your CRM/CMS
These systems track genuine deals and revenue. Treat all other figures as explanatory attempts.
If the ad platforms together show $50K revenue while Shopify reports $35K, trust Shopify as it reflects reality.
It can even differentiate conversions from new versus returning customers, crucial for measuring nCAC.
Overlay my customer journey onto ad platform results to understand campaign impacts along the journey, using available incrementality tests to decide budget allocation better.
Improve on triangulation
Attribution windows: Long customer journeys challenge interpretation. Segment campaigns by customer journey stages, and shrink attribution windows to improve outcomes.
Track ratios: Keep the gap between ad platform conversions and CRM data consistent. Sudden changes might reveal an incrementality insight.
Triangulation won’t provide clean numbers. But it will deliver a consistent decision-making framework, far superior to false precision.
As someone exploring the ins and outs of Microsoft Advertising, I’ve discovered an update that’s sure to enhance our campaign analysis. Microsoft is now allowing us to customize columns with all conversion metrics, providing us with deeper insights and aligning reports with our unique business goals.
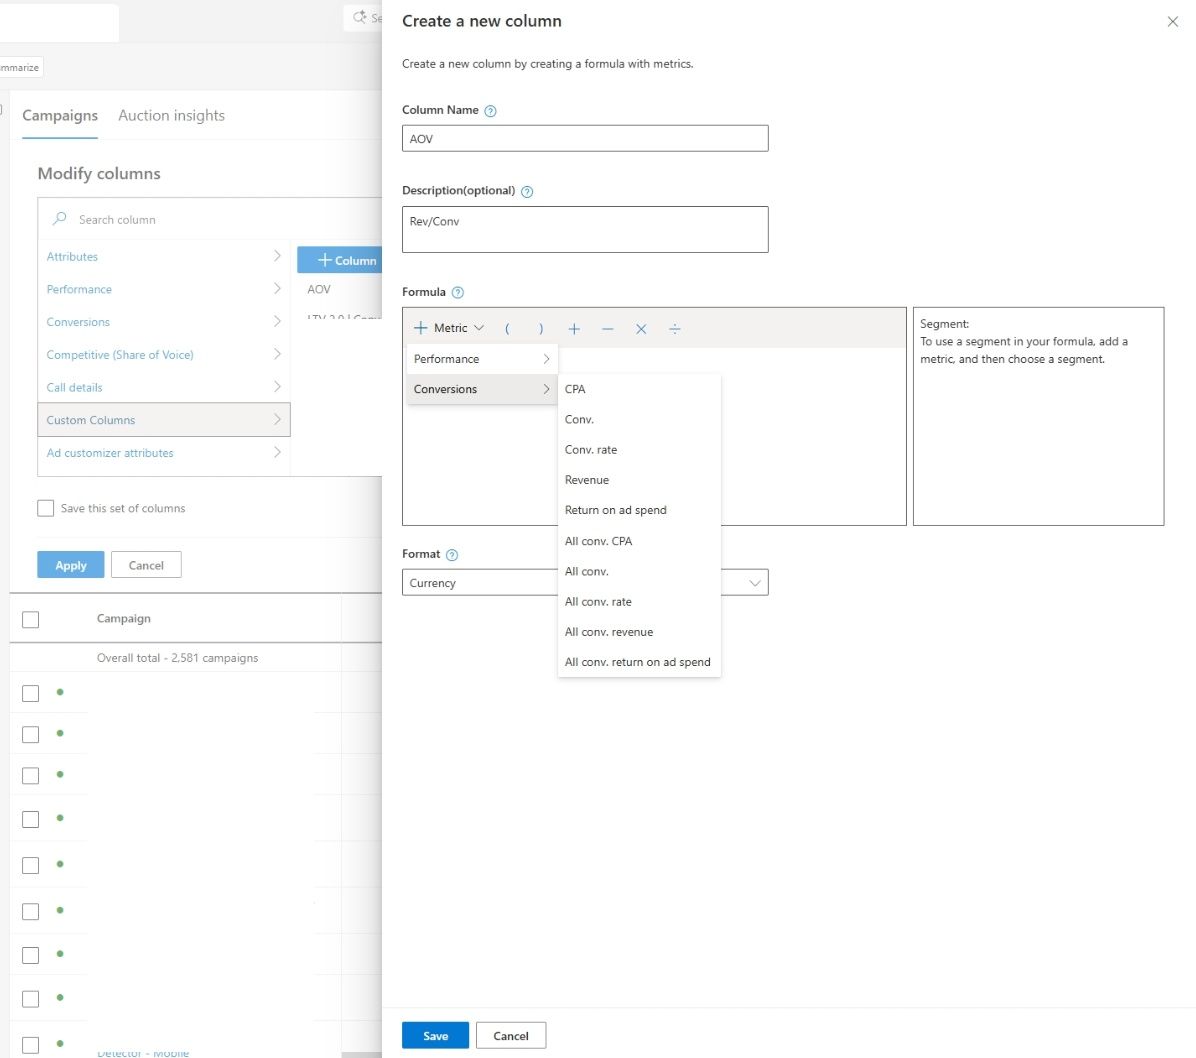
What does this mean for us? Well, according to Navah Hopkins, our go-to expert at Microsoft, we can now build custom metrics by leveraging the full spectrum of conversion data available in the platform. This means we can track all conversions and primary conversions, enabling us to tailor our reporting to meet our specific objectives more closely.
Please note the new image showcasing Microsoft’s enhanced custom columns feature. It’s a visual reminder of how these updates can transform our analytical capabilities.
Why am I excited about this? Because the standard reporting often doesn’t mirror how we truly measure success. By giving us the tools to expand custom columns, Microsoft allows us to define metrics that truly matter—be they lead quality, revenue, or a combination of conversion actions.
This flexibility is crucial for managing a variety of conversion types or navigating complex marketing funnels. Now, I can create custom columns, using ratios and metric combinations such as cost per qualified lead or conversion rates focused on primary goals.
Moreover, I appreciate that the revenue and ROAS calculations will now reflect the values that align with my conversion goals, providing more accurate insights directly linked to business outcomes.
What does this change imply for us in a broader sense? It represents a shift toward a more flexible and advertiser-defined measurement approach, instead of relying solely on standardized platform metrics.
This update highlights the ongoing demand for improved reporting customization as campaigns become increasingly automated and intricate.
So, what should we keep an eye on? I’ll be observing how advertisers like us utilize these custom metrics to guide optimization decisions, whether consistency in reporting improves across teams, and if similar flexibilities will roll out in other areas of the platform.
Bottom line? With Microsoft giving us more control over how we measure success, custom columns are evolving into a vital asset for campaign analysis. Read more about this update here.
I’m thrilled to share some exciting news from Microsoft Advertising. They’ve made a significant leap in Performance Max reporting by adding conversion and spend data to PMax placement reports. This means I now have a much clearer understanding of how my ad placements are performing, which is fantastic for optimizing my campaigns.
What’s happening. According to Microsoft Ads Product liaison Navah Hopkins, the PMax Website Publisher URL report now includes conversion and spend metrics. This update takes us beyond just seeing where our ads appear; it lets us see actual performance data in action.
This new visibility allows me to pinpoint exactly which placements are driving meaningful results, not just impressions or clicks. It’s a game-changer for understanding what really works.
Why we care. Having this level of detail means I can make smarter decisions about where to allocate my budget. It helps me scale successful inventory and eliminate waste, providing a stronger foundation to trust Performance Max’s capabilities with tangible data rather than estimates.
How advertisers can use it. This update opens several practical doors. I can leverage high-performing placements to shape my Audience Ads strategies, like building remarketing campaigns or targeting audiences based on successful inventory.
At the same time, I can spot placements that aren’t a good fit and exclude them using account-level URL exclusion lists. This not only protects brand safety but also boosts efficiency.
Between the lines. This development further enhances the transparency of automated campaigns. It’s evident that while automation handles much of the heavy lifting, platforms are keen on giving us advertisers clearer insights into what’s effective and where we need to intervene.
What to watch:
Will this transparency extend even further in PMax reporting?
How will advertisers balance the power of automation with manual tweaks?
Could similar reporting features be rolled out across other platforms?
I sometimes find it challenging to measure the true impact of my paid social campaigns on PPC performance. Despite not always seeing conversions directly within the social platform, these ads can significantly influence my overall marketing efforts.
To truly understand how paid social affects my other marketing channels, including PPC, I’ve found a few strategies that help me set up and measure effective tests.
Step 1: Determine Your Hypothesis
I always start by clarifying what I want to learn from my tests. Defining a realistic hypothesis that I can evaluate with available data is crucial.
For example, I often use the following hypothesis to measure the influence of social traffic on PPC:
Search lift hypothesis: Increasing social media spend will boost brand search volume and PPC CTRs.
Logic:
Social ads build brand awareness, prompting more people to search for my brand during research and purchase stages.
As more people become familiar with my brand, they tend to click on PPC ads more, regardless of search terms, enhancing both brand and non-brand CTRs.
Exposure to my brand boosts trust, potentially increasing conversion rates.
Measurement:
Track impression and click volume for branded terms.
Monitor CTR changes for brand and non-brand terms.
Observe conversion rate changes for these terms.
My hypothesis varies, sometimes focusing on the lift from social spend or a surge in direct traffic.
Step 2: The Test
Setting up test parameters is my next step. It’s essential to avoid simply comparing results before and after changes due to possible seasonal effects. A geographic split test is typically my go-to method.
In this test, I increase social spend in specific geographies and analyze PPC data from these areas versus others. While selecting geographies, I control for various factors, such as regional televised sports events or confined TV commercials, to ensure my test results are valid.
It’s crucial to compare control and experimental groups by similar factors like income levels and region types. I also ensure my budget can accommodate anticipated increases in social spent, preventing budget limitations from skewing results.
Evaluating the impression share before and after allows me to ensure budget constraints don’t impact my outcomes.
Step 3: The Measurement
When starting measurement, I keep it simple, comparing platform data to see changes prompted by stopping social spend across all channels like TikTok, LinkedIn, Facebook, etc.
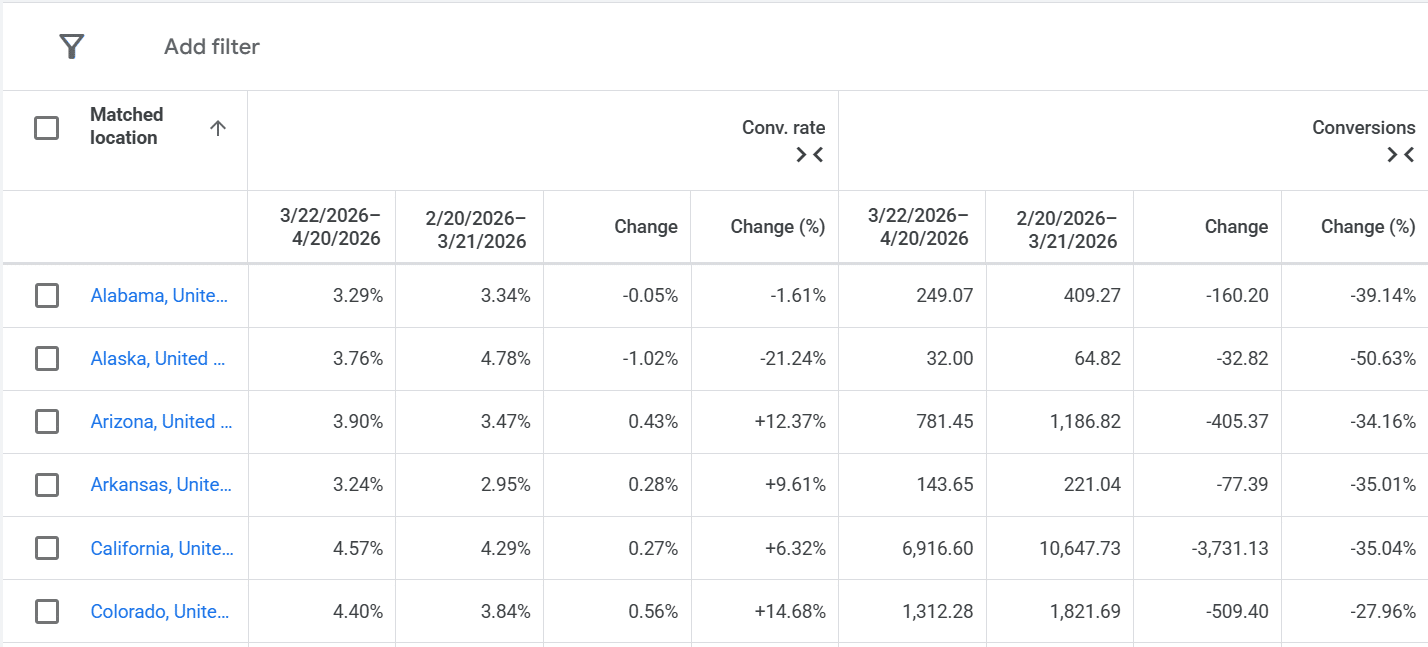
Upon halting social spending, I’ve observed mixed conversion rate results, with some regions showing increases and others decreases, though an overall drop in conversions was common.
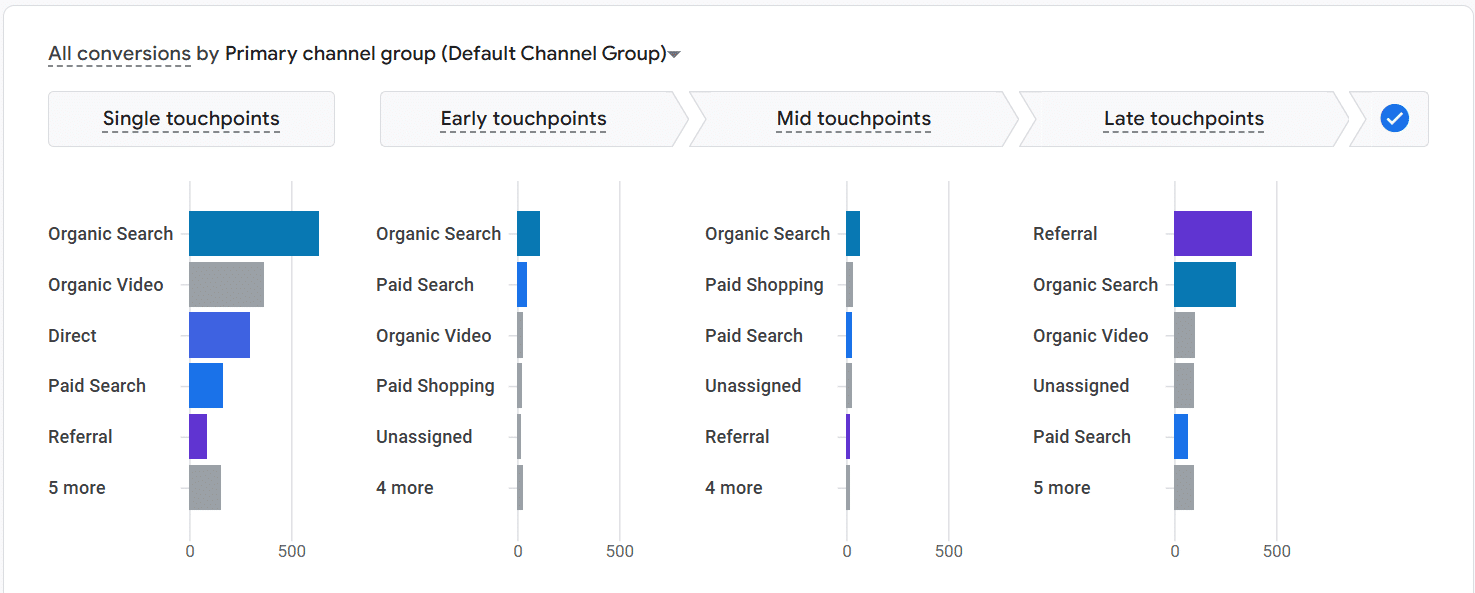
Depending on my analytics setup, I delve into more complex analyses, looking at conversion touchpoint differences, visitor overlap rates between social and paid search, or different attribution models.
Before initiating any tests, I ensure that my measurement capabilities are robust enough to understand and interpret results accurately.
Step 4: Evaluation Beyond Test Criteria
While running tests, I measure results against my hypothesis but also look at additional variables that may provide further insight.
In one case, a brand I tested on believed they could cut down on brand advertising without affecting their search volume. However, a drop in common brand terms contradicted this. An evaluation across various factors showed unpredictable results that required expanded analysis.
I rely heavily on my experience to sniff out anomalies and conduct further internal evaluations.
When results seem unexpectedly drastic, I question whether it’s a quirk or if other factors, like recent AI-driven changes, are silently influencing outcomes.
What to Do With Your Social Impact Tests
The test setup is straightforward:
Define your hypothesis.
Choose how to test, preferably using a geographic split.
Ensure you can measure the outcomes appropriately.
Run the tests and evaluate the hypothesis-related metrics.
Assess additional metrics for further insights or testing ideas.
For some, social channels like Facebook are top converters, while others see poor outcomes in isolation, necessitating tests to guide budget allocation strategies.
In these scenarios, companies with substantial social media spending reduce to test impact, while others might increase spending to assess performance changes.
Results vary widely across companies, with some seeing significant performance lifts and others noticing minimal changes, underscoring the need for personalized testing.
Conducting geographic split tests can offer incredible insights into how social media campaigns bolster or detract from other marketing channels.
I’ve got exciting news from Google Ads! They’re making our lives a lot easier by simplifying the process of enhanced conversions into one convenient toggle switch. This means I can now enjoy more accurate conversion tracking with minimal setup effort.
Google is streamlining one of its key measurement tools by merging enhanced conversions for web and leads. By doing so, I can utilize multiple data inputs simultaneously, offering me more precise tracking with fewer hurdles.
What’s happening. Google Ads is consolidating its enhanced conversions into a single system. The best part? I no longer have to choose just one implementation method!
I can send user-provided data through various channels like website tags, Data Manager, and API integrations all at once. The prior separation between ‘enhanced conversions for web’ and ‘enhanced conversions for leads’ is disappearing, saving me from unnecessary complexity.
What’s changing and when: By June 2026, Google Ads is allowing the intake of user-provided data from website tags, Data Manager, and API connections. This collective approach is set to enhance conversion accuracy and boost bidding performance.
The switch to a single feature with an easy toggle removes the need for me to fuss over method selection like tag vs API.
Why I care. This update is a game-changer for conversion tracking during a time when data signals are vanishing. By utilizing multiple data sources, Google Ads can match conversions more precisely, which boosts my bidding efficiency and campaign successes. It also removes the technical obstacles, giving me seamless access to better data without needing to stick to one integration method.
Impact on advertisers. No action is required from me or any existing users if the customer data terms have already been agreed to. New users have the flexibility to enable enhanced conversions at both the account and individual conversion action levels, with the option to opt-out at the conversion action level if needed.
How to enable it (quick take). At the account level, I’ll simply go to Goals → Settings, enable enhanced conversions under Customer data use, and accept the data terms. For individual conversion actions, I can set up or edit a conversion action, enabling enhanced conversions during the process and agreeing to data terms.
Yes, but. To leverage enhanced conversions, I must agree to Google’s Data Processing Terms and ensure I’m complying with its expanding use of first-party data, a crucial step today.
Bottom line. Google is quietly pushing for broader adoption of user-provided data by making setup simpler. For me, this means improved performance with less manual input. I’m getting richer conversion data feeding into my bidding strategies and optimizations, and I can achieve greater results while simplifying my overall measurement strategy.