In the ever-evolving world of AI-driven advertising, I’ve noticed that Performance Max campaigns have become absolutely crucial. Both Google and Microsoft offer these innovative opportunities, allowing advertisers to bring together creative assets, audience signals, and automation into a single seamless campaign type.
While Google and Microsoft share this foundational concept, they execute it uniquely. I am excited to offer an in-depth comparison of Google PMax and Microsoft PMax as they stood toward the end of 2025, hoping to shed light on the intricacies that could shape your 2026 advertising strategies.
What I found universally true across both platforms is the replacement of ad groups with asset groups. These groups encompass a blend of creatives, such as images and headlines, along with audience signals, but also carry an absence of any prioritization.
Significantly, PMax is built for automation. Both platforms request the use of Maximize Conversions or Maximize Conversion Value strategies, underlining the need for conversion tracking that can keep pace with no less than 30 conversions in a month.
Goal alignment is another crucial aspect. I realized that accurate reflection of business goals in your campaigns is imperative, for an artificially low ROAS target will likely backfire by yielding unexpectedly lower returns.
Search term visibility is an area where Google offers broader negative keyword support, unlike Microsoft who is still piloting this feature. However, Microsoft’s PMax creatives have been involved in AI placements longer, demonstrating proven results and thus indicating a stronger track record in this area.
Google’s PMax has evolved impressively, offering tools such as channel-level reporting and video asset support, which are particularly beneficial for visual marketing endeavors.
On the flip side, Microsoft’s edge, especially for B2B advertising, includes higher campaign limits, impression-based remarketing, and the integration of LinkedIn targeting signals, appealing for advertisers looking at high-quality lead generation.
Reflecting on both platforms, I believe PMax should be seen as a tool for incrementality rather than a replacement for proven search campaigns. The optimal approach involves leveraging both platforms’ strengths, whether it’s Google’s affinity for creative automation or Microsoft’s prowess in B2B targeting and remarketing.
In my experience, the open web often feels like the Wild West, especially in recent times. Many creators, myself included, have watched as our hard work is scraped and fed into large language models without any hint of permission.
This situation has become a free-for-all, leaving website owners with almost no means to opt out or safeguard their creative endeavors. There have been attempts to address this, such as Jeremy Howard’s llms.txt initiative. Much like robots.txt helps us manage site crawlers, llms.txt aims to provide guidelines for AI companies’ crawling bots.
However, a promising new protocol is on the horizon, potentially granting site owners like myself more control over how AI firms utilize our content. It looks like this might become part of robots.txt, allowing us to set definitive rules around AI system access and usage.
IETF AI Preferences Working Group
In response to this issue, the Internet Engineering Task Force (IETF) began the AI Preferences Working Group earlier this year in January. Their mission is to craft standardized, machine-readable rules to empower site owners to articulate AI usage preferences for their content.
Since its inception in 1986, the IETF has established core Internet protocols like TCP/IP, HTTP, DNS, and TLS. Now, they’re laying down foundations for the open web’s AI era. Leading this group are co-chairs Mark Nottingham and Suresh Krishnan, joined by figures from Google, Microsoft, Meta, and more.
Of particular interest is Google’s involvement via Gary Illyes, who is part of this working group.
“The AI Preferences Working Group will standardize building blocks that allow for expressing preferences about how content is collected and processed for Artificial Intelligence (AI) model development, deployment, and use.”
What the AI Preferences Group is Proposing
This group aims to deliver new standards that empower site owners to determine how LLM-powered systems can utilize their open web content.
A standard track document detailing a vocabulary to express AI-related preferences, independent of content association methods.
Standard track document(s) that explain how to associate these preferences with content using IETF-defined protocols and formats, for example, Well-Known URIs and HTTP response headers.
A standard approach for reconciling multiple preference expressions.
At the time of writing, nothing is set in stone yet. Early documents, however, provide a sneak peek into potential standards.
This working group published two crucial documents in August.
These documents propose significant updates to the Robots Exclusion Protocol (RFC 9309), suggesting new rules and definitions enabling site owners to specify AI content usage permissions.
How It Might Work
AI systems on the web are categorized and assigned standard labels. Whether a directory will exist for site owners to identify system labels remains unclear.
Currently, the defined labels include:
search: for indexing/discoverability
train-ai: for general AI training
train-genai: for generative AI model training
bots: for all types of automated processing, such as crawling and scraping
For each label, you can set two values:
y to allow
n to disallow.
I found it interesting that these rules can be applied at the folder level and customized for different bots. In robots.txt, they’re implemented using a new Content-Usage field, akin to existing Allow and Disallow fields.
Here’s an example robots.txt that the working group shared in their document:
Explanation Content-Usage: train-ai=n indicates that no content on this domain may be used for training any LLM model, whereas Content-Usage: /ai-ok/ train-ai=y permits model training using content within the /ai-ok/ folder.
Why Does This Matter?
There’s significant buzz about llms.txt within the SEO community and its use alongside robots.txt. Yet, no AI company has confirmed adherence to these guidelines, and Google disregards llms.txt.
Website owners, including myself, crave more explicit control over how AI companies leverage our content—be it for training models or RAG-based responses.
I feel that the IETF’s new standards signify positive progress. With Illyes as a contributing author, I remain optimistic that once finalized, companies like Google will embrace these standards, respecting new robots.txt rules during content scraping.
I’ve been deeply involved in the compelling discussions around AI, especially the intriguing intersection of ‘AI hype meets AI reality.’ Tools like Semrush One and its Enterprise AIO tool have taken center stage, offering invaluable insights into what’s happening inside LLMs. The big questions I often ponder are: How many citations are we capturing and just how many mentions are our brands accumulating?
When this data first emerged, it felt revolutionary. However, it quickly prompted other questions, like ‘What’s the ROI here?’ and ‘How can I integrate this data into my team’s marketing strategy?’ Ensuring that this valuable and fascinating data translates into actionable insights is a challenge I enjoy tackling.
It’s no secret that the data these tools provide is incredibly valuable. But, what steps do I take next? Let’s uncover this journey together.
The Fundamental Challenges of Tracking LLMs
Tracking LLMs can be more challenging than traditional metrics like Google rankings. Google rankings may show where I stand, but ranking doesn’t always correlate with traffic or revenue. Even if I rank highly, an AI Overview could dominate the search, reducing my traffic for a given keyword. I need to ask myself, is this the right traffic for my business goals?
The big difference between traditional SEO rankings and LLM visibility is the straightforward correlation between strong rankings and increased revenue, which is more complex with LLMs. I can easily track user behavior after they land on my site from organic search, but it’s not so clear-cut with LLMs.
SEO effectively drives traffic to my site, allowing me to evaluate the success of my conversion rate optimization (CRO) strategies. However, LLMs operate differently, leaving me with the task of creatively connecting the dots.
The Problem with Methodology
As I dive deeper into using LLM-related data, I realize this approach requires me to step out of my comfort zone as a performance marketer. My usual reliance on direct attribution and data points is shifted toward constructing a narrative that ties LLM visibility to larger brand storytelling.
This method isn’t novel, however. Brand marketers have dealt with indirect metrics since the days of billboard advertising. Still, the shift requires me to create insights from what might seem like fragmented LLM data.
Metrics and Approach to LLM Impact Measurement
Uncovering the true value brought by LLM visibility metrics is a layered and comprehensive process. To do this accurately, I need to understand the wider ecosystem of my organization’s promotional efforts. This understanding allows me to determine the root cause of site traffic or branded searches effectively.
For instance, if a TV ad campaign runs concurrently with optimizing for LLM mentions, analyzing their impact becomes essential. Only with complete awareness of such activities can I identify true causality or correlation.
From here, I find that LLM visibility data is usually just the starting point. It’s unlike traditional SEO insights, which might be more apparent and direct. My task is to delve deeper, probing these data points to uncover richer insights.
The Branded Search of It All
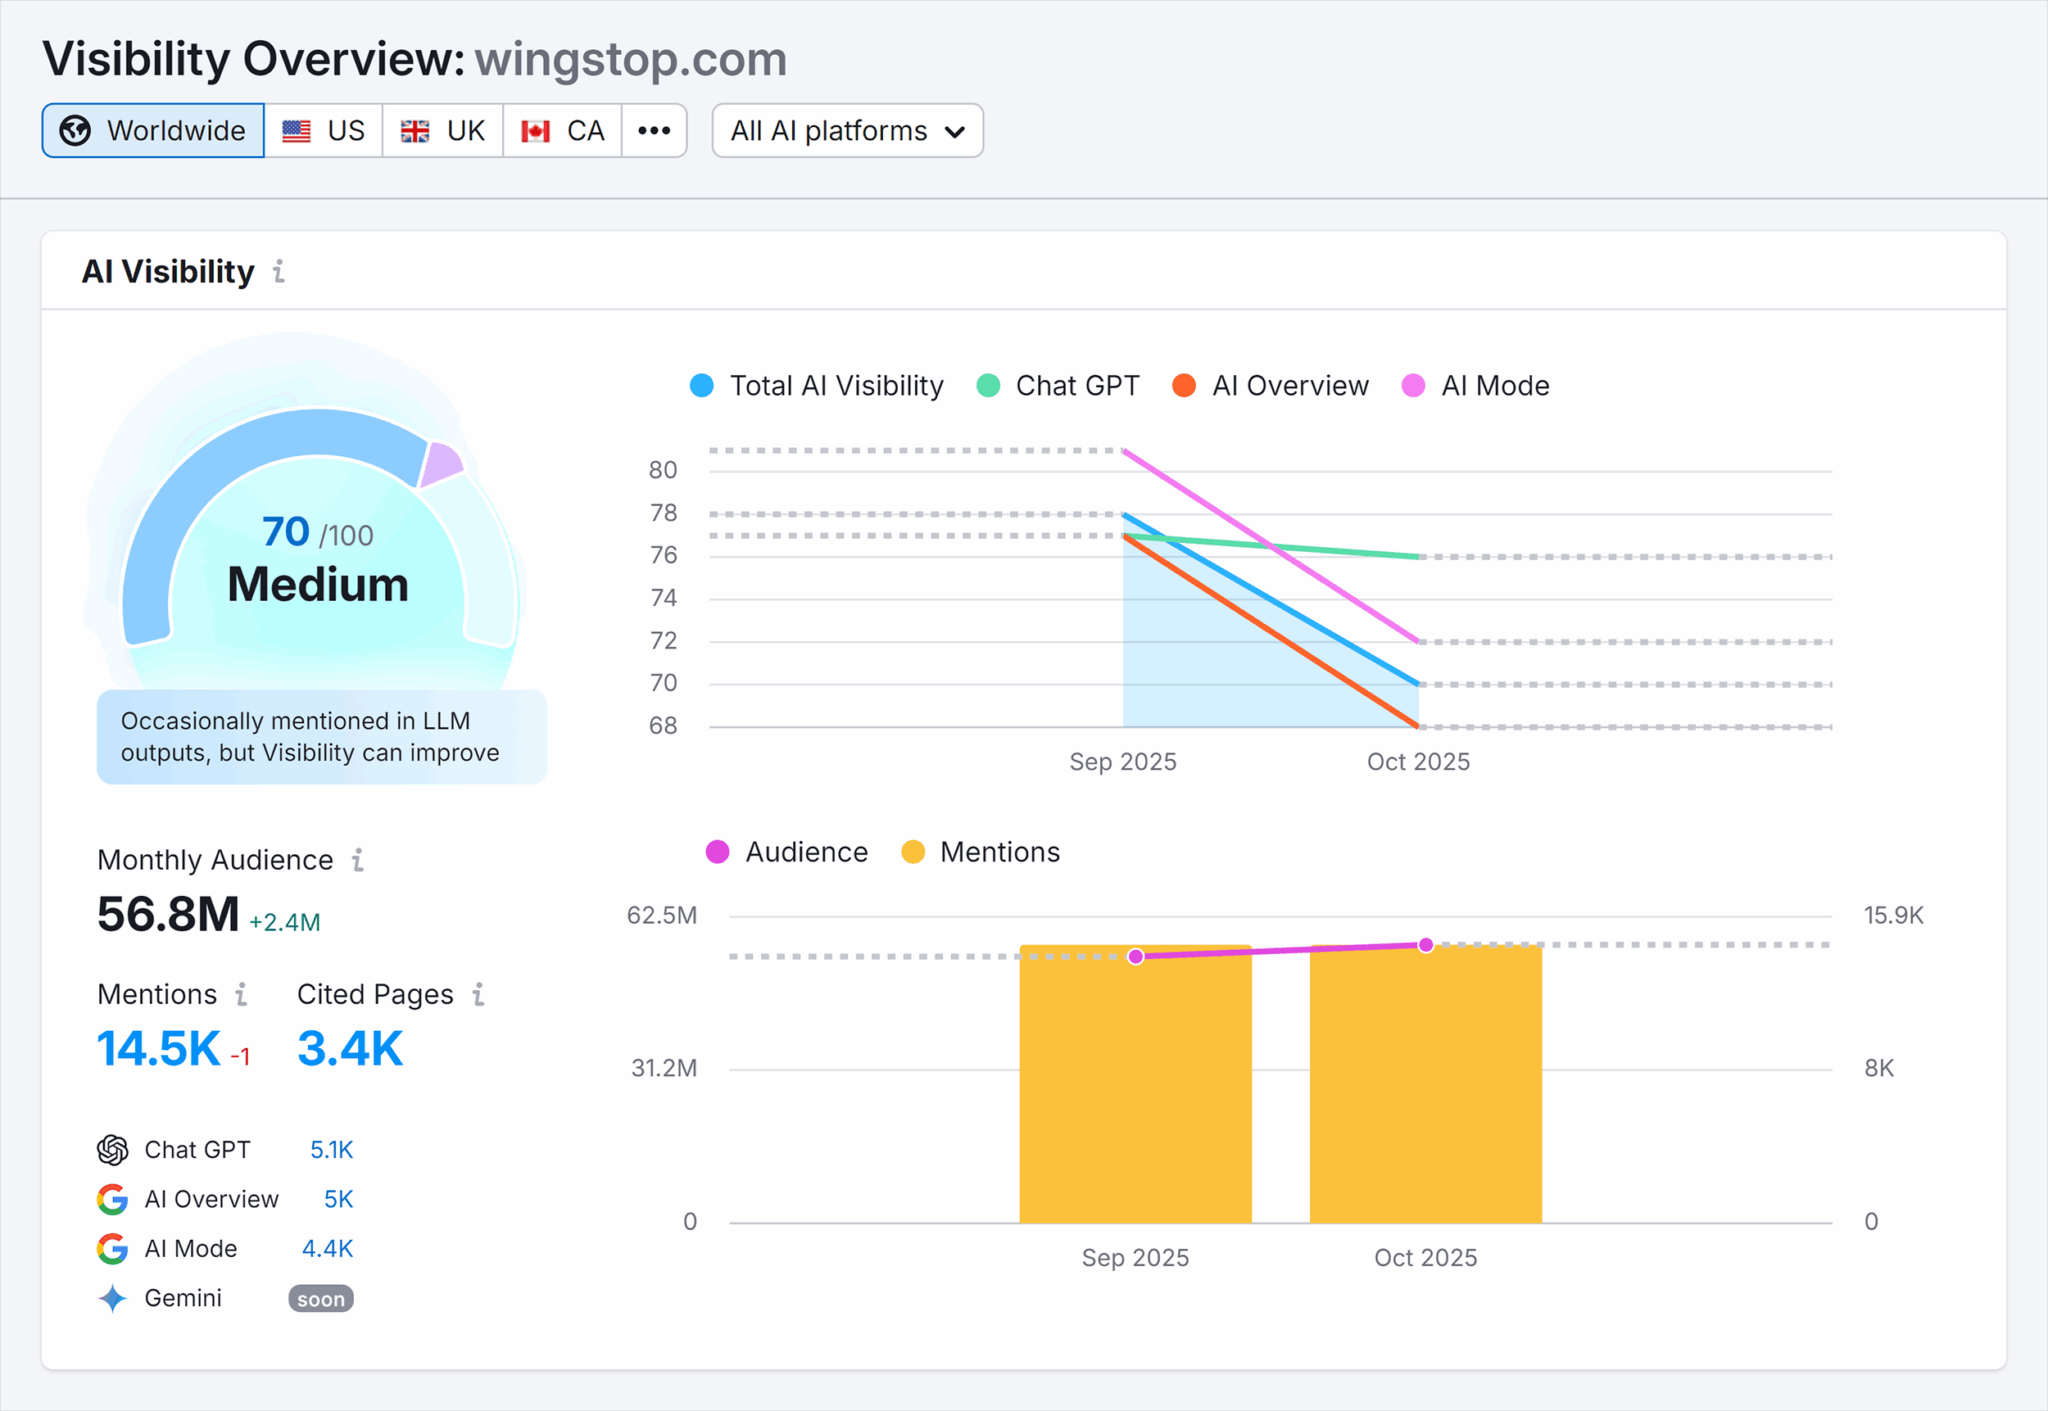
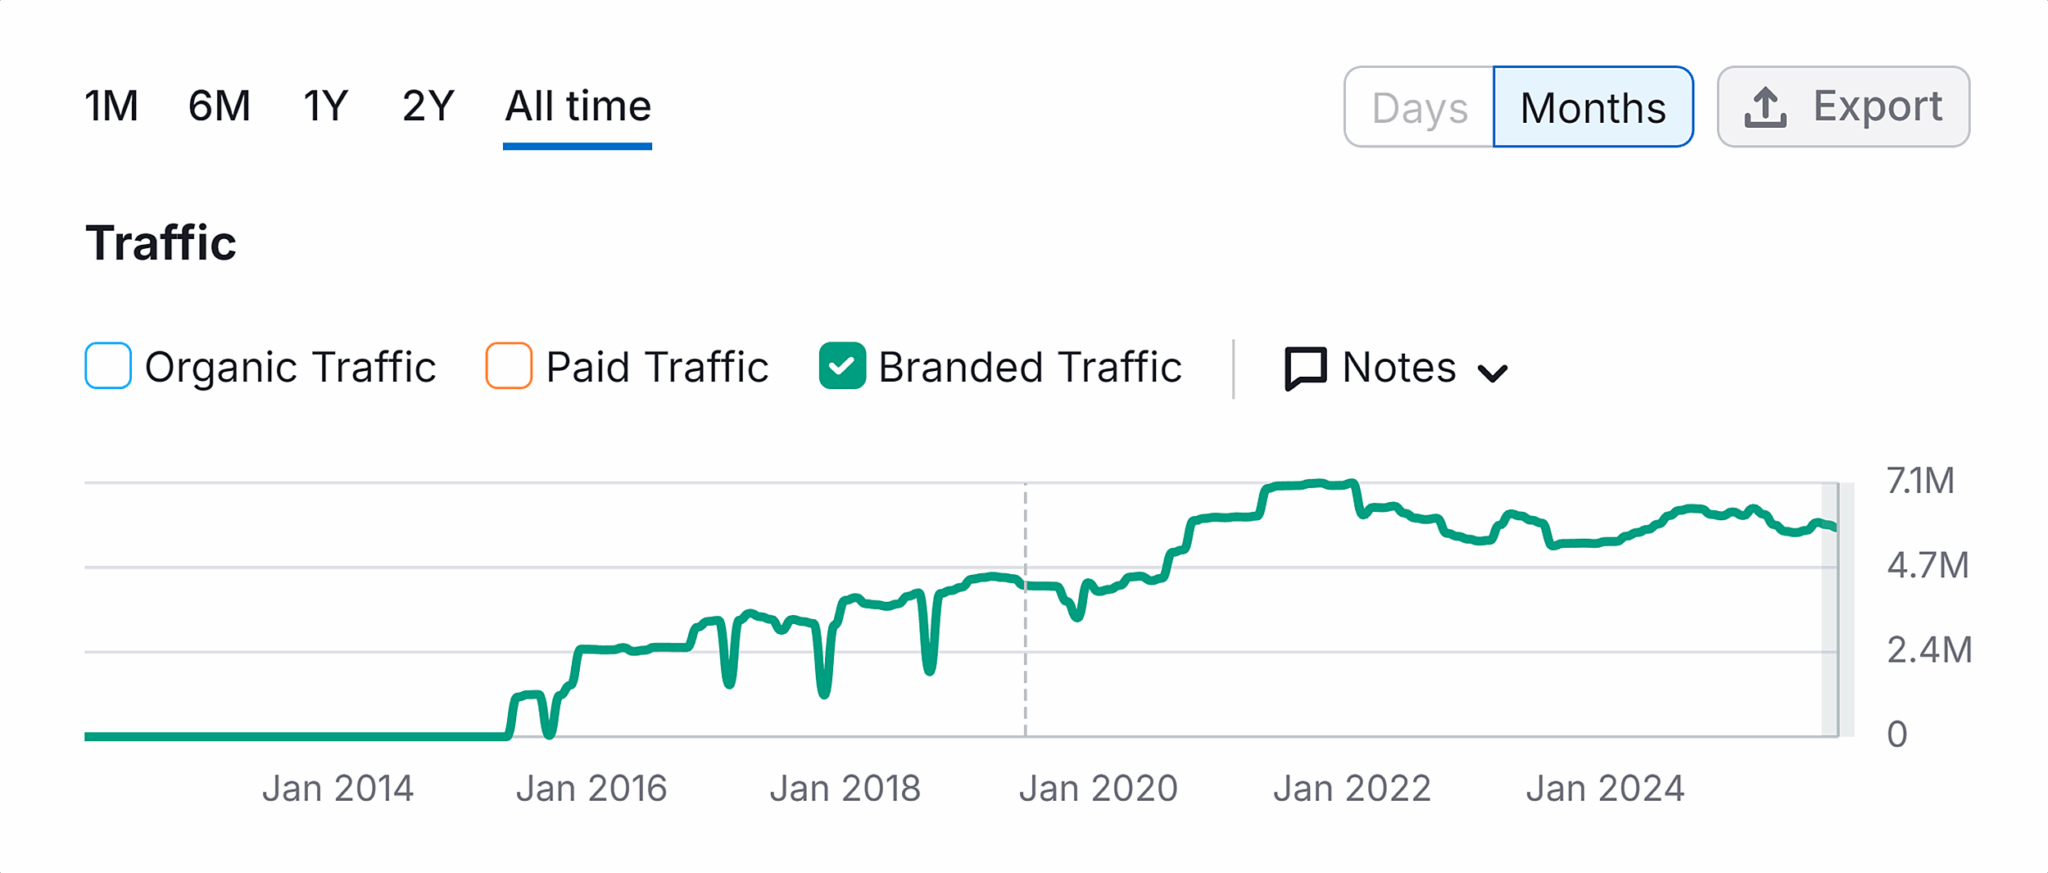
I’ve noticed that brand search provides exceptional insights into LLM performance, offering a rich vein of marketing intelligence. The comparison between two competing chicken wing chains, Buffalo Wild Wings and Wingstop, brightened this understanding for me. While their LLM citations differ, their brand awareness through social media presence offers a clearer picture of market positioning.
Simply examining the branded search traffic showed me how both brands performed similarly on Google, despite their different social media followings. Here lies the heart of utilizing search data creatively to find LLM visibility data strategies.
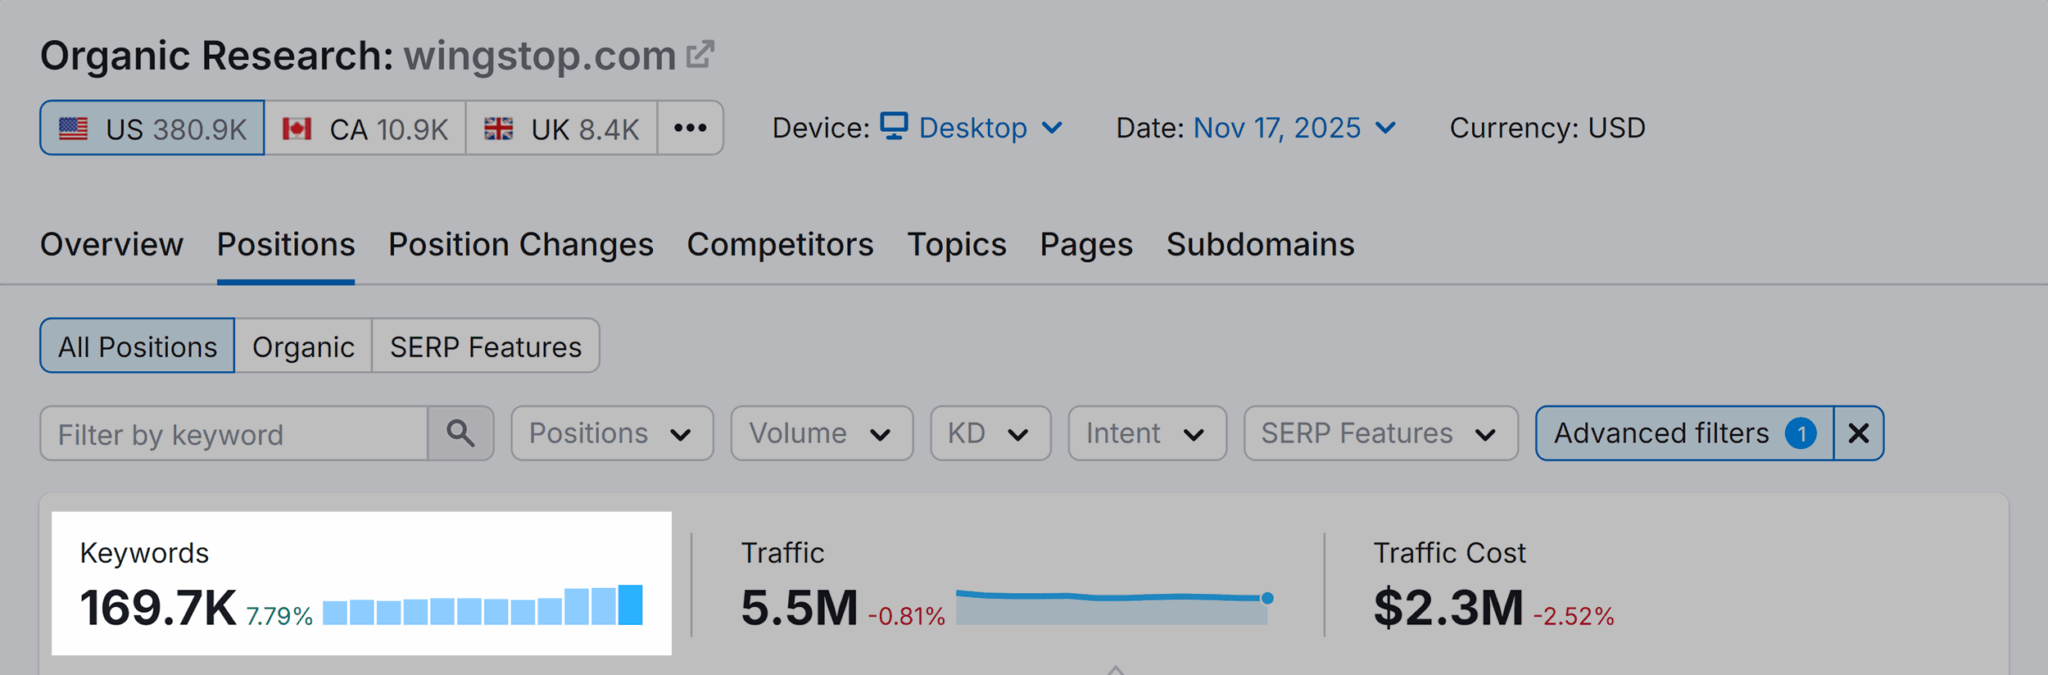
Rather than merely counting traffic, I am now compelled to consider the number of branded keywords involved, providing a sometimes surprising view on brand awareness and diversity. This approach provides a richer understanding of LLM visibility’s impact.
Direct Traffic: My Trusted LLM Data Companion
I’ve come to see direct traffic as an essential part of my LLM data narrative. Far from being a black hole, direct traffic can often indicate brand awareness and affinity, especially when correlated with LLM visibility metrics. Understanding these correlations allows me to paint a clearer picture of AI’s practical impact on consumer behavior.
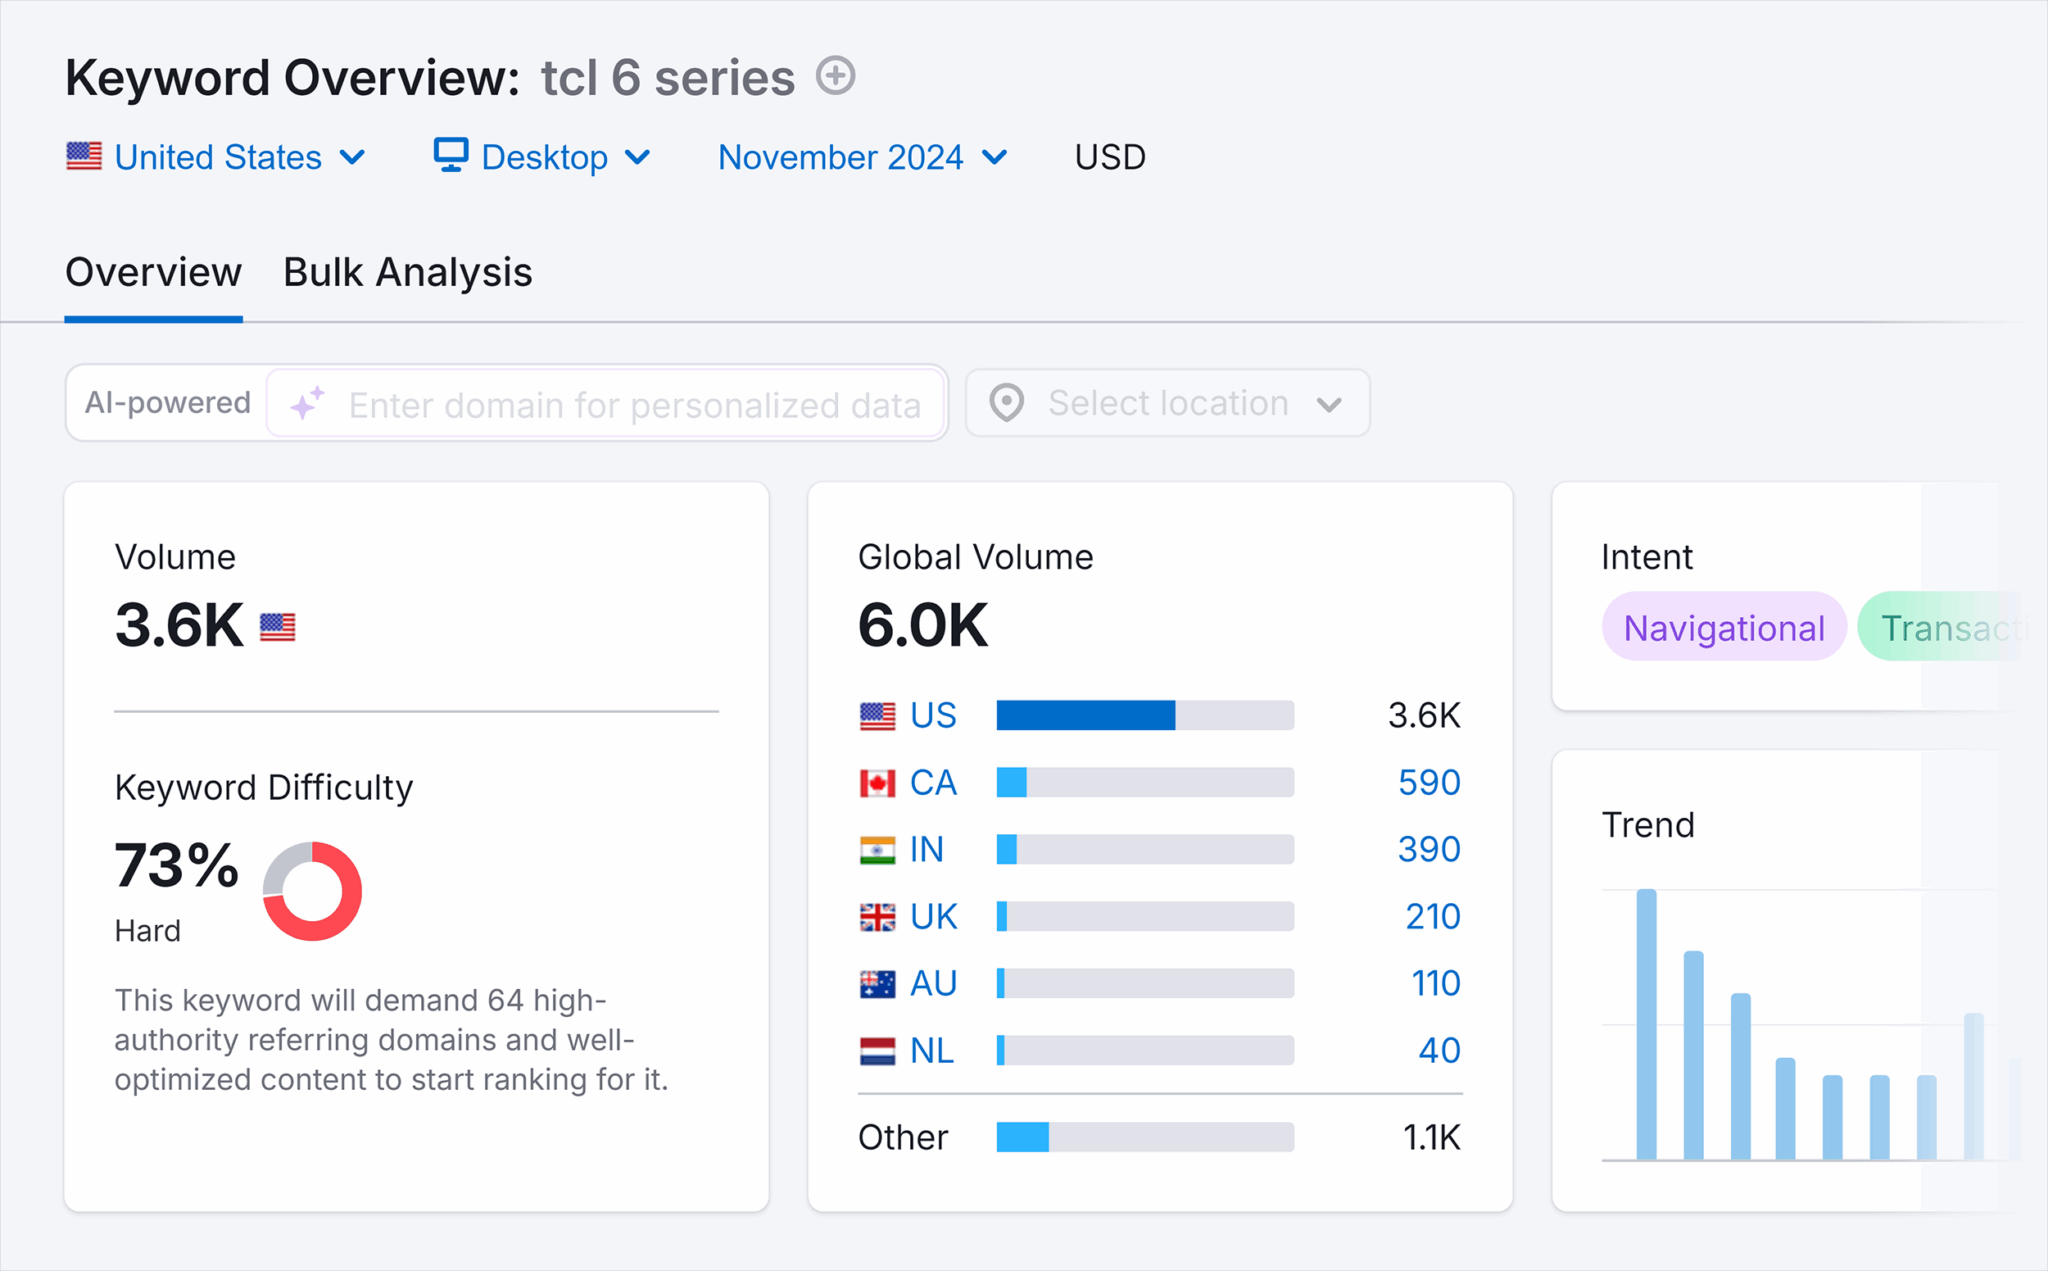
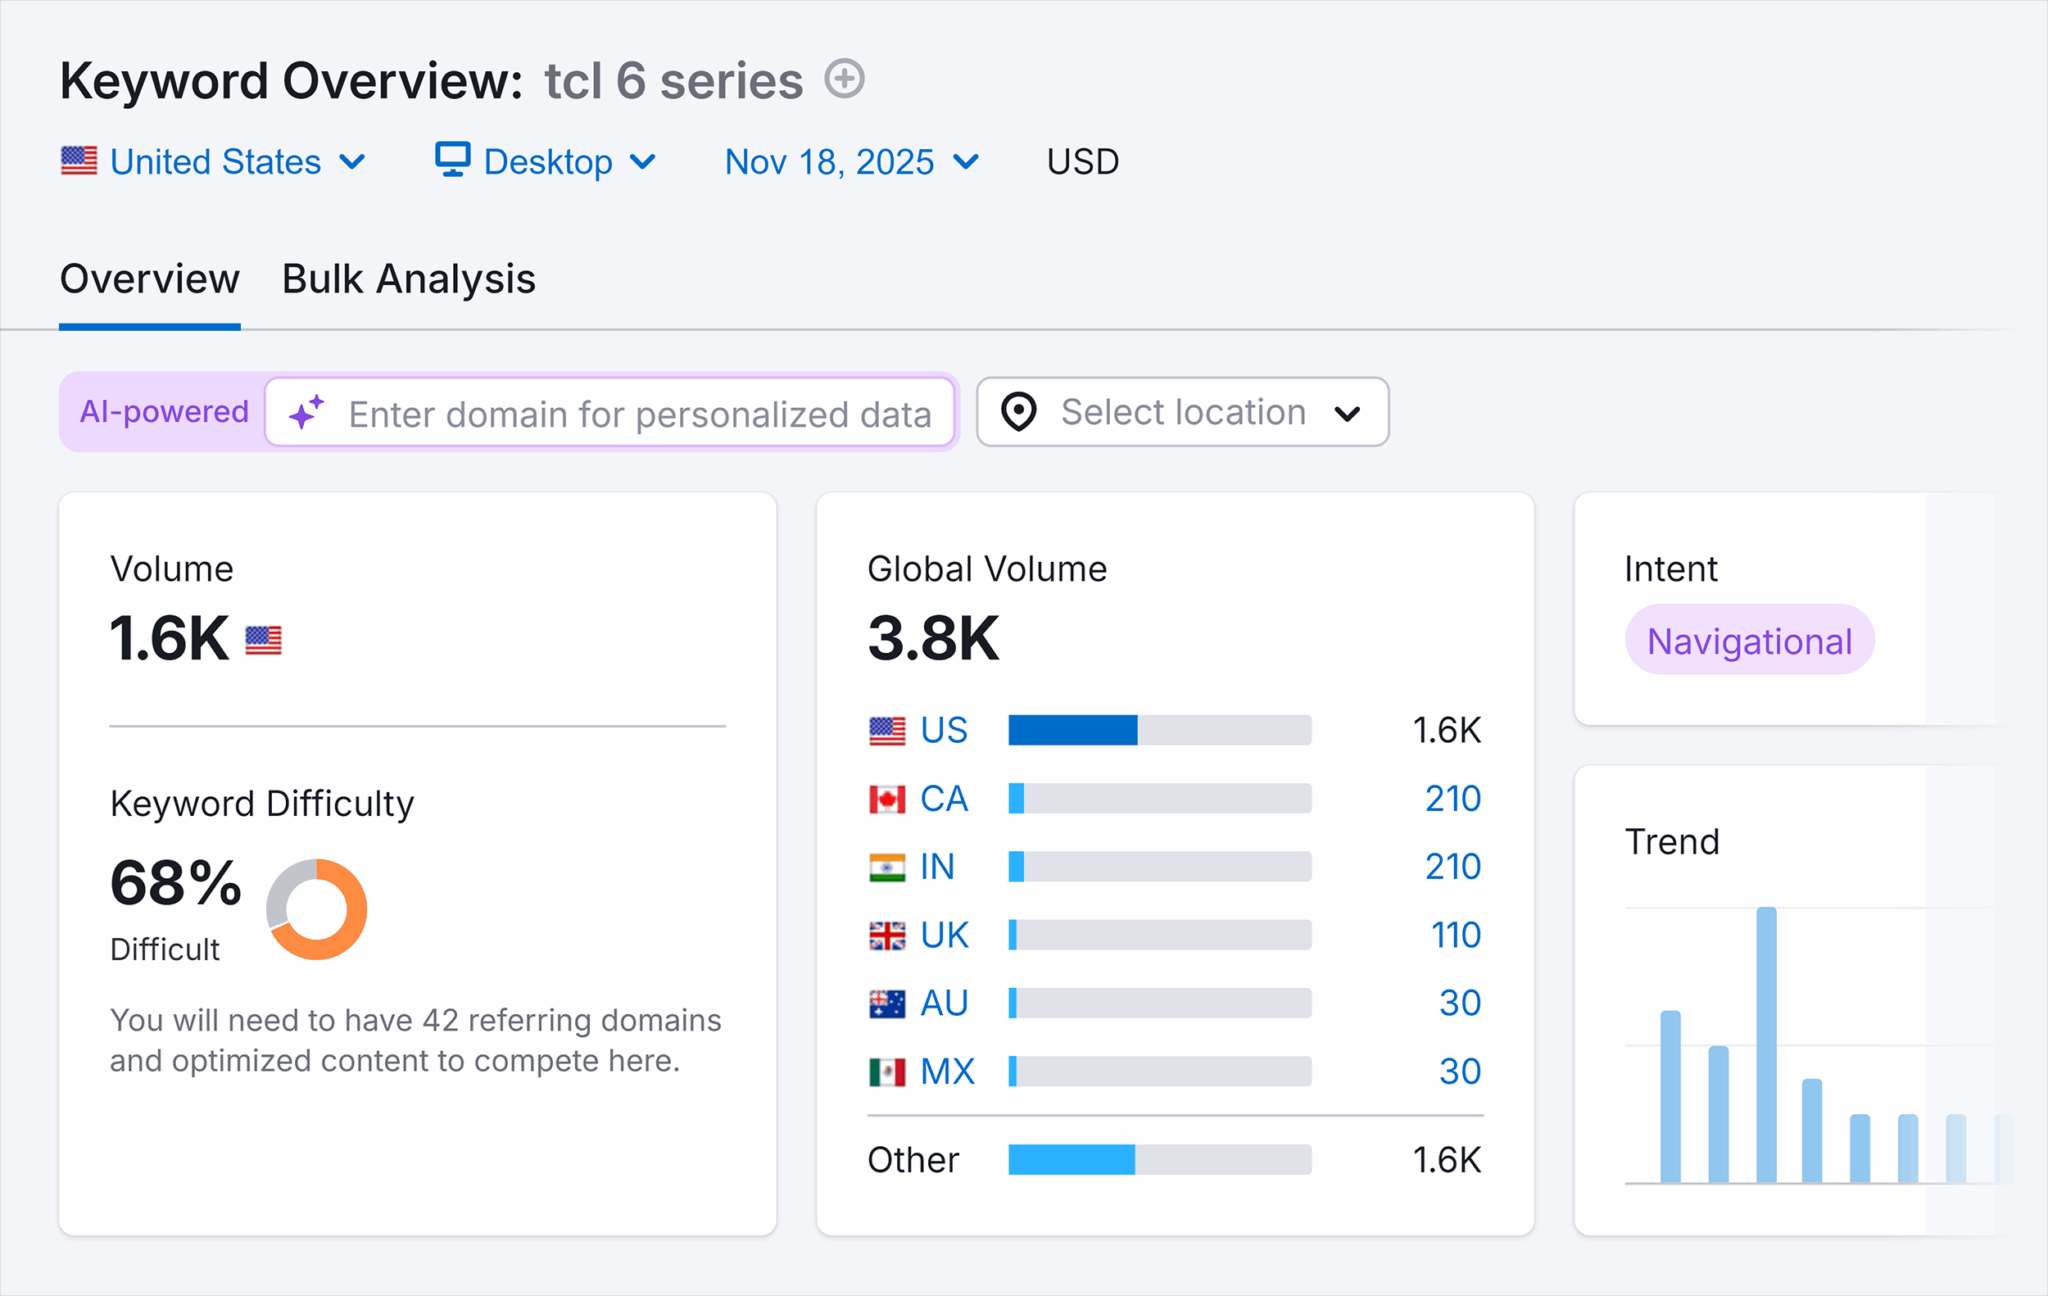
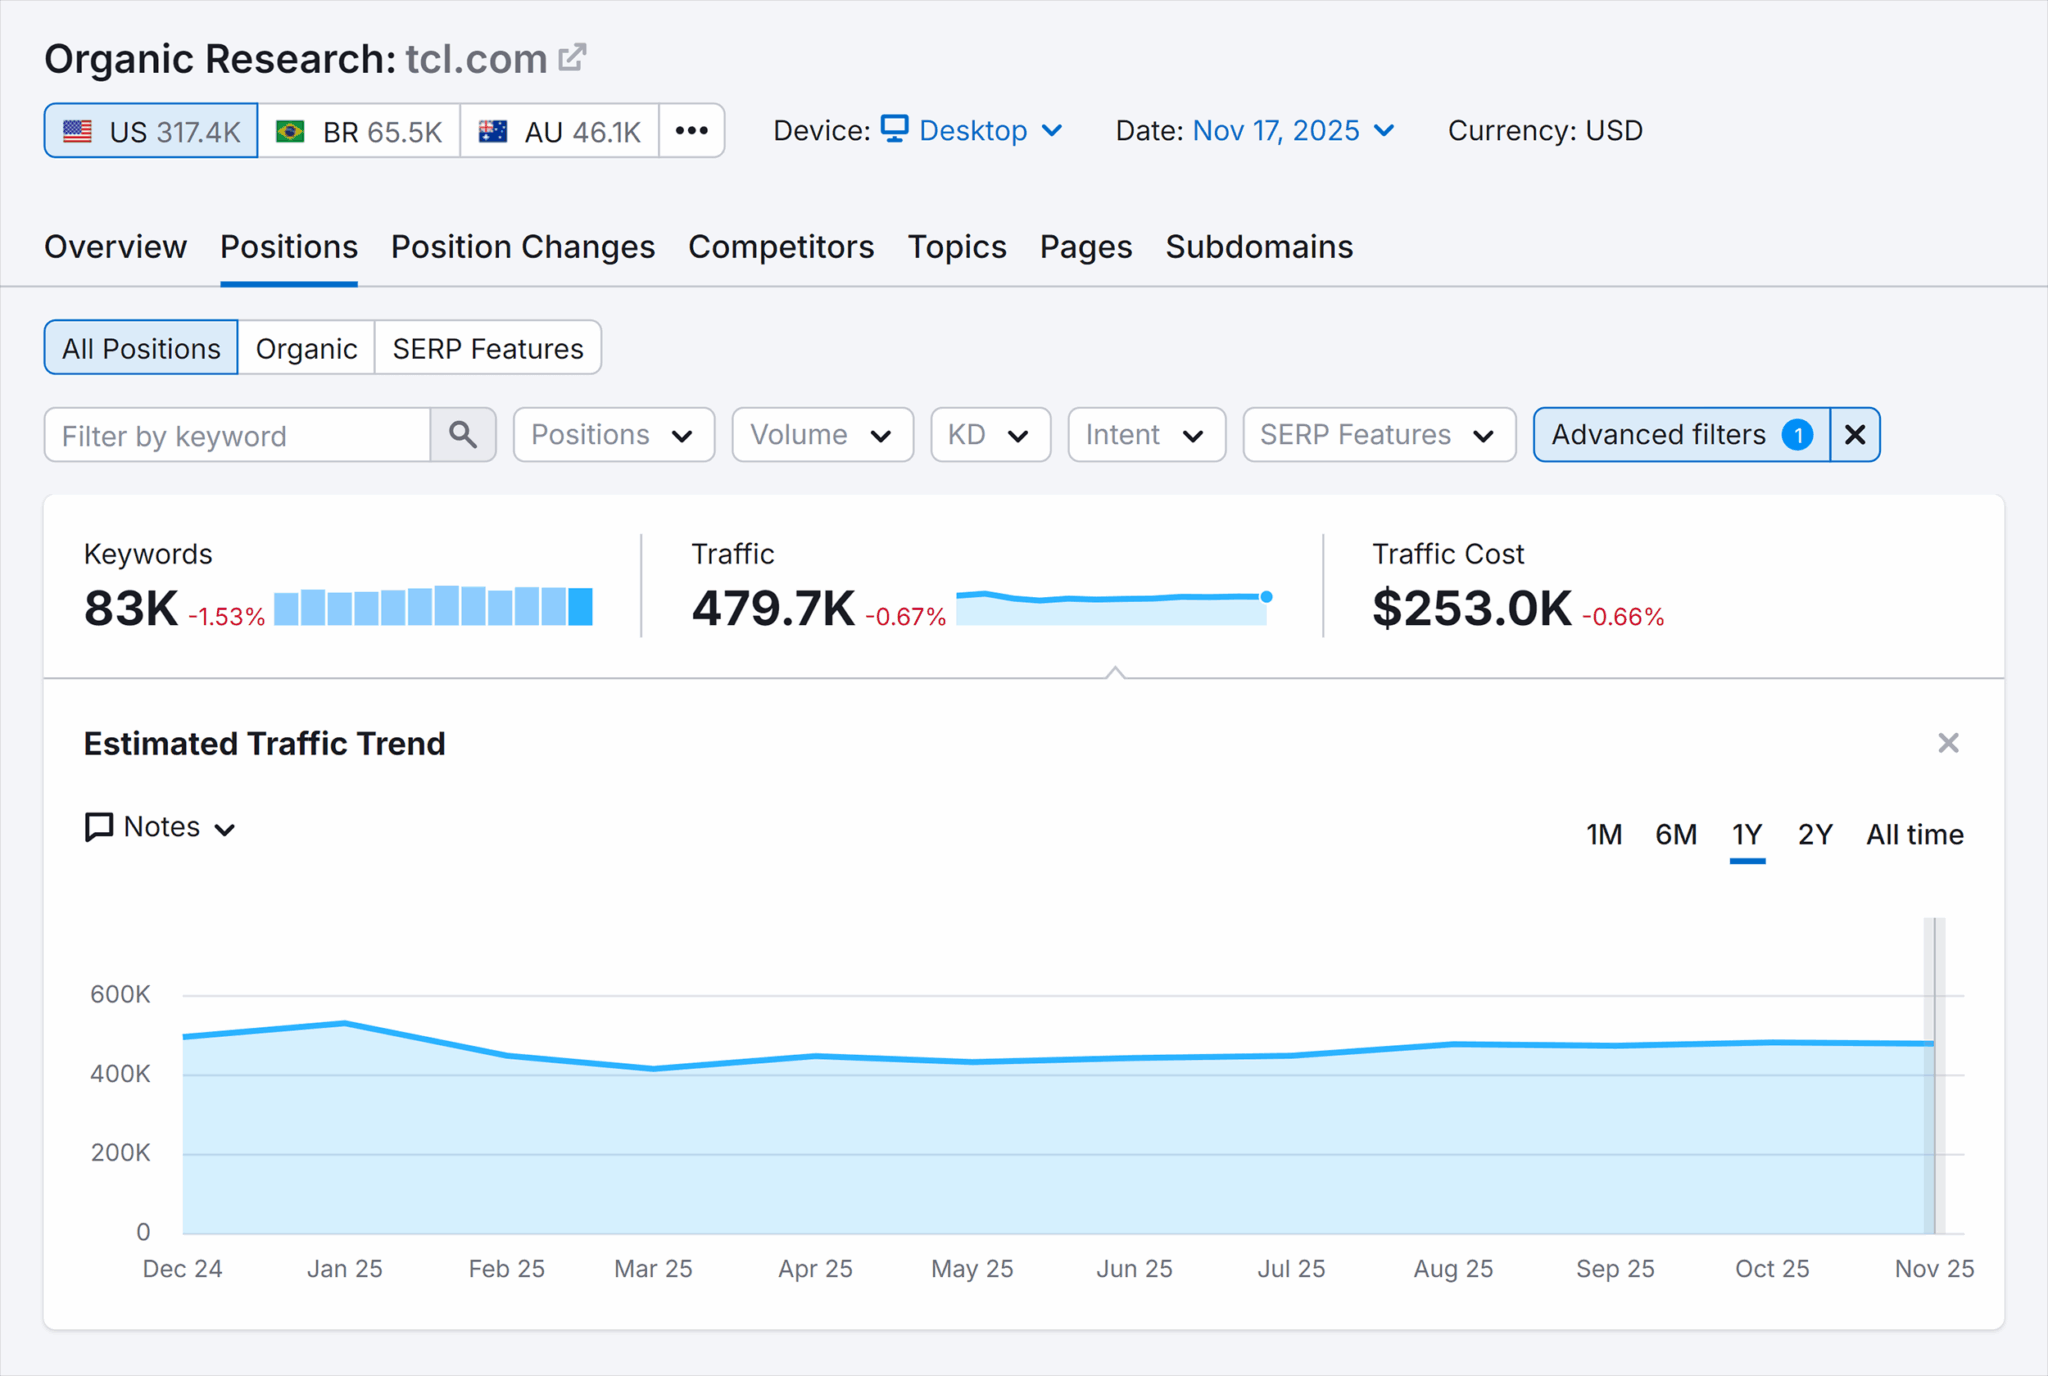
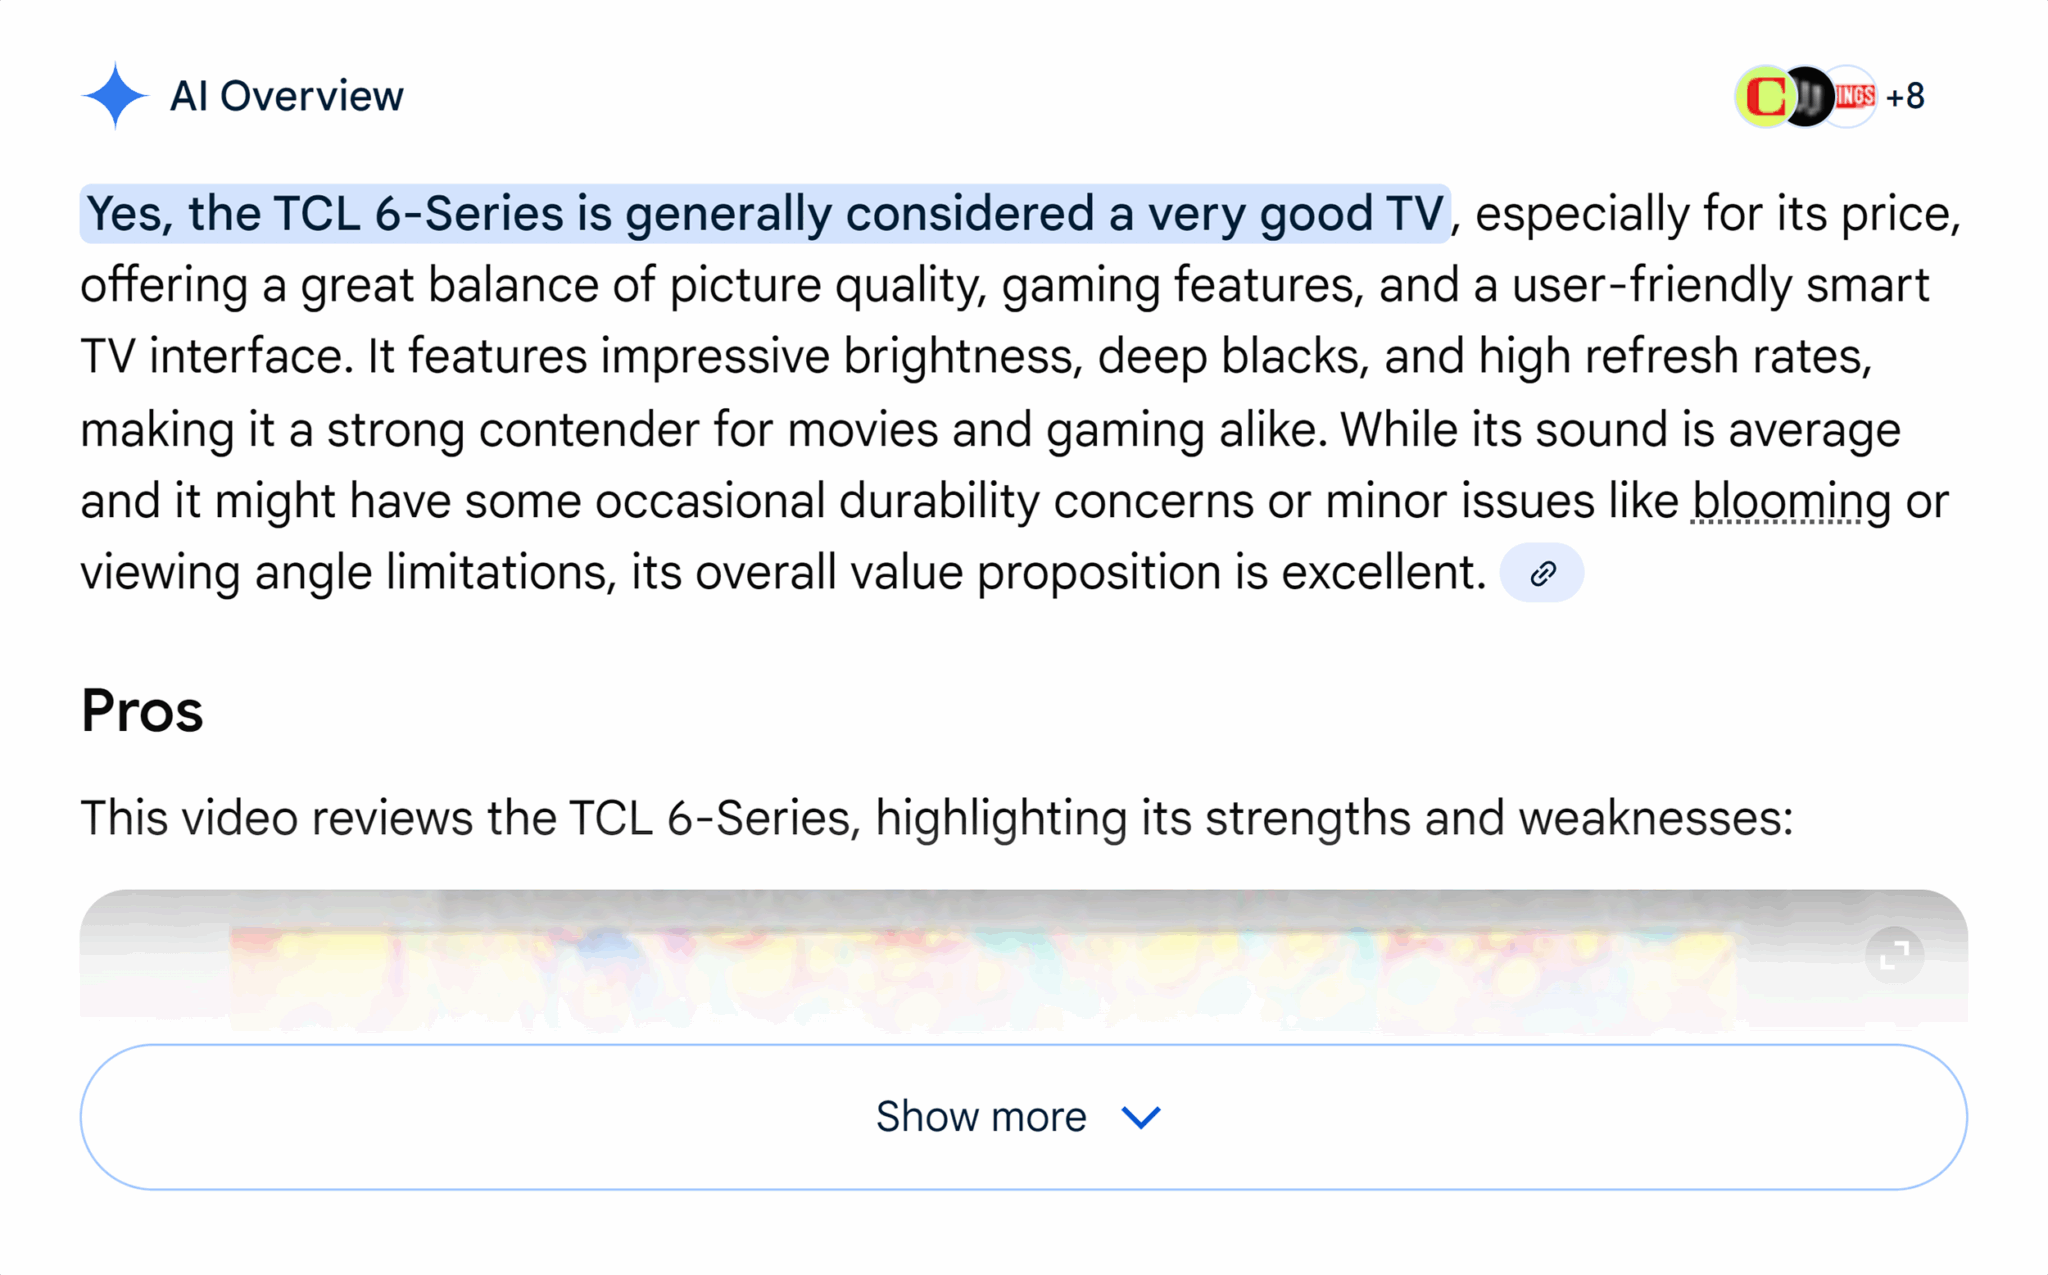
For instance, if I compare LG and TCL, LG’s superior direct traffic and increasing momentum in LLM visibility suggest a tangible AI-driven influence, a possibility I must explore through multi-metric analysis.
Considering various metrics together and identifying shared trends offer insight into how LLM visibility might be affecting my brand’s overall recognition and engagement.
Not Just One Metric: Stitching Together LLM Data Stories
Ultimately, it’s about developing a comprehensive data story from LLM visibility insights. This story goes beyond direct KPIs, utilizing various data sources, such as bounce rates and organic traffic, to add depth and relevance to the narrative. Every piece of performance-focused data stands as testimony to the expertise we can bring to LLM visibility.
Total LLM visibility data, when creatively amalgamated with performance data, can transform insights into actionable strategies that align with pragmatic business objectives, showcasing our value in the AI-driven landscape.
When people ask me how to assess the ROI of their marketing campaigns, I always suggest starting with the customer acquisition cost (CAC). CAC, alongside Customer Lifetime Value (LTV or CLV), is vital in navigating the realm of B2B marketing.
By examining your CAC, you can identify which marketing channels deserve more attention and which aspects of your marketing strategy could use improvement. Benchmarking your CAC against industry standards is key.
The aim of this article is to guide you in recognizing what qualifies as a good CAC in your industry and to encourage you to even explore how your CAC fares compared to related industries.
Calculating Your Customer Acquisition Cost
To calculate your CAC, simply divide your total marketing and sales expenditures by the number of new customers acquired, using the formula below:
Make sure to perform this calculation annually or on a rolling basis to accommodate seasonal customer behavior changes. If your B2B business enjoys consistent year-round sales, consider quarterly CAC analysis to gauge the impact of new initiatives.
Additionally, calculating CAC per channel allows you to compare different marketing strategies effectively.
This report emphasizes B2B CACs. For B2C data, see our B2C Edition.
After determining your CACs, you can measure them against the industry averages shared below.
Average Customer Acquisition Cost (CAC) By Industry
The table below presents average CACs across 29 B2B industries, gathered from client data spanning January 2022 to August 2025. Consider these dataset limitations:
Within each industry, we categorize CAC as Organic or Inorganic. Organic CAC includes mainly SEO and Organic Social, while Inorganic CAC covers PPC / SEM and Paid Social.
Email marketing, events, and other channels are excluded due to insufficient data.
Data from client analytics is anonymous. Organic data leans towards SEO and Inorganic towards PPC / SEM, given our B2B clientele and service focus.
Below are the analysis results:
[Insert table block here]
Average Customer Acquisition Cost (CAC) for SaaS Companies
Our team also reviewed average customer acquisition costs across 22 SaaS industries to determine each industry’s B2B CAC.
SaaS Industry
CAC
[Insert table rows here]
How Your CAC Relates to Customer Lifetime Value
While CAC reflects acquisition costs, Customer Lifetime Value (LTV) reveals the average profit per customer. Calculate LTV by dividing your profit over a chosen period by the number of unique customers, and multiply by their average purchase frequency. Aim for an LTV to CAC ratio of at least 3:1 for optimal financial health.
Keep in mind historical trends and competitor data. A 2:1 LTV to CAC ratio isn’t necessarily negative if you’re seeing improvement over time.
Particularly during new campaigns or long-term strategies, your ratios may fluctuate. For example, if you’ve launched an SEO campaign, results typically appear after 4-6 months.
How to Lower Your CACs
Organic CAC often triumphs over inorganic due to its longevity and skill-based approach. Investing in organic channels yields sustainable results without ongoing cash infusion.
If you’re curious about organic marketing to reduce your CAC, feel free to contact us. Our firm, with multiple U.S. locations, has helped various B2B sectors achieve superior ROI with SEO strategies.
Further Reading
For deeper insights into CAC and its relation to LTV, browse the following resources:
On episode 331 of PPC Live The Podcast, I had an enlightening conversation with Dale Olorenshaw, the Head of Paid Media and Search at StrategiQ. Dale shared a painful yet invaluable experience involving a high-budget test campaign and a critical oversight that taught him powerful lessons.
The costly tale centered around a test campaign with a £15,000 budget. While the campaign saw impressive clicks and engagement, it surprisingly yielded almost no conversions. A month later, the client pointed out that all traffic was directed to the wrong landing page, never reaching the newly built dedicated test page.
Several internal missteps led to this error. Dale bypassed the internal QA process by managing the campaign solo. He shrugged off instincts that flagged something was amiss and, due to seemingly normal top-line metrics, he overlooked a deeper dive into conversion discrepancies. The most humbling moment was realizing the client discovered the oversight first.
Although initial panic ensued, Dale refrained from sending a hasty, emotional response. Instead, he acknowledged the issue, paused to clear his mind, and waited to gather all the facts. The following morning, he approached his account director with full transparency and honesty, declaring, “I’ve messed up.”
StrategiQ stood firmly behind Dale, focusing on solutions rather than blame. They managed to recover part of the wasted budget, provided extra work at no additional cost, and offered discounted fees for the next project phase. Once relaunched correctly, the client relationship remained intact.
This experience profoundly impacted Dale’s professional approach. He now adheres strictly to QA processes, trusts his instincts when numbers seem off, and promotes team accountability with second opinions and checks, acknowledging that seniority doesn’t shield from human errors.
Dale also highlighted a common PPC issue he continues to observe: the overcrowding of Responsive Search Ads. Google’s push for numerous headlines and descriptions can saturate ads with small budgets, leading to insufficient data for meaningful insights. His advice is to streamline assets for clarity and quality.
For Dale, discussing mistakes openly is crucial. He argues that the PPC community needs to normalize these conversations since newcomers may only witness success stories online and equate mistakes with incompetence. Sharing real experiences shows that growth often springs from problem-solving.
In closing, Dale offers leadership advice on fostering a supportive culture. Encouraging honesty, removing blame, and focusing on collective problem-solving ensures that mistakes are seen as learning opportunities rather than failures.
If there’s one takeaway, let it be this: Don’t react impulsively, stay honest, and treat client funds with the utmost care as if they were your own.
Have you ever wondered how to make your products stand out in Google AI Shopping and its AI Mode? I’ve discovered that optimizing feeds, utilizing schema, improving imagery, and crafting conversational Product Detail Page (PDP) content are key strategies to enhance visibility.
You are not choosing between agencies that all sell the same service. You are choosing which team can understand a technical product, translate it into real search demand, earn access to your subject-matter experts, and connect visibility to qualified opportunities. A polished pitch can conceal weaknesses in any one of those areas.
Understand the agency models before comparing names
Industrial SEO, manufacturing SEO, and B2B SEO are loose labels. Two agencies may use the same label while offering very different capabilities. One may excel at technical websites and product catalogs. Another may be a content operation with light technical support. A third may coordinate SEO with paid media, conversion work, and a website redesign.
Organize the market by operating model first. This prevents you from rejecting a capable specialist for lacking services you do not need, or hiring a broad agency whose industrial expertise exists only in its sales presentation.
Agency model
Best suited to
Evidence to request
Main risk to test
Industrial SEO specialist
Technical products, application-led demand, specification-heavy buying, and close collaboration with engineers or product teams
Query maps, technical briefs, product architecture work, and examples of turning expert knowledge into useful pages
A fixed industrial playbook that ignores your route to market, margins, capacity, or buying committee
B2B SEO and content agency
Markets where education, problem awareness, comparison, and category discovery create demand before an RFQ
Evidence connecting informational content to product evaluation, conversion paths, and qualified pipeline
Broad thought leadership that attracts readers but never helps a buyer select a product or supplier
Technical SEO consultancy
Large catalogs, faceted navigation, JavaScript problems, migrations, international sites, duplicate pages, or persistent indexing issues
Prioritized technical backlogs, implementation specifications, validation methods, and developer collaboration
A technically cleaner site with no plan for demand, content, authority, or lead quality
Full-service digital agency
Organizations that need SEO coordinated with paid search, analytics, conversion work, creative, and website development
Named SEO ownership, channel-specific deliverables, reporting boundaries, and examples of cross-channel decision-making
SEO being bundled into a larger retainer without enough specialist attention
Consultant and internal-team hybrid
Companies that already have writers, developers, analysts, and subject-matter experts but need direction and governance
Decision frameworks, templates, training materials, review processes, and a realistic division of responsibilities
A strategy that depends on internal capacity your team does not actually have
These models are not a ranking. The right one depends on the bottleneck. If search engines cannot reliably crawl and interpret your catalog, a content-heavy engagement will not solve the root problem. If your site is technically sound but says little beyond product specifications, another audit may only document work you already know is needed.
Diagnose that bottleneck before building a shortlist. Ask whether the constraint is discoverability, page usefulness, technical access, industry authority, conversion, measurement, or internal execution. If several are involved, decide which one has to move first.
Define the commercial job before requesting an SEO plan
Write a brief around revenue, not rankings
An agency cannot prioritize intelligently if the brief is simply to increase organic traffic. It needs to know which product families matter, where you can sell, what a qualified inquiry looks like, and which demand is commercially useless.
Economic context: which offerings are strategic, constrained by capacity, dependent on distributors, or poor fits despite apparent search demand.
Conversion events: RFQs, specification requests, distributor searches, sample requests, calls, CAD or technical-document downloads, and other actions that matter to your sales process.
Qualification rules: the characteristics that distinguish a viable opportunity from a student, job seeker, consumer, existing customer, or out-of-market inquiry.
Operational constraints: developer availability, legal or regulatory review, subject-matter expert access, publishing permissions, and analytics limitations.
Business measurement: the CRM stages, opportunity fields, and revenue signals that should eventually connect search activity to commercial outcomes.
A useful one-sentence brief follows this pattern: Increase qualified discovery and inquiries for [priority offerings] among [buyer groups] in [markets], while excluding [poor-fit demand], with progress judged by [commercial signals].
This sentence forces an important distinction. Search volume describes attention; it does not establish value. An industrial term can look attractive while referring to the wrong material, tolerance, application, geography, order size, or buyer. The agency should investigate those differences before proposing a publishing calendar.
Map searches to the decisions a buyer must make
Industrial demand rarely fits into a simple split between informational keywords and product keywords. A buyer may begin with a failure mode, move through an application or process, compare materials or capabilities, verify specifications, and then evaluate suppliers. Different pages should support different parts of that path.
Problem and application searches need pages that explain conditions, constraints, and suitable approaches without forcing a premature product pitch.
Category and capability searches need clear product-family or service pages that define fit, differentiation, limitations, and next steps.
Specification, material, model, and part searches need accurate technical pages with unambiguous attributes, relationships, and supporting documents.
Supplier and location searches need credible evidence about service areas, facilities, lead handling, certifications, distribution, and relevant capabilities.
Comparison and alternative searches need honest selection criteria, trade-offs, compatibility details, and reasons to rule an option in or out.
Ask each agency to map a representative offering through that path during discovery. You are not testing whether its team already knows every technical detail. You are testing whether it asks the questions needed to learn, distinguishes buyer intent from keyword similarity, and can turn the result into page-level decisions.
Use a six-part scorecard to test real capability
A useful scorecard separates capabilities that agencies often blend together in a proposal. Score the evidence, not the confidence of the presentation. If a capability matters to your brief, require an artifact, a worked example, or a clear operating process.
Commercial prioritization. Ask how the agency would choose among product families, applications, buyer roles, and markets. A strong answer requests margin, capacity, sales, qualification, and territory inputs before committing to targets. A weak answer treats search volume or keyword difficulty as the entire business case.
Industrial fluency. Ask the team to trace a product from the problem it solves through its specifications, alternatives, decision-makers, and conversion path. Strong teams separate terms that look similar but imply different applications or buyer needs. They also identify where an engineer, operator, procurement lead, distributor, or executive may need different evidence. Be wary of an agency that repeats your terminology without testing what it means.
Technical search execution. Ask how the agency will evaluate crawling, indexation, internal linking, canonicalization, faceted navigation, duplicate content, PDFs, JavaScript rendering, structured data, site speed, international targeting, and migration risk where relevant. The expected output should be a prioritized implementation backlog with owners, dependencies, and validation steps. A long issue inventory without impact or sequence is not a strategy.
Expert-led content operations. Ask who interviews subject-matter experts, drafts briefs, verifies technical claims, obtains images or diagrams, manages approvals, and updates aging pages. Inspect a sample brief and an edited deliverable. The process should preserve technical nuance while making the page understandable to the intended buyer. If the plan assumes your engineers will write finished copy on demand, execution will probably stall.
Relevant authority building. Ask how the agency identifies credible places where your expertise, data, tools, or resources deserve mention. Good answers are grounded in trade relationships, useful assets, professional communities, distributors, associations, partners, and publications relevant to the market. Opaque backlink packages and generic authority scores do not show that a link will be contextually appropriate or commercially useful.
Measurement and search-change readiness. Ask how reporting will connect Google Search Console, site analytics, forms, calls, CRM stages, and revenue data without pretending attribution is perfect. Then test the agency’s approach to AEO and generative engine optimization. It should make important facts clear, visible, crawlable, internally connected, and supported by accurate JSON-LD where appropriate. Structured data must describe claims that users can verify on the page; it cannot compensate for missing evidence. Require the agency to distinguish established SEO work from experiments in AI visibility, citations, and brand mentions.
The final capability deserves particular scrutiny. Adding AI language to a conventional proposal is easy. A serious plan identifies what will change on the site, how entities and relationships will become clearer, which technical or editorial assumptions are being tested, and how the team will monitor outcomes without promising control over an external model’s answer.
Weight the scorecard according to your actual constraint. A catalog with severe indexation problems should place more weight on technical implementation. A technically healthy site with thin product explanations should emphasize industrial fluency and content operations. Do not average away a critical failure: an agency that cannot support your primary bottleneck is not the right choice simply because it scores well elsewhere.
Normalize proposals, interrogate proof, and protect the handoff
Make every proposal answer the same questions
Agency proposals are hard to compare because similar labels can conceal different amounts of work. One content deliverable might mean a title and keyword list; another might include expert interviews, technical diagrams, writing, review, publishing, internal links, schema, and measurement.
Create a comparison sheet with these fields:
The business outcome and search problem being addressed.
The exact deliverable, including what is and is not included.
The agency role, client role, and approval owner.
The systems and access required.
The implementation owner for technical recommendations.
The reporting method and commercial signals being monitored.
The assumptions that could change scope, sequence, or cost.
Ownership of content, data, creative assets, accounts, dashboards, and documentation at the end of the engagement.
That last field is not administrative trivia. If the agency controls accounts, tracking infrastructure, domains, content, or essential documentation, switching providers can create operational and data risk. Keep core business assets in accounts your company owns, with access granted to the agency.
Ask for proof that reveals the mechanism
A chart moving upward is not enough. It may combine branded and non-branded demand, hide changes in paid activity, reflect a website launch, or show traffic that never became qualified pipeline. Confidentiality may limit what an agency can reveal, but it should still be able to explain its reasoning and show sanitized work.
Use these questions to inspect a case example:
What was the original commercial and search problem?
Which pages, templates, technical systems, or content processes changed?
What did the agency deliver, and what did the client implement?
Which results were branded, non-branded, local, product-led, or informational?
How did the team assess inquiry quality rather than form volume alone?
What evidence connects the work to the result, and what other explanations remain possible?
What would the agency do differently if the same constraints appeared in our organization?
Direct artifacts usually tell you more than awards or directory positions. Request a sample technical ticket, query map, content brief, reporting view, editorial workflow, or decision memo. You are looking for whether the agency can convert analysis into work that your developers, marketers, engineers, and sales team can use.
Treat these promises as decision-level warnings
Guaranteed rankings or visibility. An agency can control its work, not search-engine or AI-system placement. Replace the guarantee with commitments about deliverables, quality controls, implementation support, and transparent measurement.
A strategy built entirely from high-volume keywords. Volume does not account for product fit, margin, capacity, geography, or lead quality. Require a commercial prioritization layer.
Large-scale AI publishing without expert review. Industrial errors can affect credibility, sales conversations, and potentially product use. Require named review ownership, claim verification, and a correction process before scaling output.
An unexplained link package. If the agency cannot describe relevance, editorial standards, acquisition methods, and ownership, you cannot evaluate reputational risk.
Reporting limited to sessions, impressions, and rankings. These are diagnostic signals, not the complete business outcome. Require a plan for connecting search activity to qualified actions and CRM data where feasible.
A redesign or migration proposed before diagnosis. Moving URLs, templates, navigation, and content can create avoidable visibility loss. Preserve a crawlable inventory, redirects, measurement, and validation steps before approving an irreversible launch.
A plan that assumes unlimited access to your experts. Ask how the agency will batch questions, prepare interviews, manage reviews, and proceed when an expert is unavailable.
Begin with a diagnostic commitment when uncertainty is high
If neither side understands the full scope, start with a defined diagnostic phase rather than pretending the annual roadmap is already known. That phase can produce an access inventory, measurement baseline, demand map, technical priorities, representative content brief, implementation backlog, and division of responsibilities.
Define the outputs before signing. A diagnostic should reduce uncertainty and support a go, revise, or stop decision. It should not become an open-ended audit that repeats known issues without establishing what happens next.
Before the larger engagement begins, name an internal owner, a technical implementation contact, a sales or CRM contact, and the subject-matter experts who can validate priority topics. Agree on how decisions are logged and what happens when approvals stall. In industrial SEO, the agency’s plan is only one part of the operating system; your access and review process determine whether that plan can leave the slide deck.
Key takeaways
Choose an agency model that matches the bottleneck: technical access, content depth, industry authority, measurement, or internal execution.
Give every candidate the same commercial brief, including priority offerings, markets, qualification rules, conversion events, and operational constraints.
Test commercial prioritization, industrial fluency, technical execution, expert-led content, authority building, and measurement as separate capabilities.
Require artifacts and causal explanations. Traffic charts, awards, testimonials, and confident presentations are supporting evidence, not proof of fit.
Evaluate AEO and GEO through concrete site changes, accurate visible facts, retrieval-friendly content, appropriate JSON-LD, and clearly labeled experiments.
Keep core accounts, data, content, and documentation under your ownership so a future handoff does not endanger continuity.
Your next move is to choose one commercially important product family and write the brief around it. Give that same brief to a small shortlist, ask each agency to map the buyer’s search path, and score the evidence with the same criteria. The differences between a sector label and a workable industrial SEO partnership will become visible quickly.
If you manage paid search, SEO, or both, Google AI Mode puts you in an awkward position. Ads are beginning to appear inside generated answers, yet you do not have the rollout details or clean reporting needed to treat AI Mode as a mature channel.
You can still prepare without rebuilding your search program around an experiment. The useful work is to identify the complex decisions that matter to your customers, connect each decision to a clear answer and landing experience, and separate confirmed performance data from assumptions about AI Mode.
It does not establish the size of the audience, the range of eligible campaigns, the auction mechanics, the controls advertisers will receive, or the performance you should expect. Repeated screenshots demonstrate availability, not reach or return on ad spend. Do not use them as a forecast.
This distinction matters. An optional tab creates a new destination for a subset of users. Automatic routing would change the path for users who believe they are conducting an ordinary search. Your preparation should be useful under either scenario.
Key takeaways
Treat AI Mode as an emerging surface inside Google Search, not as a separately measurable channel you can already manage with confidence.
Organize your strategy around complex customer tasks, because those are the searches most plausibly affected by direct routing into an AI experience.
Connect the generated answer, organic page, ad message, landing page, and conversion action around the same user decision.
Keep reported, observed, and inferred evidence separate. A screenshot can confirm that an ad appeared, but it cannot prove incremental traffic or revenue.
Use bounded tests with explicit spending and lead-quality limits. Do not make a broad budget shift before eligibility, controls, and reporting are clear.
Map the complex decisions behind your valuable searches
AI Mode matters because a generated response can combine discovery, clarification, and evaluation in the same interaction. A conventional keyword plan may tell you what phrase brought someone to Google, but it often misses the decision that person is trying to complete.
Start with the commercial decisions that deserve visibility. Useful groups include urgent service needs, comparisons with several constraints, troubleshooting that may lead to a purchase, and planning questions with multiple steps. These are planning categories, not claims about Google’s targeting rules.
Prioritize a group when it has meaningful business value, requires more explanation than a short product description can provide, and has a credible next action. A complex query with no relevant offer should not receive budget merely because it looks suited to AI Mode.
Use a query-to-answer worksheet
For each priority query group, document the following fields:
User task: the decision the person wants to complete, expressed without marketing language.
Required context: the constraints that could change the answer, such as location, use case, urgency, compatibility, company size, or budget sensitivity.
Direct answer: the shortest accurate response your page can support.
Decision criteria: the factors a buyer should evaluate before choosing an option.
Evidence: product specifications, service boundaries, policies, demonstrations, or other verifiable support for your claims.
Next action: the appropriate conversion for that stage, such as checking availability, viewing a relevant product, requesting an assessment, or starting a purchase.
Destination: the page that continues the decision without forcing the visitor to restart on a generic homepage.
Consider a hypothetical search about choosing payroll software for a multi-location company with hourly employees. The underlying task is not merely finding payroll software. The person needs to know whether a product fits distributed locations, hourly work, administration requirements, and implementation constraints. A useful destination addresses those factors directly, shows what can be verified, and offers a next step suited to an evaluator. A generic product page that repeats a broad value proposition leaves the actual decision unresolved.
This worksheet gives paid and organic teams a shared unit of work. SEO can build the complete explanation. Paid search can match the commercial intent and lead to the right destination. Conversion teams can remove friction from the next action. You are no longer optimizing three disconnected assets against the same keyword list.
Build one coherent journey across AI, organic, and paid results
You do not need a separate species of content called “AI content.” You need pages whose meaning, audience, evidence, and next step are easy to identify. That improves the material available to an answer system while preserving its usefulness for people who arrive through a conventional result or an ad.
Make the organic page answer-ready
Use a descriptive heading for the actual decision. A vague heading such as “Solutions” hides the subject from readers and machines alike.
Give the direct answer before expanding into criteria, alternatives, and caveats. Do not make the visitor excavate a recommendation from a long introduction.
Name the relevant entity, product, audience, location, and limitations precisely. Pronouns and slogans are weak substitutes for clear relationships.
Separate facts from recommendations. Specifications, availability, eligibility, and service boundaries should be explicit; editorial guidance should explain how to use them.
Support consequential claims with evidence on the page. If a claim cannot be substantiated, weakening or removing it is safer than making it more prominent for AI discovery.
Keep structured data consistent with the visible content. JSON-LD can clarify entities and relationships, but it should not introduce claims, ratings, questions, or offers that a visitor cannot see and verify.
Link to the next decision rather than merely to a parent category. A comparison page may need a product detail page, pricing information, an implementation explanation, or a location-specific service page.
Do not rewrite every page in response to early ad sightings. Apply this structure first to query groups closest to meaningful business outcomes. That keeps the work testable and prevents a speculative interface change from driving a site-wide content overhaul.
Make the paid destination continue the answer
An ad shown during an AI-assisted journey may meet a user who has already received definitions, options, or preliminary guidance. Sending that person to a page that starts again with a generic brand introduction creates a reset. The ad and destination should advance the task.
Align the ad message with the same decision criteria used on the organic page.
Send distinct intent groups to distinct destinations when the answer, eligibility, or next action genuinely differs.
State important restrictions before the conversion action. Hiding geography, compatibility, minimum requirements, or service limits can produce clicks that were never qualified.
Match the conversion to the user’s stage. A person comparing requirements may need detailed information before being ready for a sales conversation.
Preserve accurate conversion tracking and lead-quality feedback. More exposure in a new interface is not useful if you cannot distinguish qualified outcomes from superficial engagement.
Avoid writing ad copy that implies endorsement by Google’s generated answer. Placement inside an AI experience does not turn a sponsored claim into an independent recommendation. Clear brand identification and defensible language remain essential.
Paid and organic teams should review the journey together before launch. Check whether the organic explanation, paid promise, landing-page evidence, and conversion action describe the same offer for the same audience. If they conflict, AI Mode is not the first problem to solve; the search experience is already inconsistent.
Measure AI Mode without pretending the data is cleaner than it is
The same discipline should govern paid analysis. Use whatever placement and campaign detail Google actually reports in your account. If AI Mode is not identified as a distinct dimension, do not manufacture that distinction in a dashboard and present the result as platform data.
Maintain three evidence levels
Evidence level
What belongs in it
What it can support
Reported
Metrics and dimensions explicitly supplied by Google Ads, Search Console, analytics, and your conversion systems
Optimization within the scope those systems actually identify
Observed
Dated screenshots or reproducible appearances showing an ad in AI Mode for a particular query, device, and market
Confirmation that the surface appeared under those conditions
Inferred
Traffic shifts, query-pattern changes, or conversion movements that coincide with AI Mode activity but lack a dedicated source dimension
A hypothesis that requires further testing, not a claim of causation
Record observed appearances with the query, date, device type, market, visible ad, destination, and a screenshot. This log can help you spot recurring conditions. It cannot reveal impression share, incremental reach, auction cost, or conversions that Google has not attributed to the surface.
For reported performance, monitor the full path rather than stopping at click-through rate. Review landing-page engagement, completed conversions, lead quality, sales acceptance, and revenue signals available to your business. A new placement can generate attention while weakening commercial efficiency, so a click increase alone is not enough to justify more spending.
Run bounded tests instead of making a speculative budget shift
A large budget reallocation based on screenshots creates direct financial risk: you may pay to chase inventory that is limited, inconsistently available, or not separately controllable. Use a test structure that remains valuable even if AI Mode exposure cannot be isolated.
Choose a commercially important query group from the query-to-answer worksheet.
Write a falsifiable hypothesis, such as whether a decision-specific destination will improve qualified conversion performance compared with the current generic destination.
Define the primary outcome, the lead-quality check, the maximum acceptable spend, and the stopping condition before changing the campaign.
Change only the elements needed to test that hypothesis. Preserve a usable comparison wherever campaign volume and account structure allow it.
Annotate changes to copy, landing pages, targeting, budgets, measurement, and site content so later movements are not casually attributed to AI Mode.
Evaluate reported outcomes first. Add AI Mode observations as context, and label any connection between them as an inference unless Google provides direct attribution.
This approach also protects you if the product direction changes. Better intent mapping, clearer evidence, more relevant destinations, and stricter measurement improve conventional search campaigns and organic pages as well as emerging AI experiences.
Start with the high-value decision your existing search journey handles least clearly. Put the organic owner, paid-search owner, and conversion owner around the same query-to-answer worksheet, then fix the handoffs you can already measure. When Google supplies broader access or dedicated reporting, you will have a coherent system to test rather than a collection of guesses to unwind.
If you used the Microsoft Advertising app to check spend between meetings or intervene in a campaign away from your desk, the important change is not the missing icon. It is the loss of a familiar response path when an account needs attention.
What the retirement changes in your account workflow
Your campaigns and account are not being retired. The change removes the native mobile app as a management surface. Microsoft Advertising’s web interface remains available and becomes the place where campaign management happens.
That distinction matters because this is an operational change, not a migration of campaign data. You do not need to rebuild campaigns merely because the app disappeared. You do need to replace every procedure that assumes someone can install, open, or rely on it.
Remove app-based instructions from account playbooks, onboarding documents, bookmarks, and internal training.
Do not treat an old copy still visible on a device as a continuity plan. Complete retirement means the app should no longer be part of your response process.
Replace links to the Apple App Store or Google Play with the approved Microsoft Advertising web login path used by your organization.
Identify every person whose only convenient access was the app, including account owners, agency contacts, weekend coverage, and executive reviewers.
The hidden risk is stale documentation. A responder may know exactly what campaign change is needed but lose time because the first step in the runbook says to open an application that can no longer be installed. Search your procedures for references to the app before the next urgent change exposes them.
Make web access a tested workflow, not an assumed fallback
A browser bookmark is useful, but it does not prove that your replacement workflow works. Authentication, permissions, account selection, device policies, and a small screen can all create friction at the moment you need to act. Test the entire path under the conditions in which it will actually be used.
Inventory the mobile jobs. List what people previously did from the app: read-only performance checks, campaign status changes, budget edits, or initial investigation of an account problem.
Map each job to the web interface. Record where the relevant account, campaign, setting, and confirmation state appear. A note such as “use the website” is not enough for an on-call procedure.
Test authentication on the intended device. Use the actual phone, browser, identity, and network conditions assigned to the responder. Complete any required multifactor authentication without weakening your organization’s security controls.
Confirm account permissions. Make sure the responder can reach the correct customer and perform the actions assigned to that role. Access to a login page is not the same as access to the required account.
Run a read-only drill. Ask the responder to find a named campaign, confirm its status, select the intended date range, and locate the setting they would use during an intervention.
Validate one authorized change. During normal work, use a routine edit that already has approval. Confirm the account and campaign before saving, then verify that the intended value or status appears afterward. Do not create an unnecessary live change merely for testing.
Create the shortest safe entry path. Add an approved browser bookmark or home-screen shortcut if the managed device supports one. Label it clearly so it cannot be confused with a reporting dashboard or another advertising account.
The web interface may contain the campaign-management capabilities you need, but capability and readiness are different. The cutover is complete only when the correct person can sign in, reach the correct account, perform the permitted task, and verify the result.
Rebuild rapid-response coverage around ownership and verification
If an app notification or habitual app check was part of your monitoring routine, do not assume that retiring the app automatically creates an equivalent alert elsewhere. Inventory how each important signal reaches your team and verify the available notification settings in your account. The goal is to separate detection from intervention: one channel can tell you that something needs attention, while the web interface is where an authorized person investigates and acts.
For every scenario that may require a fast response, write down five fields:
Signal: What event starts the review, and through which approved channel does it arrive?
Owner: Who investigates first, and who is the named backup if that person is unavailable?
Authority: Which changes may that responder make without waiting for a new approval?
Verification: Which account, campaign, currency, date range, setting, and saved state must be checked before the incident is closed?
Handoff: Where is the action recorded, and who needs to know what changed?
This is especially important for budget and status changes because a wrong-account edit can affect spend. Before saving from a phone, stop long enough to confirm the customer, campaign, currency, proposed value, and direction of the change. After saving, reload or revisit the setting and confirm that the result matches the instruction.
Agencies and larger teams should also test backup access. Use individually assigned identities and appropriate account permissions rather than shared passwords. A coverage plan that depends on one person’s device or credentials has merely replaced an app dependency with a people dependency.
Set a safe boundary between phone and desktop changes
The web interface being the remaining management route does not mean every edit belongs on a phone. Decide in advance which actions are suitable for a small screen and which should wait for a desktop. The deciding factor is not convenience; it is the cost of misreading the account, scope, or value.
Situation
Recommended operating rule
Required check
Read-only status or performance check
Phone web access is reasonable after the login path has been tested.
Confirm account, campaign, and date range.
Narrow, preauthorized containment action
Use a phone only when the target and permitted action are unambiguous.
Verify the saved state and record the action.
Budget edit
Use a phone only within an agreed approval rule; otherwise move to desktop review.
Confirm currency, current value, new value, and campaign.
Multi-campaign or structural change
Move to a desktop so the full scope can be reviewed before saving.
Review every affected campaign and the intended scope.
Permission, authentication, or account-selection problem
Escalate to the account administrator instead of improvising access.
Preserve identity and access controls.
This boundary should appear in the account playbook. A useful rule is specific enough to settle a real decision: “The on-call responder may inspect any campaign from the phone, but structural and multi-campaign edits require desktop review.” Adapt the permitted actions to your approval model rather than relying on personal judgment during an incident.
Keep the access path secure as well. Use a managed device and approved browser where your organization requires them. Do not save account credentials on a shared or borrowed phone, and do not bypass multifactor authentication to make mobile access faster.
Key takeaways
The Microsoft Advertising mobile app was removed from both major app stores and reached complete retirement in January 2026; campaign management now moves through the web interface.
An installed icon or browser bookmark is not a continuity plan. Test authentication, permissions, account selection, task execution, and result verification.
Replace every app-dependent instruction in your playbooks, onboarding material, and coverage procedures.
Give each rapid-response scenario a signal, owner, backup, authorized action, verification step, and handoff location.
Use phone access for tested, low-ambiguity work. Move broad, structural, or high-consequence changes to a desktop.
Open the web interface on the device your responder will actually use and run one read-only drill before the next urgent campaign decision. Any failure you find during that drill is cheaper to fix than the same failure during a live spend problem.
Your team may have an SEO roadmap, an AI visibility dashboard, and several departments publishing different versions of the same product story. That is not mainly a tooling problem. It is an ownership problem.
AI-era SEO still depends on discoverable pages, clear answers, credible evidence, and a usable website. The job has widened, though. You now need to keep your brand understandable across search results, generative answers, third-party mentions, sales conversations, and the journey that follows discovery. Here is a practical operating model for doing that without building a separate strategy around every new acronym.
The channel changed; the job got wider
People can investigate the same decision through a search results page, an AI-generated response, a publisher, a social discussion, or a vendor website. Those routes overlap, but they do not retrieve, summarize, or present information in exactly the same way.
The behavioral shift is substantial enough to plan for. Of 2,000 consumers surveyed in June, 82% described AI-powered search as significantly more useful than traditional methods. That result reflects one survey, not a universal migration away from search engines, but it is a strong reason to examine whether your brand can be represented accurately outside a conventional results page.
Use the following as working definitions, not universal standards:
Label
Useful operating meaning
What it does not mean
SEO
The umbrella discipline for making content discoverable, understandable, relevant, and useful throughout an organic search journey.
Rankings alone, or work that ends when a visitor reaches the website.
GEO
A strategy for helping generative systems represent a brand, entity, product, or idea accurately and with support.
A guaranteed method for earning a mention or citation from an AI system.
AEO
The practice of making important questions and answers explicit, concise, and well supported.
A reason to turn every page into a shallow collection of question-and-answer blocks.
AISEO or AISO
Umbrella language for SEO roles or programs that explicitly include AI-mediated discovery.
A settled technical standard or a replacement for content, technical, authority, and user-experience work.
A simple nomenclature policy prevents weeks of internal debate. Keep SEO as the established business function, use GEO for the generative-discovery workstream, and use AEO for answer design when that distinction helps. If your organization prefers another label, document it once and move on. The operating model matters more than the name.
Treat visibility as an answer supply chain
A search or AI answer is the visible end of a longer supply chain. Customer language enters the business, teams turn it into positioning and evidence, publishers distribute it, systems interpret it, and a person decides whether to take the next step. Weakness at any handoff can make an otherwise strong page irrelevant.
Capture the decision. Start with what a person is trying to choose, verify, compare, or accomplish. Search queries are one input. Add recurring sales objections, customer-success questions, support language, account discussions, and the reasons prospects choose you or reject you.
Define the facts. Establish the approved names, descriptions, relationships, capabilities, limitations, audiences, and differentiators that every team should communicate consistently.
Attach evidence. Connect each material claim to a page, case study, demonstration, policy, customer example, or other evidence that actually supports it. If nobody can point to support, rewrite or remove the claim.
Publish and reinforce. Express the same core meaning across product pages, educational content, communications, public relations materials, customer resources, and relevant third-party profiles. Adapt the format to each audience without changing the underlying fact.
Complete the journey. After discovery, make the logical next action obvious. A correct answer that leads to an unclear page, an unexplained form, or an irrelevant call to action has not created much business value.
This model changes how you diagnose poor visibility. Do not begin with, “How do we get mentioned by an AI tool?” Begin with, “Which decision are we failing to support, and where does the answer supply chain break?” The problem might be missing evidence, contradictory descriptions, weak distribution, inaccessible content, or a landing page that does not continue the conversation.
Empathy becomes operational here. You need to understand the person’s uncertainty, the constraints of the platform presenting the answer, and the internal team responsible for the missing input. Machines do not need empathy. The people asking questions, building platforms, approving claims, and acting on answers do.
Build a canonical brand knowledge layer
Most large organizations do not lack content. They lack agreement. A product page uses one category name, sales uses another, public relations emphasizes a third, and customer success explains the offer in language that never reaches the website. Each version may be defensible in isolation while the combined brand becomes difficult to interpret.
Create a claim ledger before creating more pages
A claim ledger is a controlled record of what the organization is prepared to say and prove. Build it around one priority offer first. Give every entry the fields needed for review, reuse, and correction:
The entity, product, service, or capability being described.
The approved name and concise description.
The audience and customer problem to which the claim applies.
The exact claim, including any limitation or qualification needed to keep it accurate.
The evidence and canonical URL supporting the claim.
The business owner responsible for accuracy.
Permitted wording variants for different channels or audiences.
The review trigger, such as a product change, policy change, expired proof point, or revised positioning.
Separate facts from promotional language. “The product includes capability X” is a factual claim that product should verify. “The easiest way to solve Y” is a comparative or persuasive claim that requires a different standard of support. Mixing the two is how unsupported superlatives spread across pages and later become difficult to correct.
Turn the ledger into an enterprise ontology
An ontology is the organized map behind the ledger: what the important entities are, which names refer to them, how they relate, and which attributes belong to each one. You do not need to model the entire company at once. Start with the entities needed to explain one buyer decision without ambiguity.
Define the company, brand, offer, category, audience, problem, capability, and evidence entities involved in the decision.
Record preferred names, accepted variants, and terms that should not be treated as synonyms.
Map relationships explicitly: which company offers which product, which capability addresses which problem, and which evidence supports which claim.
Identify exclusions and limits. Knowing what an offer does not do can prevent a damaging overstatement.
Assign an owner to each business-critical entity so changes have a clear path into content and data.
Consistency does not require identical copy everywhere. A technical page, a press briefing, and a sales deck serve different readers. Their depth and tone should differ. The entity name, category, capability, limitation, and proof should not contradict one another.
Align visible content and JSON-LD
Treat JSON-LD as the machine-readable expression of the same knowledge layer, not as an independent growth hack. The visible page and its structured data should describe the same entity, relationships, and facts. Markup should never introduce an aspirational claim that the page itself does not support.
Use this order of operations: approve the fact, publish a clear human-readable explanation, encode the matching structured data, and then distribute or reinforce the fact elsewhere. Starting with markup merely gives a contradictory organization another place to contradict itself.
Check that names, descriptions, and relationships match the approved knowledge layer.
Confirm that important claims have visible evidence a reader can inspect.
Remove stale markup when the corresponding offer, fact, or page changes.
Find older pages, profiles, and downloadable assets that still use obsolete positioning.
Record corrections in the ledger so the same discrepancy does not return during the next campaign.
Structured data can reduce ambiguity, but it cannot force a search engine or generative system to use, cite, or endorse your content. Its strategic value comes from expressing a truthful and consistent model of information you have already made clear.
Make every function responsible for one part of the answer
AI-era visibility becomes fragmented when each department optimizes its own output. Product focuses on features, public relations focuses on reputation, analytics focuses on exposure, and SEO tries to reconcile the results after publication. Give each function a defined responsibility inside the answer supply chain instead.
Product marketing owns the approved positioning, audience, differentiators, and visual explanation of the offer.
Product confirms feature names, current behavior, limitations, and changes that make existing content inaccurate.
Communications and public relations carry consistent facts into announcements, briefings, profiles, and outreach while respecting the editorial independence of third parties.
Customer success contributes recurring questions, implementation language, adoption barriers, and evidence that reflects real customer needs.
Sales and account executives contribute decision-makers, objections, comparison criteria, buying language, and reasons a prospect chooses or rejects the offer.
Analytics connects discovery activity with useful actions and distinguishes exposure from qualified progression.
Compliance reviews claims whose wording creates regulatory, contractual, or reputational exposure and states the boundaries teams must preserve.
Do not ask every department to “do GEO.” That request is too abstract to own. Bring each team a named discrepancy: an outdated product description, a missing proof point, an objection nobody answers, a case study disconnected from the relevant offer, or a discovery path that ends on the wrong page.
Run a narrow pilot around one decision
A useful pilot is organized around a customer decision, not an AI platform. Choose one important offer, one audience, and one decision where inaccurate or incomplete representation has a plausible business consequence.
Write the questions a person asks while discovering, comparing, validating, and acting on that decision.
Capture the current environment: search results, relevant AI answers, owned pages, third-party profiles, sales materials, and the destination pages offered to the user.
Classify each problem as absent, inaccurate, unsupported, inconsistent, inaccessible, or a journey dead end. This makes the remediation assignable.
Trace every problem back to its owner. Product corrects a capability. Customer success supplies an implementation answer. Communications resolves a stale profile. Content publishes missing evidence. Web teams repair the next step.
Update the canonical facts before updating individual channels. Otherwise, each team may solve the same discrepancy differently.
Revise the relevant pages, structured data, supporting assets, and approved external materials.
Repeat the documented questions, inspect the resulting pages, and test the user’s path to the intended action. Record what changed and what remains unresolved.
Do not confuse consistency with syndicating identical copy. Preserve the same factual meaning while allowing each channel to serve its audience. You can govern your claims and approved assets; you cannot require an independent publisher to use your preferred wording or reach your preferred conclusion.
Decision-question coverage: the share of monitored priority questions for which the brand is represented in a relevant and accurate context.
Claim accuracy: the share of sampled statements about the brand that are correct and supportable under your agreed review rubric.
Evidence coverage: the share of material claims connected to current, accessible proof.
Cross-surface consistency: the share of checked priority surfaces that agree on core names, categories, capabilities, and limitations.
Correction cycle time: the elapsed time between identifying a material discrepancy and correcting the surfaces under your control.
Journey completion: the share of tested discovery paths on which a person can find the promised information and complete the intended next action without an avoidable block.
Business contribution: qualified inquiries, assisted opportunities, retained accounts, or other business outcomes in which a monitored discovery path played a documented role.
Define the rubric before scoring results. Decide what counts as a relevant appearance, a material error, acceptable supporting evidence, and a completed journey. Establish your own baseline rather than borrowing a universal benchmark that ignores your category, buying cycle, risk, and current visibility.
Sample AI answers as observations, not fixed rankings
Log enough context to make each observation interpretable: the exact question, platform, model or mode when displayed, language, location, observation date, logged-in state, response, cited URLs, and evaluator. Repeat the same controlled question set over time and retain the outputs.
A single response is evidence of what happened in one run, not a stable market-share percentage. Look for repeated patterns: the same factual error, the same missing proof, the same competitor framing, or the same destination-page problem. Those patterns tell you where to intervene even when individual wording changes.
Connect visibility to the nearest defensible outcome. If revenue attribution is not available, use qualified progression, completed tasks, evidence coverage, resolved objections, or correction speed. Label proxies as proxies. Do not convert an appearance count into an invented revenue claim.
Key takeaways
Keep SEO as the operating foundation; use GEO and AEO to describe distinct work when the labels improve ownership.
Organize the program around customer decisions and answer supply chains, not around whichever AI platform is receiving attention.
Build a controlled knowledge layer linking approved claims, entities, evidence, owners, pages, and structured data.
Require consistency of meaning across teams and channels, not word-for-word duplication.
Start with one offer, one audience, and one decision so every discrepancy has an accountable owner.
Measure accuracy, evidence, journey completion, correction speed, and business contribution alongside traffic and visibility.
Your next move is small but consequential. Select one high-value question a buyer asks before choosing your offer. Trace the answer from customer language to approved claim, supporting evidence, search or AI representation, destination page, and next action. Mark every contradiction and dead end, then bring the responsible teams together to resolve those specific failures.
That completed loop is more valuable than another visibility dashboard. It gives you the repeatable unit from which an AI-era SEO operating model can grow.